Run this strategy
Copy the prompt to reproduce the evidence above with the article’s data, assumptions, and risk checks.
Tell your AI:
Help me set up FinLab and reproduce this article. Please read: https://finlab.finance/en/setup?relatedUrl=/en/blog/us-momentum-strategy
Momentum is the most replicated anomaly in equity markets, but most articles either stop at the academic claim or show a single equity curve with no proof the underlying stock selection works. This one does both: it first checks whether 12-1 momentum actually sorts US stocks across the entire liquid universe, then turns that signal into a tradable strategy and backtests it with real, downloadable finlab code.
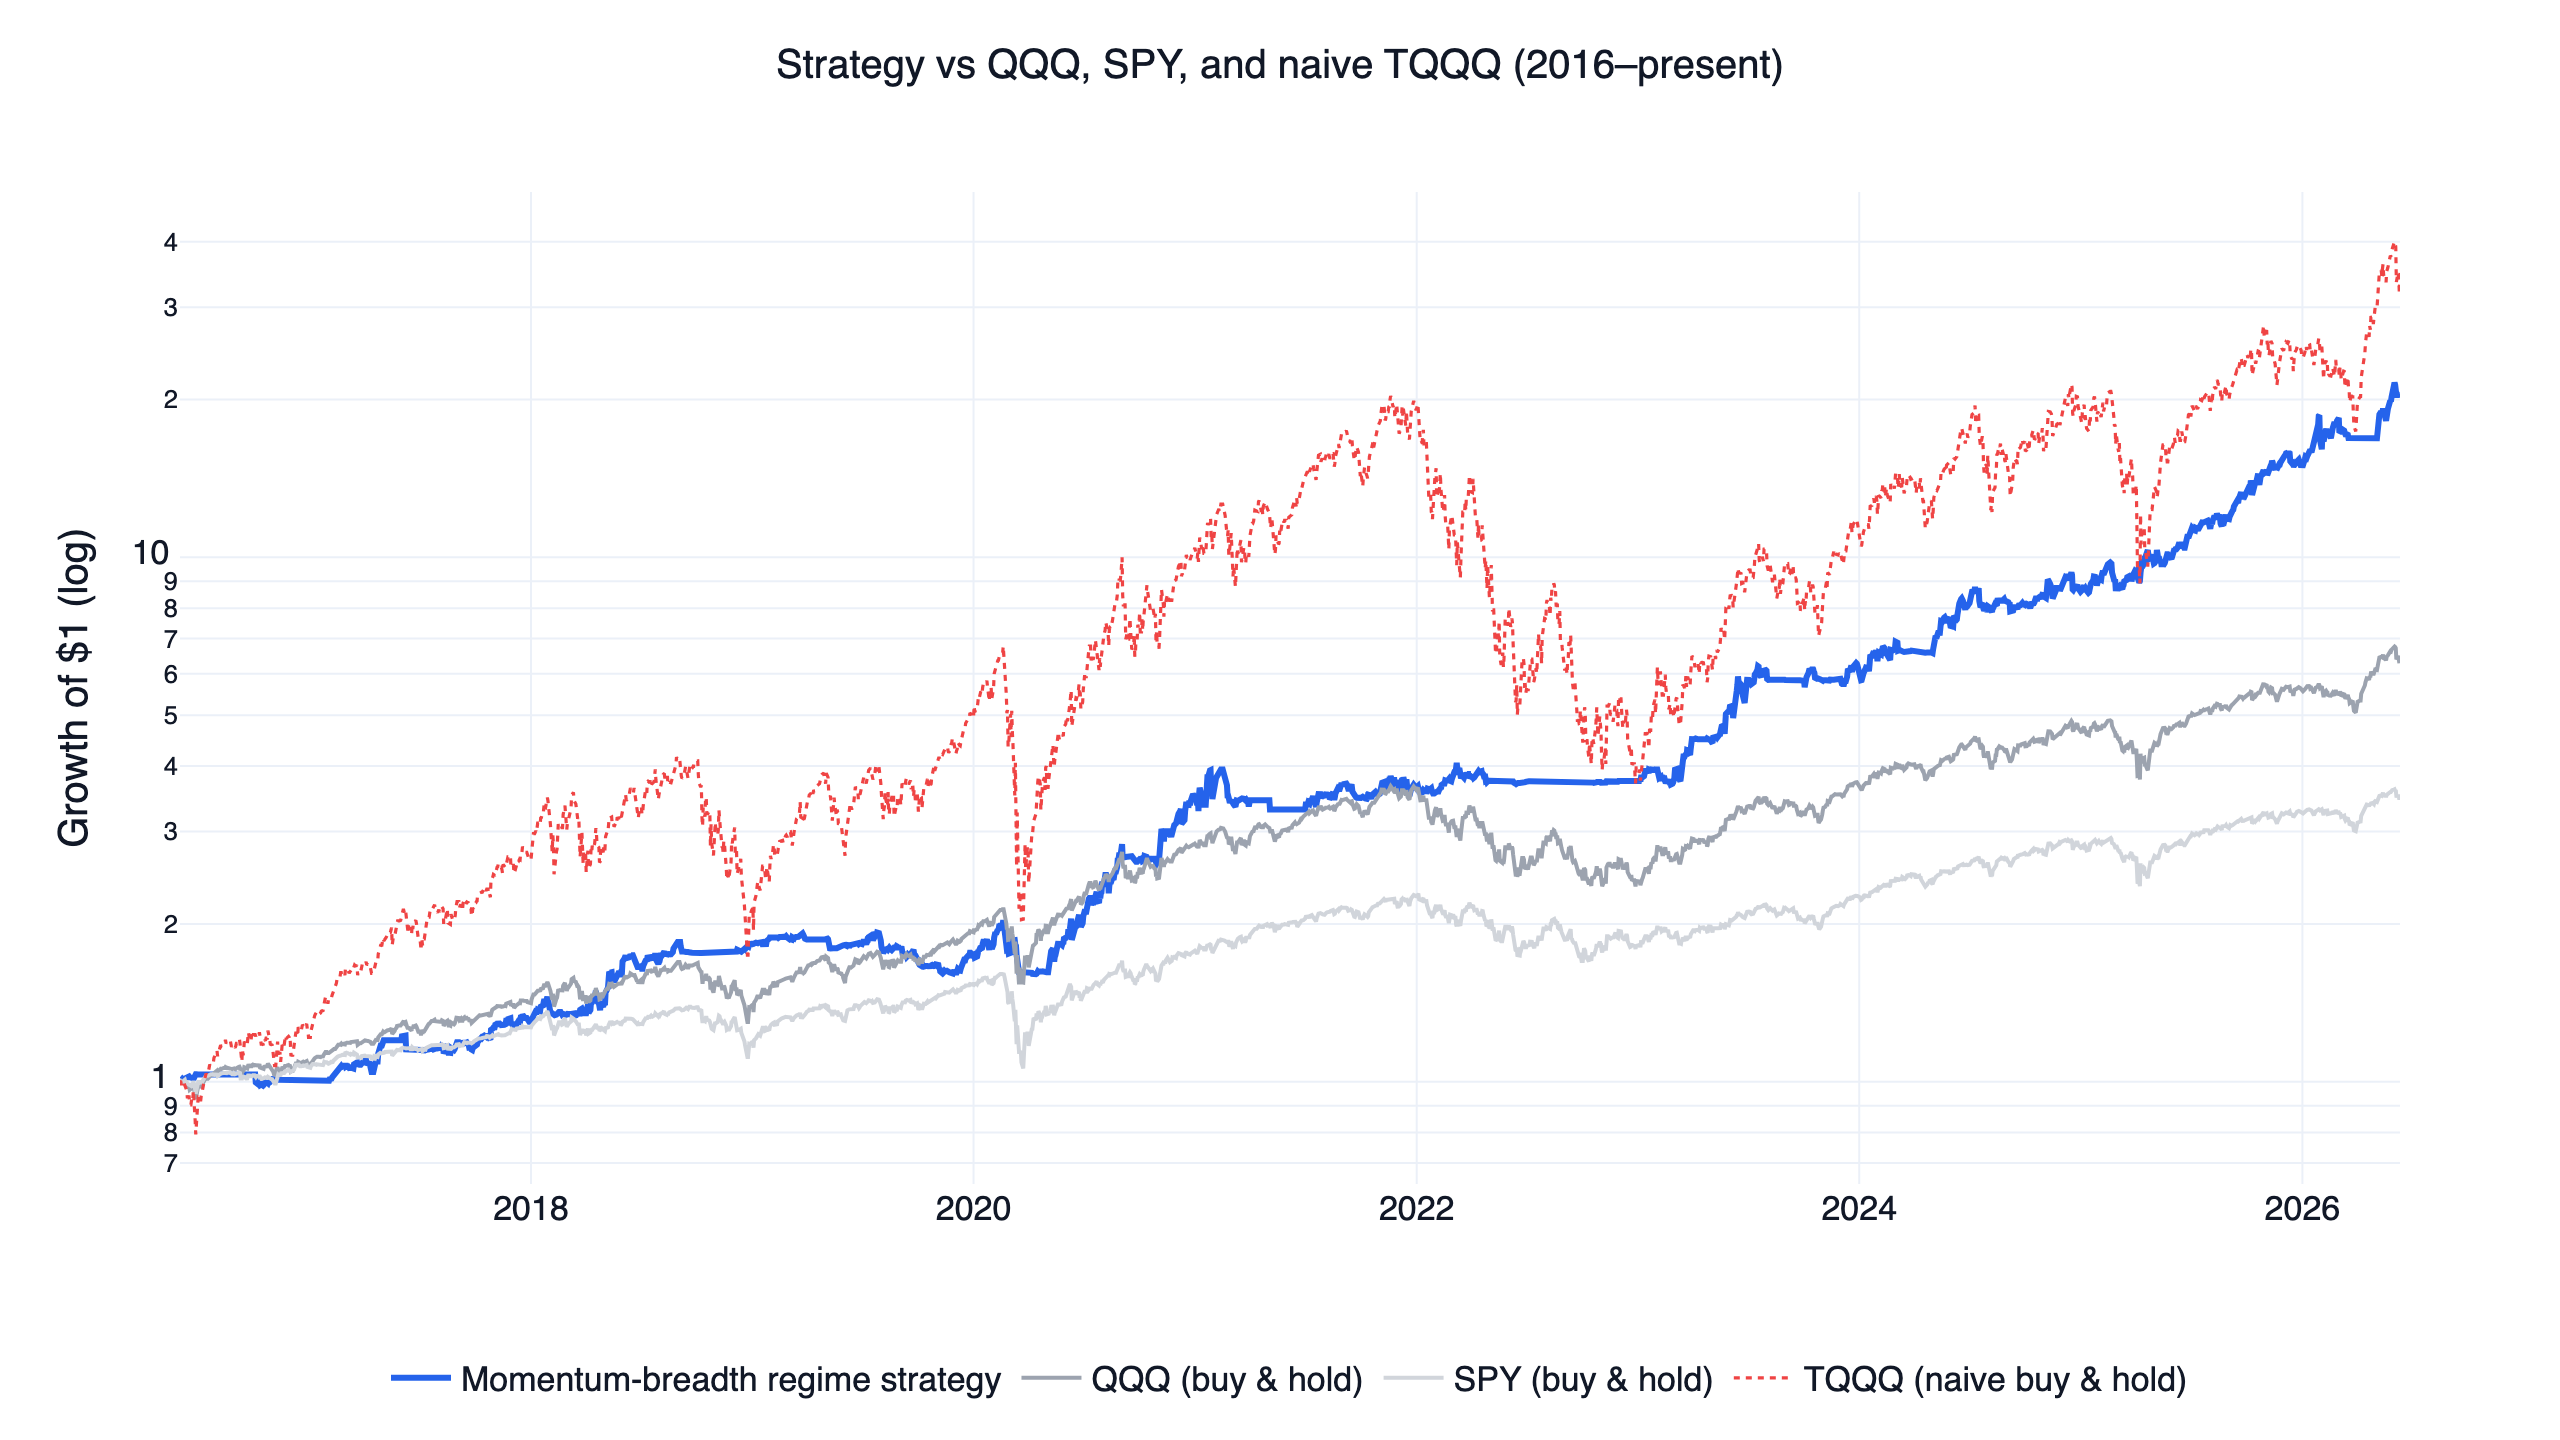
The result, over June 2016 to June 2026: a 35.1% CAGR at a 1.46 monthly Sharpe and a -21.1% maximum drawdown, against 19.7% / 1.09 / -35.6% for buying and holding the Nasdaq-100 (QQQ). One important caveat up front, because it changes how you should read every number below: the tradable version does not hold the screened stocks. It holds one or two leveraged growth ETFs, and only when the broad market trend and momentum participation say the regime supports them. The stock universe is the signal; the leveraged ETFs are the execution. That design has specific risks, covered in full further down. This momentum system is one of ten US strategies built on that same execution model — see how it compares in the US quant trading strategies overview.
The numbers at a glance
| Metric | This strategy | QQQ (buy & hold) | SPY (buy & hold) | TQQQ (naive buy & hold) |
|---|---|---|---|---|
| CAGR | 35.1% | 19.7% | 13.3% | 40.2% |
| Monthly Sharpe | 1.46 | 1.09 | 0.92 | 0.90 |
| Monthly Sortino | 4.54 | 1.75 | 1.27 | 1.53 |
| Max drawdown | -21.1% | -35.6% | -34.1% | -81.8% |
| Annualized volatility | 20.1% | 22.3% | 17.9% | 65.9% |
The TQQQ column is the point of the whole exercise. A 3x Nasdaq-100 ETF held blindly earned a slightly higher CAGR than the strategy, but at an -81.8% drawdown and 66% annualized volatility, almost no one holds that through a cycle. Timing the same leverage with a momentum-breadth signal keeps most of the upside while cutting the worst loss to -21%. Numbers are from a finlab backtest; the QQQ and SPY benchmarks use total-return (dividend-adjusted) prices.
What "cross-sectional momentum" means here
Cross-sectional momentum ranks stocks against each other and bets that recent relative winners keep outperforming recent relative losers over the next few weeks to months. The standard academic measure, used here, is 12-1 momentum: the trailing 12-month return excluding the most recent month (the last month is skipped because very short-term returns tend to reverse). Past-winner portfolios beating past losers was documented by Jegadeesh & Titman (1993) and built into a standard factor by Carhart (1997).
This is different from trend-following or "new high" breakouts, which look at one asset's own price path. Cross-sectional momentum is a relative ranking across many names at once, which is exactly why it needs the full universe to be measured properly.
Copy this prompt to your AI agent
FinLab's setup path is now one prompt. Paste it into Codex app or Claude cowork, and the AI will read https://finlab.finance/en/setup, install the FinLab skill when needed, then run or modify the strategy in this article.
Show Code
Help me set up FinLab and build my first Taiwan momentum strategy: https://finlab.finance/en/setupThe setup page is https://finlab.finance/en/setup.
Factor analysis: does the selection logic actually work?
Before trusting any strategy, the underlying factor should sort returns across the whole universe, not just in a hand-picked basket. The universe here is the top 500 US stocks by 60-day average dollar volume, with a 10M minimum dollar-volume floor, and a rolling filter that removes a name for a year after any single-day move of 50% or more (a cheap guard against split and data artifacts). Everything is point-in-time: each month uses only data that was available that day.
Sorting that universe into deciles by 12-1 momentum and measuring the next month's average return gives the cleanest test of the idea.
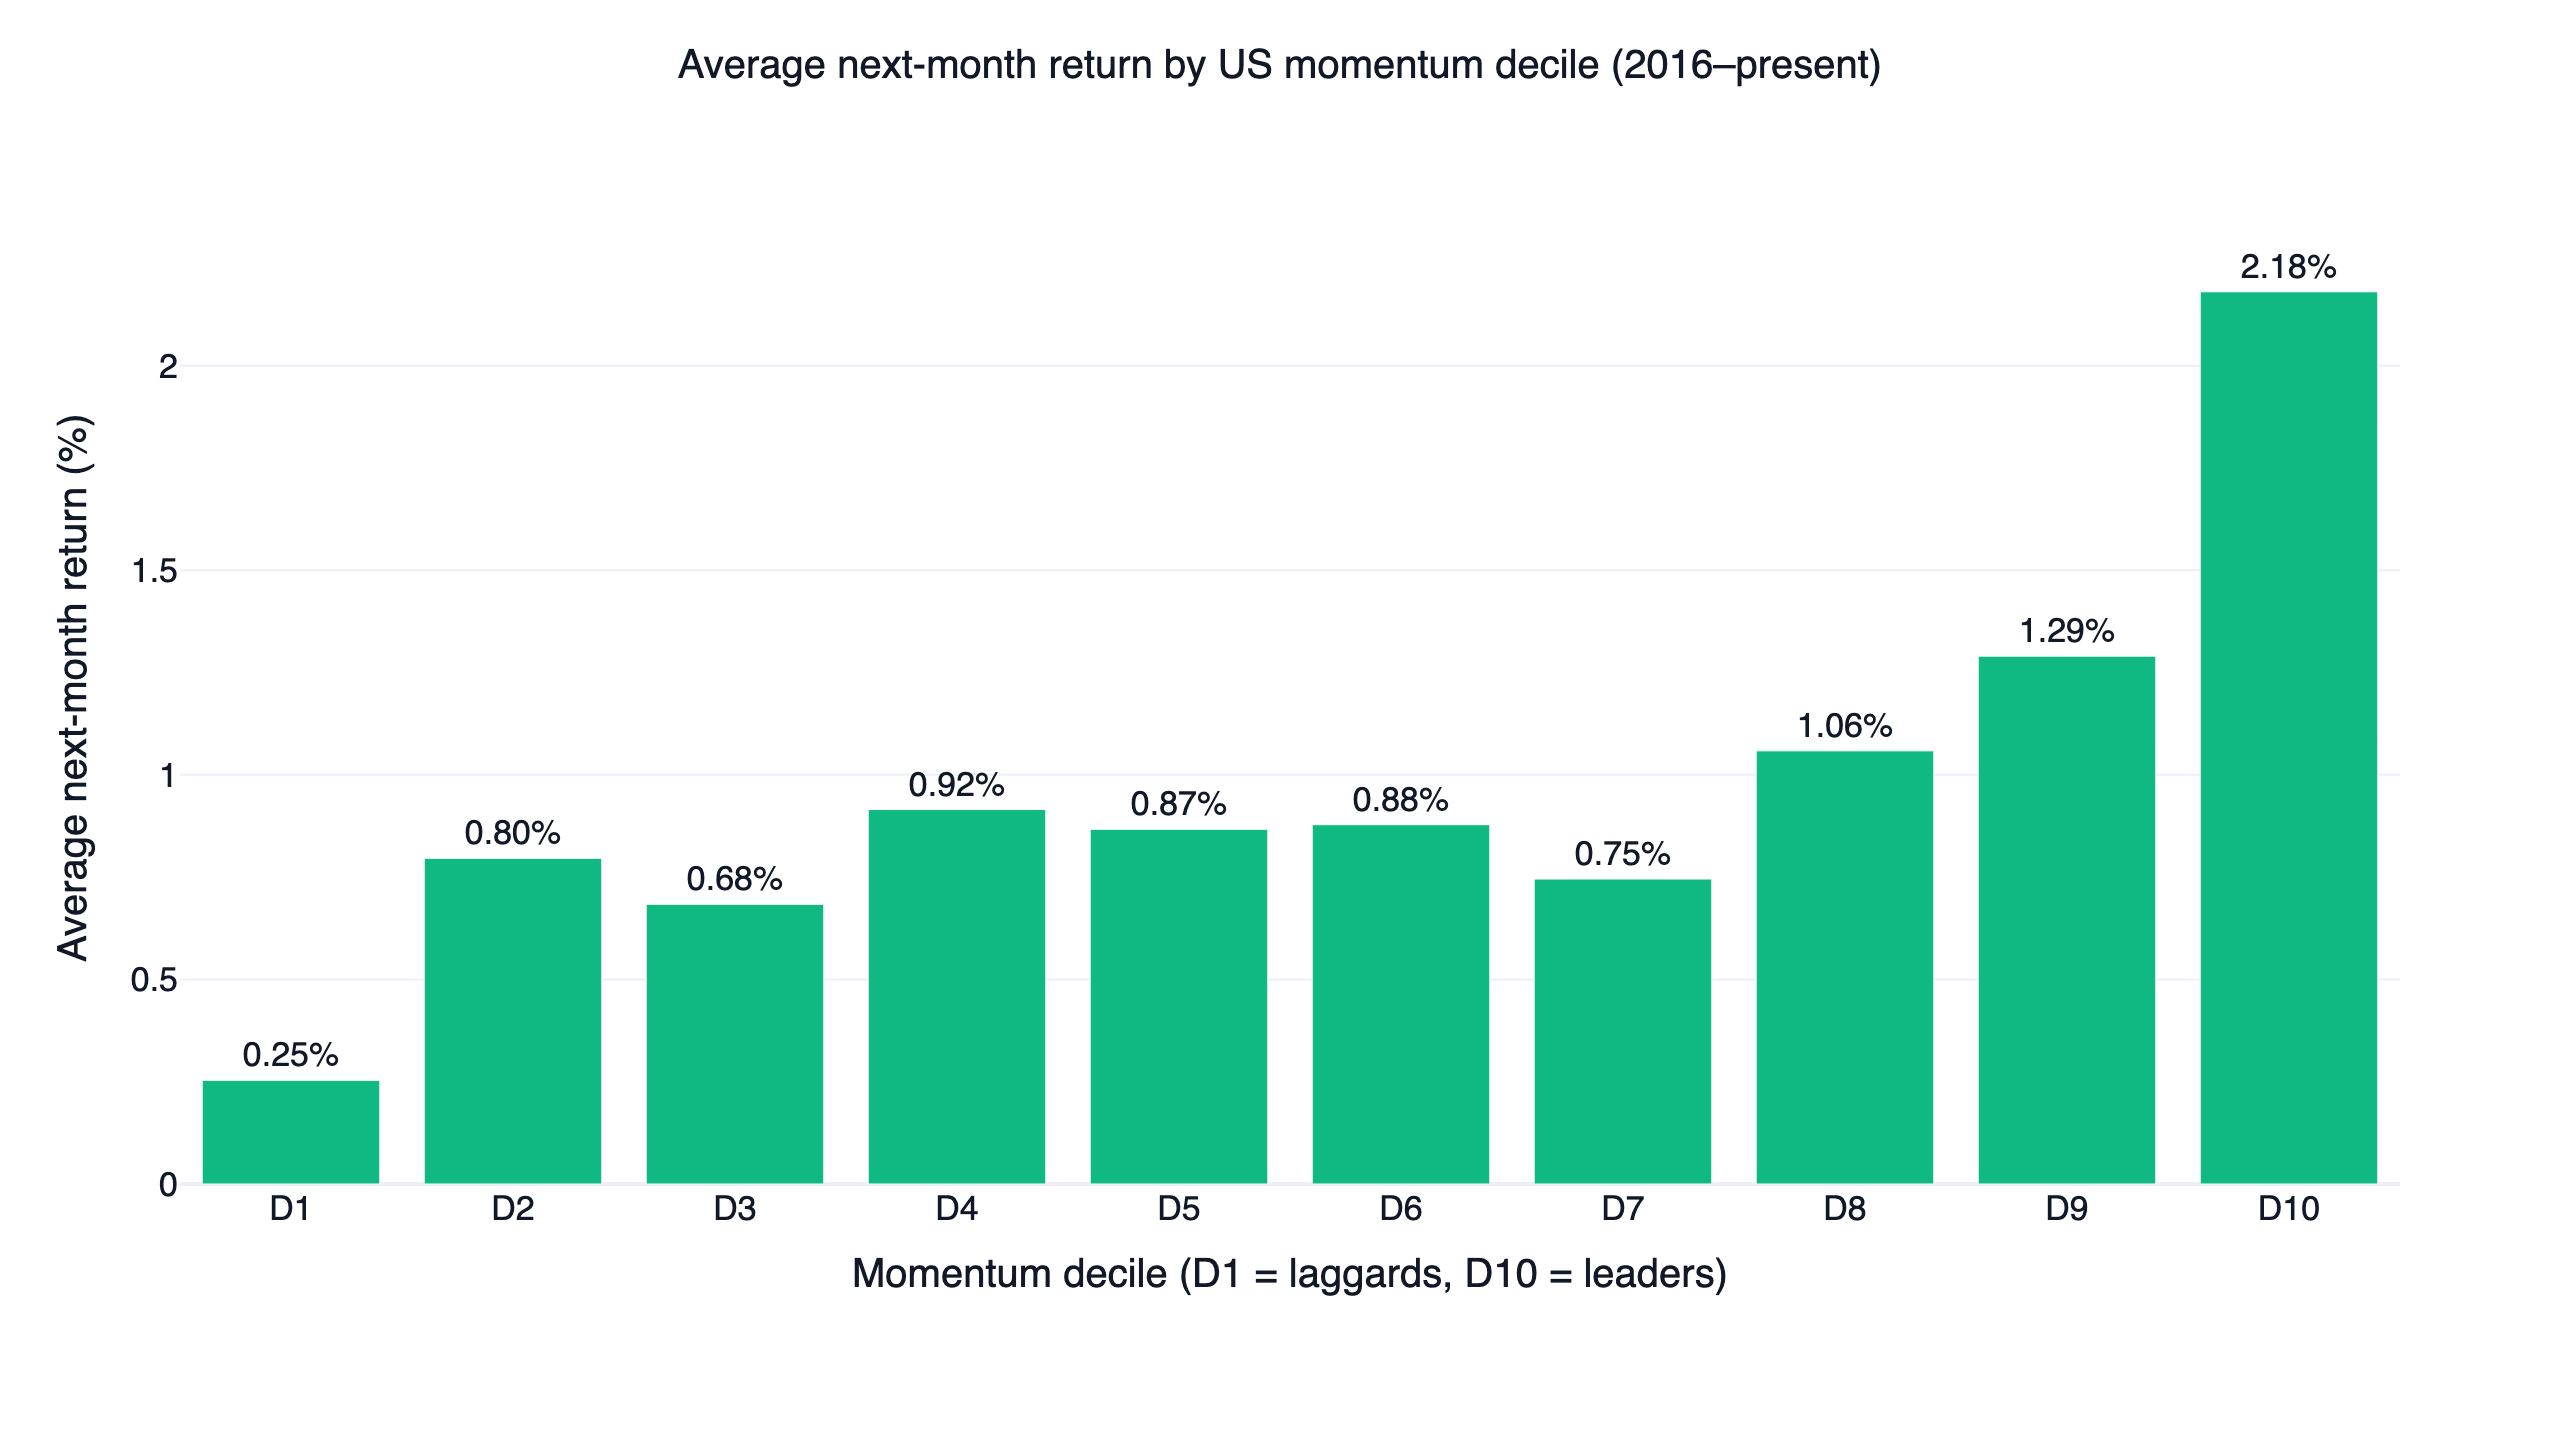
| Momentum decile | Avg. next-month return |
|---|---|
| D1 (laggards) | 0.25% |
| D5 | 0.87% |
| D8 | 1.06% |
| D9 | 1.29% |
| D10 (leaders) | 2.18% |
The return rises across deciles and the top decile separates clearly: D10 returns about nine times the laggard decile, and a long-short spread (top decile minus bottom decile) averages 1.93% per month, roughly 23% annualized. The pattern is not perfectly monotonic in the middle deciles, which is normal for momentum; the economically meaningful action is concentrated in the extreme deciles.
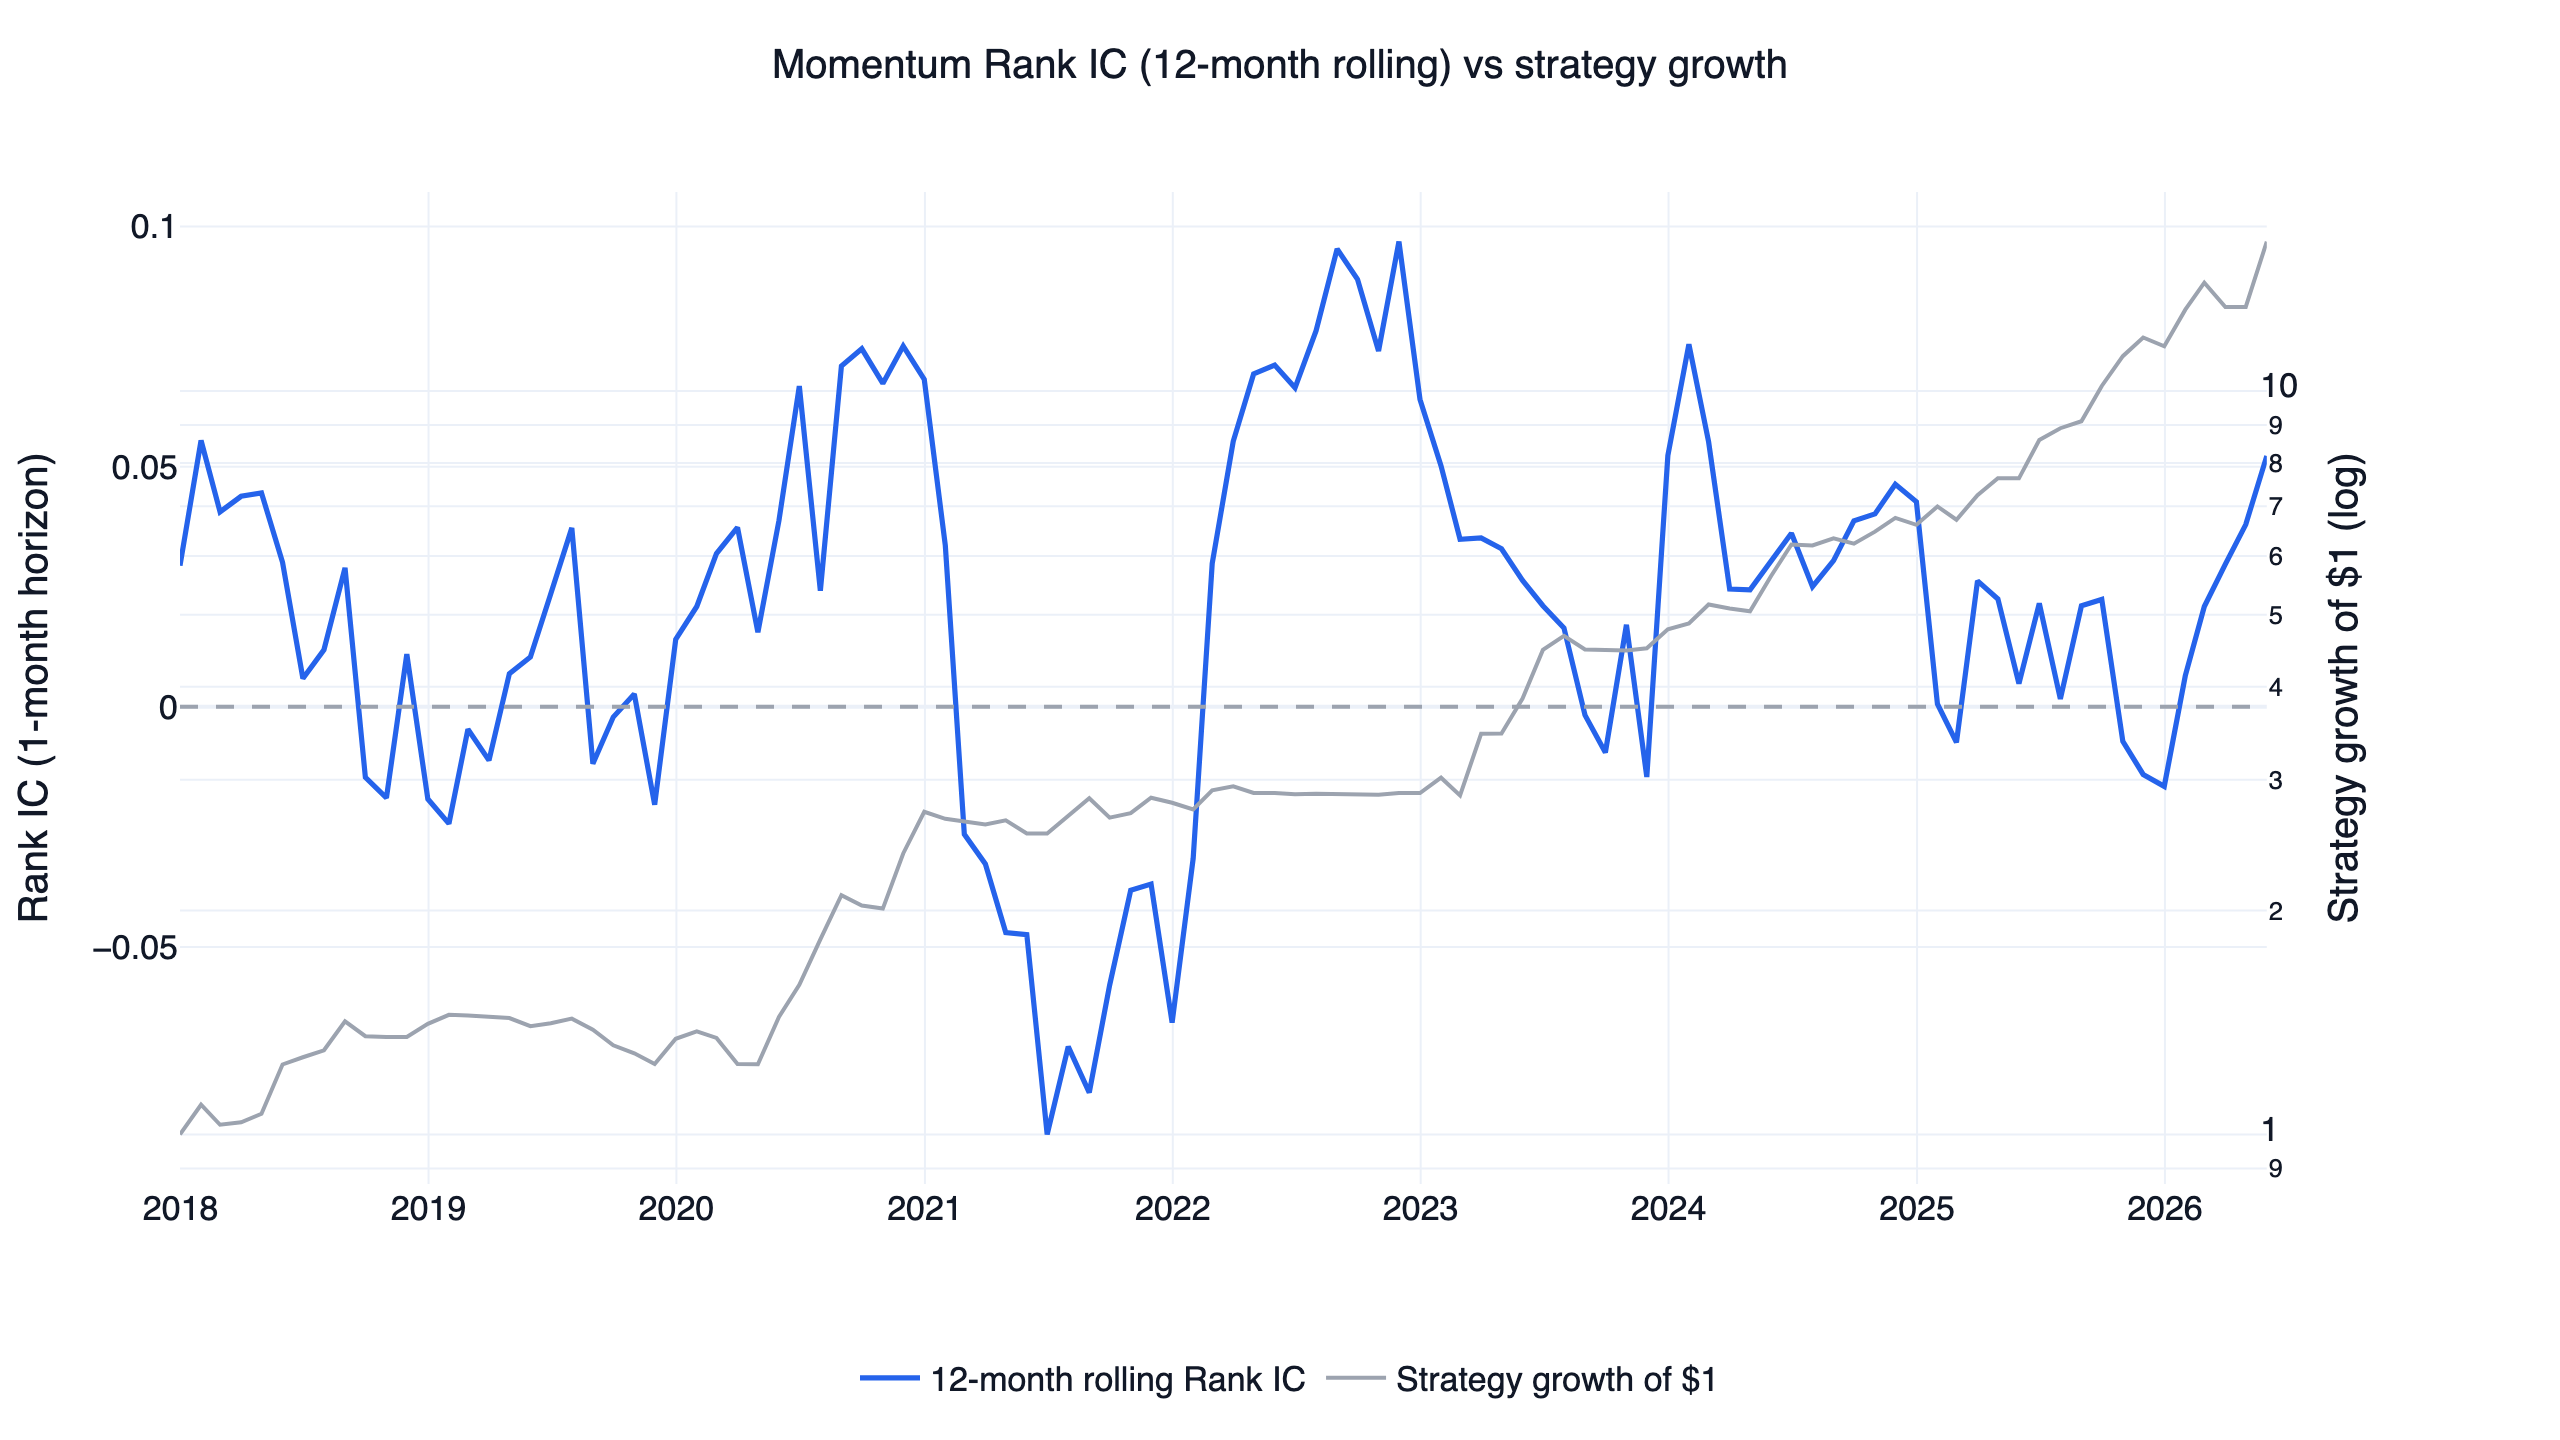
A second, stricter test is the Information Coefficient (IC) — the rank correlation between this month's factor value and next period's return. A positive, stable IC means the factor carries genuine predictive information.
| Horizon | Mean Rank IC |
|---|---|
| 1 month | 0.023 |
| 3 months | 0.034 |
| 6 months | 0.034 |
| 12 months | 0.027 |
These ICs are modest, and that is the truthful picture of momentum: it is a low-IC, fat-tailed factor whose payoff comes from the right tail (the top decile) rather than a smooth relationship across all stocks. The IC also turns sharply negative during momentum reversals, the well-documented "momentum crash" risk analyzed by Daniel & Moskowitz (2016). The decile spread and the IC together say the same thing: the selection logic is real but noisy, which is precisely why the tradable version adds a regime filter instead of holding the raw stock basket.
To make the stock-level edge concrete, here is an unlevered, no-timing portfolio that simply holds the top momentum decile (equal weight, rebalanced monthly) versus the equal-weight universe and QQQ:
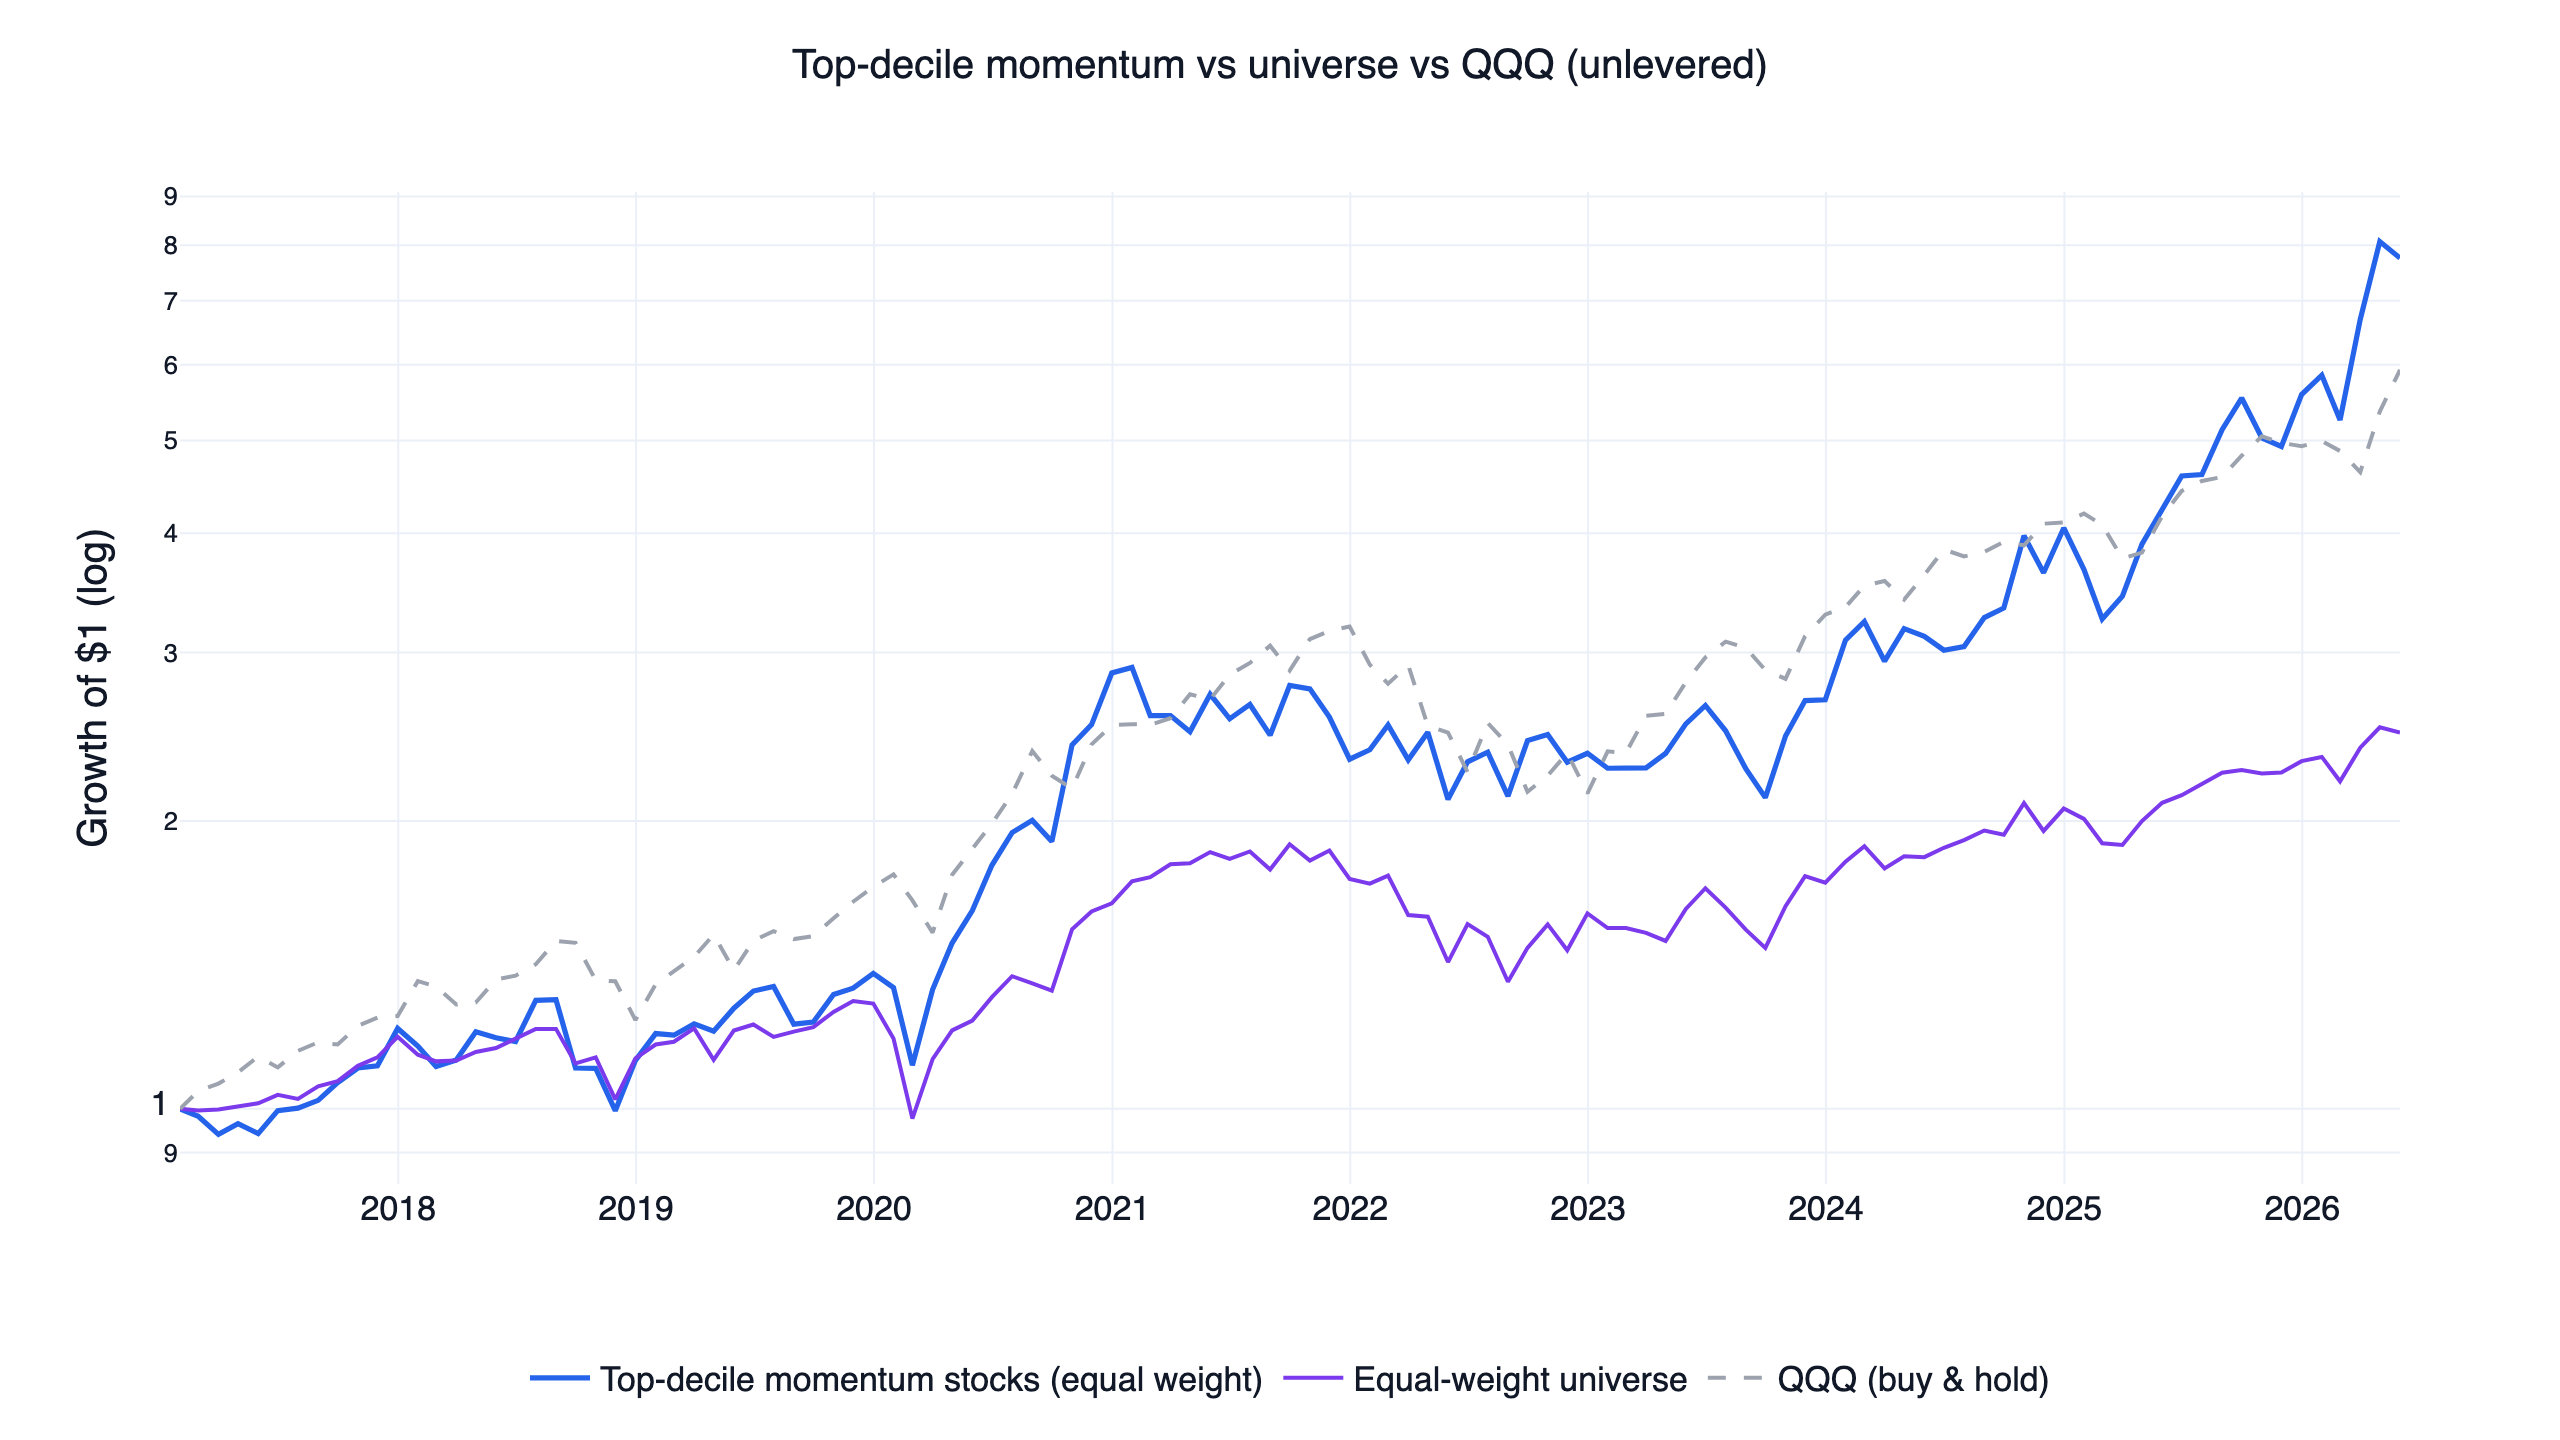
The top-decile names compound above both the broad universe and QQQ with no leverage and no market timing. That is the alpha the strategy is built on. The factor work and the cross-sector academic evidence in Asness, Moskowitz & Pedersen (2013) are why momentum is worth expressing aggressively when conditions allow.
From factor to signal: momentum breadth as a regime gate
Holding the top-decile stocks directly works, but an unlevered basket leaves return capacity on the table and still rides the full market drawdown. The strategy instead gates leveraged exposure with two conditions: the QQQ trend, which does most of the regime switching, and the breadth of momentum — the share of the universe that are positive-trend, top-decile leaders — which confirms that participation is broad rather than narrow.
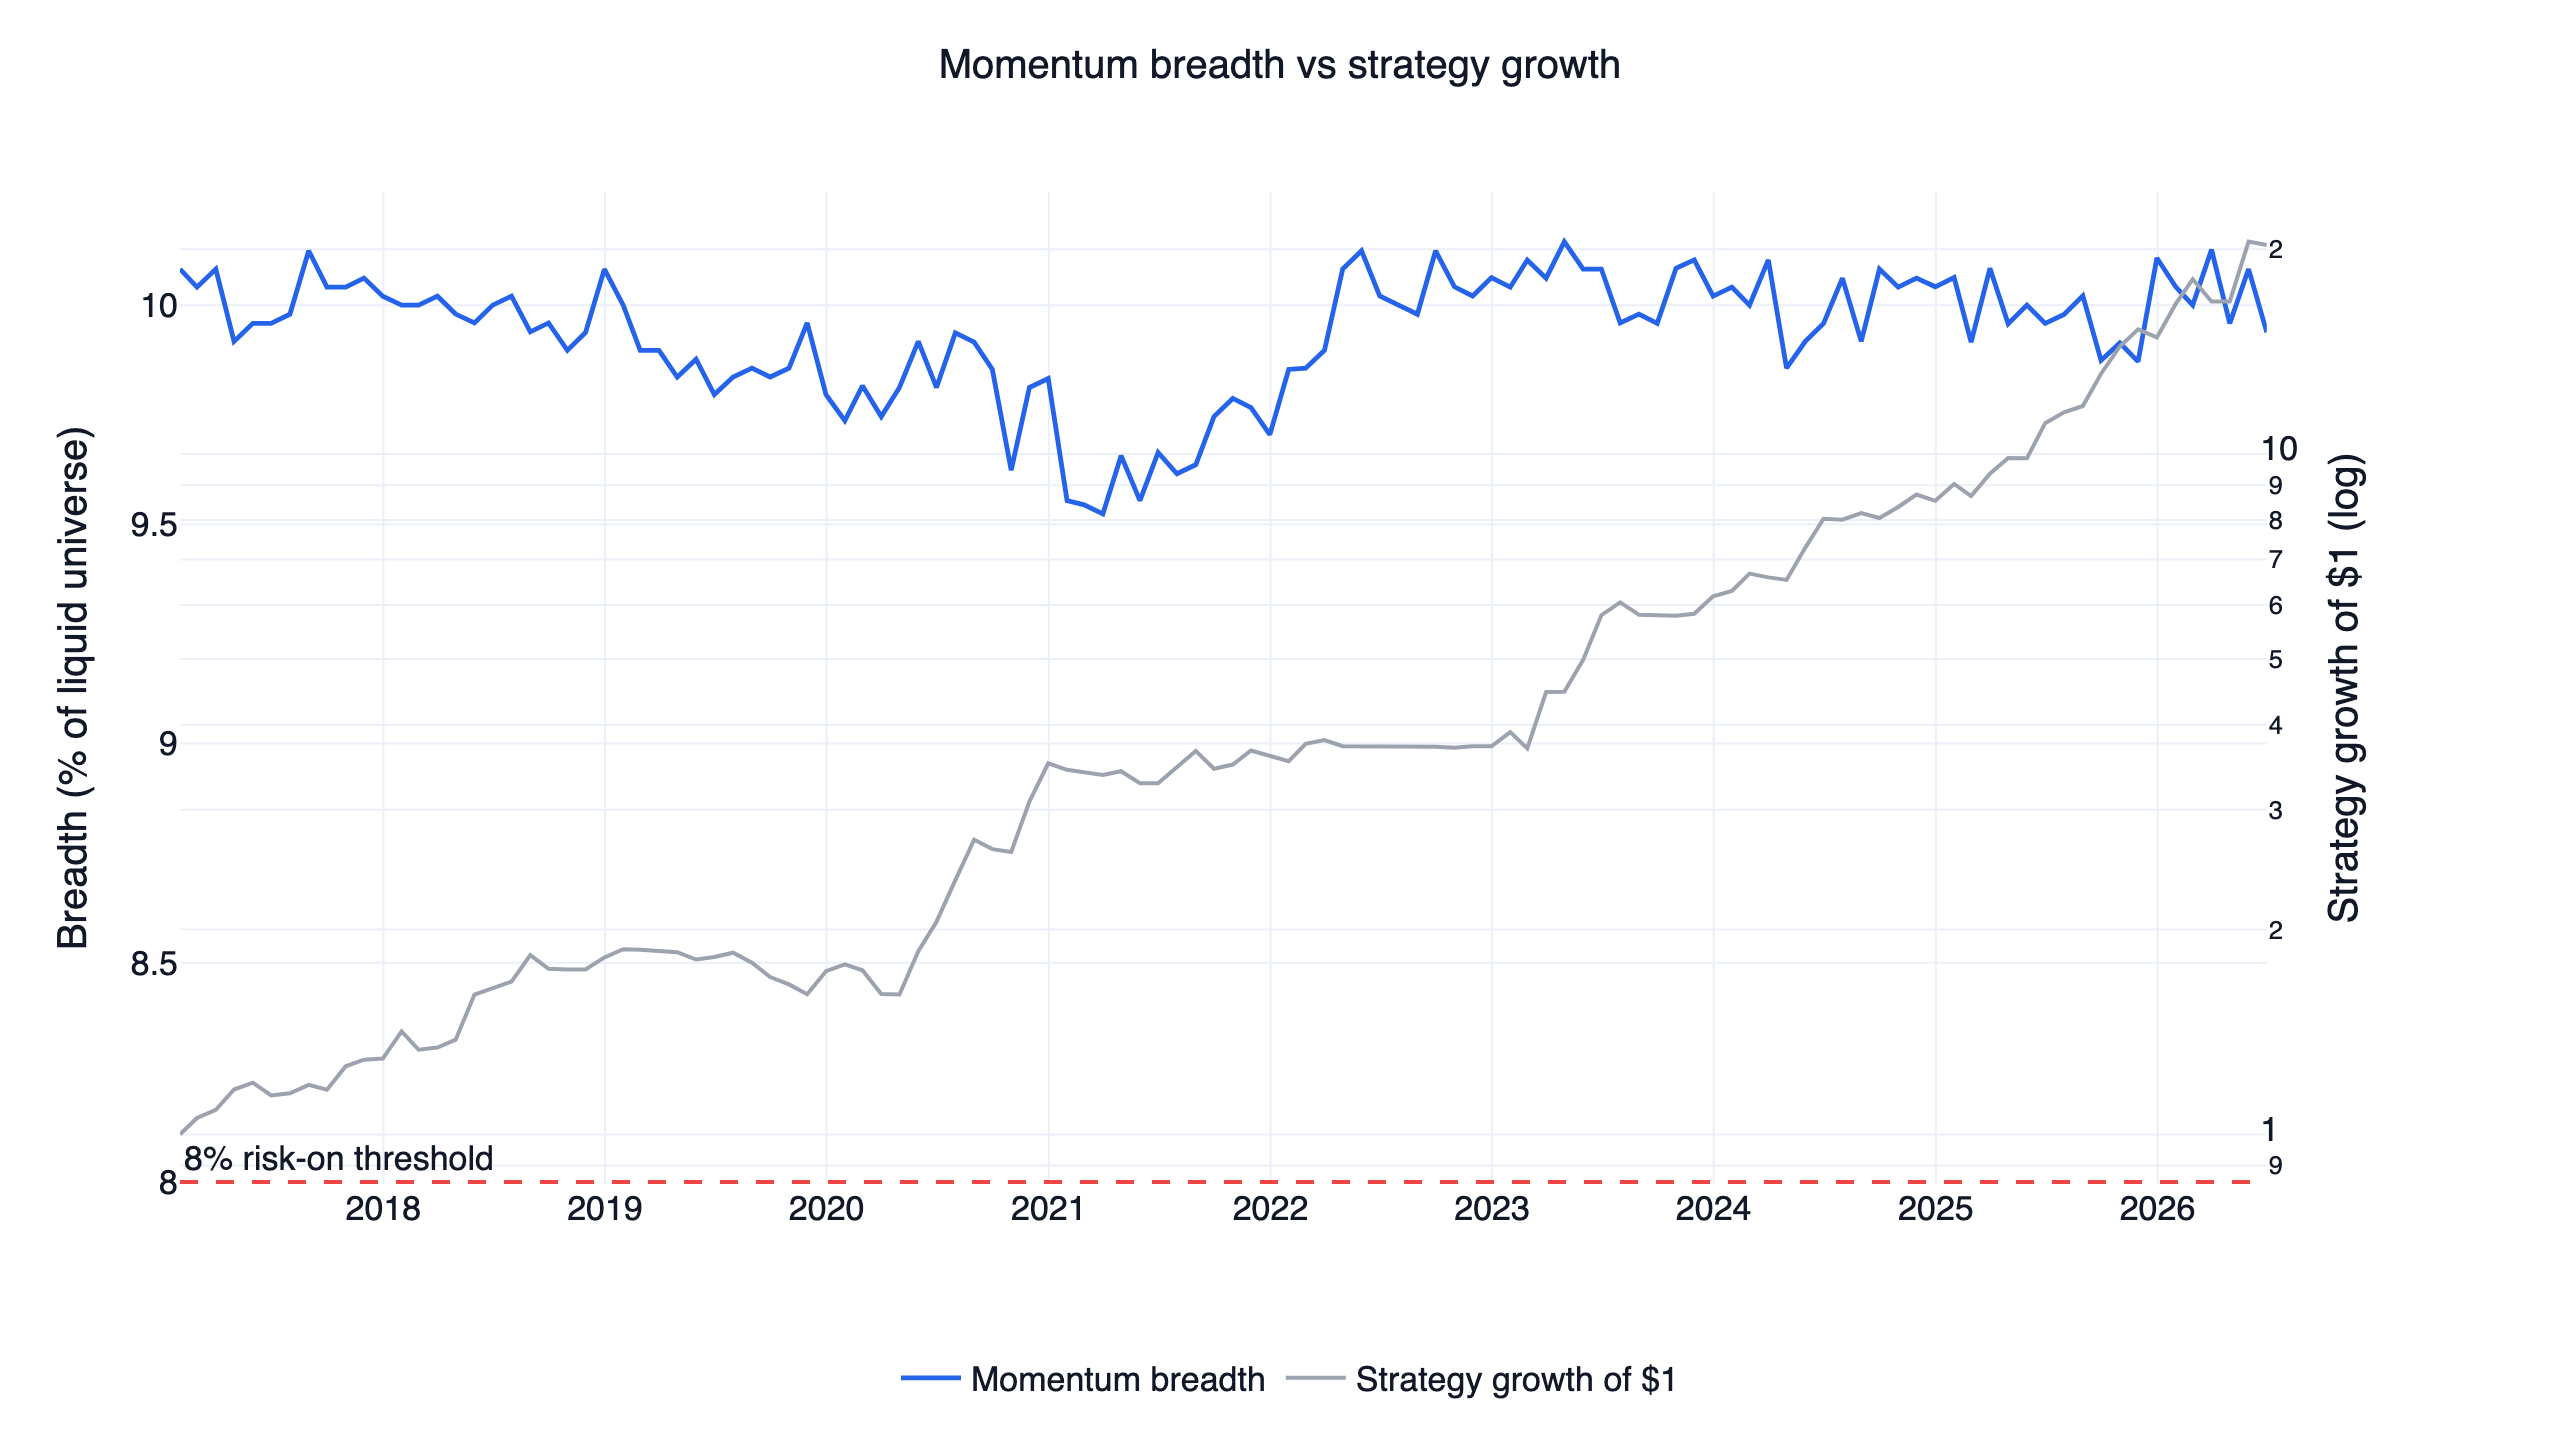
When breadth is high, broad participation signals persistent institutional risk appetite, and growth-beta leadership tends to continue. The risk-on regime requires three conditions at once: momentum breadth above 8%, QQQ trading above its 200-day average, and a positive QQQ 126-day trend. In this universe, breadth sits near its structural ceiling of about 10% for most of the sample, so it mainly rules out the weakest, narrowest markets; the QQQ trend and momentum conditions are what flip the regime in practice. When all three hold, the strategy buys the two strongest leveraged growth ETFs (TQQQ and TECL); otherwise it rotates to a single defensive ETF (treasuries, gold, or cash-like). Rebalancing is monthly, with an 8% touched stop on the ETF leg.
The data behind it
Everything runs on FinLab's US datasets. The single-stock screen and the ETF execution use different markets:
Show Code
from finlab import data

# Single-stock universe (the momentum screen / breadth signal)
data.set_market("us")
close = data.get("us_price:adj_close")   # dividend/split-adjusted prices
volume = data.get("us_price:volume")

# Leveraged + defensive ETFs (the tradable position)
data.set_market("us_fund")
etf_close = data.get("us_fund_price:adj_close")[["QQQ", "TQQQ", "TECL", "IEF", "GLD", "SHY"]]
us_price:adj_close is total-return adjusted, so the momentum factor is not distorted by dividends or splits. The benchmark used throughout is QQQ total return over the same window, with SPY as a broad-market reference. The leveraged ETF series already embed each fund's daily-reset behavior and expense ratio, so the volatility drag of 3x products is reflected in the results — it is not assumed away.
The strategy, in readable steps
The core logic is short. This is the on-page version; the full downloadable script is linked at the end.
Show Code
from finlab import data
from finlab.backtest import sim
from finlab.dataframe import FinlabDataFrame

data.set_market("us")
close = data.get("us_price:adj_close")
volume = data.get("us_price:volume")
fund_close = data.get("us_fund_price:adj_close")[["QQQ", "TQQQ", "TECL", "IEF", "GLD", "SHY"]]

# 1. 12-1 momentum on a liquid, point-in-time universe
universe = liquid_universe(close, volume, top_n=500)
ret_12m = close / close.shift(252) - 1
ret_1m = close / close.shift(21) - 1
momentum = ret_12m - ret_1m

# 2. Breadth: share of the universe that are positive-trend momentum leaders
leaders = (momentum[universe].rank(axis=1, pct=True) > 0.90) & (ret_12m > 0)
breadth = leaders.sum(axis=1) / universe.sum(axis=1)

# 3. Risk-on when breadth AND the QQQ trend agree
qqq_trend = fund_close["QQQ"] > fund_close["QQQ"].rolling(200, min_periods=100).mean()
qqq_mom = fund_close["QQQ"] / fund_close["QQQ"].shift(126) - 1
risk_on = (breadth > 0.08) & (qqq_trend & (qqq_mom > 0)).reindex(breadth.index)

# 4. Hold the 2 strongest leveraged ETFs in risk-on, else 1 defensive ETF
#    (full selection + weighting in the downloadable strategy.py)
The liquid_universe helper applies the dollar-volume, price, and artifact filters described above. The full position construction and the sim() call (monthly rebalance, 8% stop) are in the downloadable file.
Results and out-of-sample test
The strategy curve versus benchmarks is the chart at the top of this article. Here is the interactive finlab report — drawdowns, monthly returns, and trade list — so you can inspect it directly rather than trust a summary:
The single most important robustness question for any backtest is whether it only worked in the period it was designed on. The strategy parameters were chosen on 2016-2021 data and then left untouched on 2022-present, an unseen period that includes the 2022 bear market.
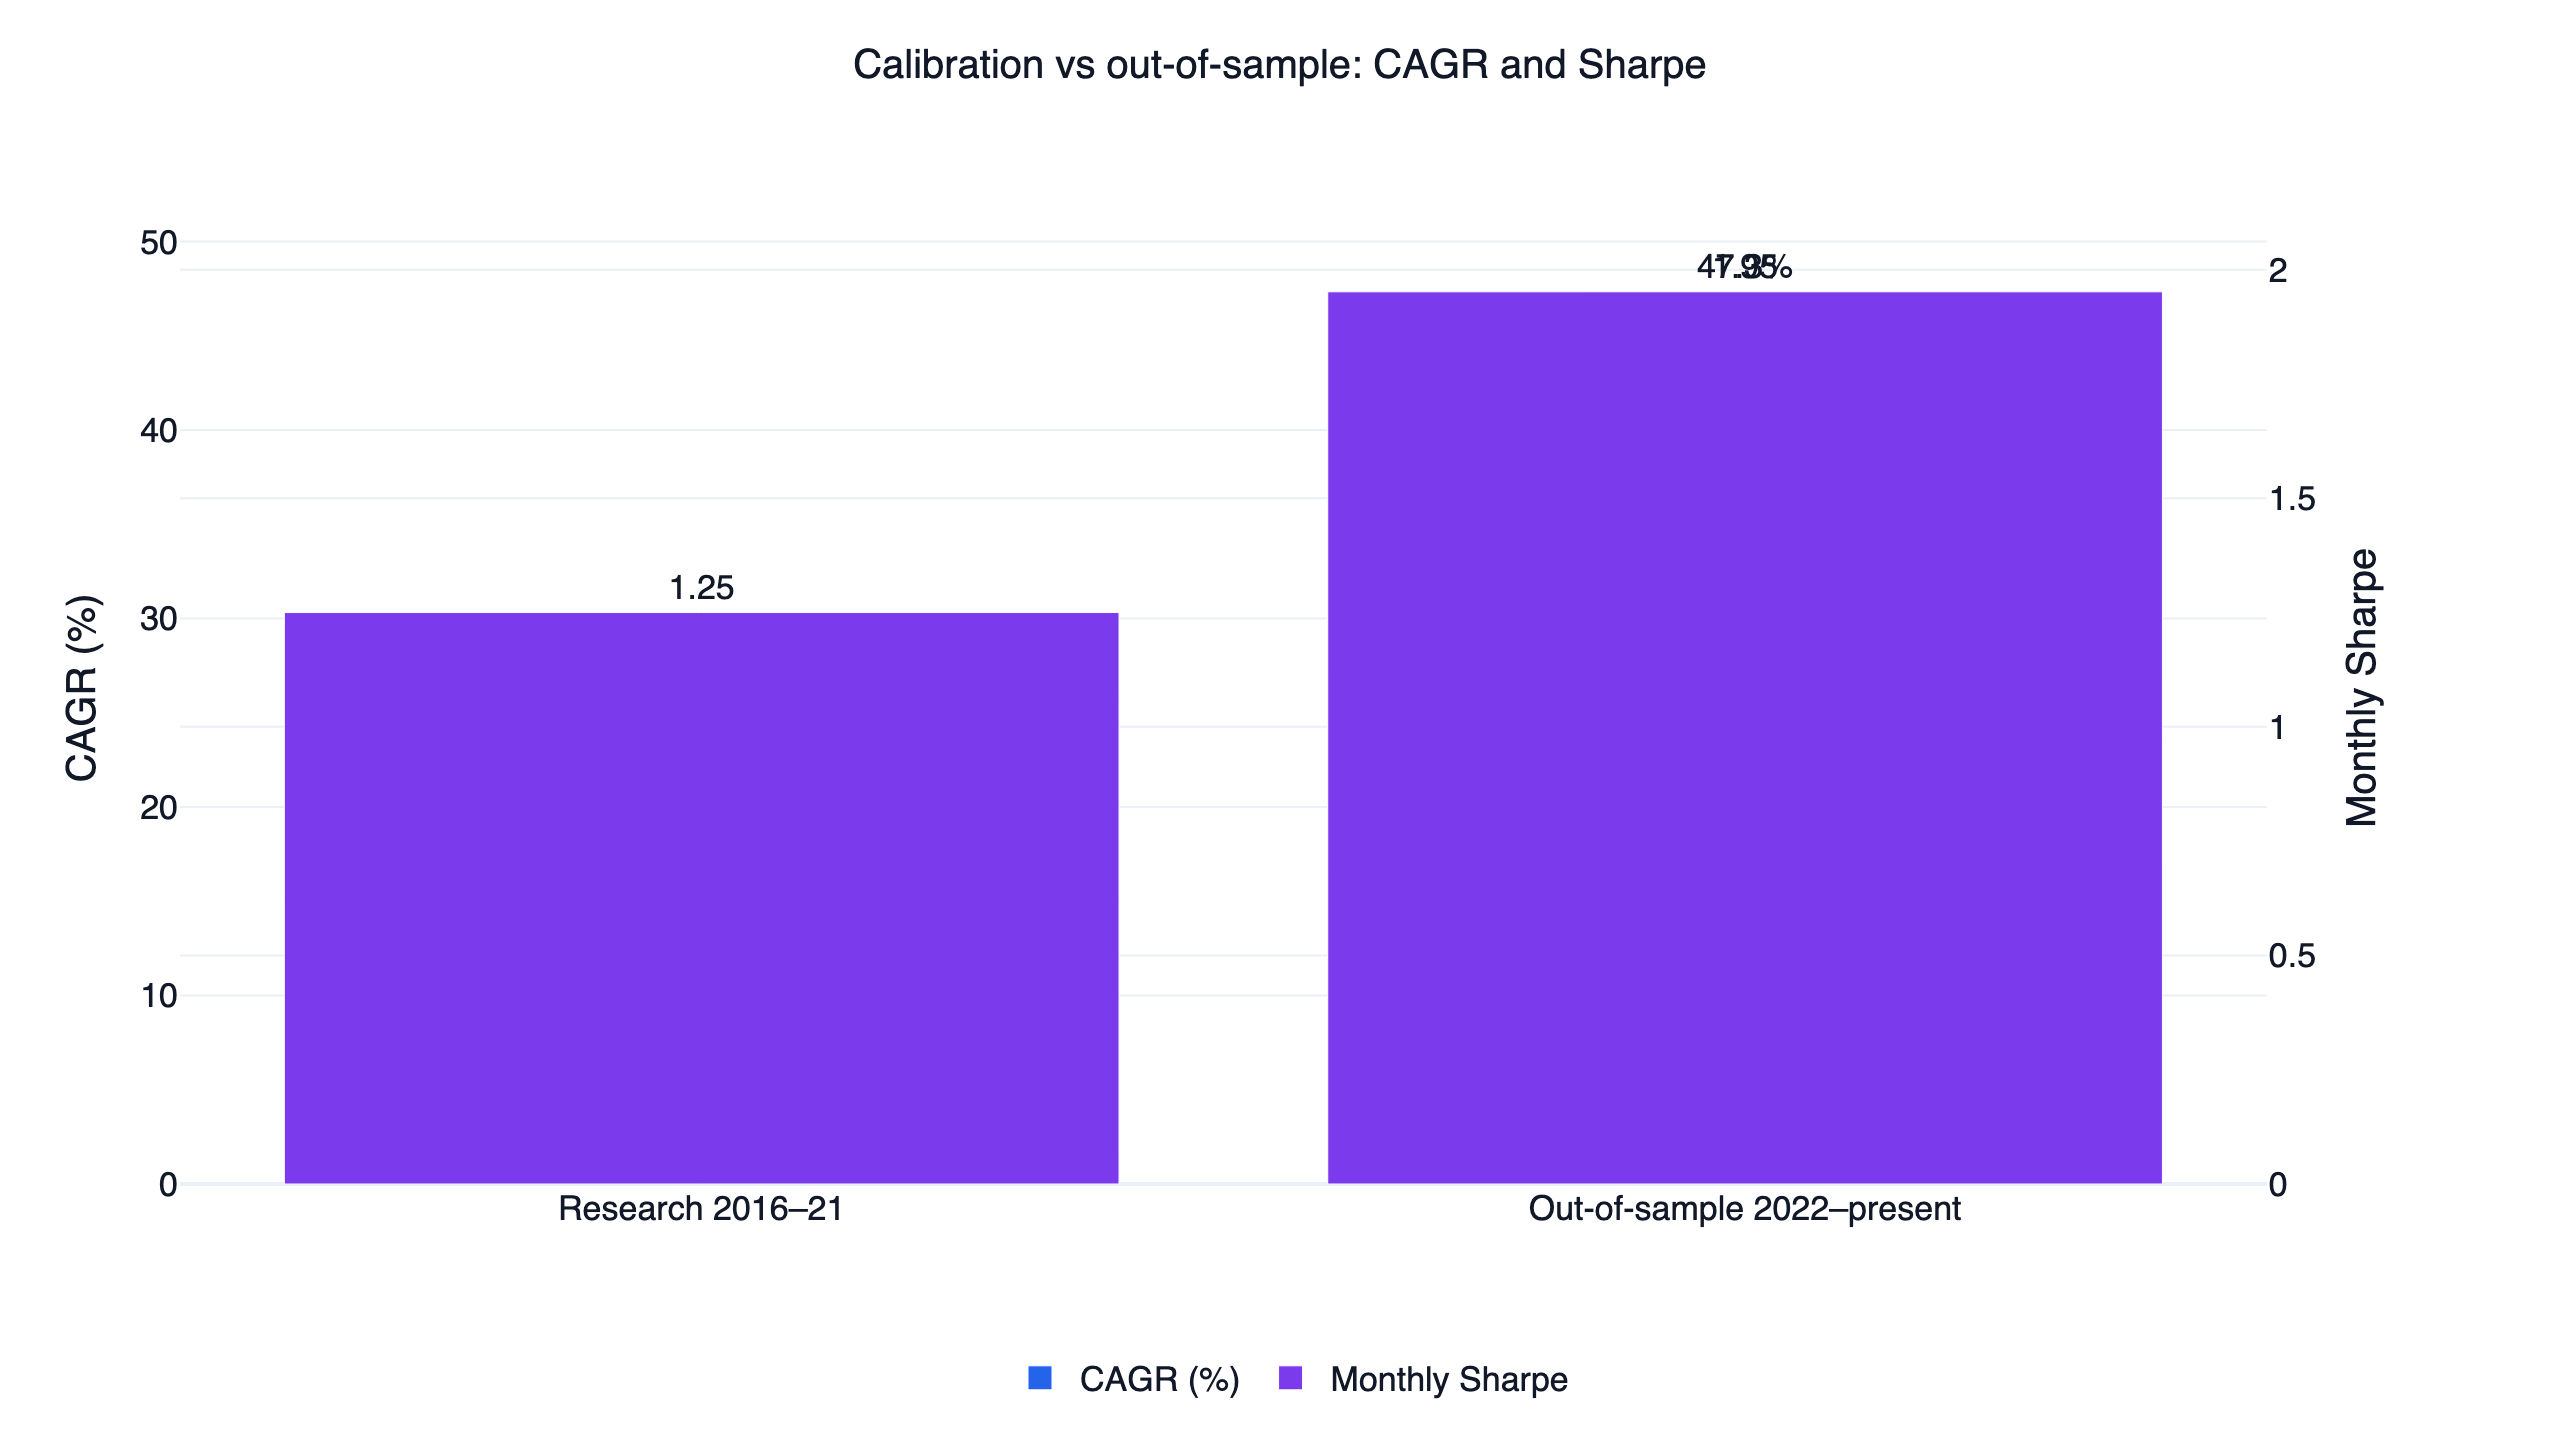
| Period | CAGR | Monthly Sharpe | Max drawdown |
|---|---|---|---|
| Research (2016-2021) | 26.0% | 1.25 | -21.1% |
| Out-of-sample (2022-present) | 47.3% | 1.95 | -13.9% |
Performance held up out of sample, with a smaller drawdown in the unseen period — partly because the regime filter moved to defensive ETFs through much of 2022. That is a genuine point in the strategy's favor, but it is a single market cycle, not a guarantee.
Backtest method and limits
A strategy is only as trustworthy as the assumptions behind it. The relevant ones here:
| Item | This backtest |
|---|---|
| Transaction costs | Not modeled (zero commission and slippage). For monthly rebalancing of liquid ETFs this is small, but leveraged-ETF spreads and rebalance slippage would reduce live returns. |
| Leverage decay | Already reflected — TQQQ/TECL price series include daily-reset drag and expense ratios. |
| Universe / point-in-time | Top 500 by 60-day dollar volume; price and liquidity gates; rolling artifact filter; each date uses only then-available data. |
| Turnover | About 3.6x per year (monthly regime switches, not daily churn). |
| Position rule | Up to 2 ETFs in risk-on, 1 defensive ETF otherwise; 8% touched stop. |
| Sample | 2016-2021 in-sample calibration; 2022-present out-of-sample. |
| Capacity | Not estimated. Leveraged ETF AUM is large, but real impact depends on your size. |
The headline gate this strategy is judged against is a risk-adjusted ratio of at least 1.5: it passes on monthly Sortino (4.54), daily Sortino (1.63), and the out-of-sample monthly Sharpe (1.95), while the full-period monthly Sharpe of 1.46 sits just below it.
The leveraged-ETF risk you must understand
This is not a buy-and-hold stock strategy, and the leverage is the main thing that can hurt you:
- Daily reset and path dependency. A 3x daily ETF compounds daily, so a choppy, sideways market erodes value even if the index ends flat. The naive TQQQ column above (-81.8% drawdown) is what unmanaged 3x exposure looks like.
- Gaps can beat stops. The 8% stop is a touched stop in the backtest; a large overnight gap can fill worse than the stop level in live trading.
- Monthly switching is not crash protection. The regime filter rebalances monthly. A fast crash inside a month is taken at full leverage until the next rebalance.
- Concentration. Holding one or two ETFs means single-position and single-theme (large-cap US growth) risk.
If those risks are not acceptable to you, the unlevered top-decile stock portfolio shown earlier captures the same momentum edge with far less tail risk.
Who this is for
It fits an investor who wants a rules-based, growth-tilted US strategy, understands leveraged ETFs, and can tolerate 20%+ drawdowns in exchange for higher compounding. It does not fit anyone who needs capital stability, cannot monitor a monthly rebalance, or is uncomfortable holding 3x products at any time.
FAQ
Does momentum still work in US stocks? The decile sort and positive (if modest) IC over 2016-2026 say yes for the top decile, consistent with the long literature from Jegadeesh & Titman (1993) onward. The edge is concentrated in the strongest names and is vulnerable to sharp reversals.
Why hold leveraged ETFs instead of the momentum stocks? The stock basket has real alpha but limited return capacity and rides the full market drawdown. Using breadth as a regime gate and expressing it through leveraged ETFs targets higher compounding while stepping aside in weak regimes. The trade-off is leverage risk.
Isn't 35% CAGR too good to be true? It comes with a -21% drawdown, 20% volatility, and 3x-ETF exposure. The naive 3x comparison (40% CAGR but -82% drawdown) shows the raw return is available; the strategy's contribution is risk management, not magic.
How often does it rebalance? Monthly. Turnover is about 3.6x per year.
What data do I need?
FinLab's us_price:* for the single-stock screen and us_fund_price:* for the ETFs. Both are in a standard FinLab account.
Can I run this myself? Yes — use the AI-assisted setup flow, or download the script below and run it after setup.
Reproduce it yourself
Two files reproduce everything above:
- strategy.py — the full strategy, ready to run after the AI-assisted setup flow.
- data.csv — daily equity curves for the strategy, QQQ, and SPY.
The fastest path is to use the AI-assisted setup flow and ask your AI agent to run and modify it — change the universe size, the breadth threshold, or swap the leveraged ETFs for unlevered ones, and let the agent re-run the backtest. To see how this strategy sits among nine related US systems, read the US quant trading strategies overview. For more strategy write-ups, see the FinLab research blog, the AI-built PEG value strategy, the new-high momentum study, the AI quant research workflow, the institutional-flow strategy, and the cash-flow quality strategy. To see what teams build with finlab, browse the use cases and the team behind FinLab.
Last updated: 2026-06 | Backtest window: 2016-06 to 2026-06 | Benchmark: QQQ total return | Author: FinLab Quant Research (reviewed by a quantitative researcher)
Investing involves risk, and past performance does not represent future results. Leveraged ETFs carry additional risks including volatility decay and amplified losses. This content is for educational purposes only and is not investment advice and does not constitute investment advice; evaluate any strategy against your own risk tolerance.
FinLab AI
Want to build your own strategy?
Describe your stock-picking ideas in natural language. AI automatically validates, backtests, and gives you answers
Start Free