Run this strategy
Copy the prompt to reproduce the evidence above with the article’s data, assumptions, and risk checks.
Tell your AI:
Help me set up FinLab and reproduce this article. Please read: https://finlab.finance/en/setup?relatedUrl=/en/blog/us-earnings-surprise-strategy
A post-earnings announcement drift strategy bets that stocks which beat analyst estimates keep outperforming for weeks after the report. The effect is one of the oldest documented anomalies in finance, and this article tests it the hard way: a 19,083-event study and decile sorts across the full liquid US universe first, then a tradable strategy built from what the data actually supports, backtested with real, downloadable finlab code.
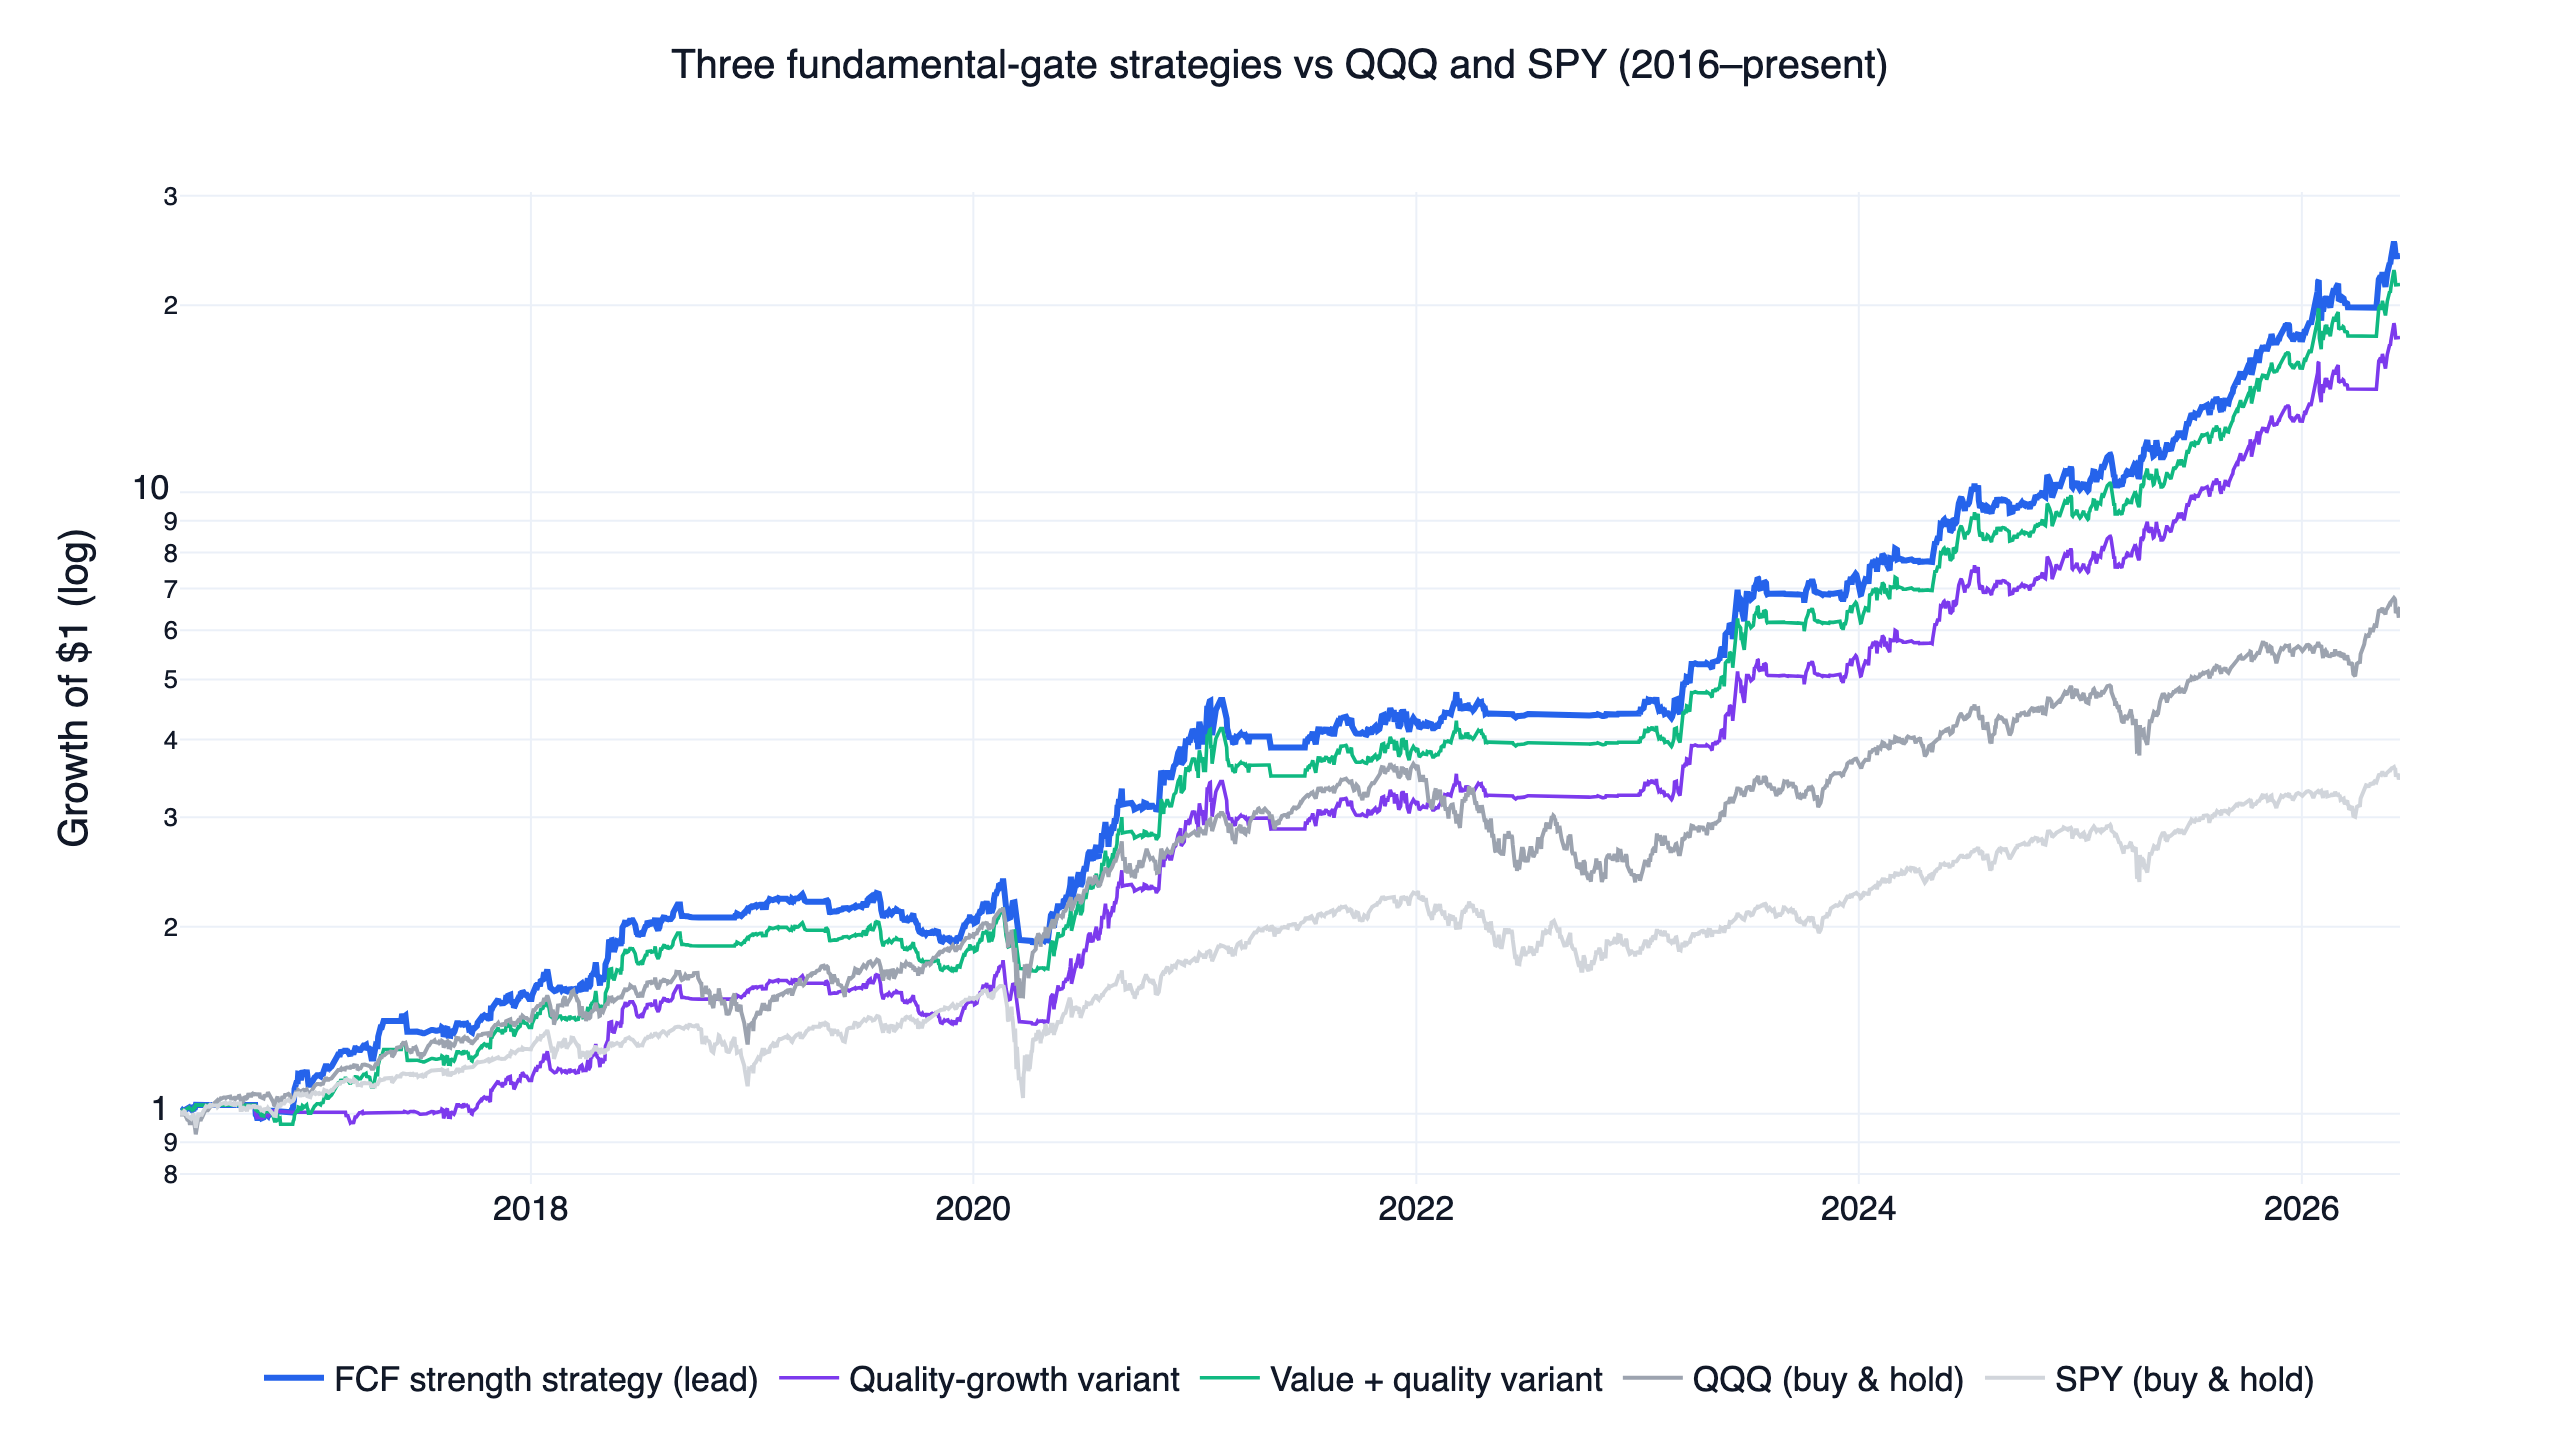
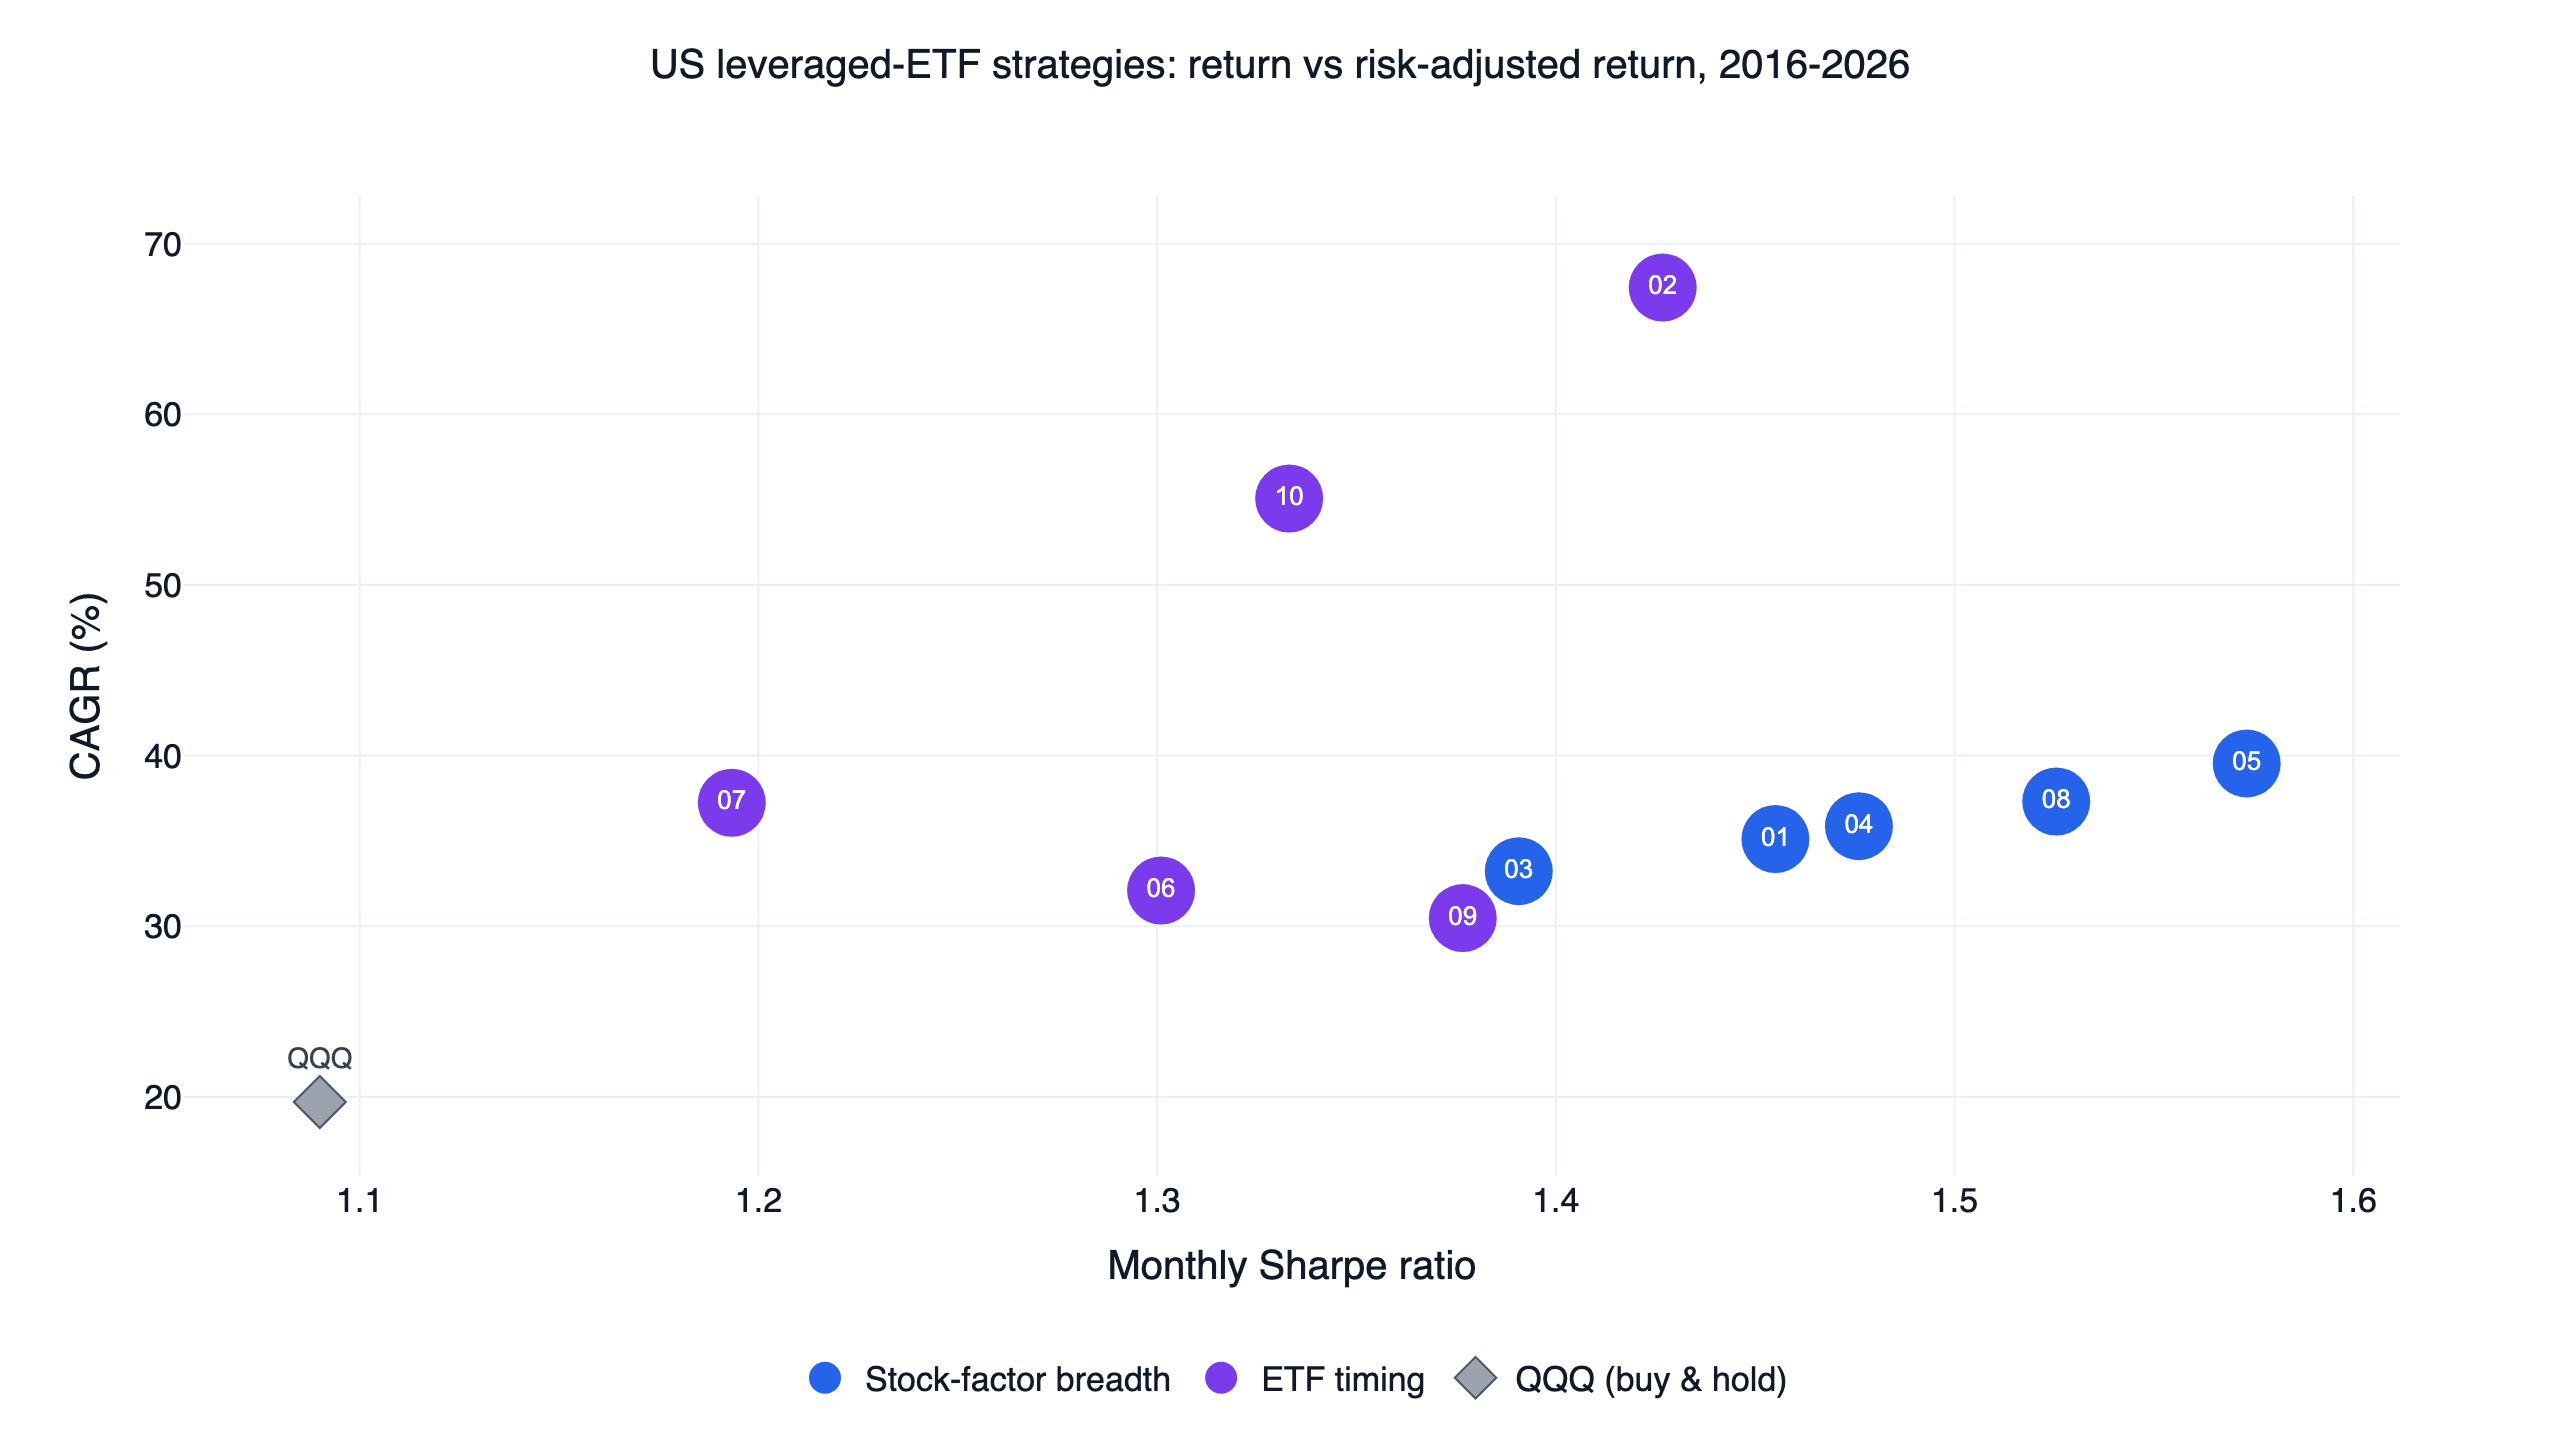
Two findings shape everything below. First, picking individual stocks by earnings surprise barely worked in liquid US large caps over 2016-2026; the single-name edge is small and driven mostly by avoiding misses. Second, the breadth of positive surprises across the market turned out to be a useful risk-on signal, and that is the version that trades: 39.5% CAGR at a 1.57 monthly Sharpe and a -21.1% maximum drawdown, against 19.8% / 1.09 / -35.6% for buying and holding the Nasdaq-100 (QQQ). The strategy never holds the surprise stocks themselves. It holds leveraged growth ETFs when surprise breadth and the market trend agree, and defensive ETFs otherwise. This is one of ten US systems built on the same execution engine, compared side by side in the US quant trading strategies overview.
The numbers at a glance
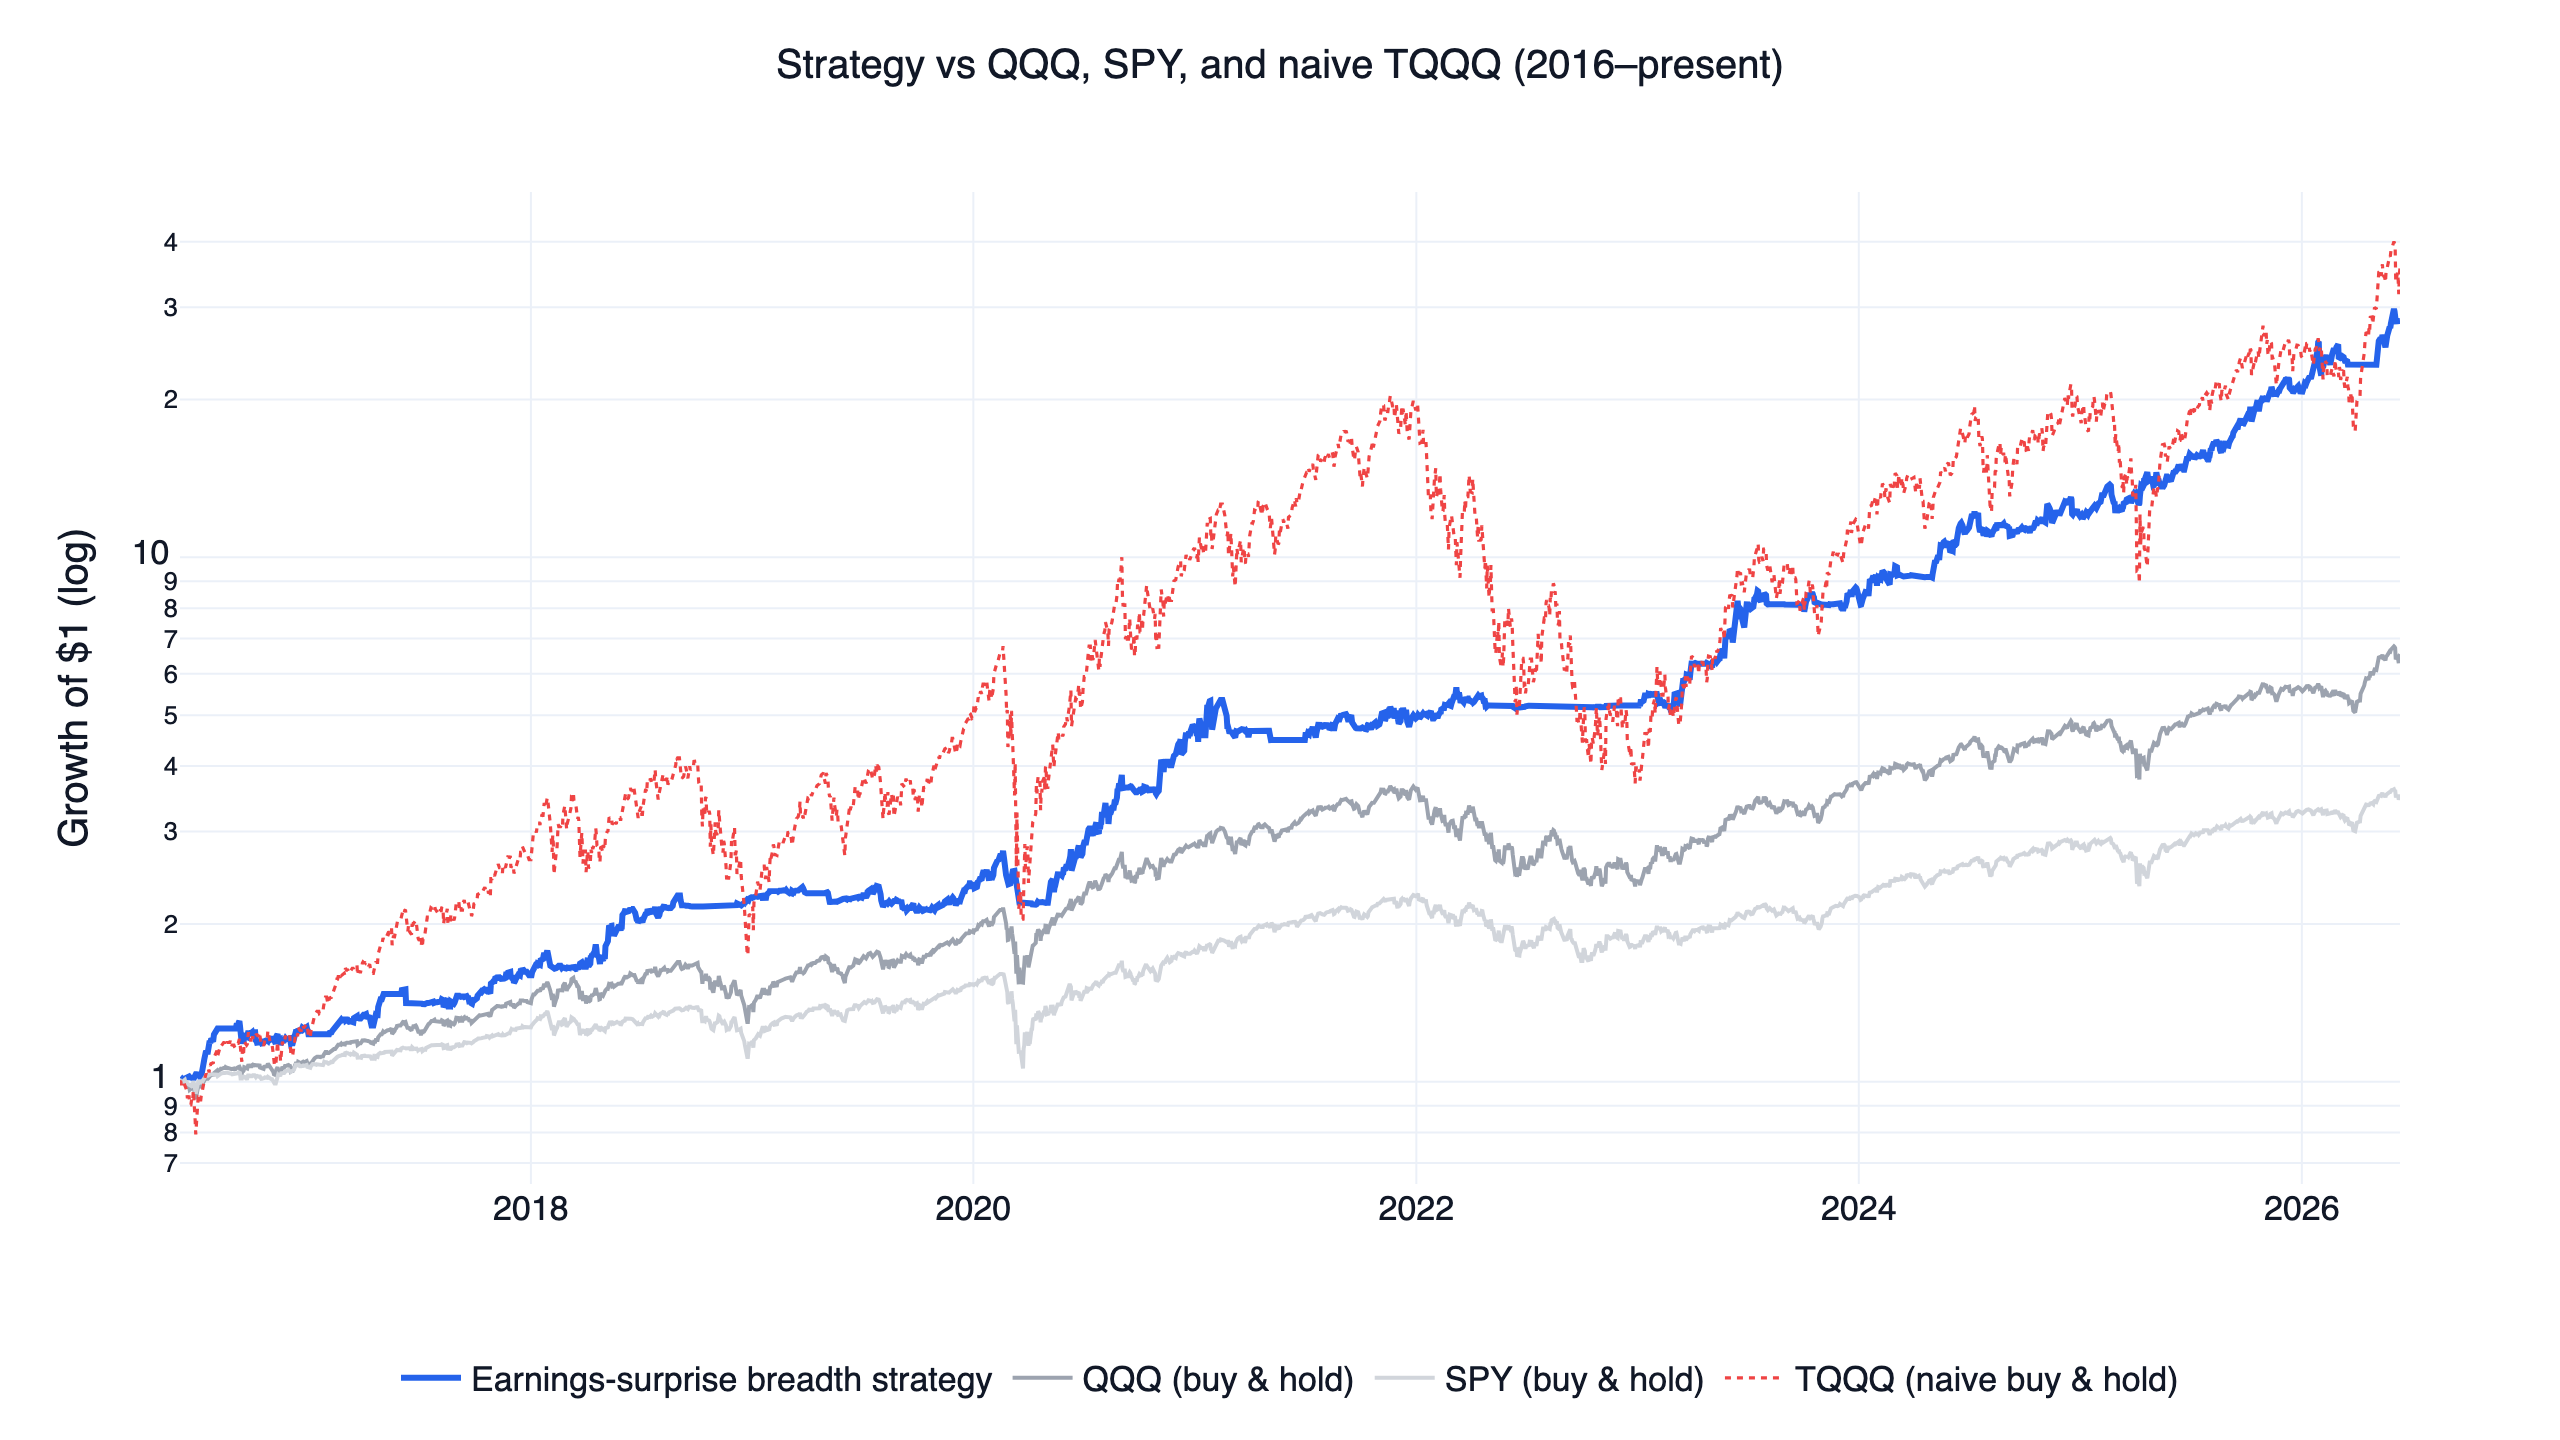
| Metric | This strategy | QQQ (buy & hold) | SPY (buy & hold) | TQQQ (naive buy & hold) |
|---|---|---|---|---|
| CAGR | 39.5% | 19.8% | 13.3% | 40.4% |
| Monthly Sharpe | 1.57 | 1.09 | 0.92 | 0.91 |
| Monthly Sortino | 5.05 | 1.76 | 1.27 | 1.53 |
| Max drawdown | -21.1% | -35.6% | -34.1% | -81.8% |
| Annualized volatility | 20.5% | 22.2% | 17.9% | 65.9% |
Window: June 2016 to June 2026. A dollar in the strategy grew to about 6.6 in QQQ, 34.6 in a naive TQQQ buy-and-hold that suffered an -81.8% drawdown along the way. As with the momentum version of this engine, the raw return of 3x leverage was always available; the strategy's contribution is deciding when not to hold it. Benchmarks use total-return (dividend-adjusted) prices, and the simulation charges no fees or slippage, which is covered in the method section.
What post-earnings announcement drift is
Post-earnings announcement drift (PEAD) is the tendency of stock prices to keep moving in the direction of an earnings surprise for weeks or months after the announcement, instead of adjusting instantly. Markets underreacting to earnings news was first documented by Ball & Brown (1968), and the drift was established as a systematic, exploitable pattern by Bernard & Thomas (1989), who showed prices respond to earnings news with a delay rather than all at once. Foster, Olsen & Shevlin (1984) found the drift scales with the size of the surprise and is stronger in smaller firms — a detail that matters here, because this test deliberately restricts itself to the most liquid 500 US names, where the anomaly faces its toughest conditions.
The surprise measure used throughout is the standard one: (actual EPS − analyst estimate) / |estimate|, from FinLab's us_earnings_surprises dataset. Surprises exist only on announcement dates, so this is event data, and each stock's factor value is its most recent surprise within the last 63 trading days (one quarter).
Copy this prompt to your AI agent
FinLab's setup path is now one prompt. Paste it into Codex app or Claude cowork, and the AI will read https://finlab.finance/en/setup, install the FinLab skill when needed, then run or modify the strategy in this article.
Show Code
Help me set up FinLab and build an earnings surprise strategy: https://finlab.finance/en/setupThe setup page is https://finlab.finance/en/setup.
Layer one: does earnings surprise pick stocks?
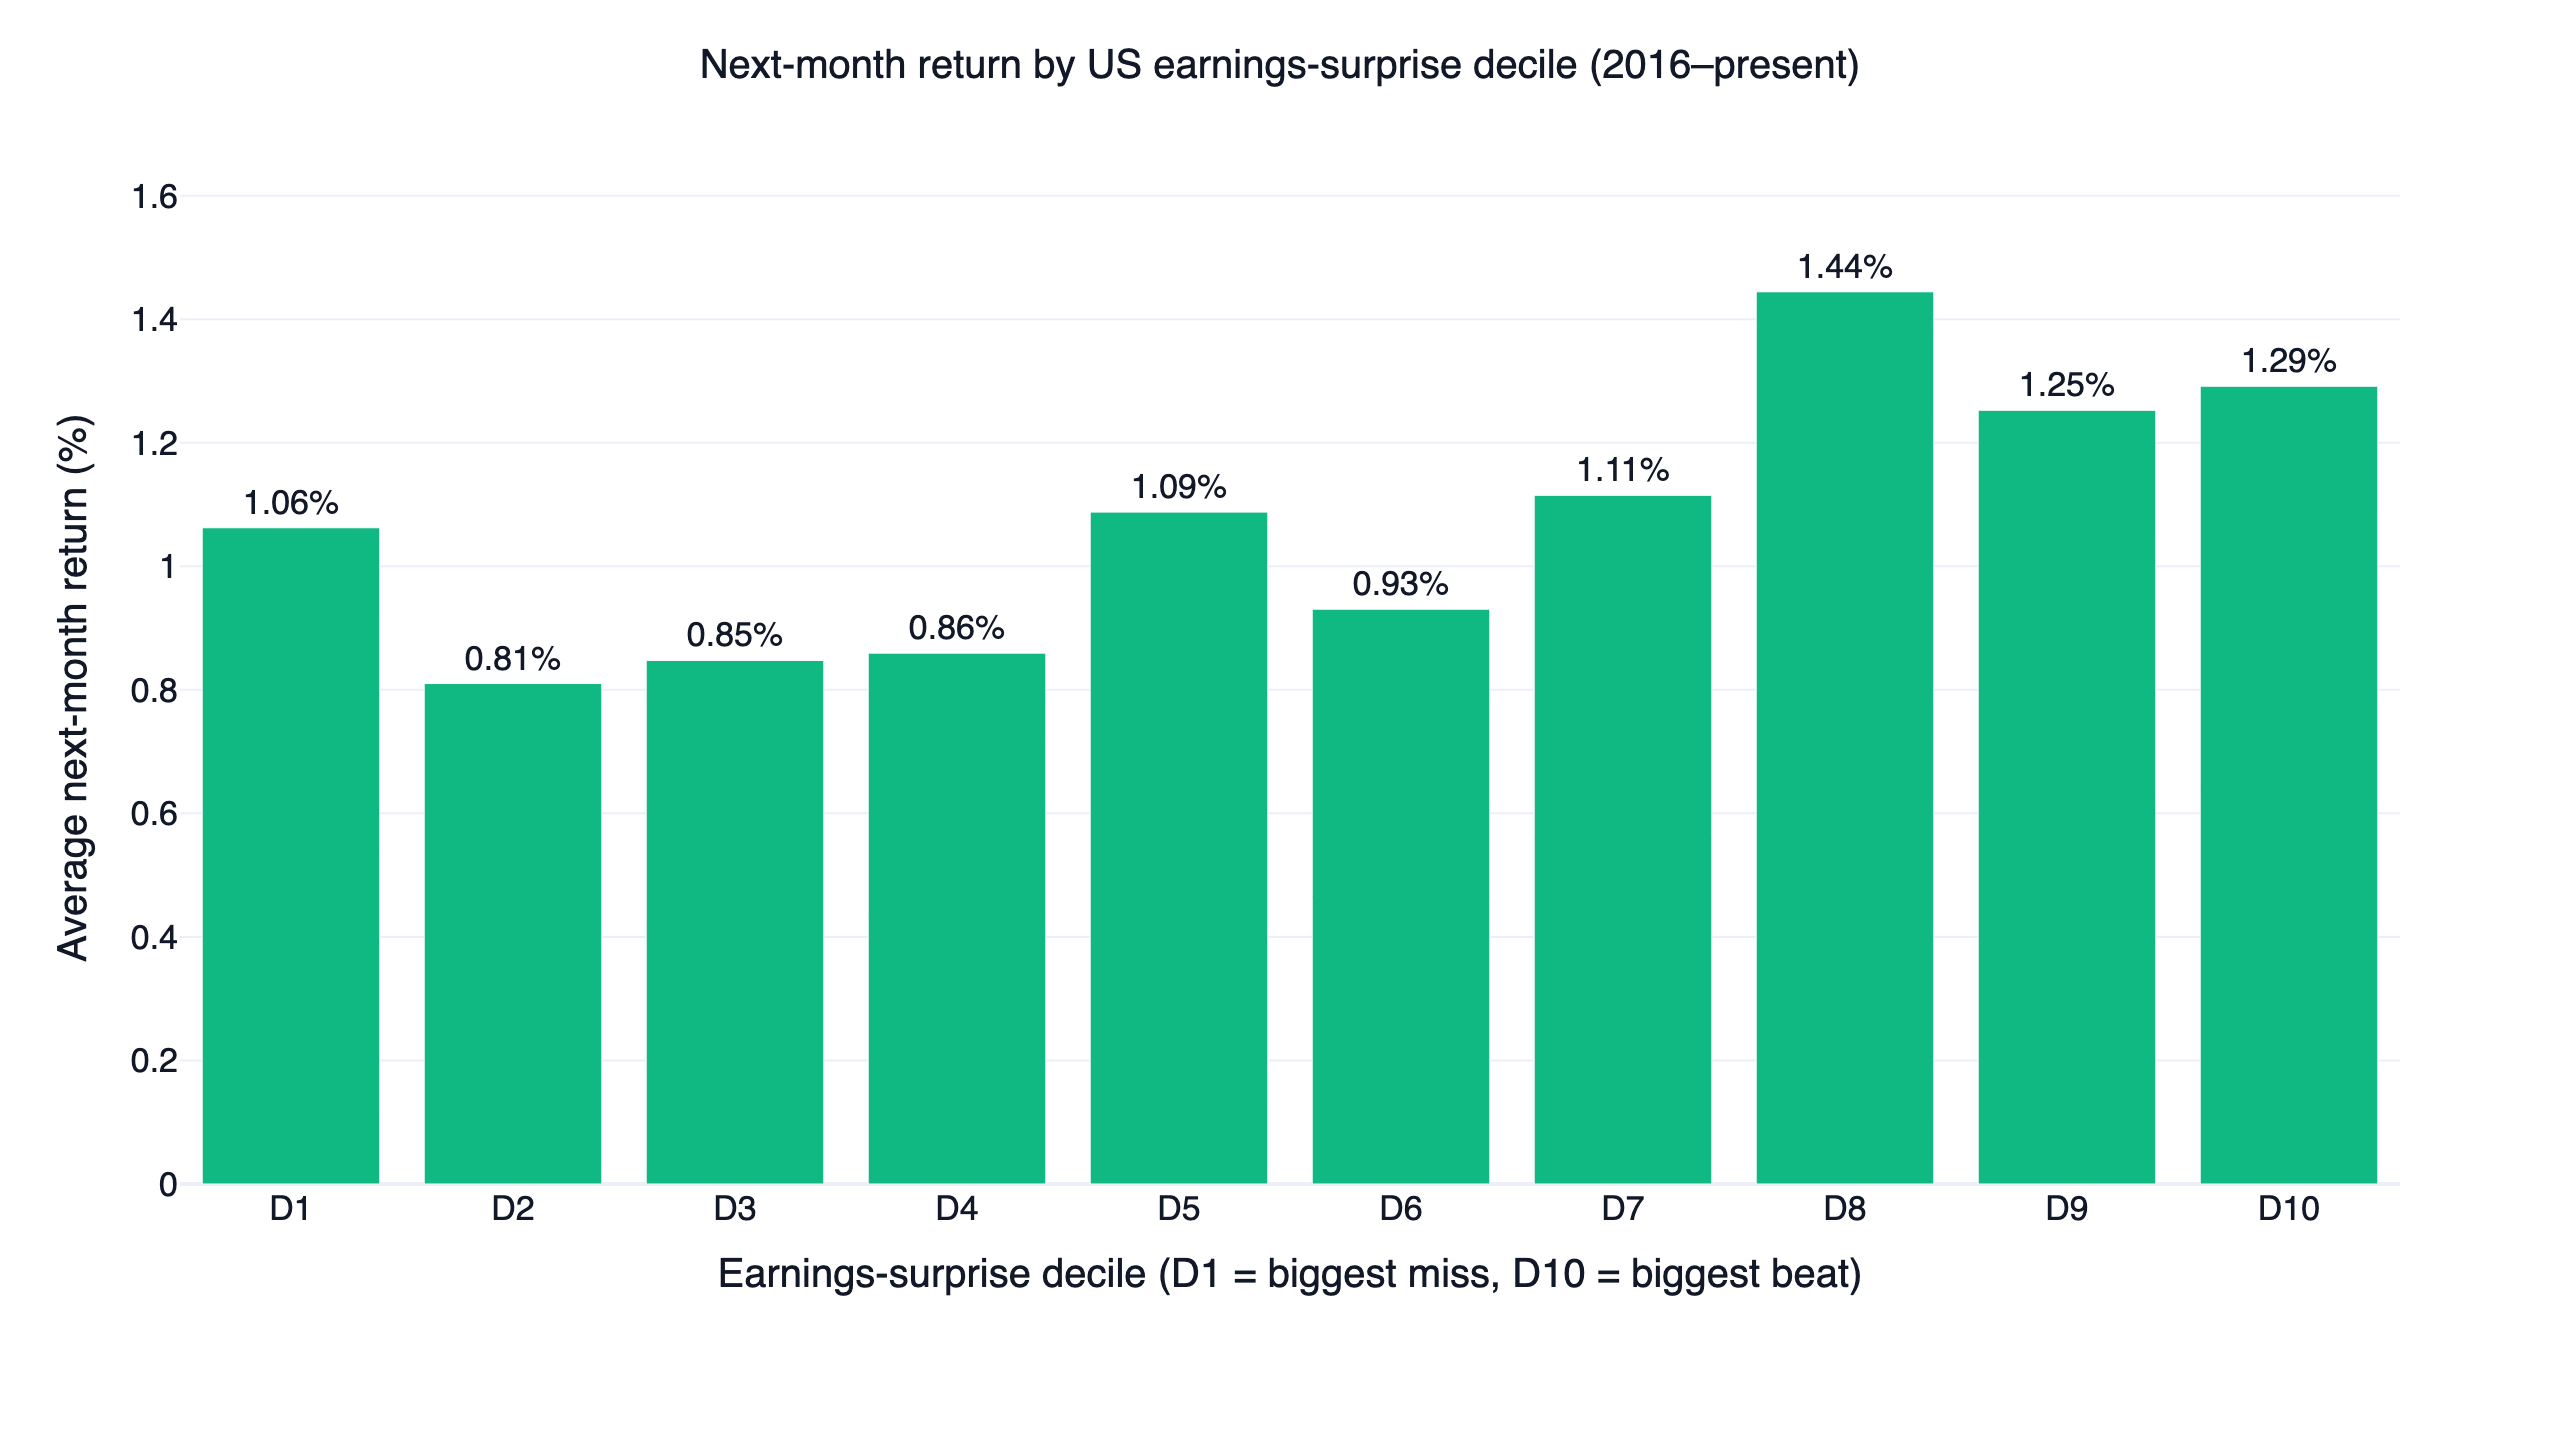
Before building anything tradable, the factor has to be tested across the whole universe: the top 500 US stocks by 60-day average dollar volume, with a 8M dollar-volume floor, and a rolling filter that removes any name for a year after a single-day move of 50% or more. About 476 names carry a fresh surprise ranking in an average month. Sorting them into deciles by their most recent earnings surprise and measuring the next month's average return gives the cleanest read.
| Surprise decile | Avg. next-month return |
|---|---|
| D1 (biggest miss) | 1.06% |
| D2 | 0.81% |
| D5 | 1.09% |
| D8 | 1.44% |
| D9 | 1.25% |
| D10 (biggest beat) | 1.29% |
The gradient is real but weak. Top-decile beats earned 1.29% per month against 1.06% for the biggest misses, the ordering is not monotonic (D8 actually tops the table at 1.44%), and a long-short portfolio of top minus bottom decile returned only +2.75% annualized with a 51.6% monthly hit rate. Compare that with the same universe sorted by 12-1 momentum, where the top decile out-earned the bottom by 1.93% per month in the US momentum study. As a stock-picking signal in liquid large caps after 2016, earnings surprise is an order of magnitude weaker.
The event study sharpens the picture. Across 19,083 in-universe earnings announcements (9,570 beats above 5%, 5,696 small beats of 0-5%, 3,817 misses), abnormal returns are measured against the equal-weight liquid universe for 60 trading days after each report:
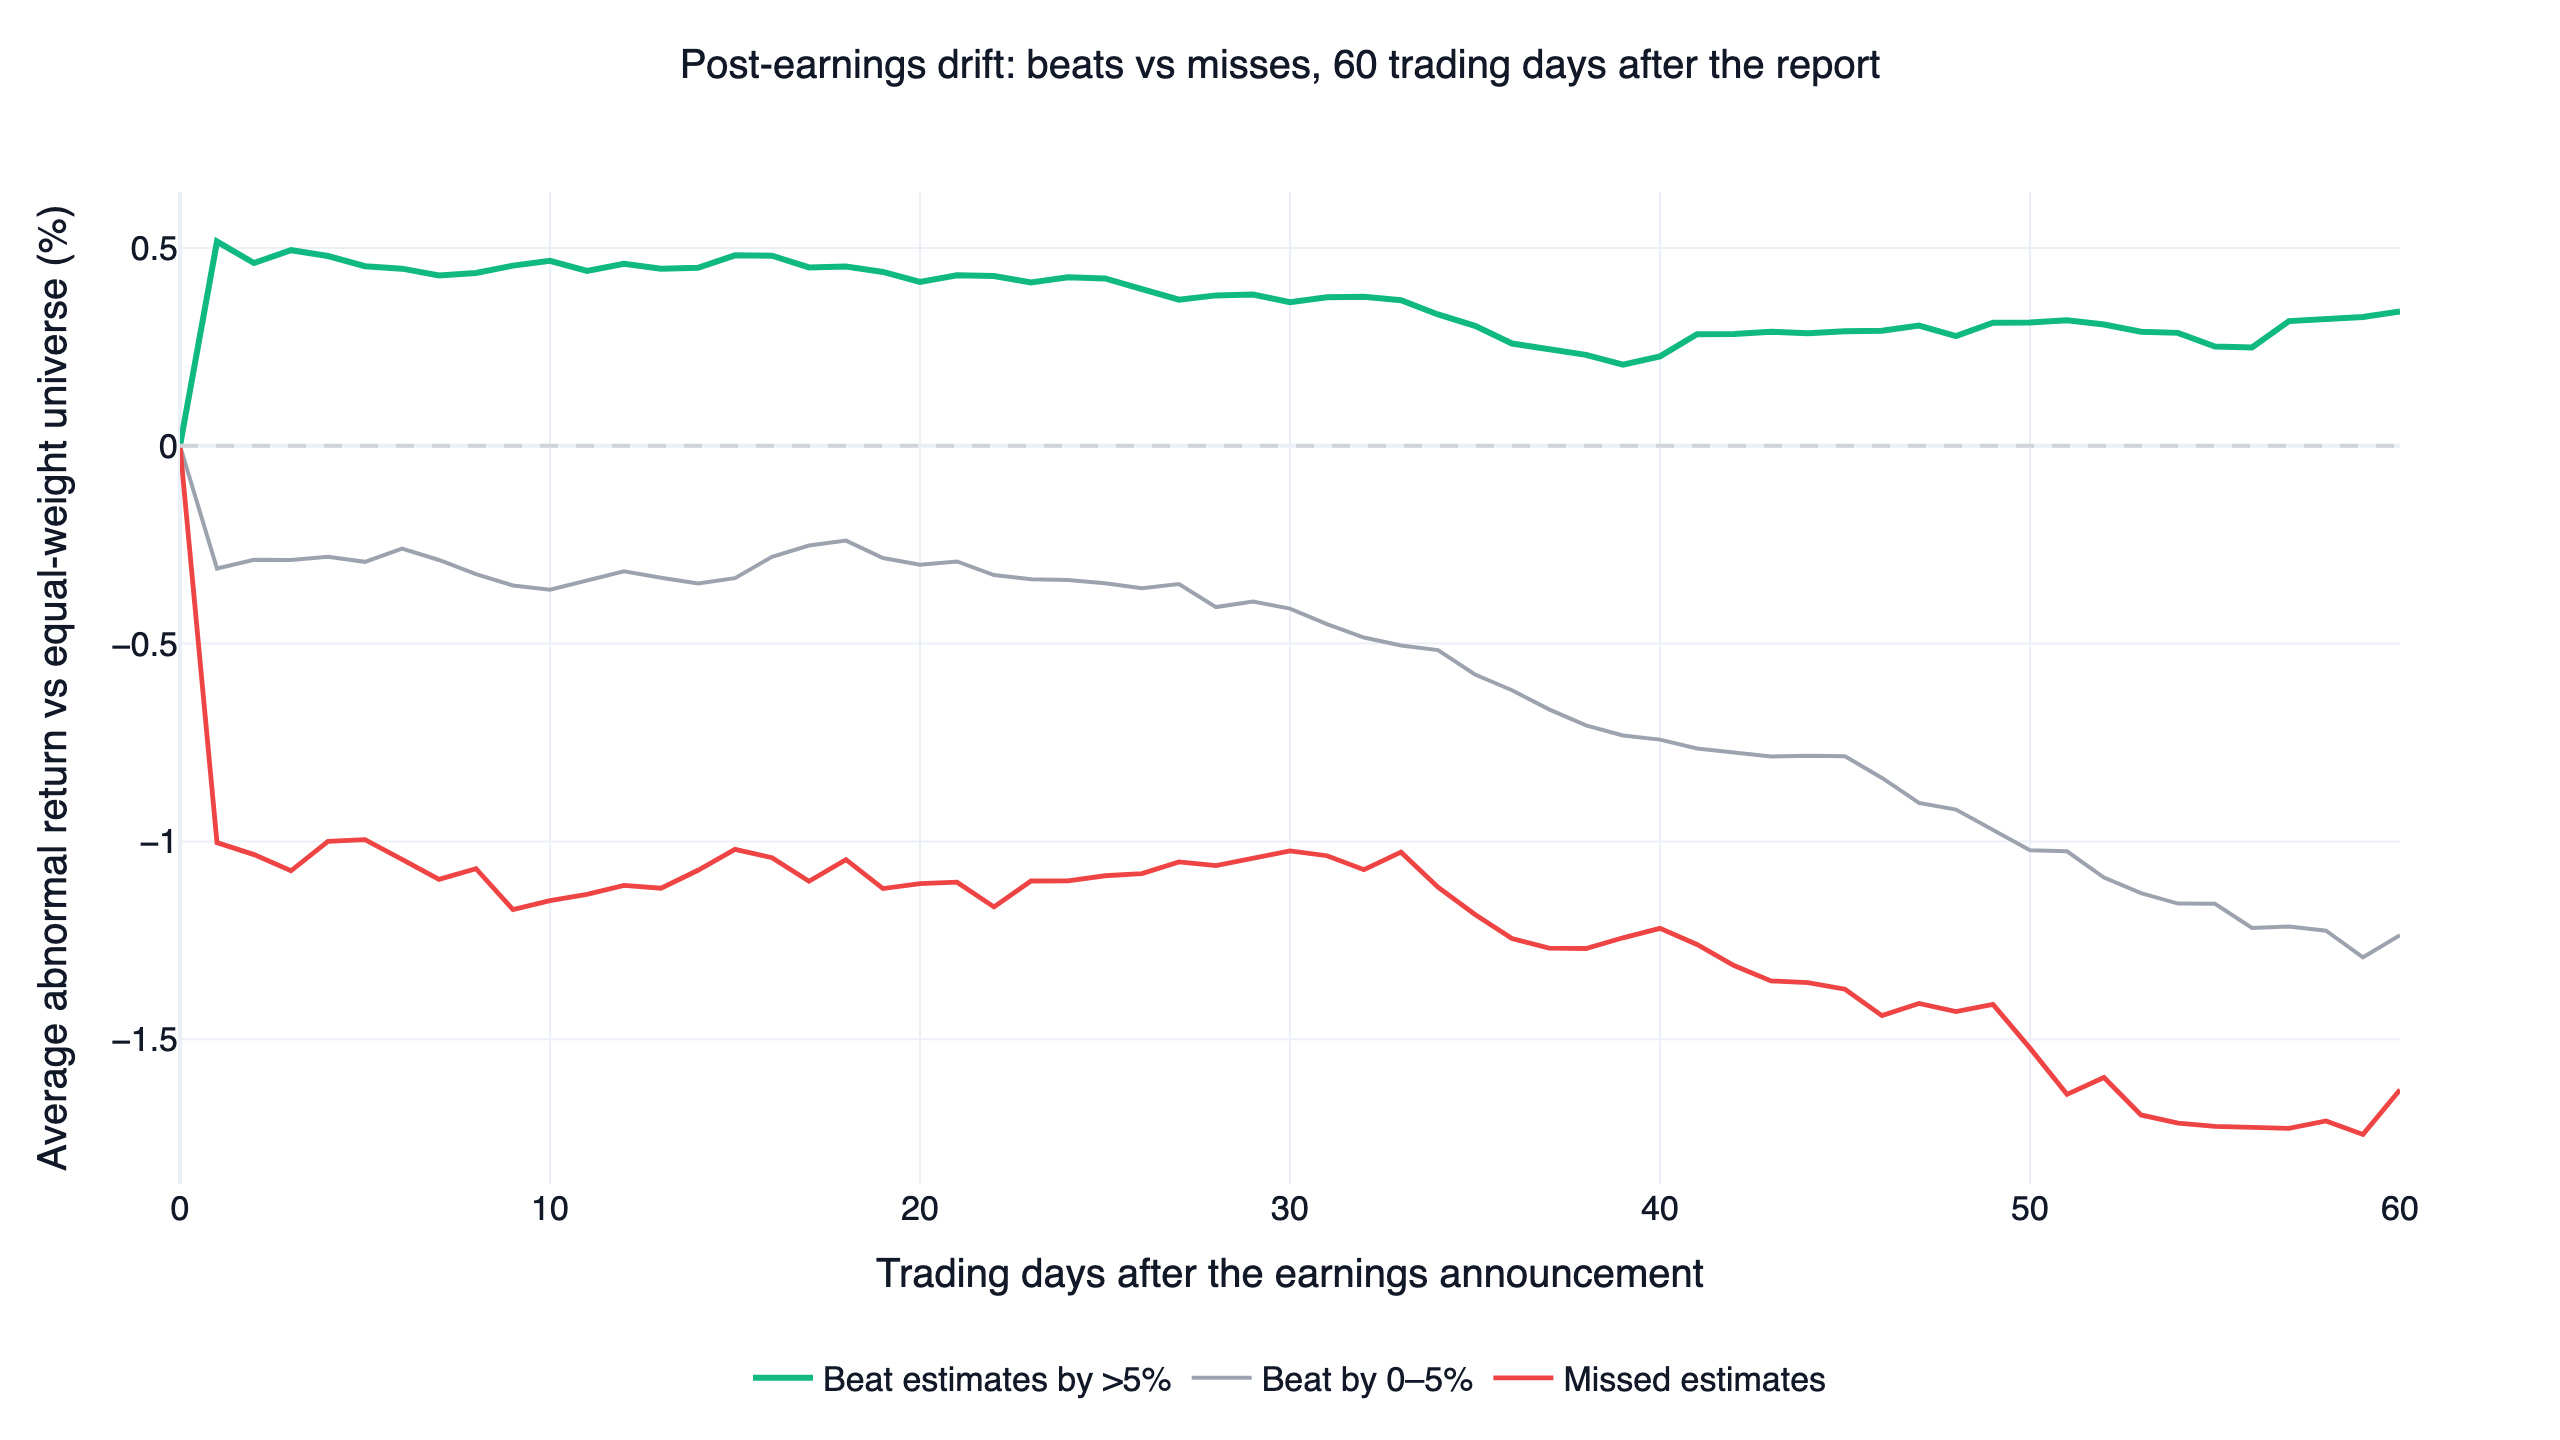
Stocks that beat estimates by more than 5% held a +0.41% abnormal return after 20 trading days and +0.34% after 60, while misses drifted down to -1.63% — a beat-minus-miss spread of about 1.97 percentage points, with most of it coming from the miss side. The drift survives in modern large caps, but mainly as a warning to avoid disappointments rather than a reason to chase beats: only 48.3% of big beats went on to outperform the universe over the next 60 days, so the positive average rides on a right tail of large winners. Measured against cap-weighted QQQ instead of the equal-weight universe, every bucket drifts negative (-1.0% for beats, -3.3% for misses), because a handful of mega-cap tech names beat the average stock over this decade regardless of anyone's earnings surprise.
One result cuts against intuition. Beats that fell on the report day went on to drift +0.84% over the next 60 days, while beats greeted with a positive day-0 pop showed no further drift at all (-0.04%). At the single-stock level, the obvious trade of buying strength after a good report had nothing left to capture in this sample; the same-day reaction matters later as a market-level confirmation, where it filters which events count toward the regime signal.
The rank information coefficient confirms how thin the cross-sectional signal is. The rank IC is the rank correlation between this month's surprise and the next period's return; consistently positive values mean the factor carries predictive information.
![]()
| Horizon | Mean rank IC | IC information ratio |
|---|---|---|
| 1 month | 0.012 | 0.15 |
| 2 months | 0.014 | 0.17 |
| 3 months | 0.014 | 0.16 |
| 6 months | 0.015 | 0.17 |
A mean 1-month IC of 0.012 is positive but small, roughly half of what the momentum factor produces on the same universe. The IC rising slightly with horizon, to 0.015 at six months, is the signature of drift rather than reversal, consistent with the delayed-response mechanism in Bernard & Thomas. The close relationship between earnings news and price continuation is also why Chordia & Shivakumar (2006) found that earnings momentum largely subsumes price momentum: the two anomalies share an engine, and by 2016-2026 the large-cap version of this one had been mostly arbitraged thin.
An unlevered portfolio that simply holds the top surprise decile, equal weight, rebalanced monthly, makes the verdict concrete:
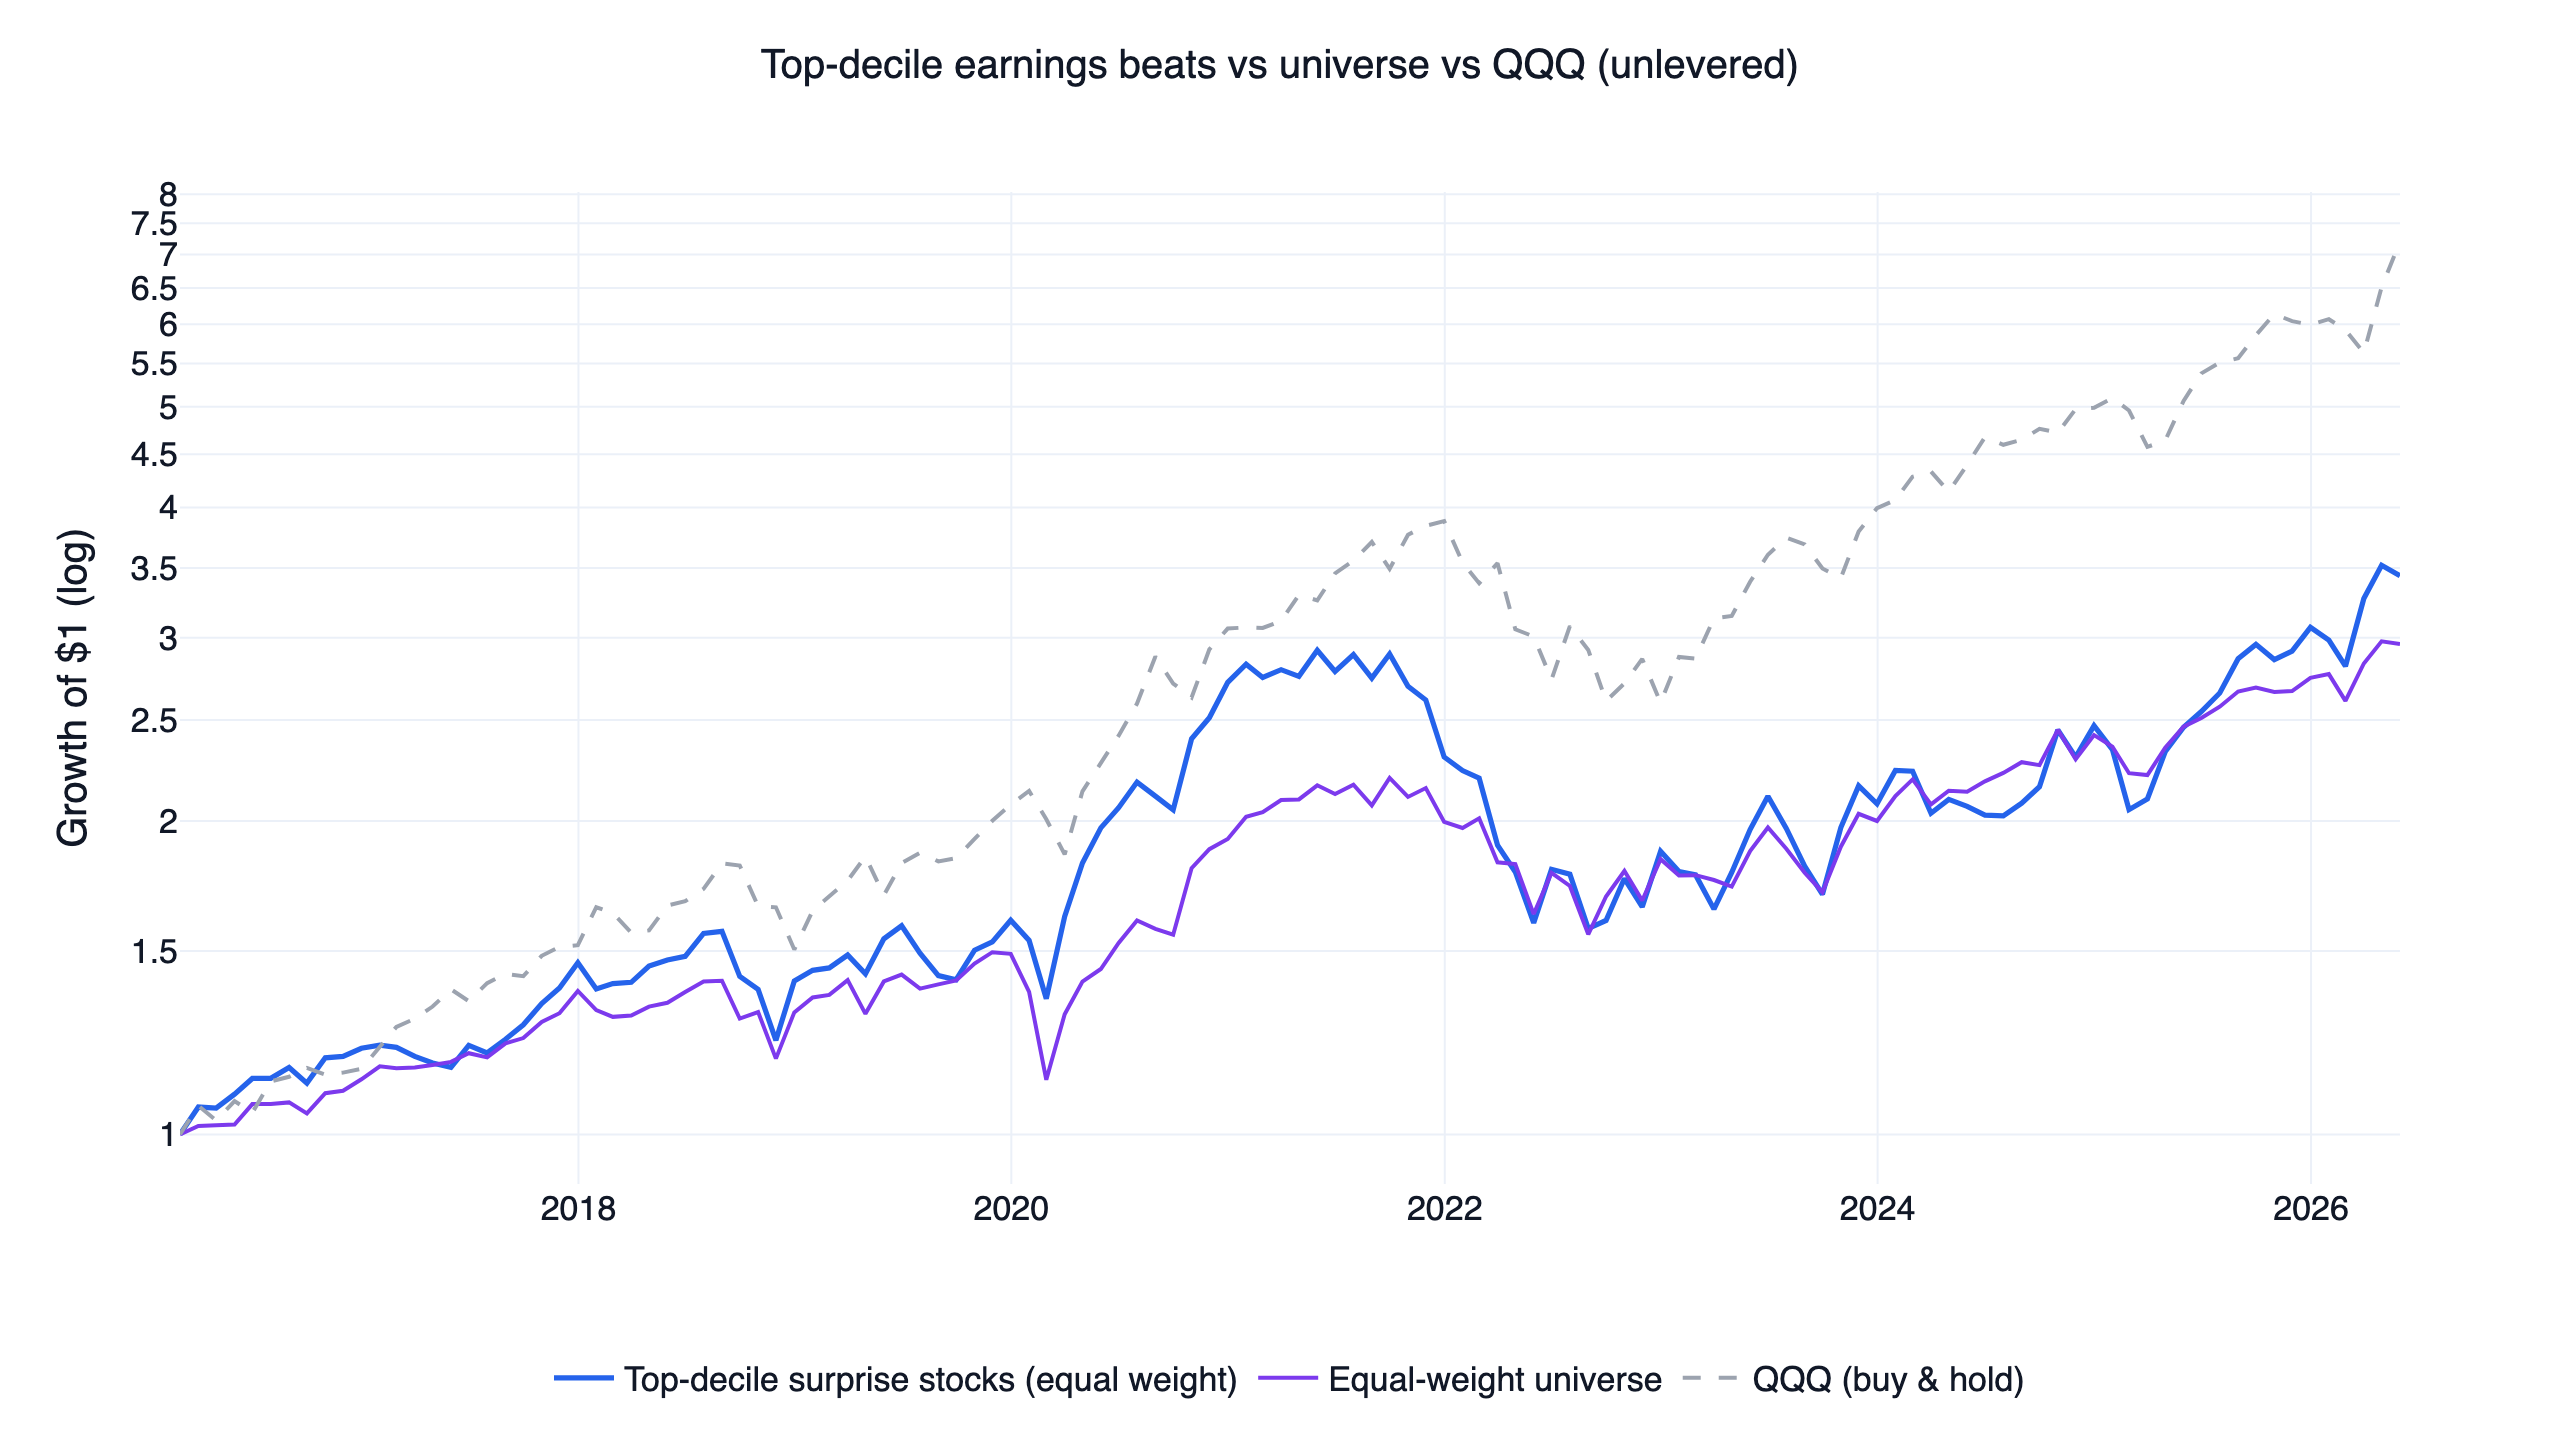
The top-decile basket grew 3.5 versus 7. Holding surprise stocks directly would have underperformed an index fund. That is the case, on this data, for using the factor a different way.
Layer two: surprise breadth as a regime gate
If individual surprises barely sort stocks, what does the aggregate say? When a large share of companies are beating estimates and the market is rewarding them the same day, earnings season is confirming the uptrend; when beats dry up or get sold, fundamentals have stopped cooperating. The strategy measures this as surprise breadth: the rolling 20-day count of in-universe events with a surprise above 5% and a positive same-day reaction, divided by the size of the universe.
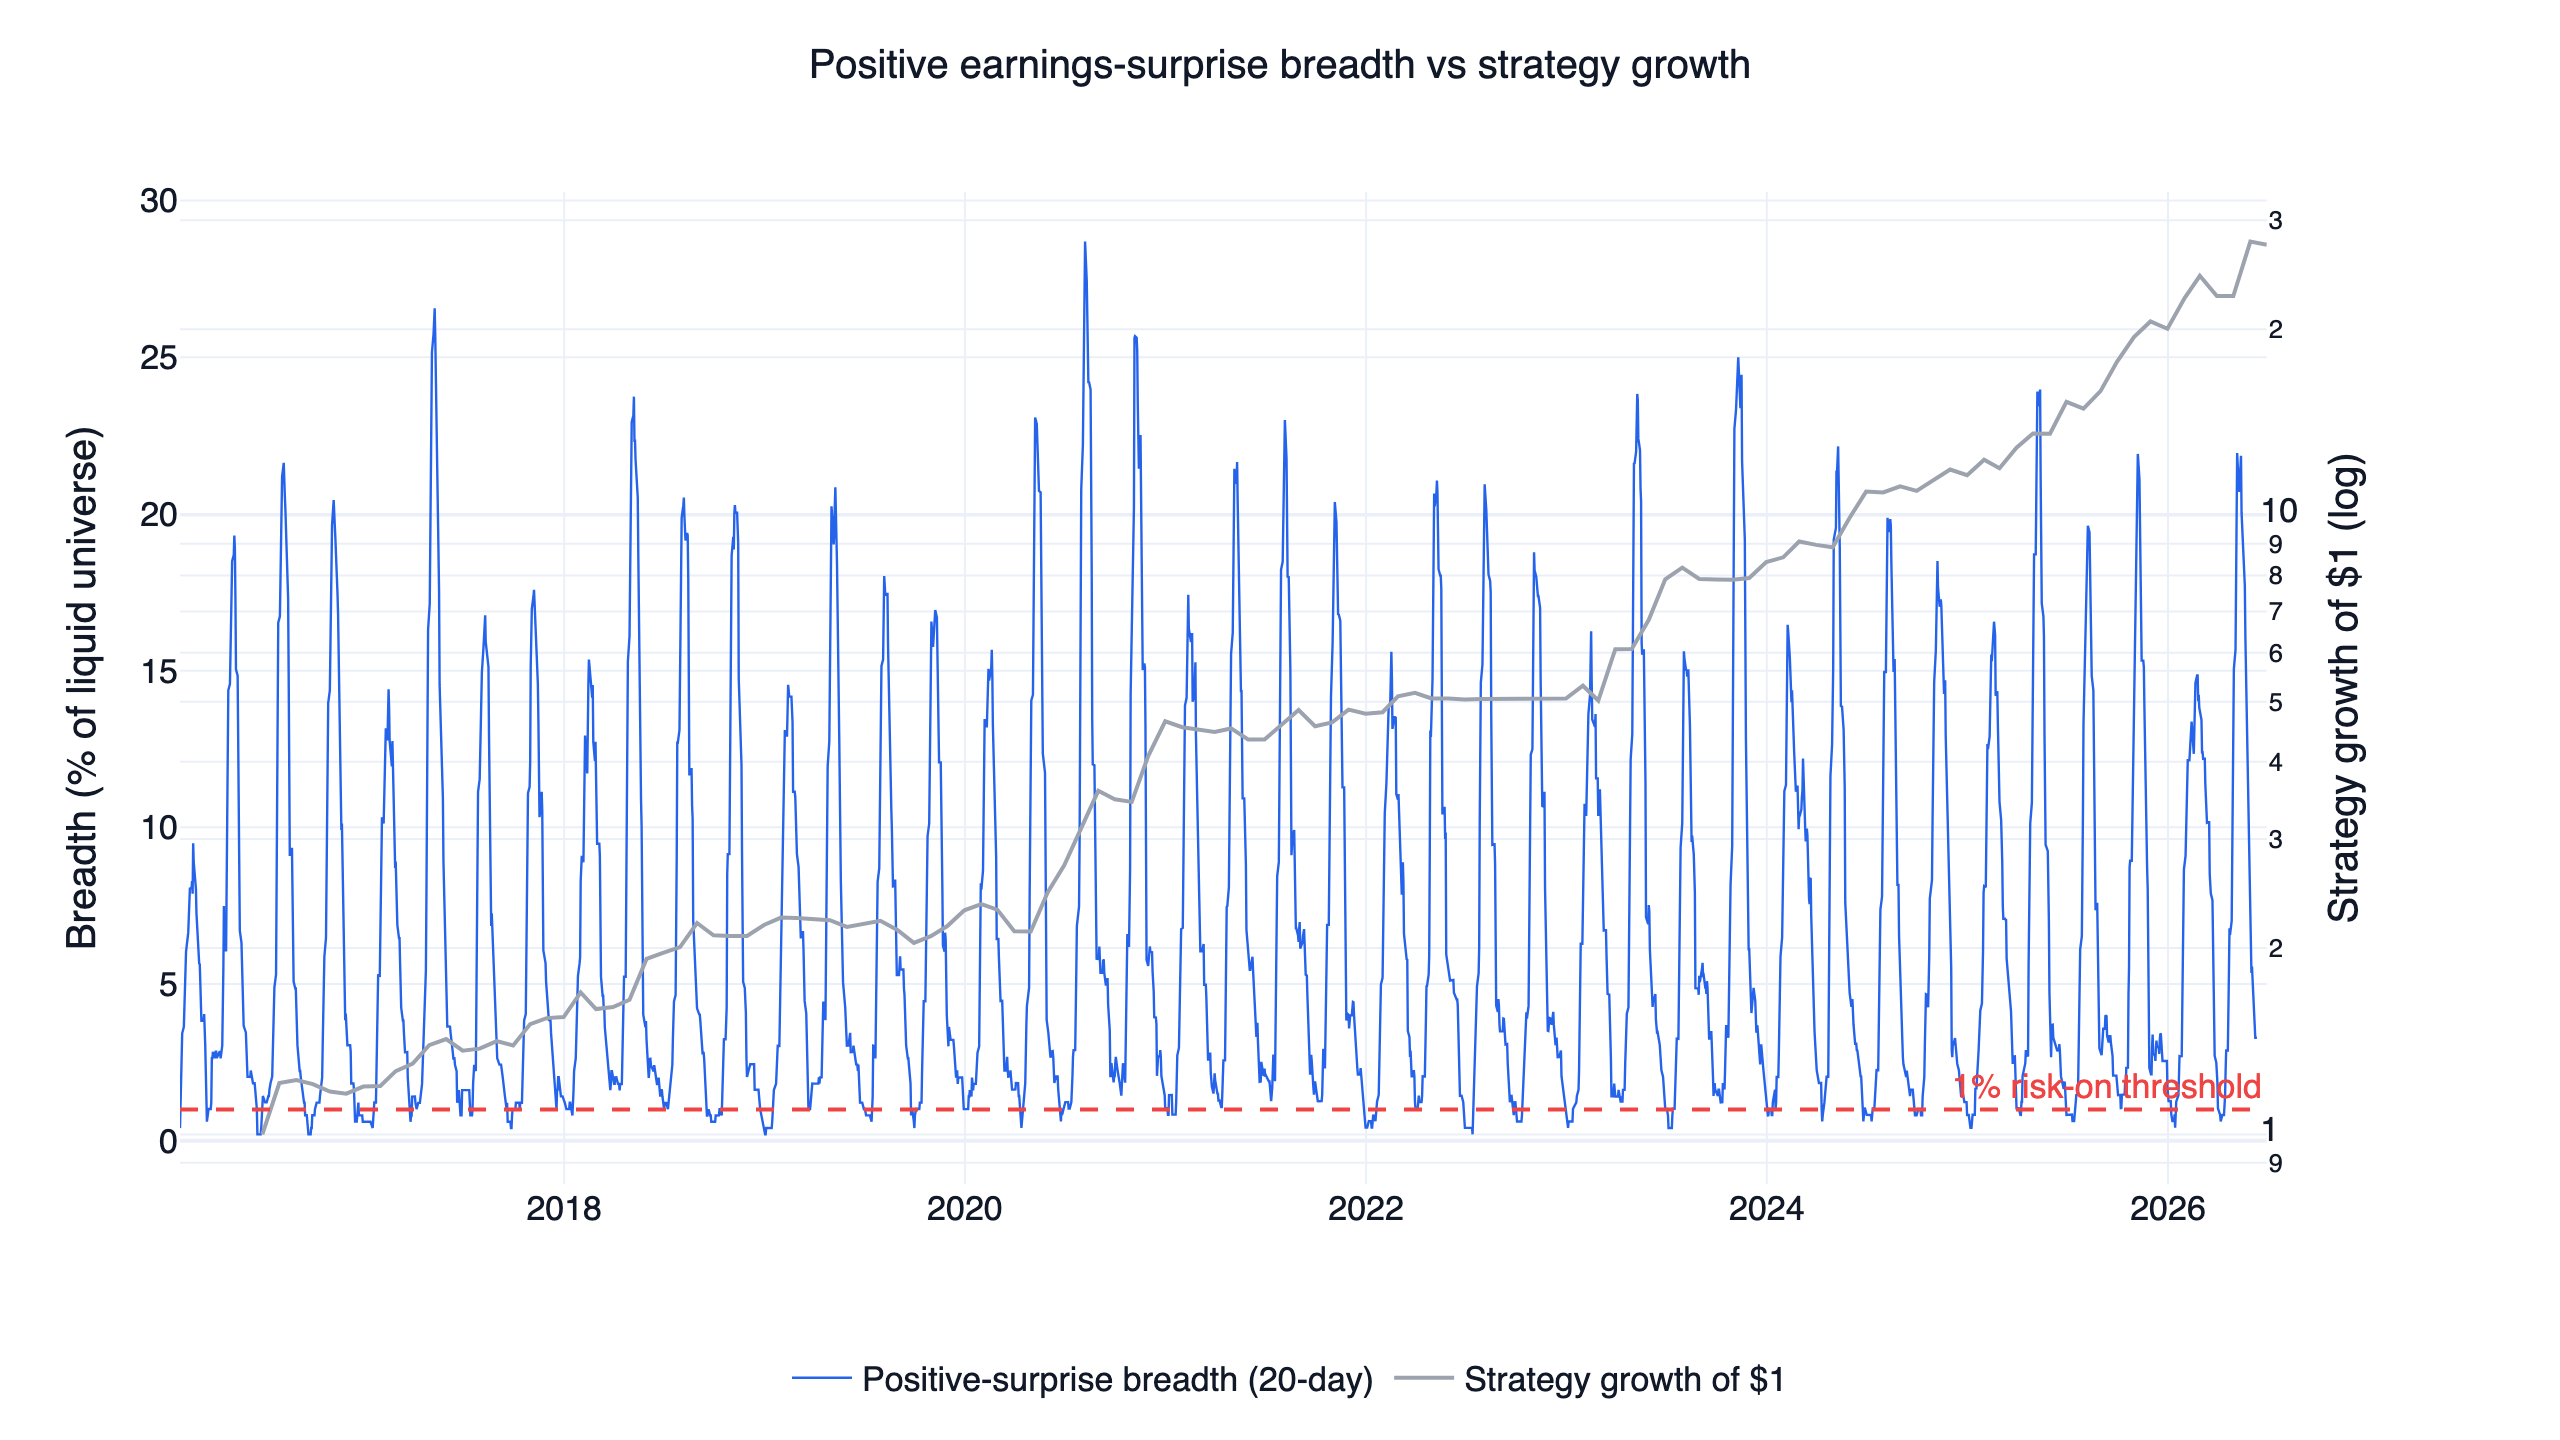
Breadth is strongly seasonal: it spikes to 20-29% of the universe in every quarterly earnings season and falls toward zero between seasons, averaging 7.0% across the sample. The risk-on threshold of 1% is therefore loose by design — it asks whether the most recent earnings season produced any meaningful cohort of well-received beats, and stays on through the quiet weeks that follow. Risk-on requires three conditions at once: breadth above 1%, QQQ above its 200-day average, and positive 6-month QQQ momentum. All three held on 64% of days; the QQQ trend conditions do most of the regime switching, with breadth ruling out the seasons where good earnings news disappeared.
One data caveat belongs here rather than in a footnote. Only companies with analyst estimates generate surprise events, so the factor's coverage of the universe averages 83% but dipped as low as 40% early in the sample. Breadth built on sparse coverage is noisier, which is one more reason the signal is used as a coarse on/off gate with a low threshold rather than a finely tuned dial.
Layer three: what the strategy actually holds
The execution engine is shared across the whole strategy family and is explained in full in the overview of all ten US systems; the short version is that risk-on buys the two leveraged growth ETFs (TQQQ and TECL, weighted by 126-day momentum), risk-off rotates to the strongest of IEF, GLD, or SHY by 3-month-minus-1-month momentum, rebalancing is monthly, and an 8% intramonth stop moves the book to cash when touched.
One mechanical detail changes how the results should be read: the book is usually a blend, never a clean all-in/all-out switch. The breadth signal lives on the stock-market calendar while the ETF sleeve trades on the fund calendar, and when the two sleeves overlap on a rebalance date the simulator normalizes the book. Over the full backtest the portfolio was a 50% defensive + 25% TQQQ + 25% TECL blend on 59% of days, fully defensive on 23%, in cash on 11% (after stops), and fully leveraged on only 7% of days. The average leveraged weight was 36% of the book — about 1.1x effective market exposure expressed through 3x funds — which is how a strategy holding TQQQ can keep its worst drawdown near -21%.
The data behind it
Everything runs on FinLab's US datasets, and the readable core of the strategy fits in one block. The universe mask implements the liquidity filters described above; the full position construction and sim() call are in the downloadable script.
Show Code
import finlab
from finlab import data

finlab.login()  # finlab opens a login prompt automatically

# Single-stock market: prices, volume, and the earnings-surprise events
data.set_market("us")
close = data.get("us_price:adj_close")
volume = data.get("us_price:volume")
eps_actual = data.get("us_earnings_surprises:eps_actual")
eps_estimated = data.get("us_earnings_surprises:eps_estimated")

# ETF market: what the strategy actually holds
fund_close = data.get("us_fund_price:adj_close")[["QQQ", "TQQQ", "TECL", "IEF", "GLD", "SHY"]]

# 1. Earnings surprise in % of the estimate (values exist only on report days)
surprise = (eps_actual - eps_estimated) / eps_estimated.abs()

# 2. Breadth: share of the liquid universe with a >5% beat and a positive
#    same-day reaction over the trailing 20 trading days
reaction = close / close.shift(1) - 1
positive_events = universe & (surprise > 0.05) & (reaction > 0)
event_count = positive_events.rolling(20, min_periods=1).sum().sum(axis=1)
breadth = event_count / universe.sum(axis=1)

# 3. Risk-on when surprise breadth and the QQQ trend agree
qqq_trend = fund_close["QQQ"] > fund_close["QQQ"].rolling(200, min_periods=100).mean()
qqq_momentum = fund_close["QQQ"] / fund_close["QQQ"].shift(126) - 1
risk_on = (breadth > 0.01) & (qqq_trend & (qqq_momentum > 0)).reindex(breadth.index)

# 4. Risk-on: TQQQ + TECL; risk-off: strongest of IEF / GLD / SHY
#    (position construction and sim() are in the downloadable strategy.py)
us_price:adj_close is dividend- and split-adjusted, so reactions and benchmarks are not distorted by corporate actions, and the leveraged ETF series already embed each fund's daily-reset behavior and expense ratio.
Results and the out-of-sample test
Here is the interactive finlab report — drawdowns, monthly returns, and the trade list — so you can inspect the result directly rather than trust a summary:
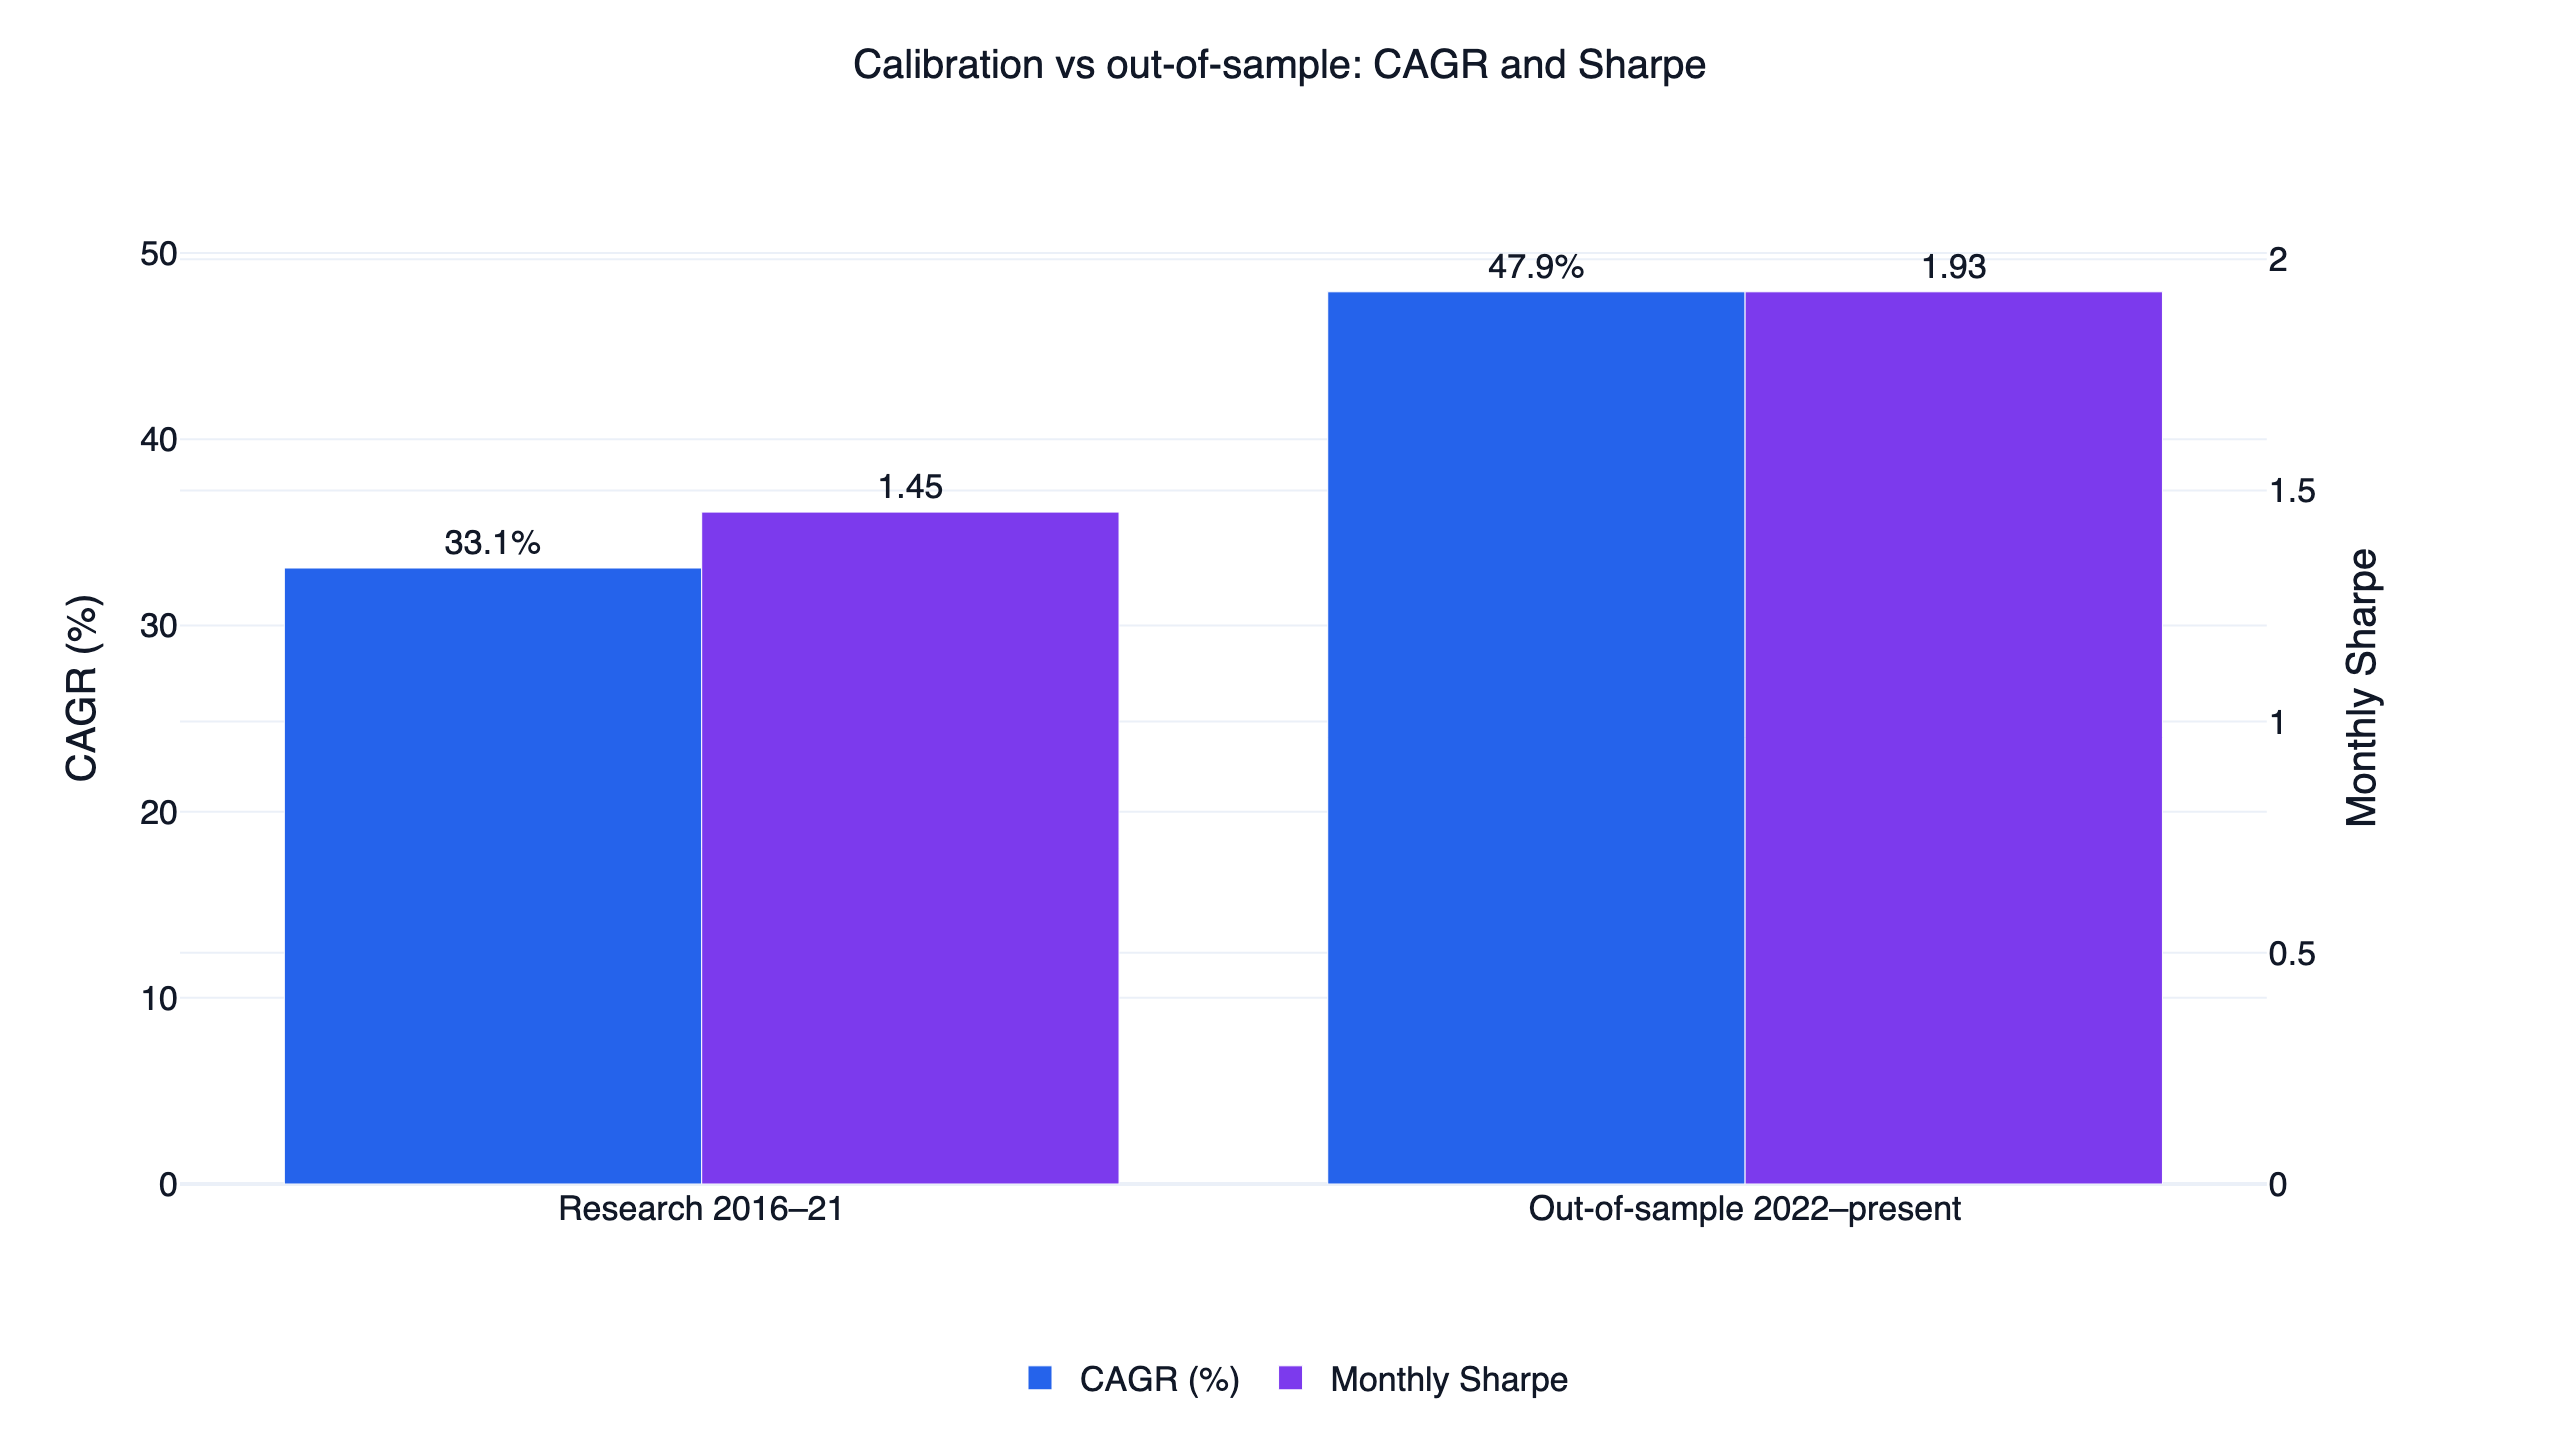
The parameters were chosen on 2016-2021 data and left untouched on 2022-present, an unseen stretch that includes the 2022 bear market.
| Period | Strategy CAGR | Strategy Sharpe | Strategy max DD | QQQ CAGR | QQQ Sharpe |
|---|---|---|---|---|---|
| Research (2016-2021) | 33.1% | 1.45 | -21.1% | 24.0% | 1.47 |
| Out-of-sample (2022-present) | 47.9% | 1.93 | -13.9% | 14.1% | 0.84 |
The split deserves a careful reading. In the research window the strategy's monthly Sharpe of 1.45 was actually a hair below QQQ's 1.47 over the same years — in the long 2016-2021 bull market, a regime-gated strategy had little to add over simply holding the index. The advantage is concentrated in the out-of-sample period, where the gate sidestepped most of 2022 (a -13.9% drawdown against QQQ's -35.2%) and the Sharpe gap widened to 1.93 versus 0.84. SPY shows the same pattern (1.12 in-sample, 0.78 out-of-sample). Performance improving on unseen data is a genuine point in the strategy's favor, but it is one market cycle, dominated by one bear market the gate happened to handle well.
Backtest method and limits
| Item | This backtest |
|---|---|
| Transaction costs | Not modeled — sim() runs with zero fees and taxes. Monthly ETF rebalancing keeps the impact modest, but live results would be lower. |
| Slippage | Not modeled. |
| Leverage decay | Already reflected — TQQQ/TECL price series include daily-reset drag and expense ratios. |
| Universe / point-in-time | Top 500 by 60-day dollar volume, price > 8M dollar-volume floor, extreme-move exclusion; each date uses only then-available data; surprises exist only on announcement dates. |
| Data coverage | Fresh-surprise coverage averages 83% of the universe but fell to 40% early in the sample; breadth is noisier where coverage is thin. |
| Turnover | About 4.1x per year, 235 trades over the decade. |
| Position rule | Blended book as described above; 8% touched stop (in cash ~11% of days). |
| Sample | 2016-2021 calibration; 2022-present out-of-sample. |
| Capacity | Not estimated. Leveraged ETF liquidity is large, but real impact depends on your size. |
The gate this strategy is judged against is a risk-adjusted ratio of at least 1.5. It clears it on the full-period monthly Sharpe alone (1.57), and again on the out-of-sample monthly Sharpe (1.93). The monthly Sortino figures (5.05 full period, 6.15 out-of-sample) also clear it, but they are inflated by how few negative months a monthly-sampled, regime-gated curve produces, so Sharpe is the number to anchor on.
The leveraged-ETF risk you must understand
The leverage, not the earnings data, is the main thing that can hurt you here:
- Daily reset and path dependency. A 3x daily ETF compounds daily, so a choppy, sideways market erodes value even if the index ends flat. The naive TQQQ row in the first table (-81.8% drawdown) is what unmanaged 3x exposure looks like.
- Gaps can beat stops. The 8% stop is a touched level in the backtest; a large overnight gap can fill worse in live trading.
- Monthly switching is not crash protection. A fast crash inside a month is taken at whatever leverage the book holds until the stop or the next rebalance.
- The signal itself is sparse and seasonal. Breadth depends on analyst coverage and goes quiet between earnings seasons; the strategy's own max drawdown was -21.1% with the gate working as designed.
- Concentration. The leveraged sleeve is two funds on one theme (large-cap US growth).
Who this is for
It fits an investor who wants a rules-based, fundamentals-confirmed US strategy, understands leveraged ETFs, and can tolerate 20%+ drawdowns in exchange for higher compounding. It does not fit anyone who needs capital stability, wants to trade individual earnings announcements (layer one shows how little that paid in large caps), or is uncomfortable holding 3x products at any time.
FAQ
Does post-earnings announcement drift still work in US stocks? In liquid large caps over 2016-2026, only weakly at the single-stock level: a +2.75% annualized long-short return and a 0.012 rank IC. The miss side is stronger than the beat side (-1.63% vs +0.34% over 60 days), so the cleanest single-name use of the data is avoiding disappointments. The aggregate breadth of well-received beats remains informative as a market regime signal.
What counts as an earnings surprise in this earnings surprise trading strategy backtest?
Actual EPS minus the analyst consensus estimate, divided by the absolute value of the estimate, from FinLab's us_earnings_surprises dataset. A "strong beat" for the breadth signal means a surprise above 5% with a positive same-day price reaction.
Why not just buy the stocks that beat estimates? The unlevered top-decile basket grew 3.5 over the decade while QQQ grew it to about $7. The selection edge over the equal-weight universe is real but too small to beat an index fund, which is why the strategy uses surprises as a regime gate instead.
Isn't 39.5% CAGR too good to be true? It comes with zero modeled costs, a -21.1% drawdown, 20.5% volatility, and 3x-ETF exposure, and the research-window Sharpe (1.45) did not beat QQQ's (1.47) — the edge is concentrated in the 2022+ out-of-sample window and in drawdown control. The naive TQQQ comparison (40.4% CAGR, -81.8% drawdown) shows the raw return was always available; the strategy's contribution is risk management.
How often does it trade? Monthly rebalancing with an 8% intramonth stop; turnover is about 4.1x per year, 235 trades across the decade.
What data do I need?
FinLab's us_earnings_surprises:* and us_price:* for the signal, and us_fund_price:* for the ETFs. All are in a standard FinLab account.
Reproduce it yourself
Two files reproduce everything above:
- strategy.py — the full strategy, ready to run after the AI-assisted setup flow.
- data.csv — daily equity curves for the strategy, QQQ, and SPY.
The fastest path is to use the AI-assisted setup flow and ask your AI agent to run and modify it — tighten the breadth threshold, swap the leveraged ETFs for unlevered ones, or rebuild the event study on a different universe. To see how this system compares with nine related ones, read the US quant trading strategies overview, and for the strongest stock-level factor on the same universe, the US momentum strategy. For related research, see the FinLab research blog, the AI quant research workflow, the AI-built PEG value strategy, the new-high momentum study, the institutional-flow strategy, and the cash-flow quality strategy. Metric definitions are in the glossary; to see what teams build with finlab, browse the use cases and the team behind FinLab.
Last updated: 2026-06 | Backtest window: 2016-06 to 2026-06 | Benchmark: QQQ total return | Author: FinLab Quant Research (reviewed by a quantitative researcher)
Investing involves risk, and past performance does not represent future results. Leveraged ETFs carry additional risks including volatility decay and amplified losses. This content is for educational purposes only and is not investment advice and does not constitute investment advice; evaluate any strategy against your own risk tolerance.
FinLab AI
Want to build your own strategy?
Describe your stock-picking ideas in natural language. AI automatically validates, backtests, and gives you answers
Start Free