Quality and value screens are the most widely repeated advice in fundamental investing, and the least tested. This is a quality value investing strategy backtest that puts three US fundamental composites through the same examination: a quality-growth screen, a value-plus-quality screen, and a free-cash-flow / balance-sheet strength screen, each validated at the stock level (decile sorts, rank ICs, long-short spreads) and then run as a tradable strategy on identical execution. Comparing them side by side is the point: where they agree, where they diverge, and where the returns actually come from.
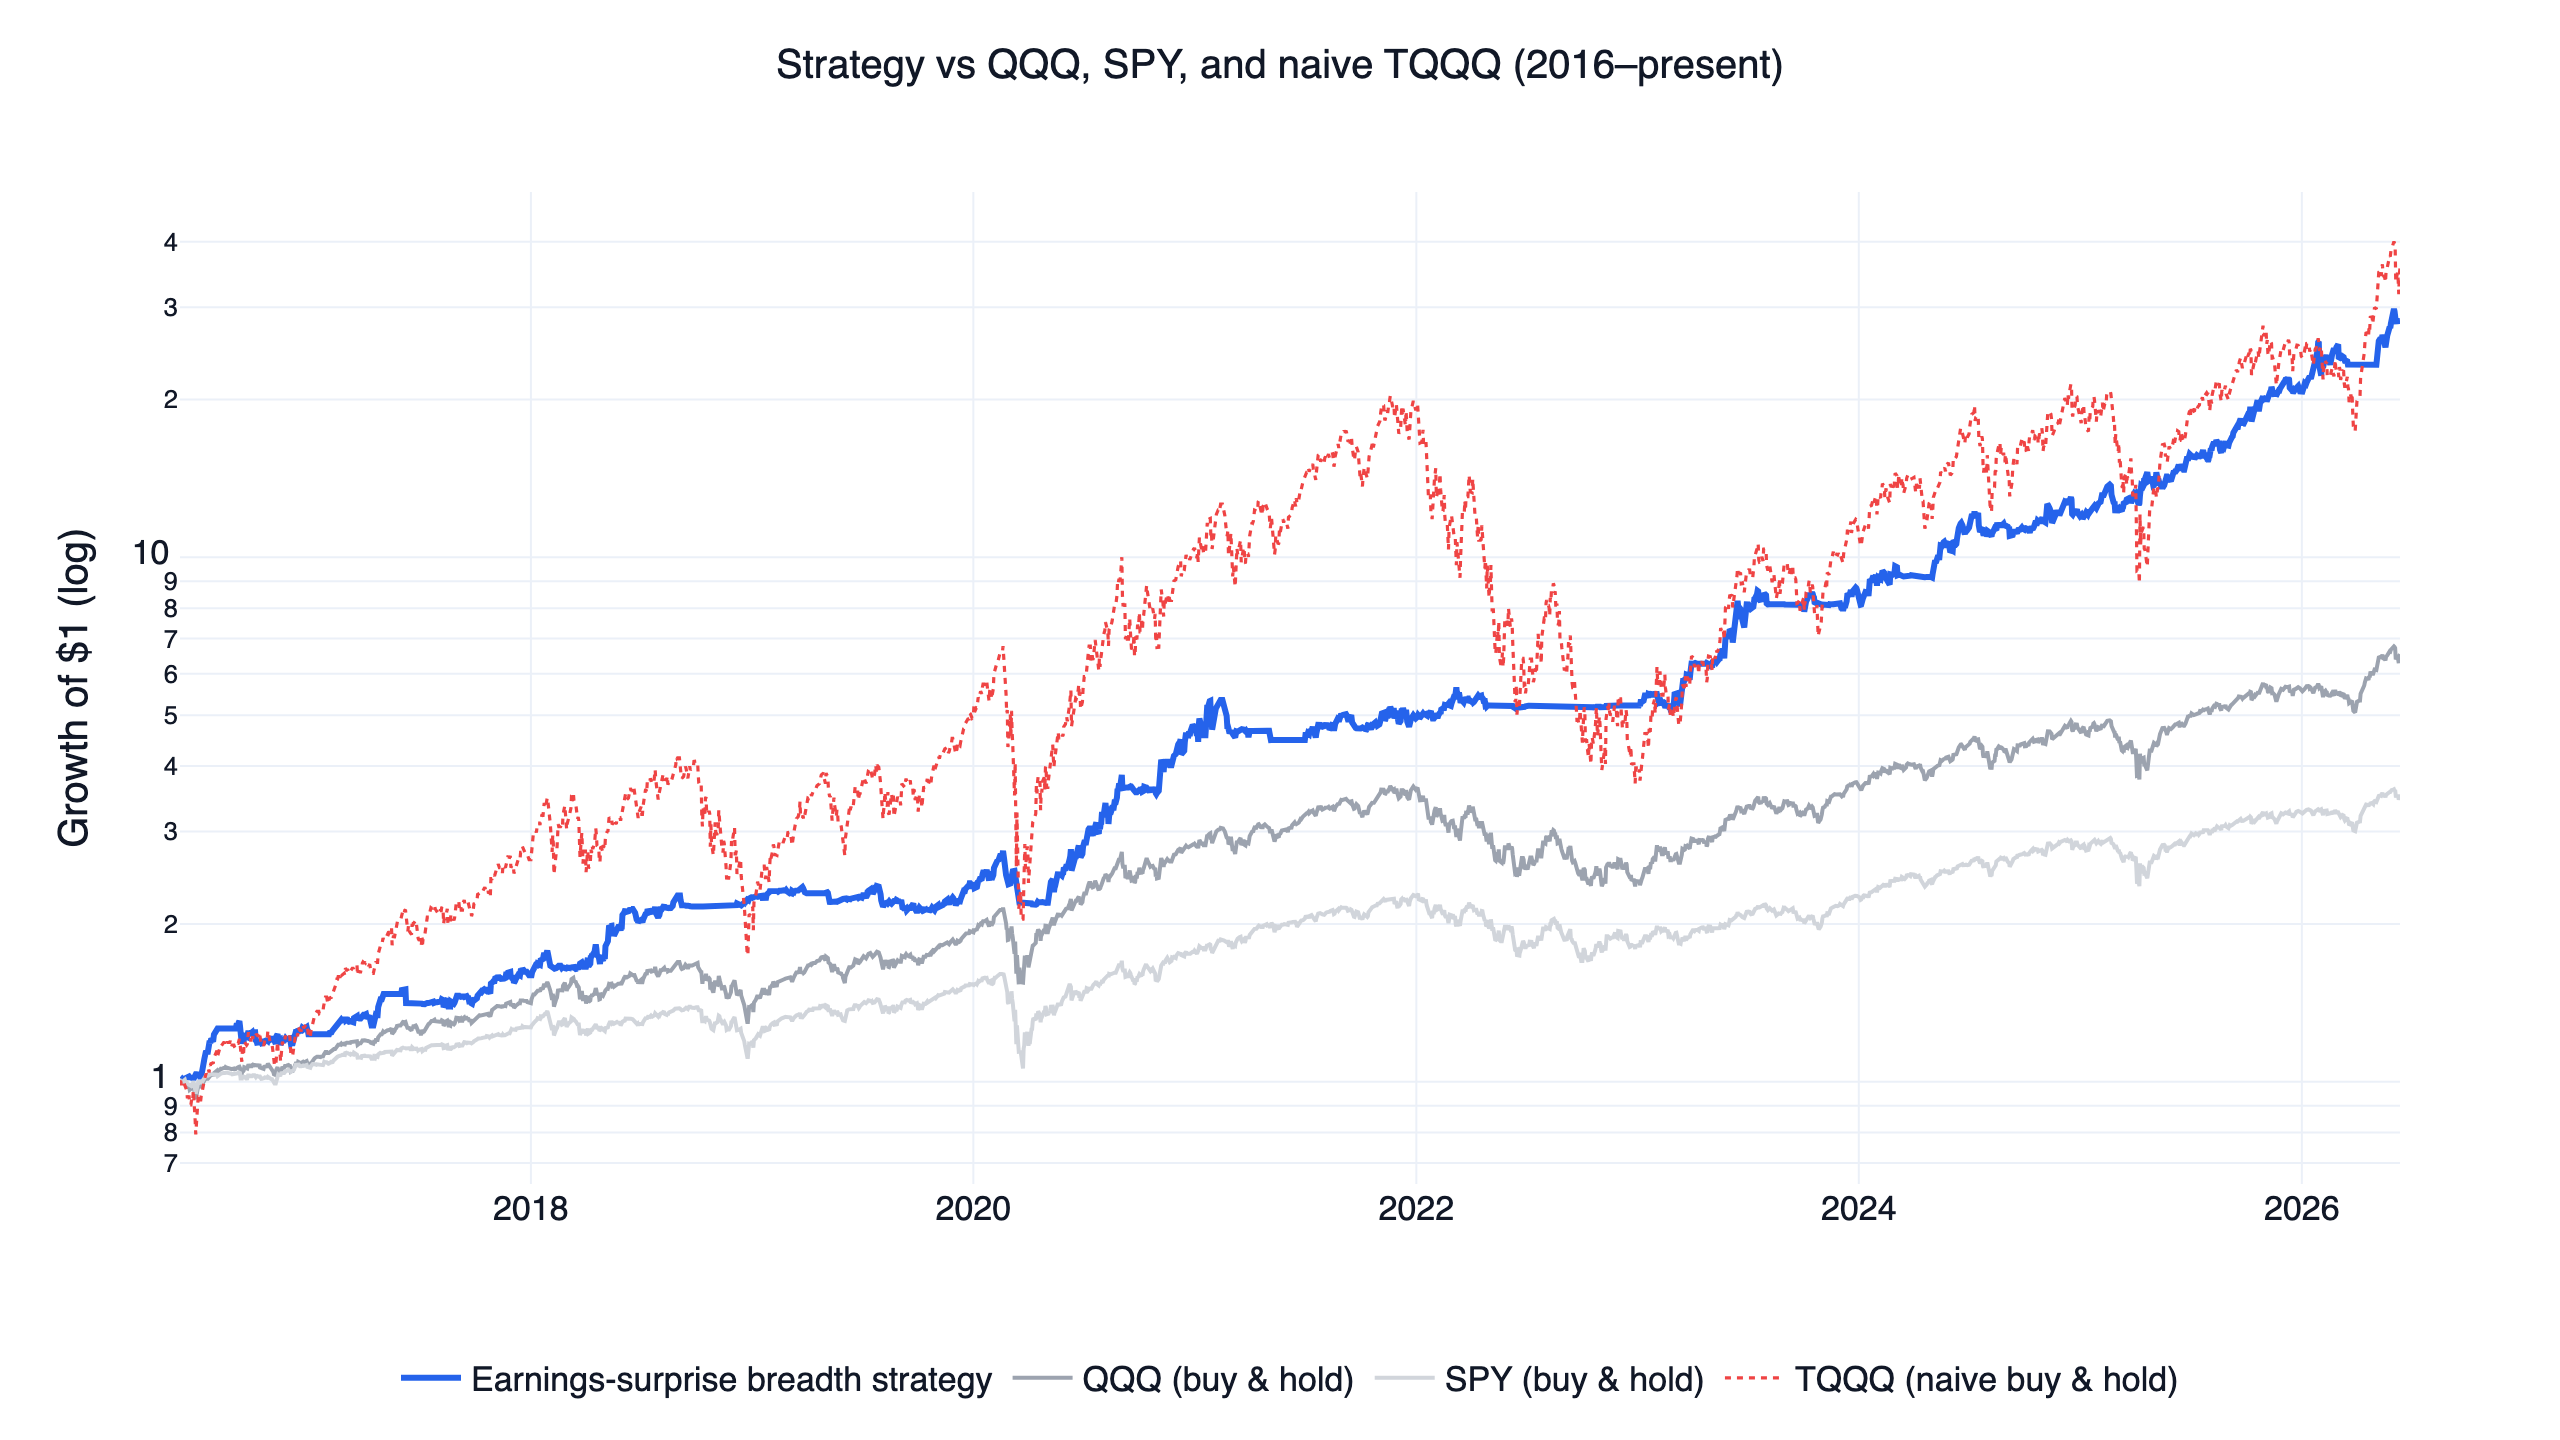
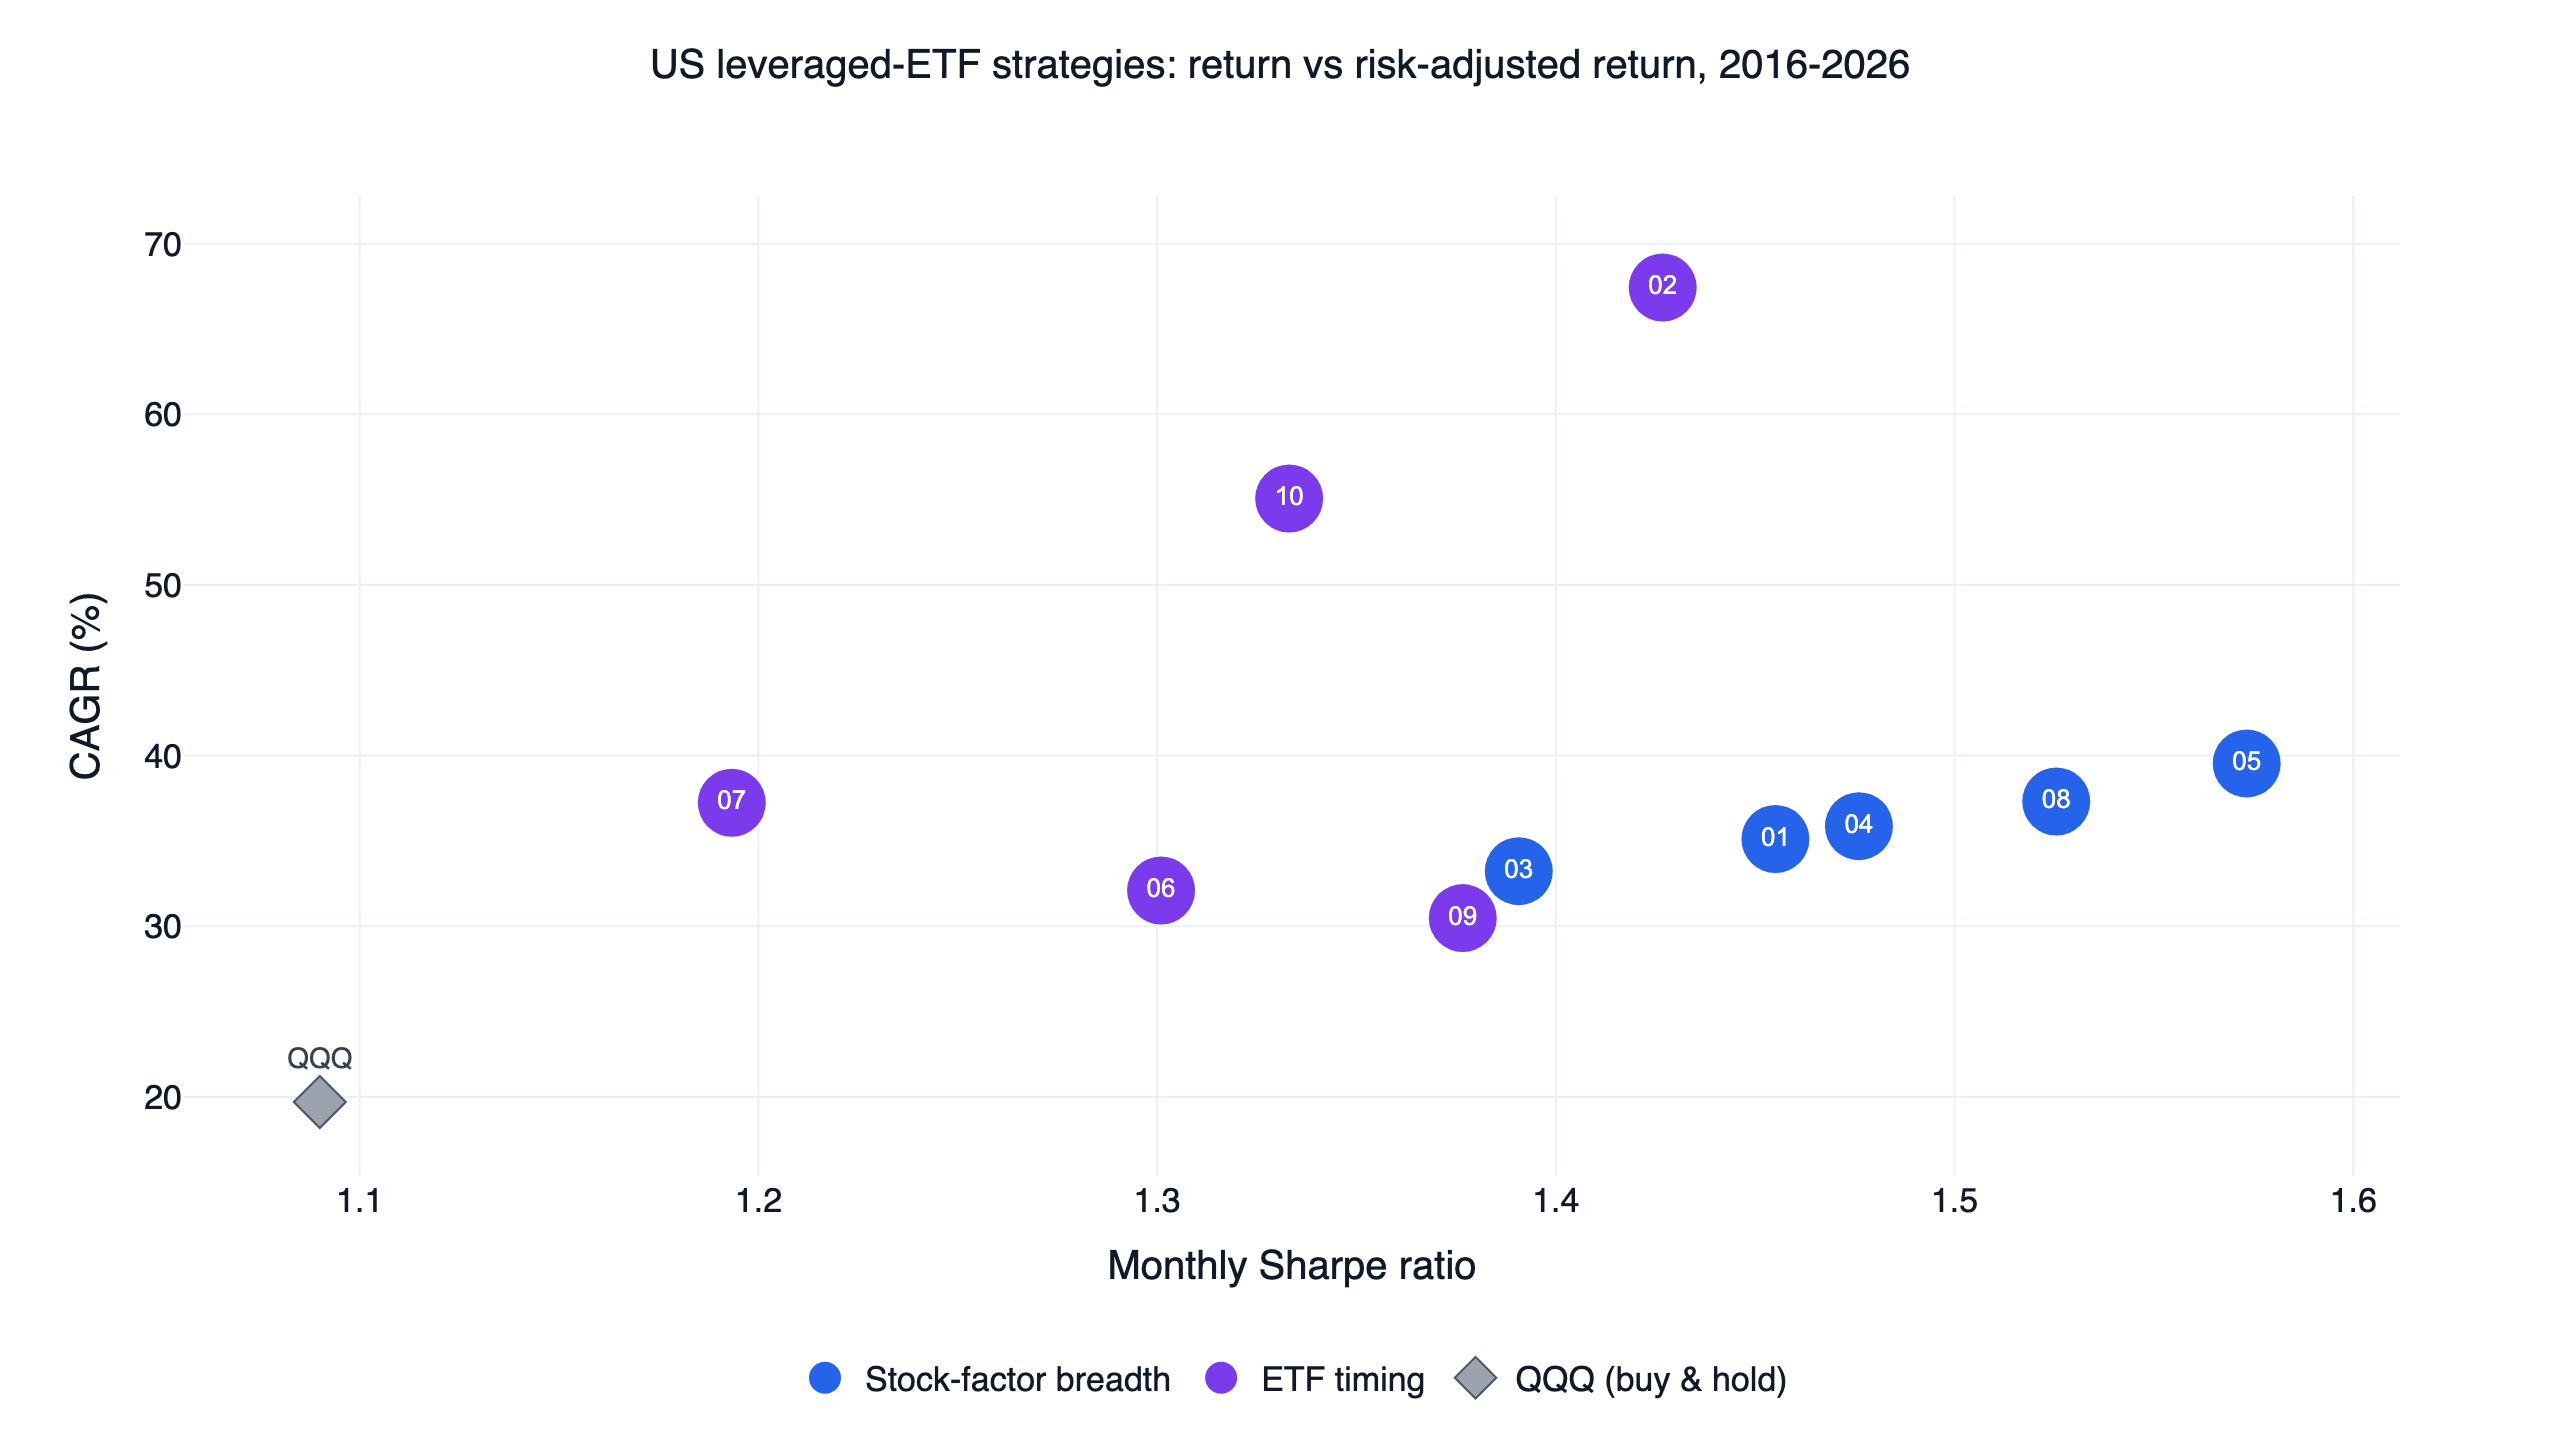
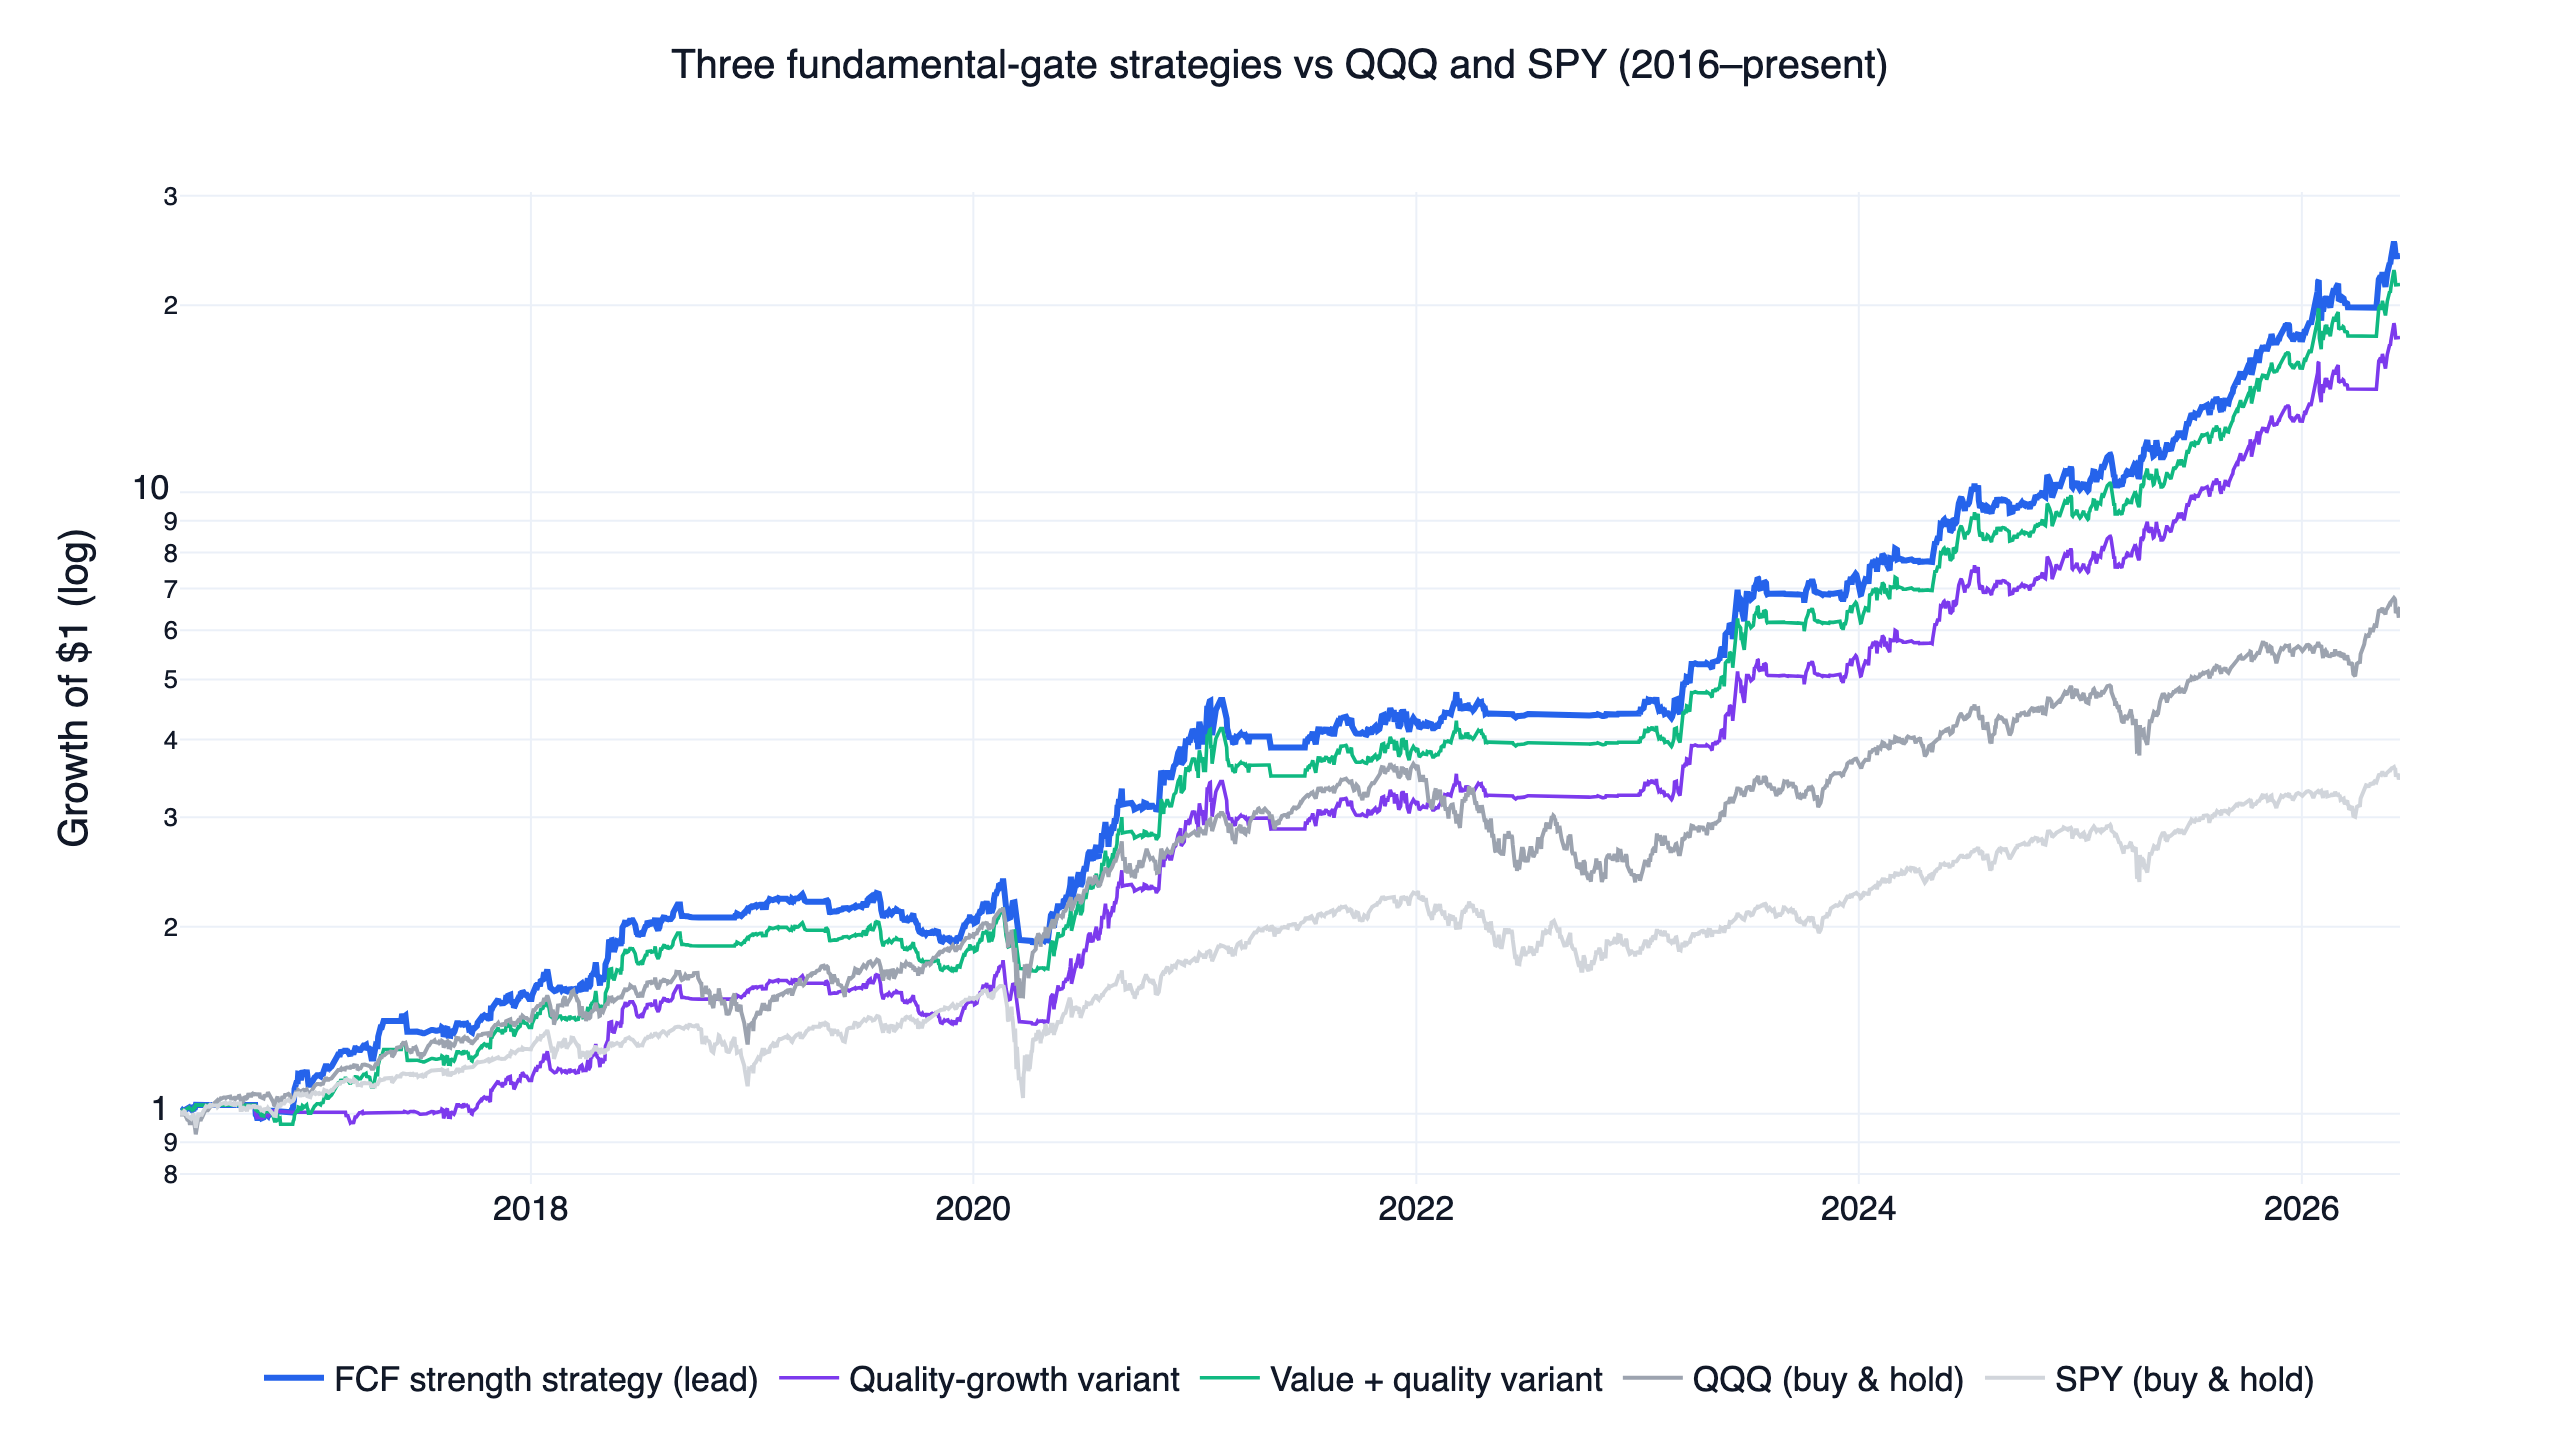
The lead strategy, built on free cash flow strength, compounded at 37.3% CAGR with a 1.53 monthly Sharpe and a -21.1% maximum drawdown from June 2016 to June 2026, versus 20.6% / 1.11 / -35.6% for buying and holding the Nasdaq-100 (QQQ). One finding changes how you should read that headline: over this period, these fundamentals were weak at picking individual winners. Their measurable power was as market breadth gates that time leveraged-ETF exposure. The evidence for both halves of that claim is below. These three systems share one execution engine with seven sibling strategies; the US quant trading strategies overview explains that shared engine in full and compares all ten.
The numbers at a glance
Full period, June 2016 to June 2026. Benchmarks use total-return (dividend-adjusted) prices over the identical window.
| Metric | FCF strength (lead) | Value + quality | Quality growth | QQQ (buy & hold) | SPY (buy & hold) |
|---|---|---|---|---|---|
| CAGR | 37.3% | 35.9% | 33.2% | 20.6% | 13.4% |
| Monthly Sharpe | 1.53 | 1.48 | 1.39 | 1.11 | 0.90 |
| Monthly Sortino | 4.79 | 4.64 | 4.36 | 1.75 | 1.27 |
| Max drawdown | -21.1% | -21.1% | -21.1% | -35.6% | -34.1% |
| Annualized volatility | 20.3% | 20.2% | 19.9% | 21.5% | 17.3% |
| Growth of $1 | $24.0 | $21.6 | $17.7 | $6.5 | $3.5 |
Two patterns in this table preview the whole study. The three strategies share an identical -21.1% maximum drawdown because they hold the same leveraged ETFs under the same 8% stop; the drawdown is a property of the execution engine. And the spread between the best and worst variant is modest (37.3% vs 33.2% CAGR), which turns out to be explained almost entirely by the first half of the sample.
Three definitions of "quality" and "value"
Each variant screens the same liquid universe, the top 500 US stocks by 60-day average dollar volume (price above 10M, point-in-time membership). Fundamentals are quarterly and aligned to SEC filing dates, with trailing-twelve-month (TTM) values built from rolling four quarters.
| Variant | Entry filter (all conditions must hold) | Breadth threshold |
|---|---|---|
| Quality growth | TTM EPS > 0; revenue growth > 8% YoY; EPS growth > 0; gross margin expanding YoY; positive 6-month price momentum | 1% |
| Value + quality | Positive earnings yield; ROE > 10%; debt/equity < 1.5; 6-month momentum > -10% | 5% |
| FCF / balance-sheet strength (lead) | TTM free cash flow > 0; FCF margin > 5%; debt/equity < 1.2; price above 200-day moving average | 5% |
Each filter has an academic lineage. The quality-growth screen leans on the gross profitability premium documented by Novy-Marx (2013), who showed that profitable firms earn higher returns than unprofitable ones despite richer valuations. The value-plus-quality combination follows the logic of Piotroski (2000), whose F-score filtered cheap stocks by fundamental health to separate recovering firms from value traps, and of Fama & French (2015), whose five-factor model added profitability and investment to size and value. The free-cash-flow screen rests on Sloan (1996), who showed that earnings backed by cash flow are more persistent than earnings built on accruals, which is the case for preferring FCF margin over reported EPS as a quality measure.
The literature establishes the anomalies. Whether these specific screens picked winning US stocks over 2016-2026 is an empirical question, and the answer is less flattering than the strategy curves suggest.
Copy this prompt to your AI agent
FinLab's setup path is now one prompt. Paste it into Codex app or Claude cowork, and the AI will read https://finlab.finance/en/setup, install the FinLab skill when needed, then run or modify the strategy in this article.
Show Code
Help me set up FinLab and build a quality-value strategy: https://finlab.finance/en/setupThe setup page is https://finlab.finance/en/setup.
Stock-level test: do these fundamentals pick winners?
The first layer of validation sorts the universe into deciles by each composite score and measures the next month's average return. If a factor selects stocks, returns should rise from D1 (weakest fundamentals) to D10 (strongest).
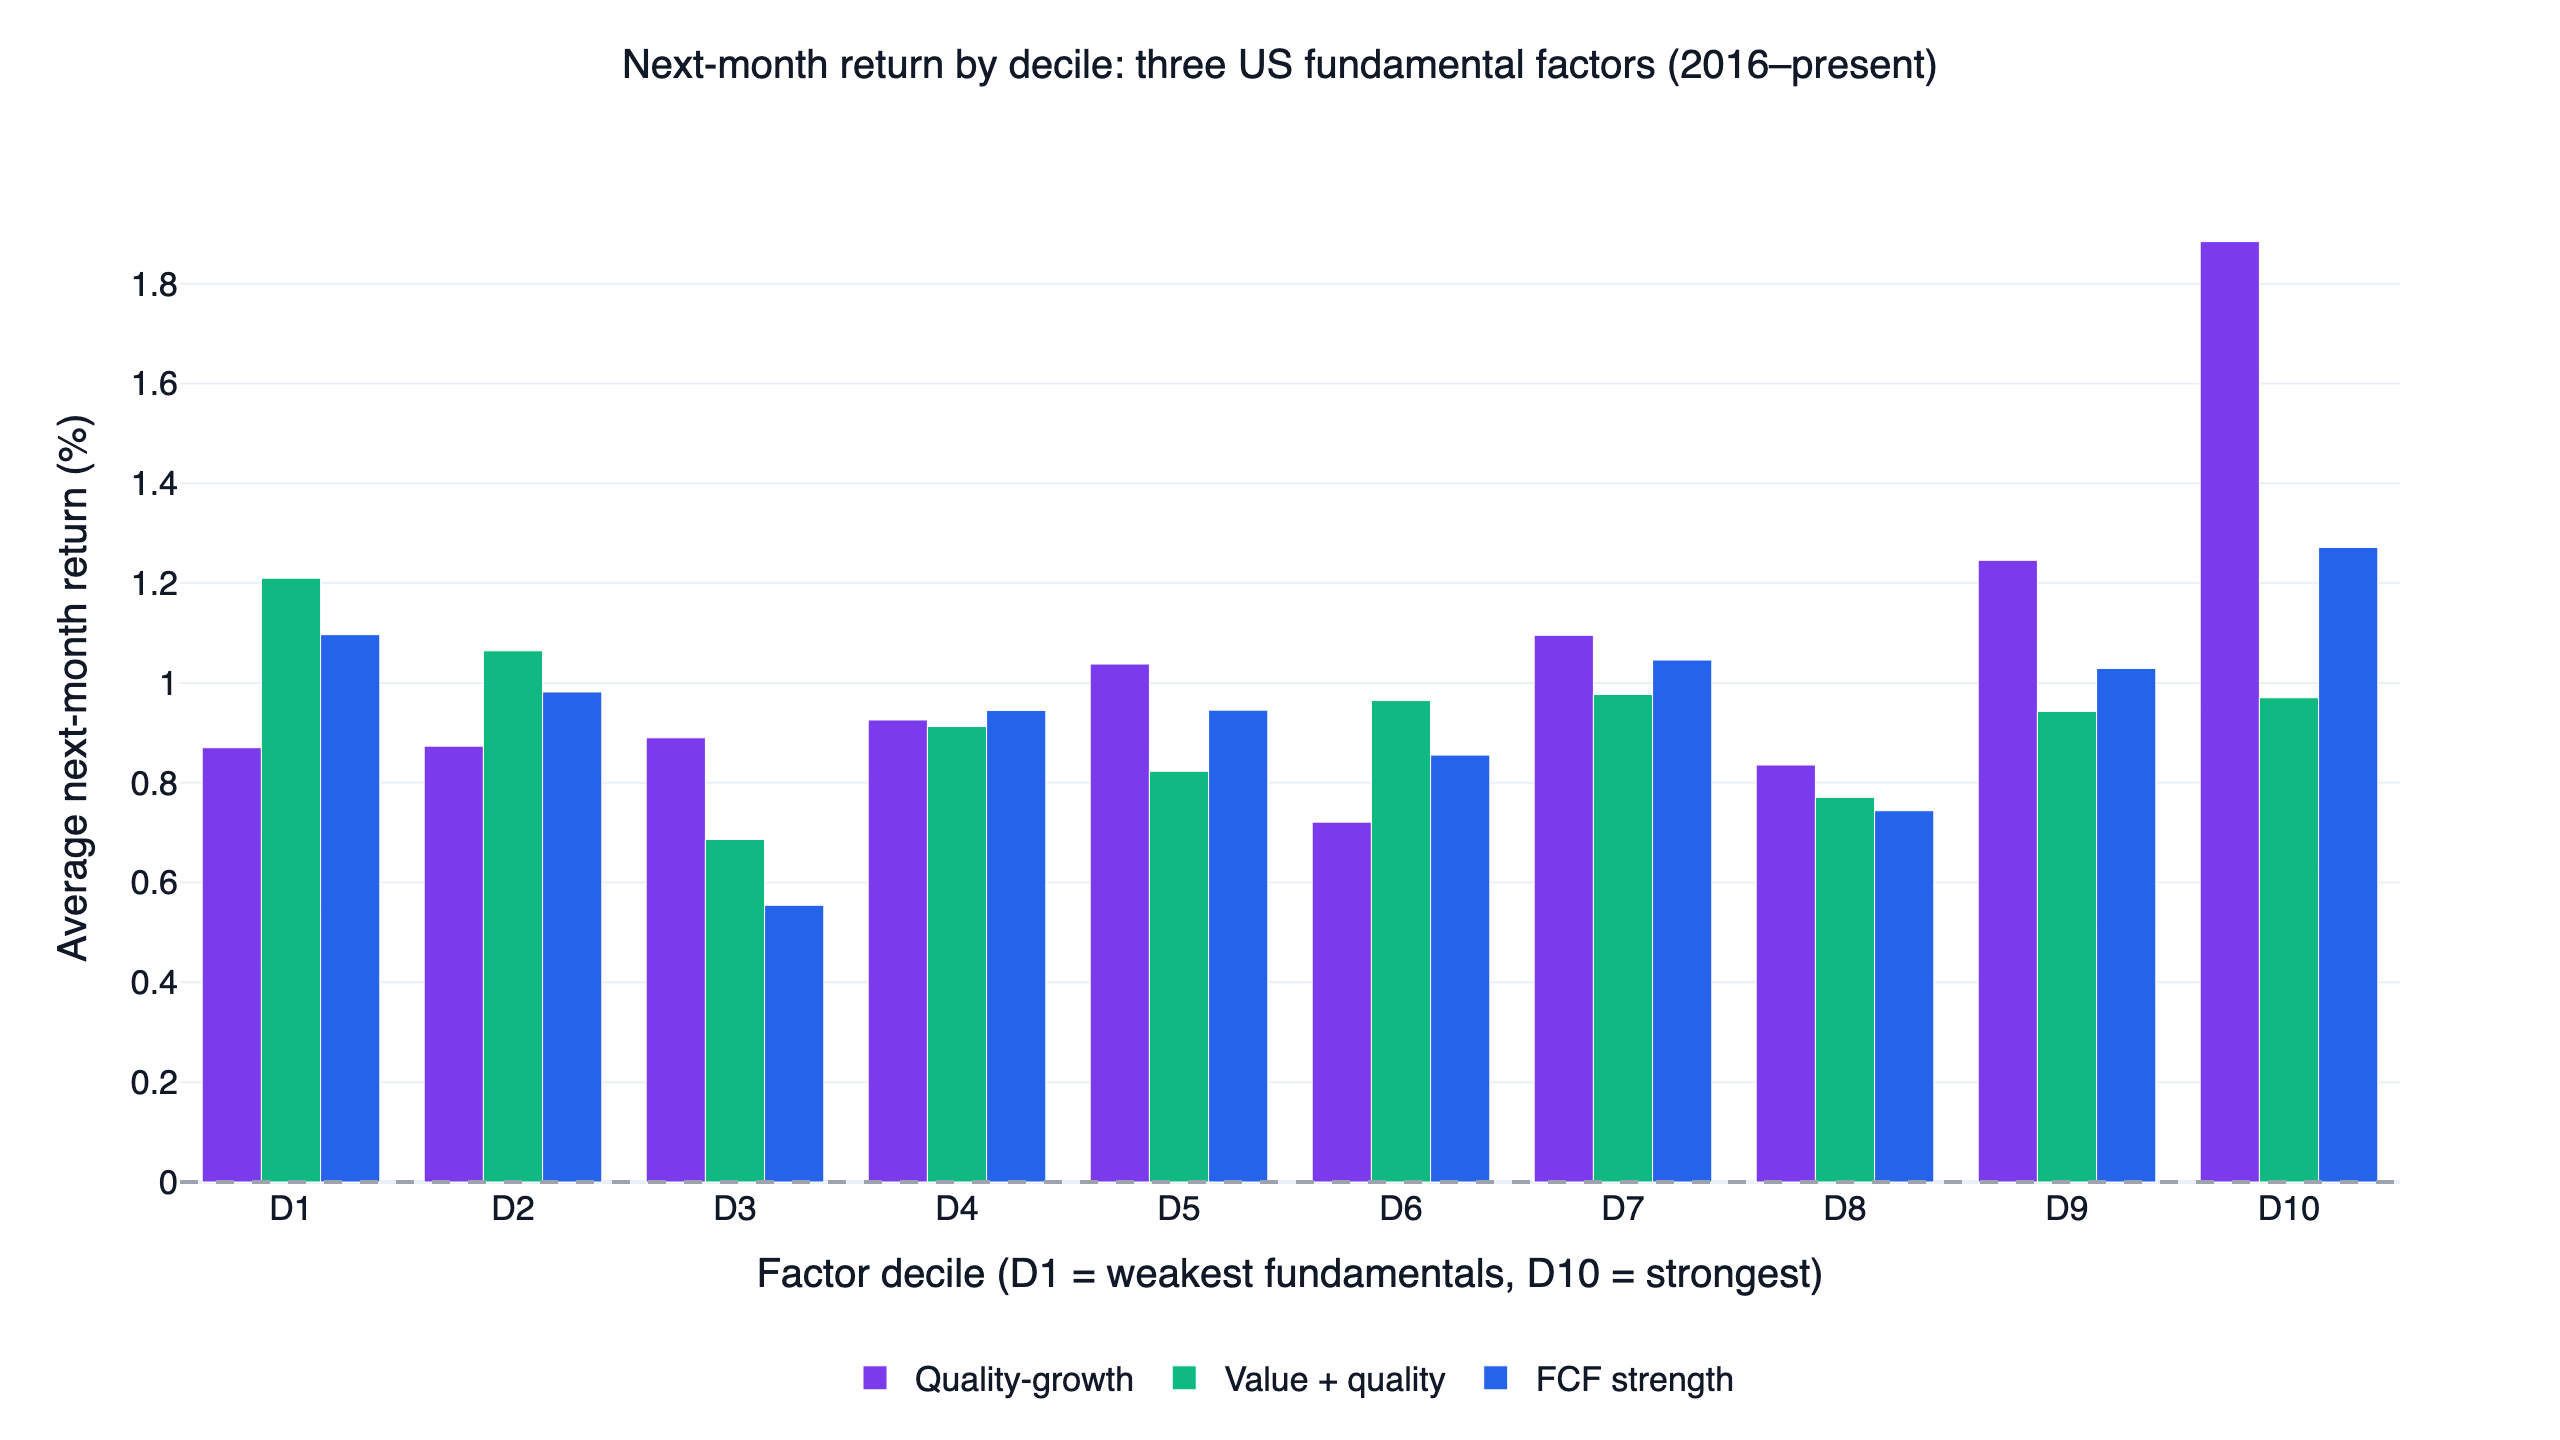
| Variant | D1 (weakest) | D10 (strongest) | Long-short spread (annualized) | Top decile beat universe |
|---|---|---|---|---|
| Quality growth | 0.87%/mo | 1.88%/mo | +12.2%/yr | 59.8% of months |
| Value + quality | 1.21%/mo | 0.97%/mo | -2.9%/yr | 49.6% of months |
| FCF strength | 1.10%/mo | 1.27%/mo | +2.1%/yr | 56.3% of months |
Only quality growth behaves the way factor investing textbooks promise: a clean premium in the top decile and a long-short spread of about 12% per year with a 58.9% monthly hit rate. The value-plus-quality composite fails the test outright over this period. Its long-short spread is negative, and its weakest-fundamentals decile (D1, the names failing the ROE, leverage, and earnings-yield screens) earned the highest next-month return of any decile, 1.21% per month. Low-quality, beaten-down names rallied hardest in this growth-led decade. The FCF composite sits in between, with a small positive premium that would not survive much friction.
The rank information coefficient, the cross-sectional rank correlation between this month's factor value and next month's return, tells the same story with one number per factor: mean 1-month rank ICs of 0.010 (quality growth), 0.012 (value + quality), and 0.007 (FCF strength), with information ratios of only 0.08 to 0.10.
![]()
The rolling ICs are small, cyclical, and cross zero repeatedly, often turning negative exactly when QQQ rallies. For comparison, the 12-1 momentum factor tested the same way in the US momentum strategy study produced a mean IC of 0.023 with a far stronger top-decile separation. As cross-sectional stock pickers over 2016-2026, these fundamental composites were weak.
The unlevered portfolio test makes it concrete. Holding each factor's top decile equal-weight, rebalanced monthly, with no leverage and no timing:
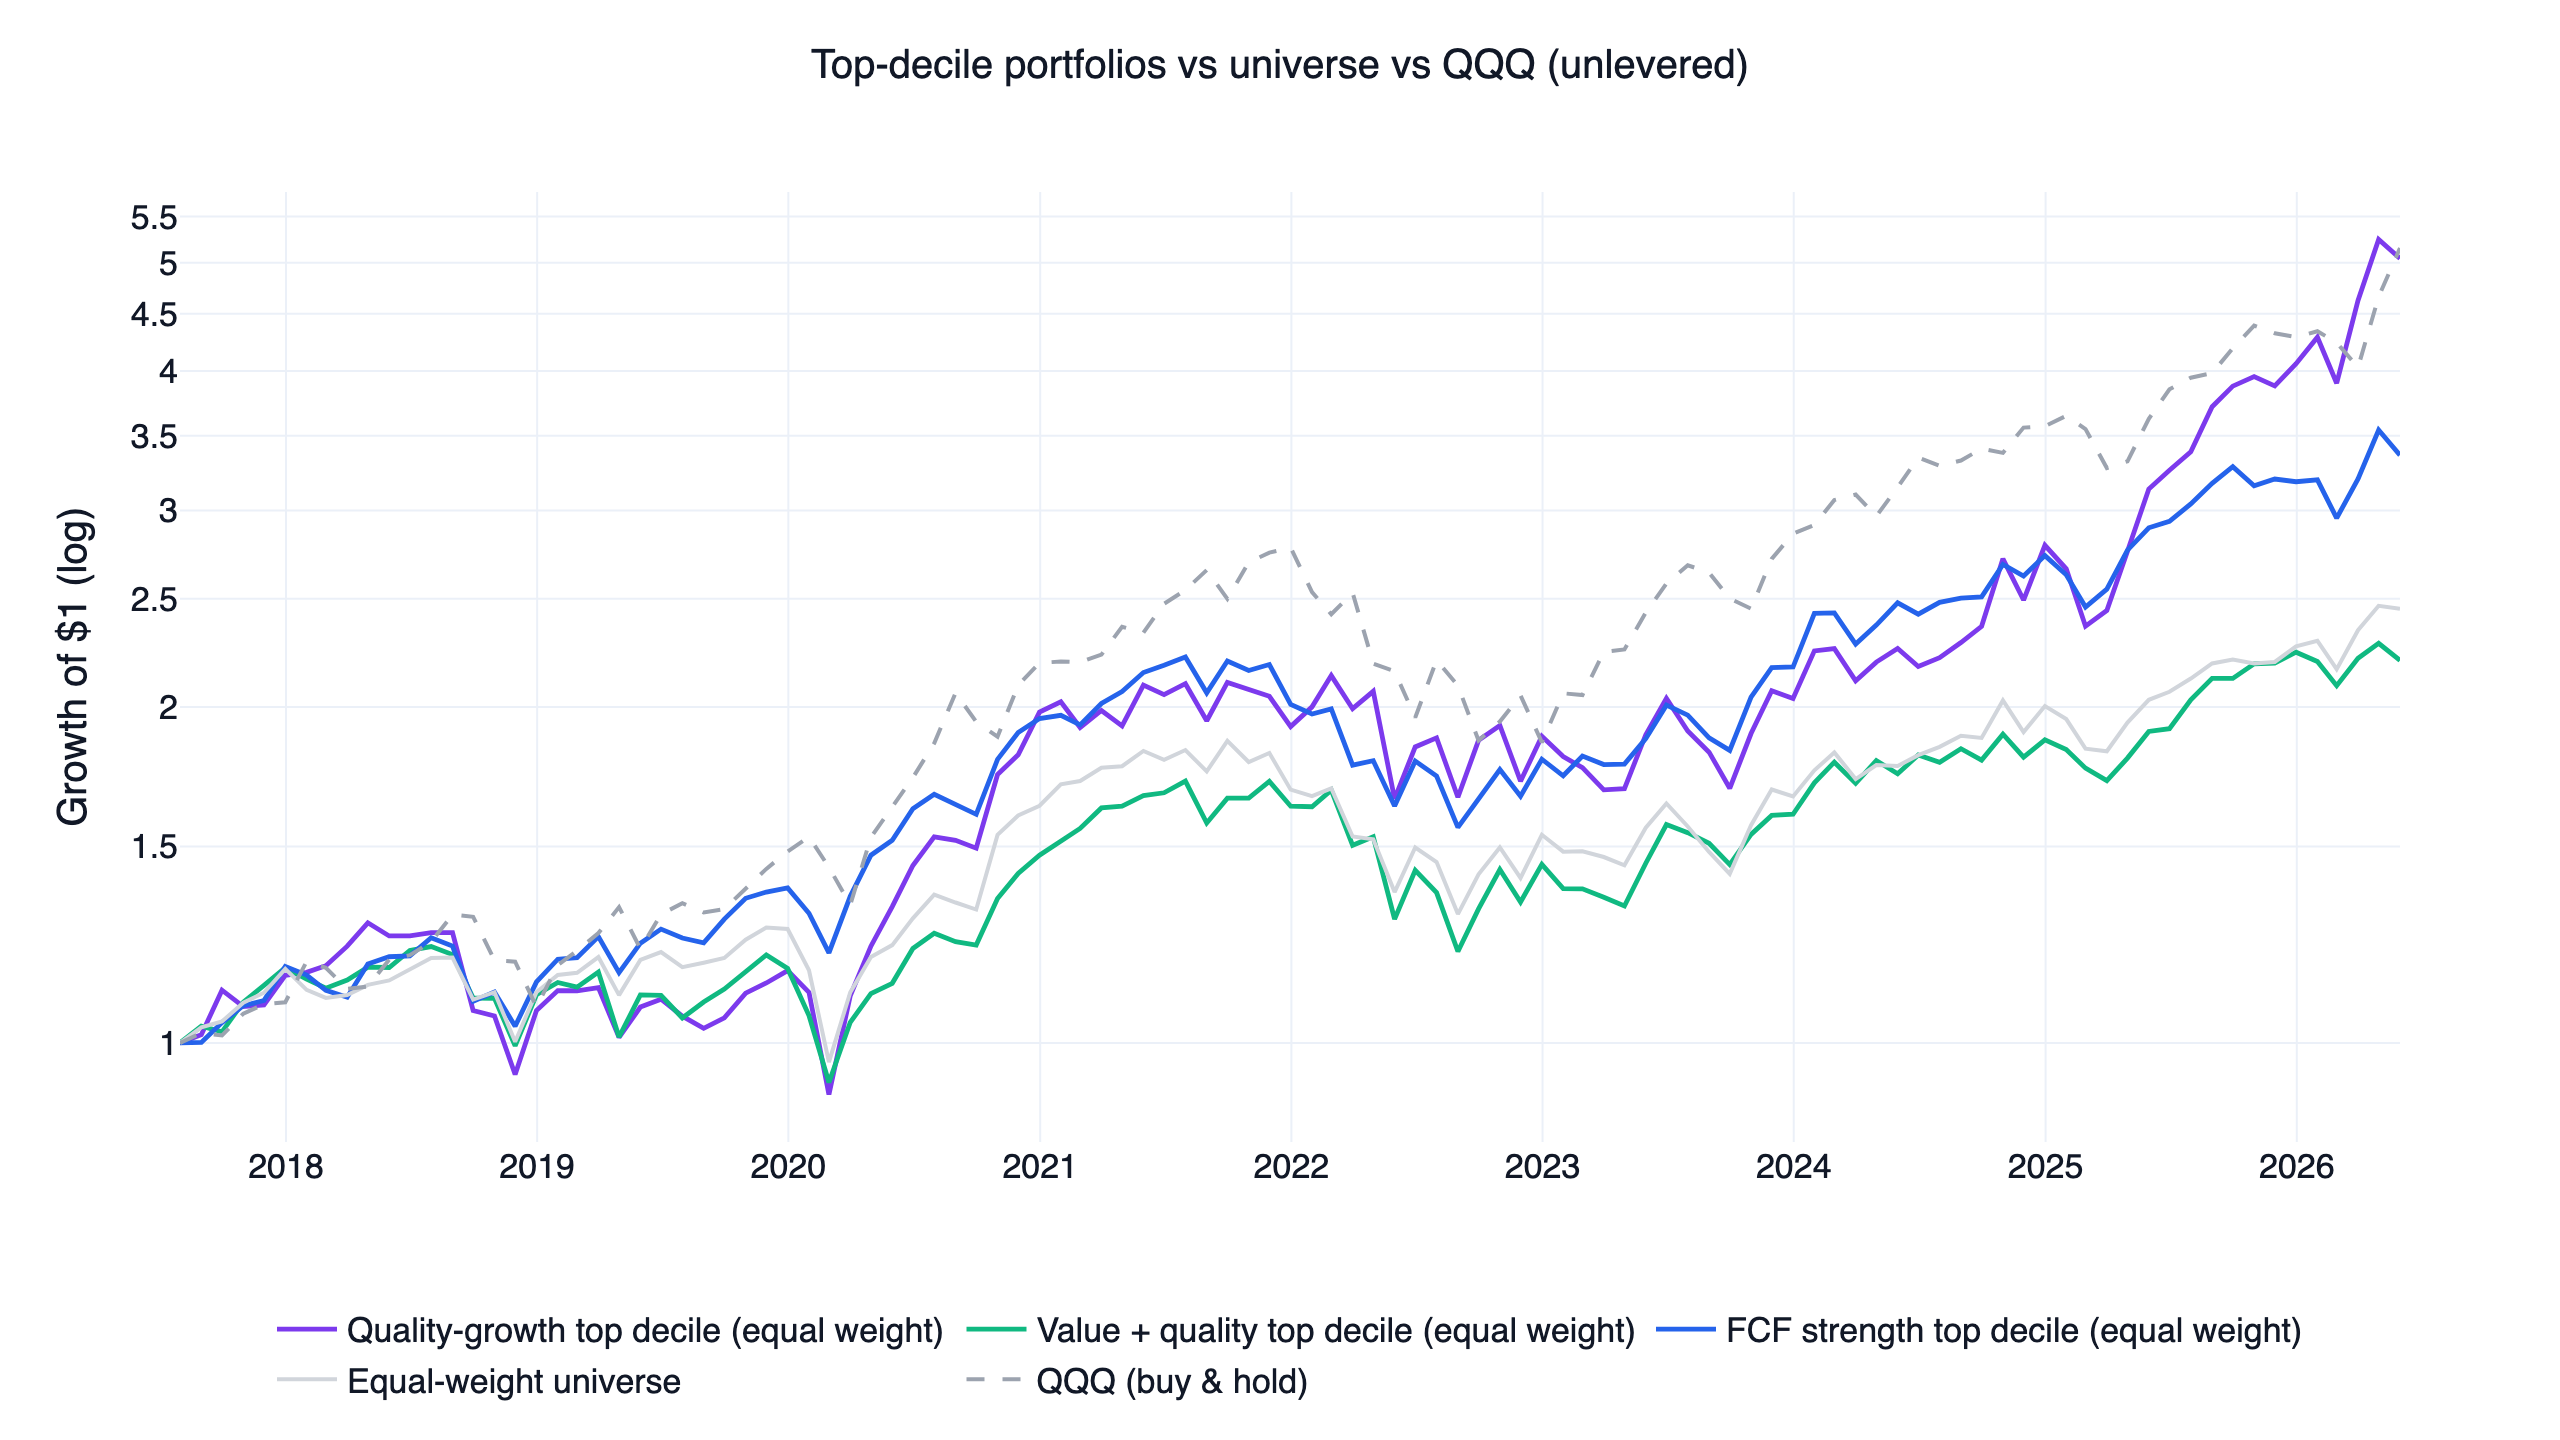
Only the quality-growth top decile ends ahead of QQQ buy-and-hold. The value-plus-quality and FCF top deciles do not. If your plan was "screen for quality value stocks and hold them," this decade would have rewarded you less than an index fund in two of the three definitions.
Where the factors do work: breadth as a regime gate
The second layer asks a different question. Instead of ranking stocks against each other, measure how many stocks pass each filter: the breadth of fundamental health across the market. When a large share of the liquid universe is generating free cash flow, growing revenue, or trading above trend with sound balance sheets, the market regime tends to support risk-taking. When that share collapses, it does not.
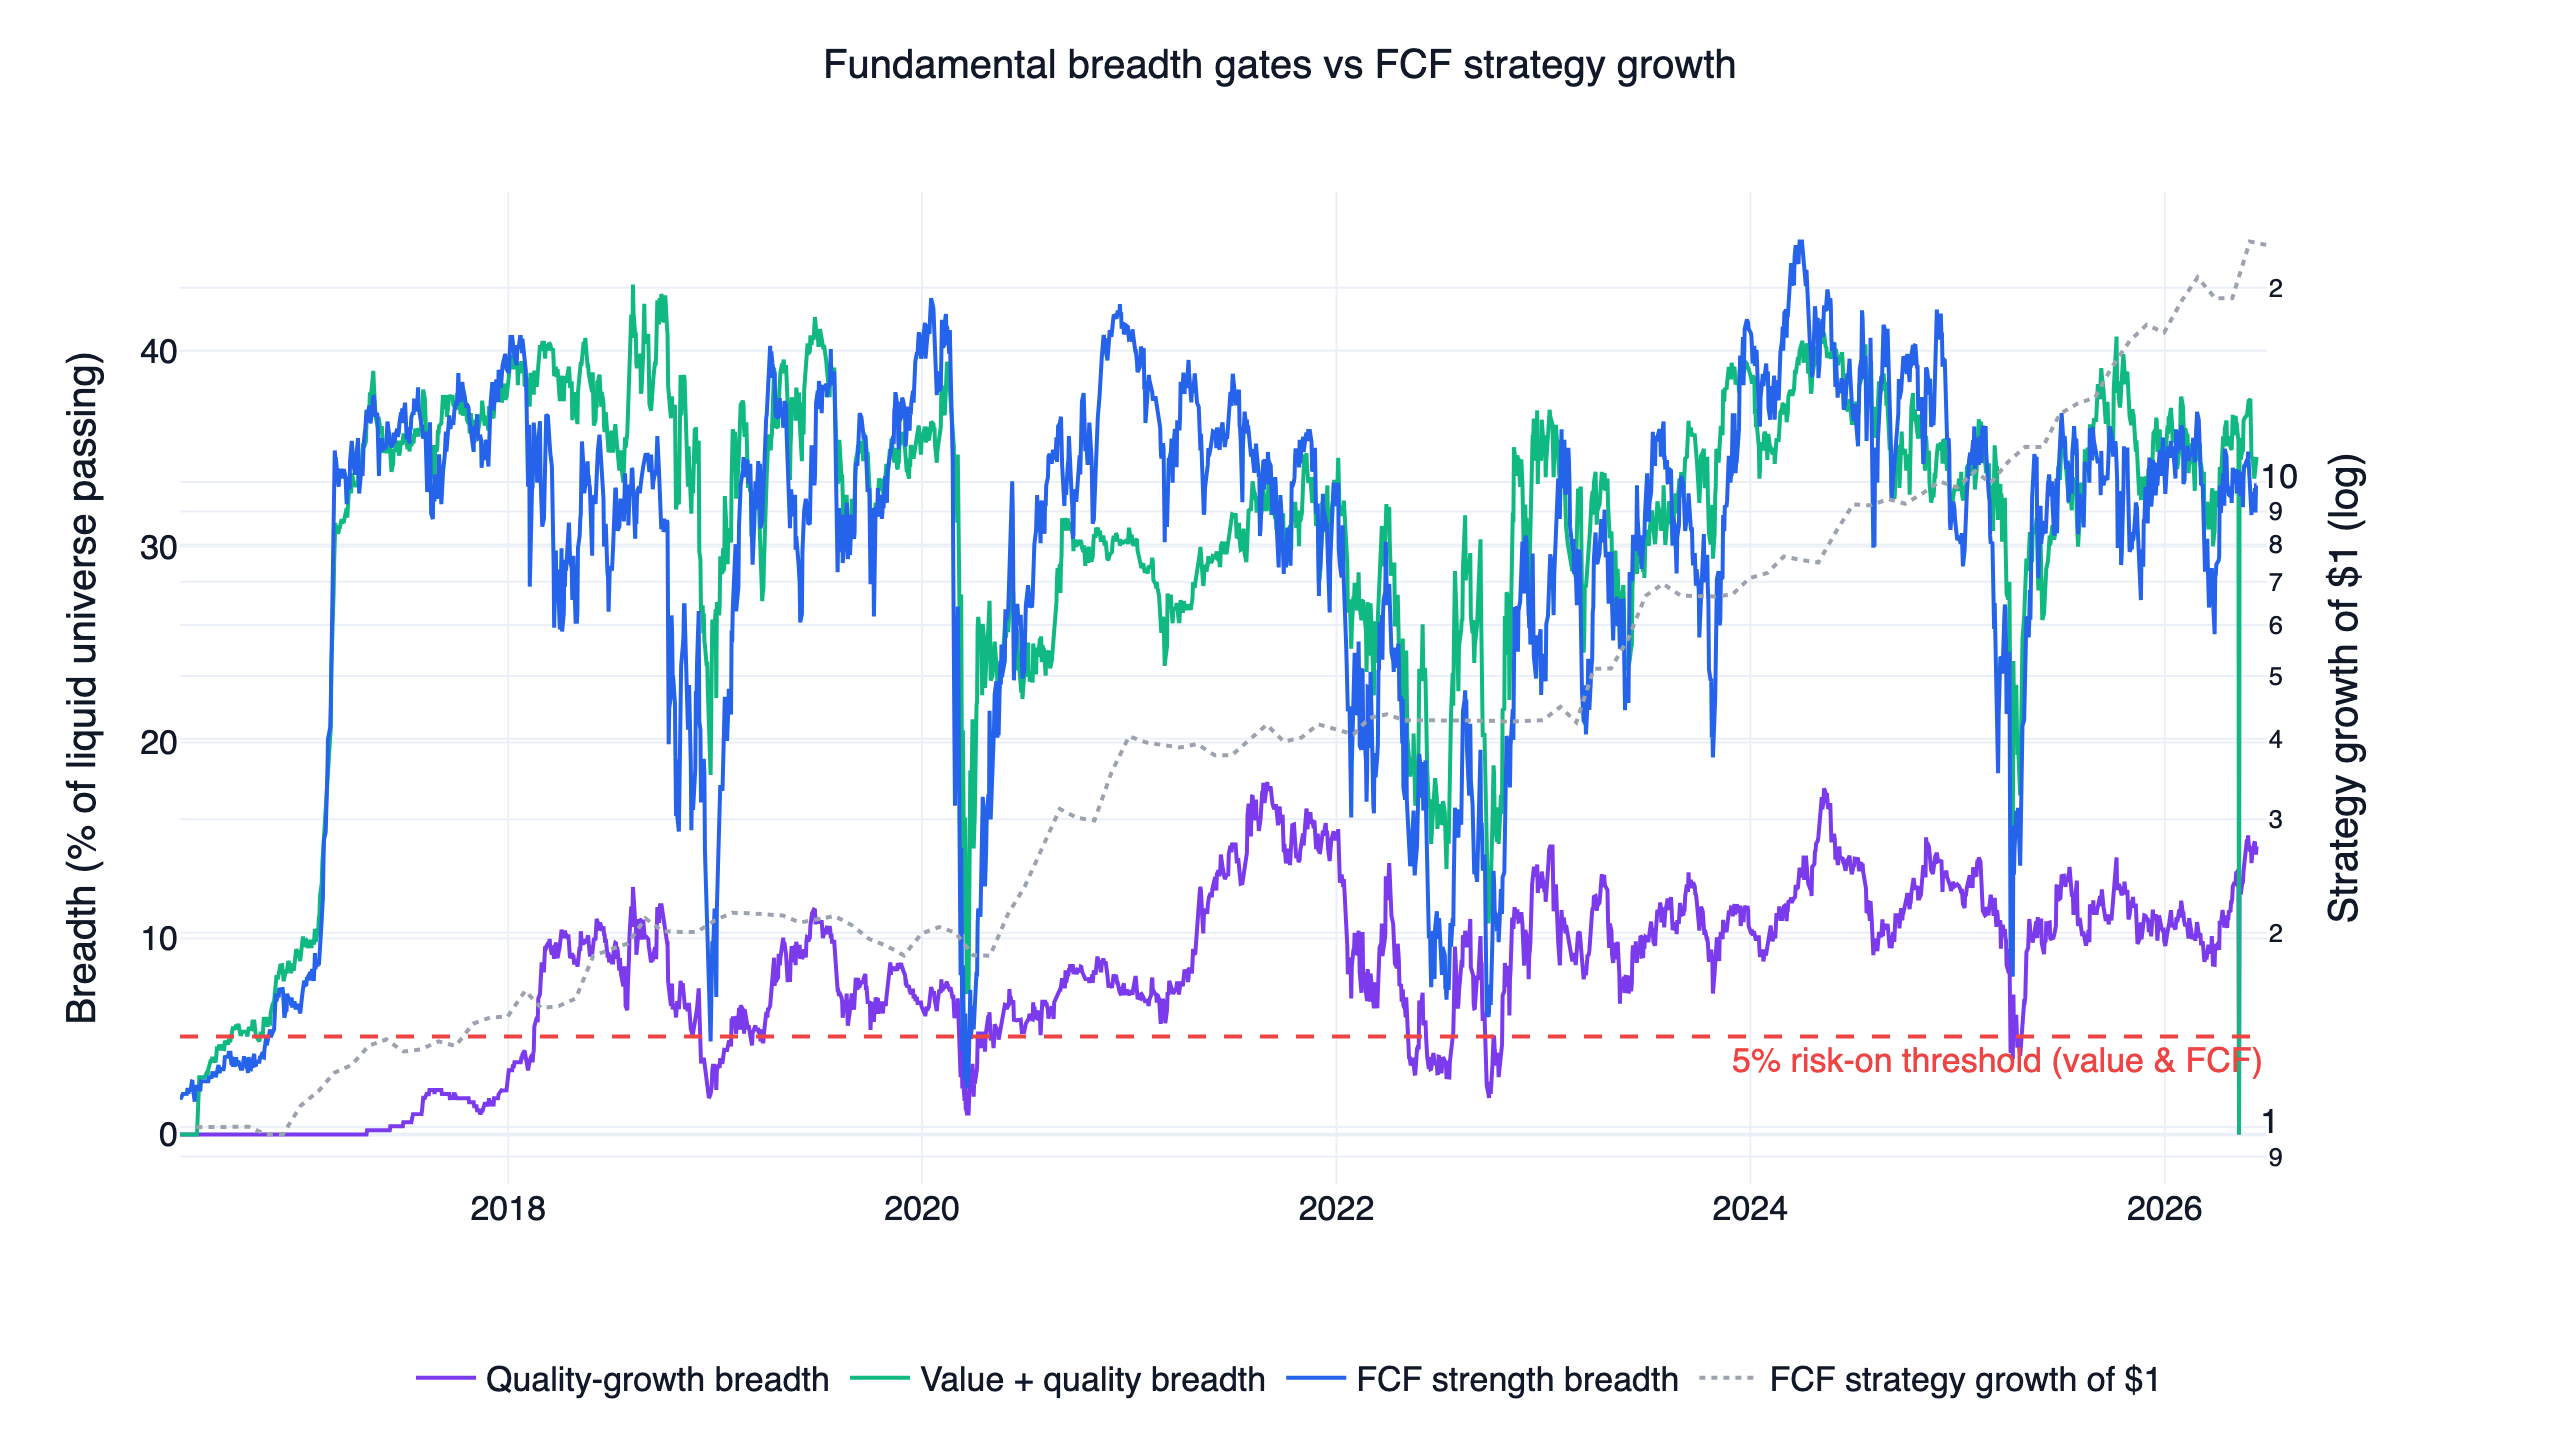
Each strategy is risk-on only when its breadth exceeds its threshold and QQQ trades above its 200-day average with positive 6-month momentum. Breadth averaged 7.9% for quality growth (against its 1% threshold), 29.6% for value + quality, and 28.5% for FCF strength (both against 5% thresholds), putting the strategies in risk-on mode 61.0%, 67.1%, and 66.0% of days respectively.
The comparative result is the most useful finding in this study. At the stock level, the three composites barely agree: the average Jaccard overlap between their top deciles is just 7% to 18%, so they are mostly holding different names. At the regime level, they almost always agree: all three gates were in the same state on 93.8% of all days, and value + quality and FCF strength matched on 98.8% of days. Three different definitions of fundamental health, applied to mostly different stocks, deliver one shared message about the market's condition. That convergence is why the strategies below perform so similarly, and it is the strongest evidence that breadth, rather than stock selection, carries the signal.
One data caveat: finlab's US fundamental history starts in 2015-Q1, and TTM plus year-over-year comparisons need up to eight quarters, so breadth readings sit near zero from 2016 to mid-2017. The strategies spent that stretch mostly in defensive assets. That is a data-coverage artifact baked into the backtest, and it makes the early-period returns conservative rather than flattering.
The lead strategy in finlab code
The tradable version gates leveraged-ETF exposure with fundamental breadth. This is the readable core of the lead FCF variant; the full script is downloadable at the end.
Show Code
import finlab
from finlab import data
from finlab.backtest import sim

finlab.login()

# 1. Liquid US universe: top 500 by 60-day average dollar volume
data.set_market("us")
close = data.get("us_price:adj_close")
volume = data.get("us_price:volume")

dollar_volume = (close * volume).rolling(60, min_periods=20).mean()
universe = dollar_volume.is_largest(500) & (dollar_volume > 10_000_000) & (close > 10)

# 2. TTM free cash flow and balance-sheet strength (filing-date aligned)
ocf = data.get("us_cash_flow:operating_cash_flow")
capex = data.get("us_cash_flow:capital_expenditure")
revenue = data.get("us_income_statement:revenue")
debt = data.get("us_balance_sheet:total_debt")
equity = data.get("us_balance_sheet:total_stockholders_equity")

fcf = (ocf + capex).rolling(4).sum()          # trailing twelve months
fcf_margin = fcf / revenue.rolling(4).sum()
debt_to_equity = debt / equity

passes = (
    universe
    & (close > close.average(200))
    & (fcf > 0)
    & (fcf_margin > 0.05)
    & (debt_to_equity < 1.2)
)

# 3. Breadth gate: what share of the liquid universe passes the filter
breadth = passes.sum(axis=1) / universe.sum(axis=1)

qqq = data.get("us_fund_price:adj_close")["QQQ"]
qqq_trend = qqq > qqq.rolling(200, min_periods=100).mean()
qqq_momentum = qqq / qqq.shift(126) - 1
risk_on = (breadth > 0.05) & (qqq_trend & (qqq_momentum > 0)).reindex(breadth.index)

# 4. Risk-on: hold the 2 strongest of TQQQ / TECL by 6-month momentum.
#    Risk-off: rotate to the strongest of IEF / GLD / SHY.
#    Monthly rebalance, 8% stop. Full rotation logic in strategy.py below.
us_price:adj_close is dividend- and split-adjusted, so trend and momentum calculations are not distorted by corporate actions, and the quarterly statement datasets are aligned to filing dates, so each day's screen uses only information that was public at the time. In risk-on, the strategy holds the two strongest leveraged growth ETFs; in risk-off, a single defensive ETF. The execution layer is identical across all three variants and across the wider family, and the strategy family overview covers its mechanics and trade-offs once for all of them.
Here is the interactive finlab report for the lead FCF strategy, with drawdowns, monthly returns, and the full trade list:
Out-of-sample: three strategies become one trade
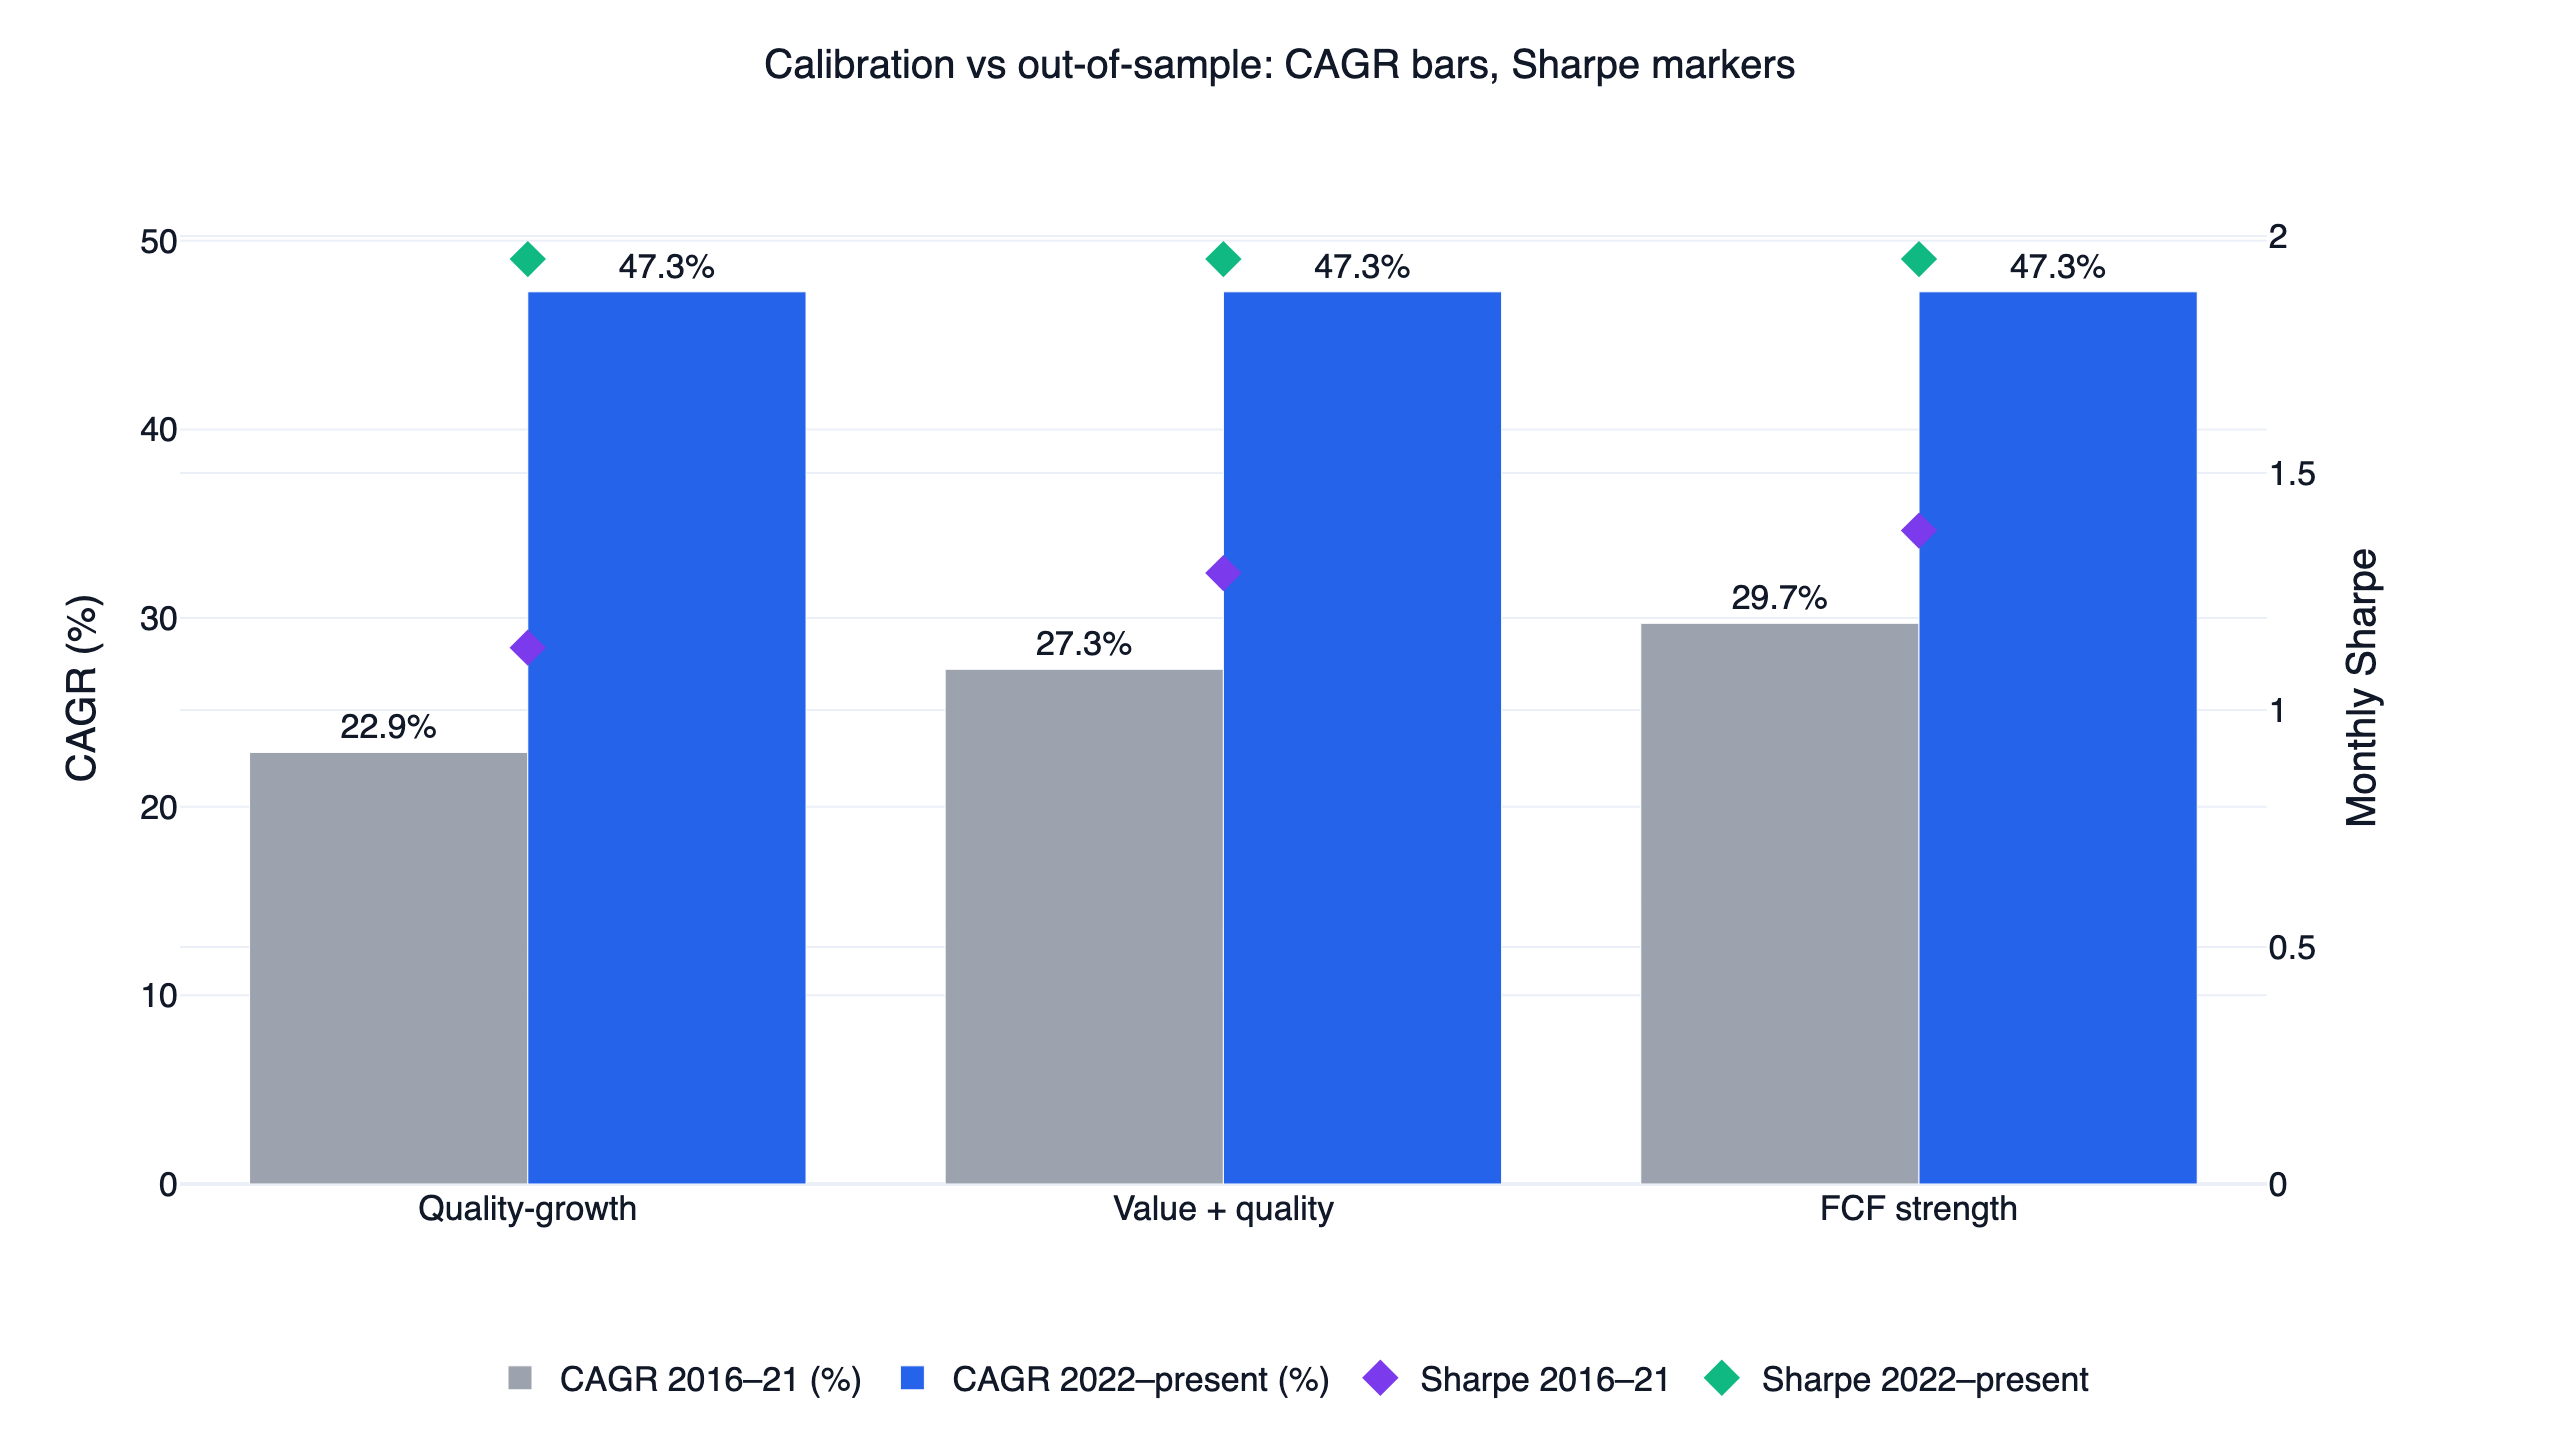
Parameters were calibrated on 2016-2021 and left untouched on 2022-present, an unseen period that includes the 2022 bear market.
| Metric | Quality growth | Value + quality | FCF strength | QQQ |
|---|---|---|---|---|
| CAGR, research (2016-2021) | 22.9% | 27.3% | 29.7% | 25.8% |
| Monthly Sharpe, research | 1.13 | 1.29 | 1.38 | 1.52 |
| CAGR, out-of-sample (2022-) | 47.3% | 47.3% | 47.3% | 14.1% |
| Monthly Sharpe, out-of-sample | 1.95 | 1.95 | 1.95 | 0.84 |
| Max drawdown, out-of-sample | -13.9% | -13.9% | -13.9% | -35.2% |
The repeated out-of-sample values are the finding, not a formatting error: all three variants post identical statistics since 2022 because their regime gates agreed on 99.9% of out-of-sample days, so they held the same ETFs at the same times. Since 2022 they are effectively one trade, which is the reason this comparison is published as a single article rather than three. All the differentiation lives in 2016-2021, where the FCF variant led (29.7% CAGR, 1.38 Sharpe) and quality growth trailed, partly because its stricter screen and the early data-coverage gap kept it defensive longer.
The research period also deserves a plain reading: during 2016-2021, none of the three variants beat QQQ's 1.52 research-period Sharpe, and quality growth did not beat its 25.8% CAGR either. The strategies earned their full-period edge in the out-of-sample years, when the gates moved to defensive assets through much of 2022 while QQQ drew down 35%. That is genuinely encouraging behavior on unseen data, and it is still one market cycle, not a guarantee.
Backtest method and limits
| Item | This backtest |
|---|---|
| Transaction costs | Not modeled (fee_ratio=0, tax_ratio=0, no slippage), reflecting US commission-free brokerage. Leveraged-ETF spreads and rebalance slippage would reduce live returns. |
| Leverage decay | Already reflected: the TQQQ/TECL price series embed daily-reset drag and expense ratios. |
| Universe / point-in-time | Top 500 US stocks by 60-day dollar volume; price > 10M; names with a single-day move of 50%+ excluded for a year (data-artifact guard); each date uses only then-available data. |
| Fundamentals timing | Quarterly statements aligned to SEC filing dates; TTM = rolling 4 quarters; no restatement lookahead. |
| Data coverage | US fundamental history starts 2015-Q1, so breadth is near zero until mid-2017 and the strategies sat in defensive assets early on. |
| Turnover | About 3.5x to 3.6x per year; 224 to 238 trades over the decade. |
| Position rule | 2 leveraged ETFs in risk-on, 1 defensive ETF otherwise; 8% touched stop. |
| Sample | 2016-2021 calibration; 2022-present out-of-sample. |
| Capacity | Not estimated. Leveraged ETF liquidity is deep, but real impact depends on your size. |
The publication gate for this strategy family is a risk-adjusted ratio of at least 1.5. The lead FCF variant passes on the full-period monthly Sharpe (1.53, finlab get_stats convention), the full-period monthly Sortino (4.79), and the out-of-sample monthly Sharpe (1.95) and Sortino (5.87). One reporting note: a monthly Sharpe computed from the rebased common-start curve comes out higher (1.62) than finlab's internal monthly-resampling convention (1.53); the headline uses the conservative value, and both conventions are recorded in the downloadable metrics.json linked at the end.
The leveraged-ETF risk you must understand
The returns above come from holding 3x products part-time, and the leverage is the main thing that can hurt you:
- Daily reset and path dependency. A 3x daily ETF compounds daily, so a choppy, sideways market erodes value even if the index ends flat. None of these strategies hold leverage unconditionally for exactly this reason.
- The actual worst case was -21.1%, shared by all three variants over the full period, with 20% annualized volatility. If a one-in-five drawdown on your whole position is intolerable, this sizing is wrong for you.
- Fundamental breadth moves slowly. Quarterly filings update with a lag, so breadth can stay positive while leveraged ETFs reprice violently, can lag a sudden liquidity shock, and in the FCF variant can deteriorate only after the price trend has already turned. The QQQ trend condition and the 8% stop are the faster brakes, and a gap through the stop can fill worse in live trading than in the backtest.
- Monthly switching is not crash protection. A fast crash inside a month is taken at full leverage until the stop or the next rebalance.
- Concentration. One or two ETFs means single-theme (large-cap US growth) risk, whatever the screen that timed the entry.
A reasonable conservative reading of this study: take the regime-gate finding, ignore the leverage, and apply breadth gating to unlevered index exposure. The compounding will be lower and the risk profile far gentler.
Who this is for
This comparison fits an investor who wants rules-based US exposure, cares whether a screen's stock-picking claims actually survive a decile test, understands leveraged ETFs, and can hold through a 20% drawdown. It does not fit anyone who needs capital stability, wants a buy-and-hold quality portfolio (the unlevered test above shows what that earned), or is uncomfortable holding 3x products at any time.
FAQ
Does a quality value strategy beat the market in this backtest? The tradable, breadth-gated versions did: 33.2% to 37.3% CAGR versus QQQ's 20.6%, with smaller drawdowns. The plain stock-picking versions mostly did not; only the quality-growth top decile beat QQQ unlevered.
Which fundamental factor was best? For the tradable strategy, FCF strength (37.3% CAGR, 1.53 monthly Sharpe, full period). For stock-level selection, quality growth, the only variant with a real top-decile premium (+12.2%/yr long-short).
Why do all three variants have identical out-of-sample results? Their risk-on gates agreed on 99.9% of days since 2022, so they held the same ETFs at the same times. The factor definitions differ at the stock level (top-decile overlap of only 7-18%) but converge at the regime level.
Is free cash flow factor investing different from value investing? Yes. Value ranks on price multiples; FCF factor investing ranks on whether earnings are backed by cash, following Sloan (1996). In this test the FCF screen produced a small positive stock-level premium while the value-tilted screen produced a negative one.
What data does this need?
FinLab's us_price:* for prices, us_income_statement / us_balance_sheet / us_cash_flow for filing-date-aligned fundamentals, and us_fund_price:* for the ETFs. All are in a standard FinLab account.
Can I run and modify this myself? Yes. Use the AI-assisted setup flow and ask your agent to rebuild any variant, or download the script below and run it after setup.
Reproduce it yourself
Three files reproduce the lead strategy, the comparison curves, and every number quoted above:
- strategy.py — the full FCF / balance-sheet strength strategy, ready to run after the AI-assisted setup flow.
- data.csv — daily equity curves for the three variants, QQQ, and SPY.
- metrics.json — the complete metrics for all three variants and both benchmarks: CAGR, drawdown, daily and monthly Sharpe/Sortino under both conventions discussed above, the research/out-of-sample splits, turnover, and the factor-validity statistics.
A natural next experiment is to hand the script to your AI agent and swap the entry filter: tighten the FCF margin, drop the trend condition, or combine the quality-growth screen with the 5% threshold, then re-run the decile test before trusting the equity curve. To see how these three sit among ten related US systems, read the US quant trading strategies comparison; for the strongest stock-level factor in the family, see the US momentum study. Related fundamental research on the Taiwan market includes the PEG value strategy, the cash-flow quality strategy, and the institutional-flow strategy, and the AI quant research workflow shows how studies like this one get built. For metric definitions, see the glossary; for more write-ups, the FinLab research blog; and for the team and what users build, the about page and use cases.
Last updated: 2026-06 | Backtest window: 2016-06 to 2026-06 | Benchmark: QQQ total return | Author: FinLab Quant Research (reviewed by a quantitative researcher)
Investing involves risk, and past performance does not represent future results. Leveraged ETFs carry additional risks including volatility decay and amplified losses. This content is for educational purposes only and is not investment advice and does not constitute investment advice; evaluate any strategy against your own risk tolerance.
FinLab AI
Want to build your own strategy?
Describe your stock-picking ideas in natural language. AI automatically validates, backtests, and gives you answers
Start Free