Run this strategy
Copy the prompt to reproduce the evidence above with the article’s data, assumptions, and risk checks.
Tell your AI:
Set up FinLab and rerun the Santa Claus rally and four other calendar effects against QQQ. Please read: https://finlab.finance/en/setup?relatedUrl=/en/blog/santa-claus-rally-calendar-effects-backtest
We tested the five best-known stock market calendar effects on QQQ and SPY from January 2016 to October 2026: the Santa Claus rally, Sell in May and go away, the turn of the month, the pre-holiday effect, and staying in cash in May and June. None of them beat simply holding QQQ. The best classic setting reached a daily Sharpe ratio of 0.72 (cash in May-June, applied to SPY) against 0.93 for QQQ with dividends reinvested, and none of the 90 neighbouring parameter settings beat QQQ either. The Santa Claus rally, the best known of the five, was the weakest: on QQQ its seven-day window gained 0.15% on average, less than the 0.57% average of any seven trading days, and it lost money in each of the last five years. The turn of the month and the day before a holiday still averaged more than other days, although neither difference was statistically significant, and they cover too few days to turn into a strategy that beats owning the index.
The five rules at a glance
Each rule holds the ETF only on the days inside its window and sits in cash the rest of the time. The numbers below are for the rule applied to QQQ; the SPY versions are in the charts and in metrics.json.
| Rule (source) | Holds | Time invested | Daily Sharpe | CAGR | Max drawdown | Settings beating QQQ | First / second half Sharpe |
|---|---|---|---|---|---|---|---|
| Santa Claus rally (Hirsch 1972) | Last 5 trading days of Dec + first 2 of Jan | 2.6% | 0.06 | 0.1% | -6.6% | 0 / 9 | 0.31 / -0.32 |
| Sell in May (Bouman & Jacobsen 2002) | November through April | 48% | 0.53 | 8.0% | -28.6% | 0 / 9 | 0.75 / 0.30 |
| Turn of the month (Lakonishok & Smidt 1988) | Last trading day + first 3 of the next month | 19% | 0.54 | 4.8% | -14.4% | 0 / 9 | 0.72 / 0.37 |
| Pre-holiday (Ariel 1990) | The trading day before each market holiday | 3.8% | 0.36 | 1.1% | -7.1% | 0 / 9 | 0.02 / 0.69 |
| Cash in May-June | Every month except May and June | 83% | 0.69 | 12.8% | -28.6% | 0 / 9 | 0.96 / 0.41 |
| QQQ, buy and hold | Always | 100% | 0.93 | 19.9% | -35.1% | benchmark | 1.09 / 0.78 |
| SPY, buy and hold | Always | 100% | 0.88 | 15.1% | -33.7% | reference | not split |
Window: 2016-01-04 to 2026-10-27, the full history of FinLab's US ETF price table. All curves start on the same day; QQQ and SPY are total-return series over exactly the same dates.
How a rule had to pass
"Beats QQQ" has one meaning here: a higher daily Sharpe ratio than buying and holding QQQ with dividends reinvested, over exactly the same trading days. Sharpe is the mean daily return divided by its standard deviation, annualised with √252, without subtracting a risk-free rate. A rule counted as working only if it passed all three checks:
- Neighbouring settings. Each rule has two parameters. We took the classic value of each and one step either side, nine settings per rule, and at least seven of the nine had to beat QQQ (the bar is 70% or more). The Santa Claus rally varied the December days (4, 5, 6) and the January days (1, 2, 3). Sell in May varied the first month held (October, November, December) and the last (March, April, May). The turn of the month varied the days before month end (0, 1, 2) and the days into the new month (2, 3, 4). The pre-holiday rule varied the days before the holiday (1, 2, 3) and the days after it (0, 1, 2). Cash in May-June varied the first cash month (April, May, June) and the number of cash months (1, 2, 3).
- Both halves. The window was cut at its midpoint, 2021-05-28, and the classic setting had to beat QQQ in each half on its own.
- Trading costs. finlab's US default charges no commission and no tax, the norm at commission-free brokers. To account for the bid-ask spread and slippage, the cost check charges 0.1% on every buy and every sell (
fee_ratio=0.001), and the rule must still beat QQQ.
Every rule was run on QQQ and on SPY, so the grid has 45 settings per ETF and 90 in total.
The five rules and where they come from
Santa Claus rally. Yale Hirsch named it in the 1972 Stock Trader's Almanac: the market tends to rise over the last five trading days of December and the first two of January. Lakonishok & Smidt (1988) studied 90 years of daily Dow Jones data and found unusually high returns around the turn of the year, along with the turn of the month and the days before holidays. Our window is Hirsch's: 5 + 2 trading days, about 2.6% of all trading days.
Sell in May and go away (the Halloween effect). Bouman & Jacobsen (2002) found that stock returns from November through April were higher than from May through October in 36 of the 37 markets they studied over 1970-1998. The rule holds from the first trading day of November to the last trading day of April and is in cash for the other six months.
Turn of the month. Ariel (1987) found that US stock returns from 1963 to 1981 were concentrated in the first half of the trading month, starting with the last day of the previous month. Lakonishok & Smidt (1988) narrowed it to four days, the last trading day of a month and the first three of the next, and McConnell & Xu (2008) found that in 1926-2005 US stocks earned essentially no market premium outside those four days, and found the same pattern in 31 of the 35 countries they examined, the US included. Our rule holds exactly those four days.
Pre-holiday effect. Ariel (1990) reported that the trading day before a market holiday earned nine to fourteen times the average return of the other days of the year. The rule holds only that day. Over our window there were 102 weekday market closures, including the two unscheduled ones for national days of mourning (2018-12-05 and 2025-01-09), which were announced days in advance.
Cash in May and June. The Chinese market saying "五窮六絕" ("May is poor, June is dire") predicts weak stocks in May and June. It is a short version of Sell in May: the rule holds the ETF all year except May and June.
Result 1: none of the five beats QQQ
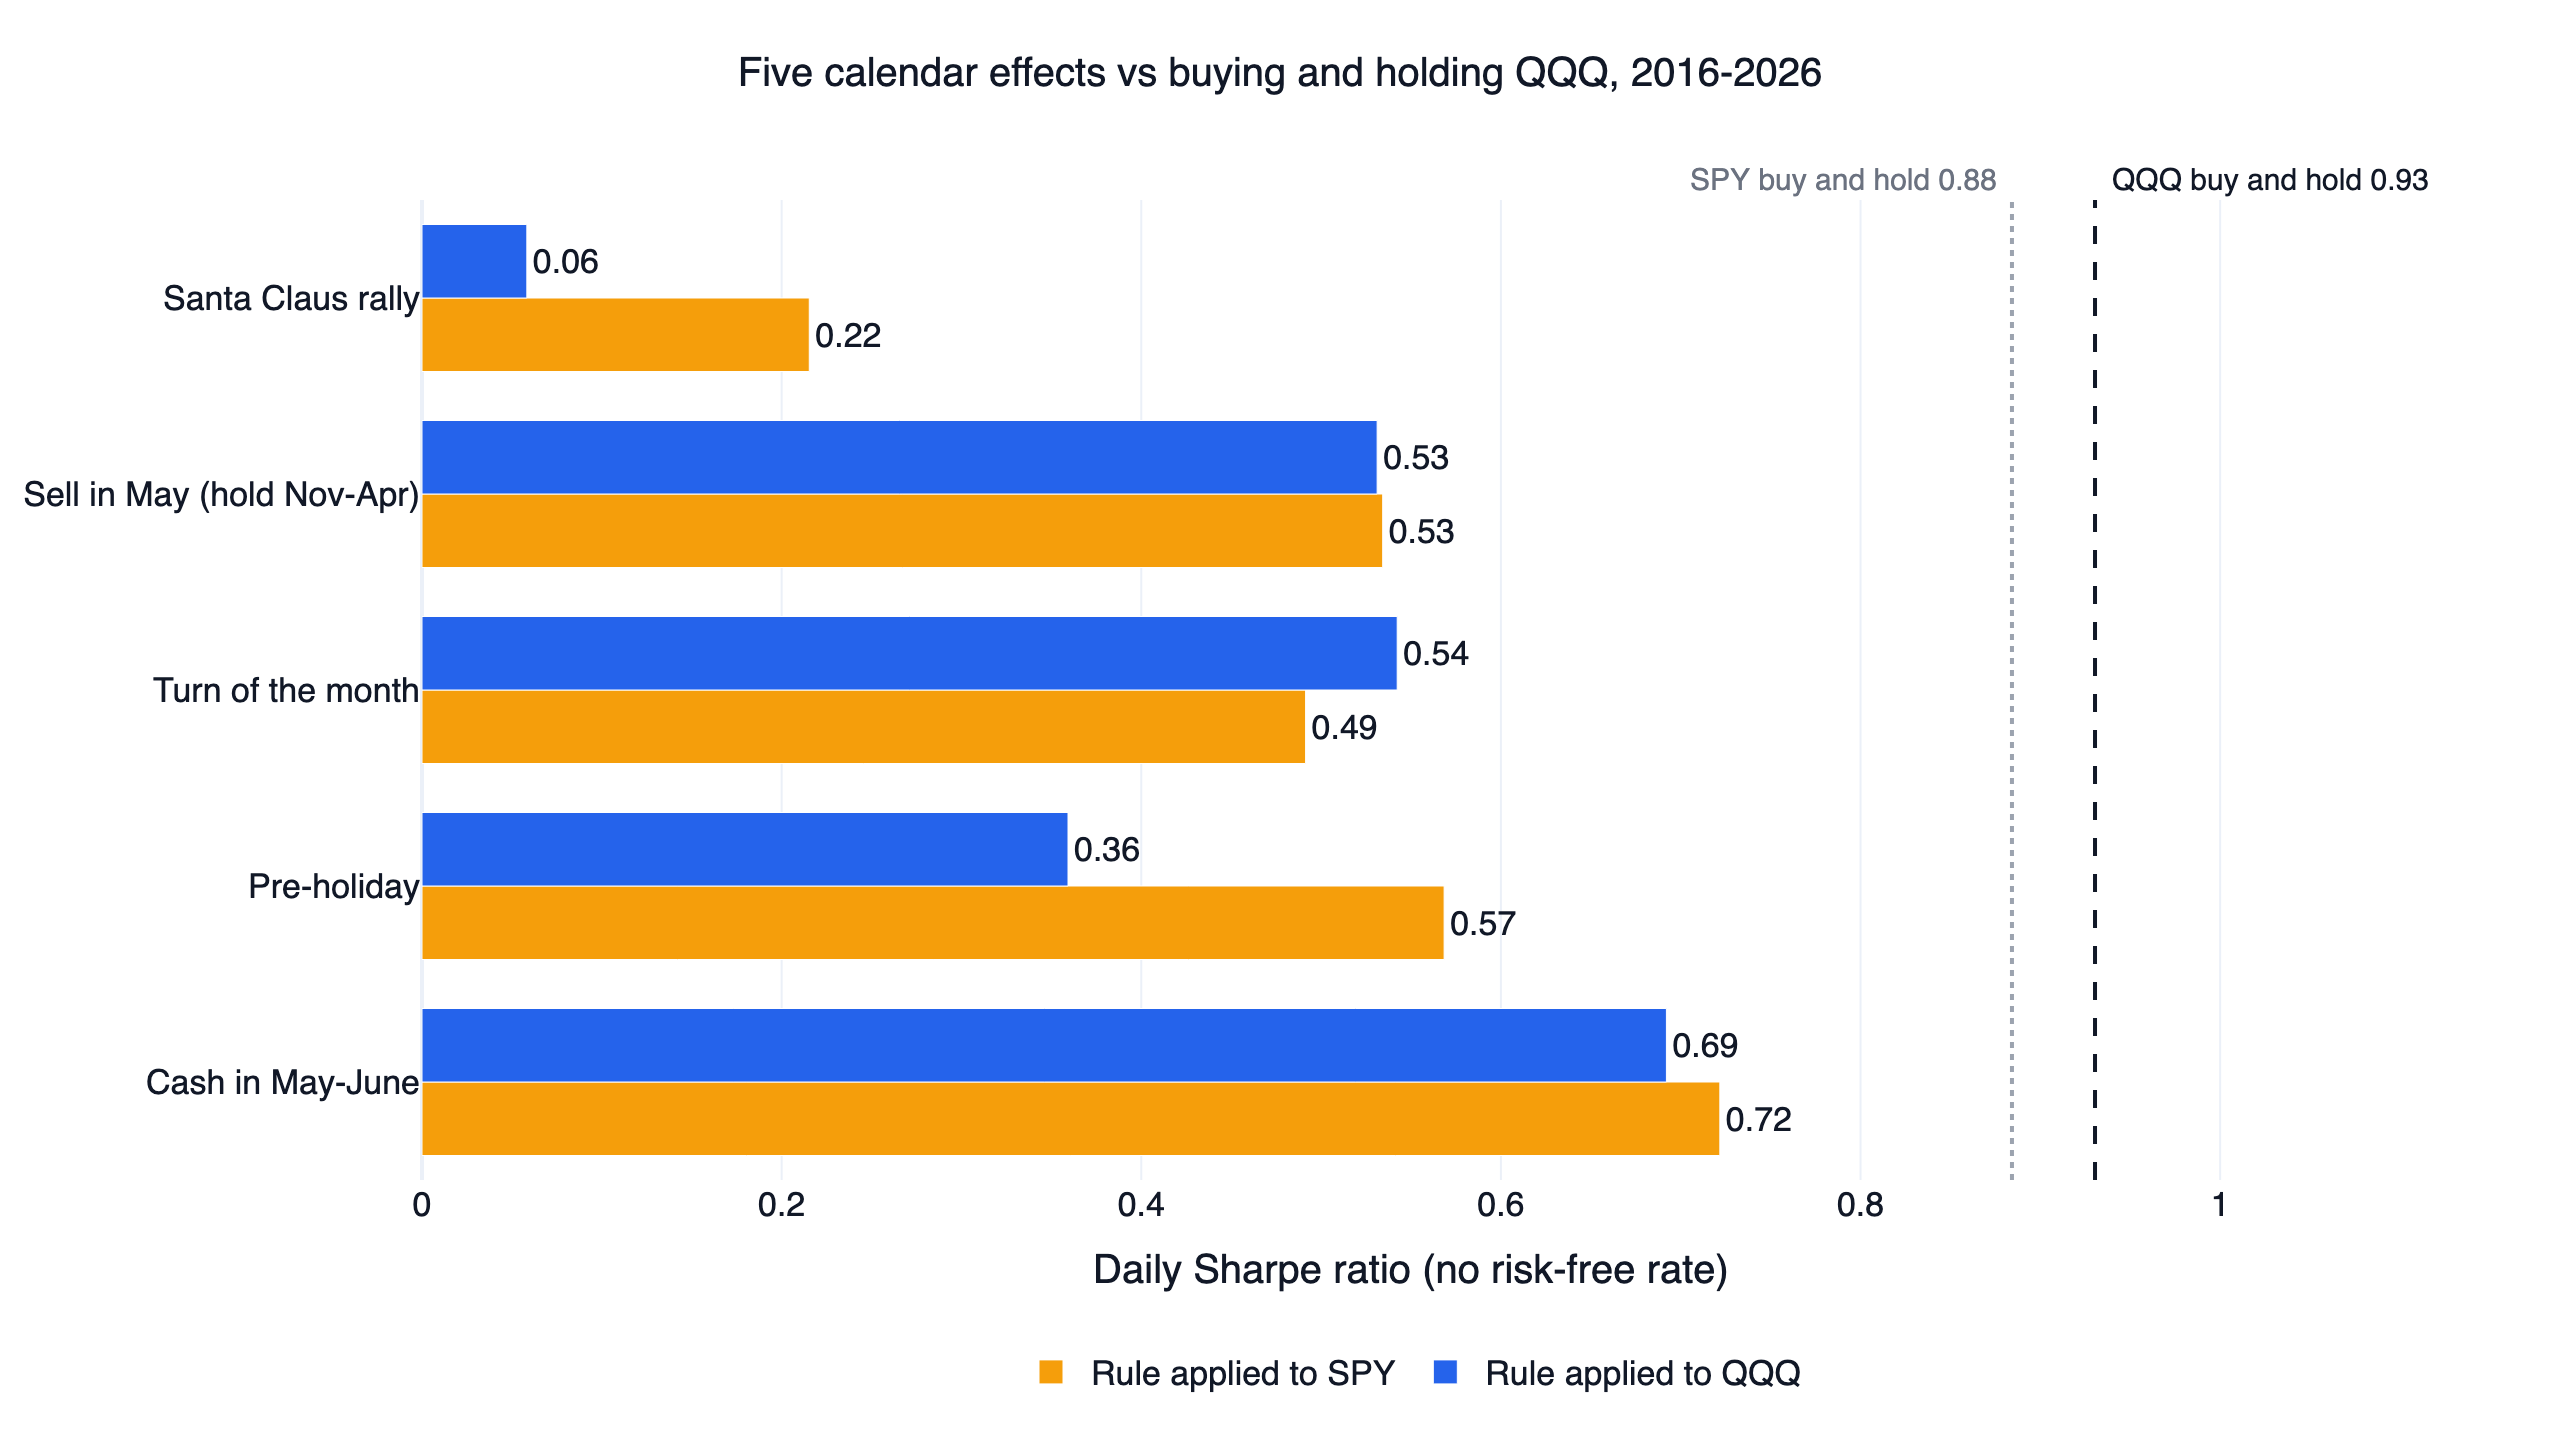
The chart at the top ranks the classic settings. The closest is cash in May-June (0.69 on QQQ, 0.72 on SPY), the rule that is invested most of the time. Sell in May (0.53 on both), the turn of the month (0.54 and 0.49) and the pre-holiday rule (0.36 and 0.57) sit between 0.36 and 0.57. The Santa Claus rally trails at 0.06 and 0.22.
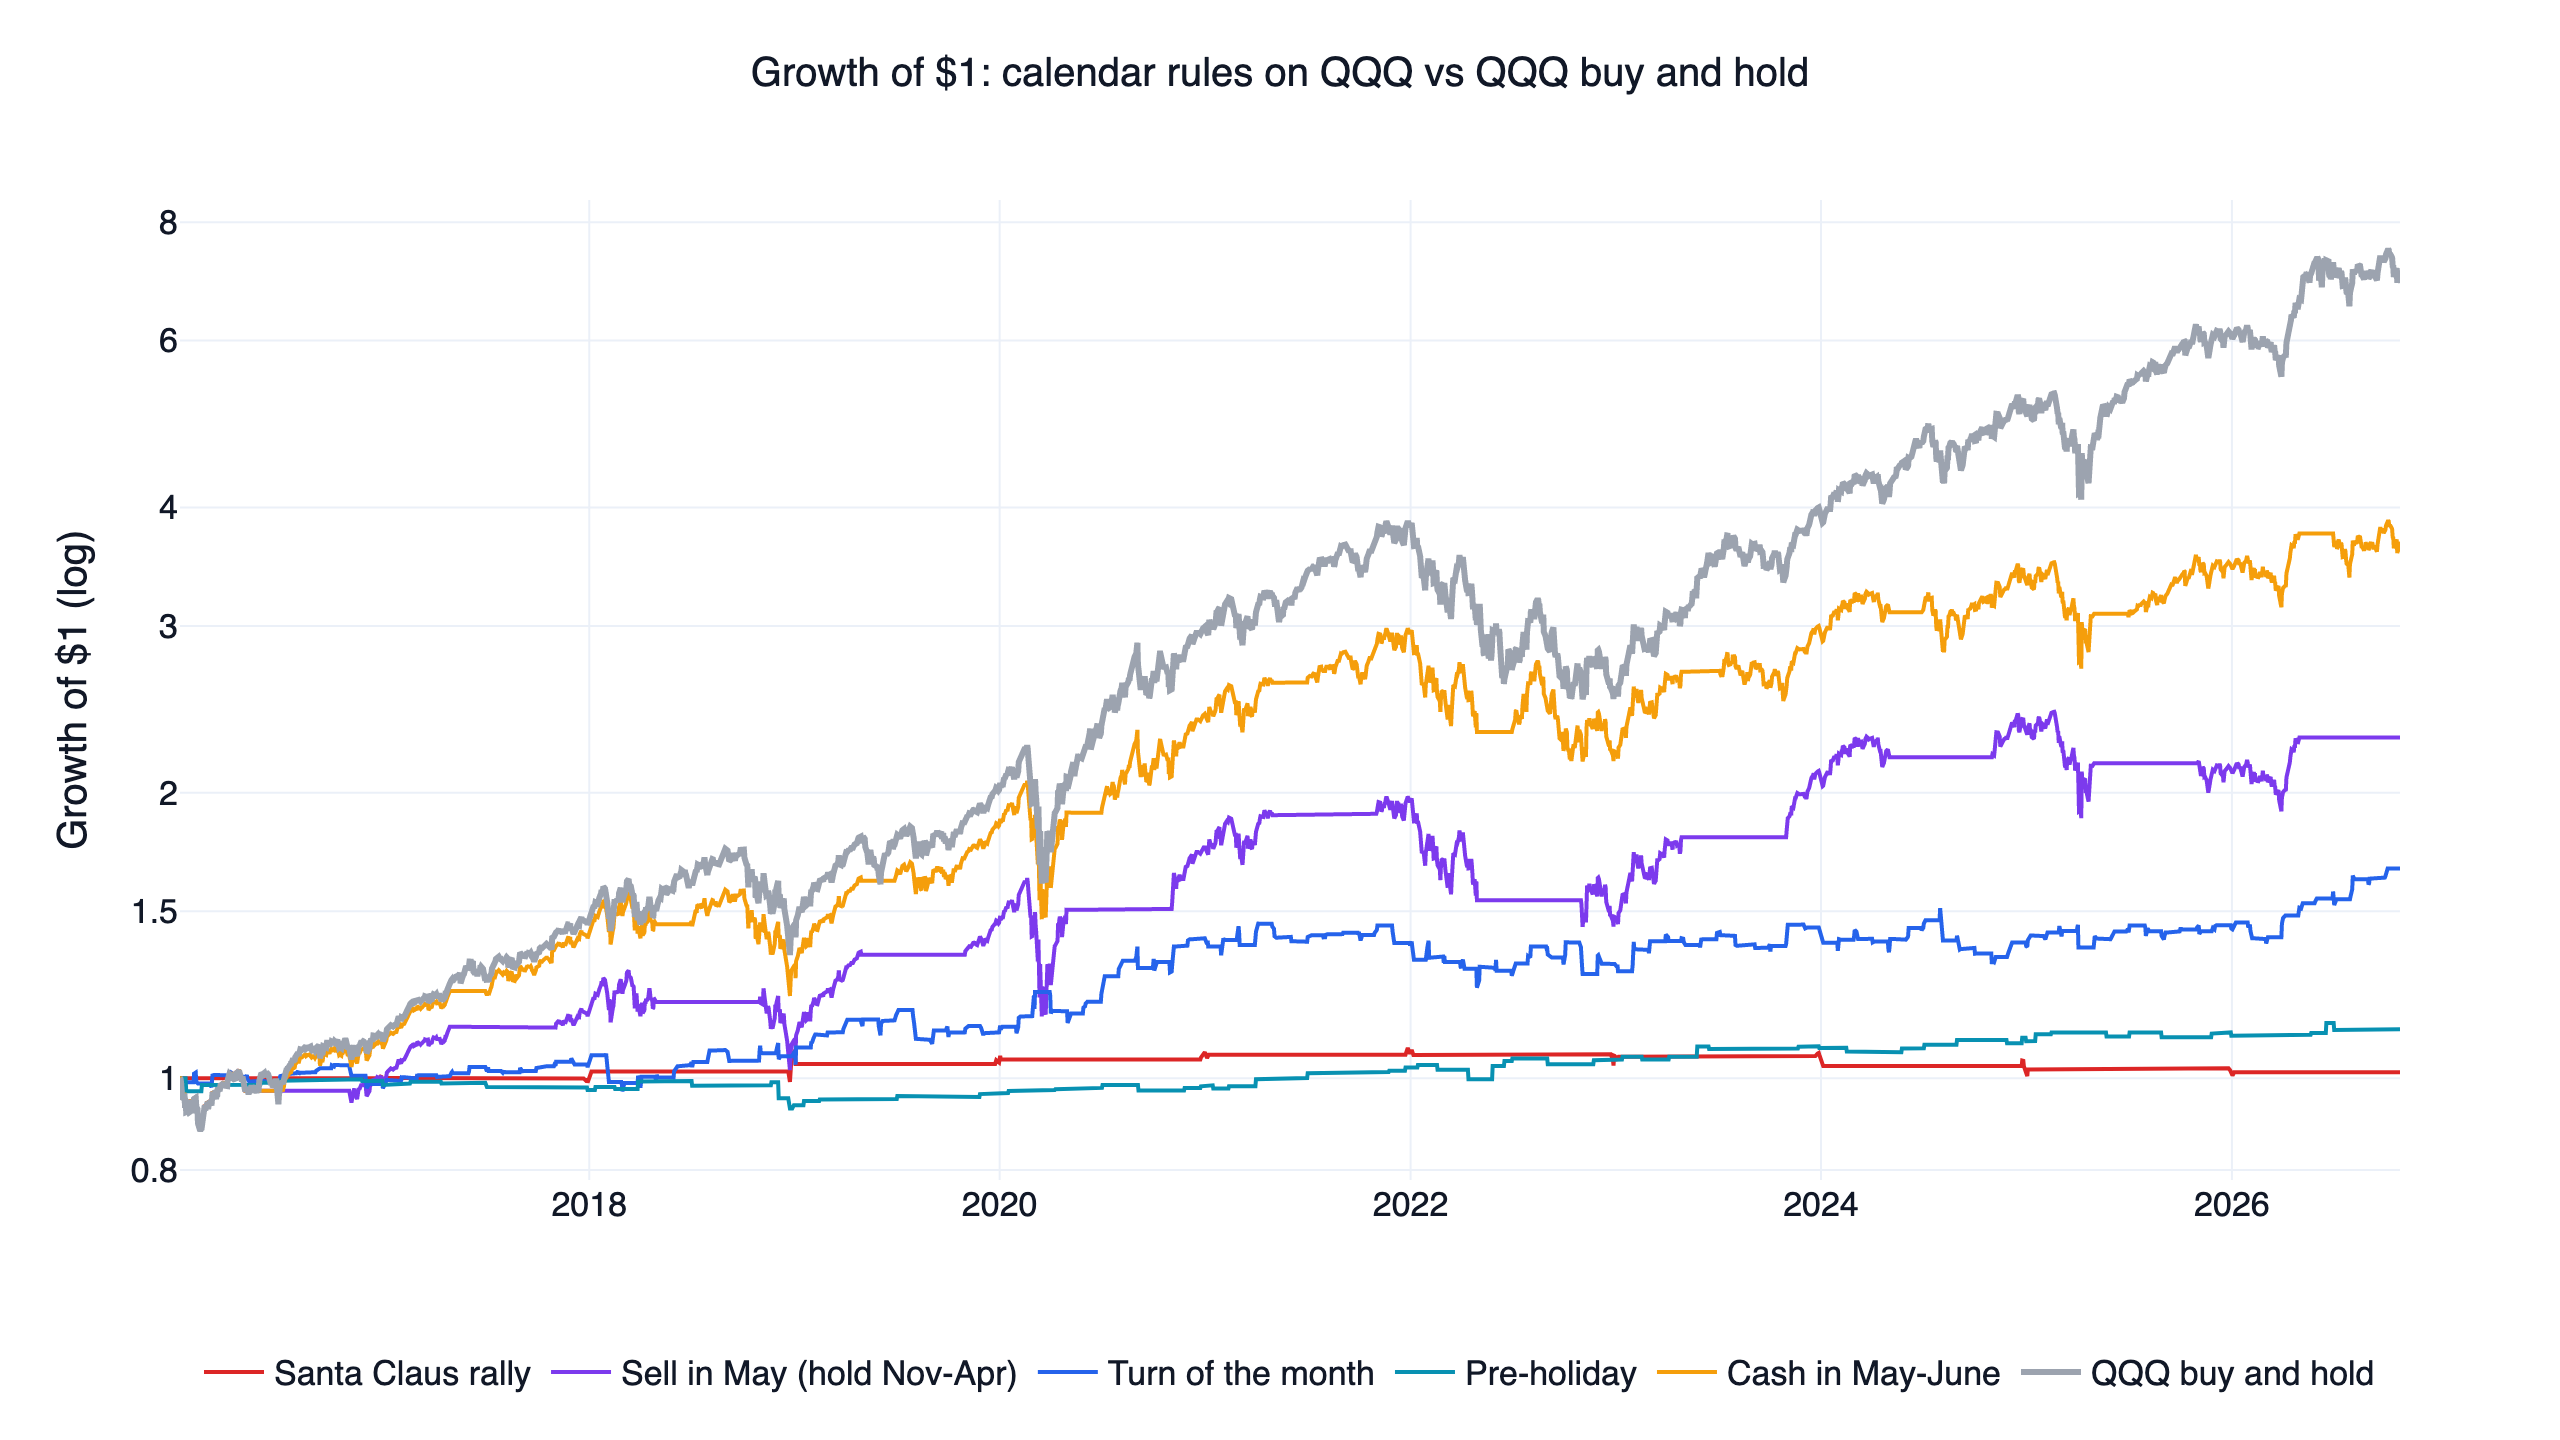
In dollars the gap is larger. One dollar in QQQ grew to 3.68, holding only November through April 1.66, the pre-holiday days 1.01. The flat stretches in the chart are the months each rule spends in cash.
Result 2: no setting beats QQQ
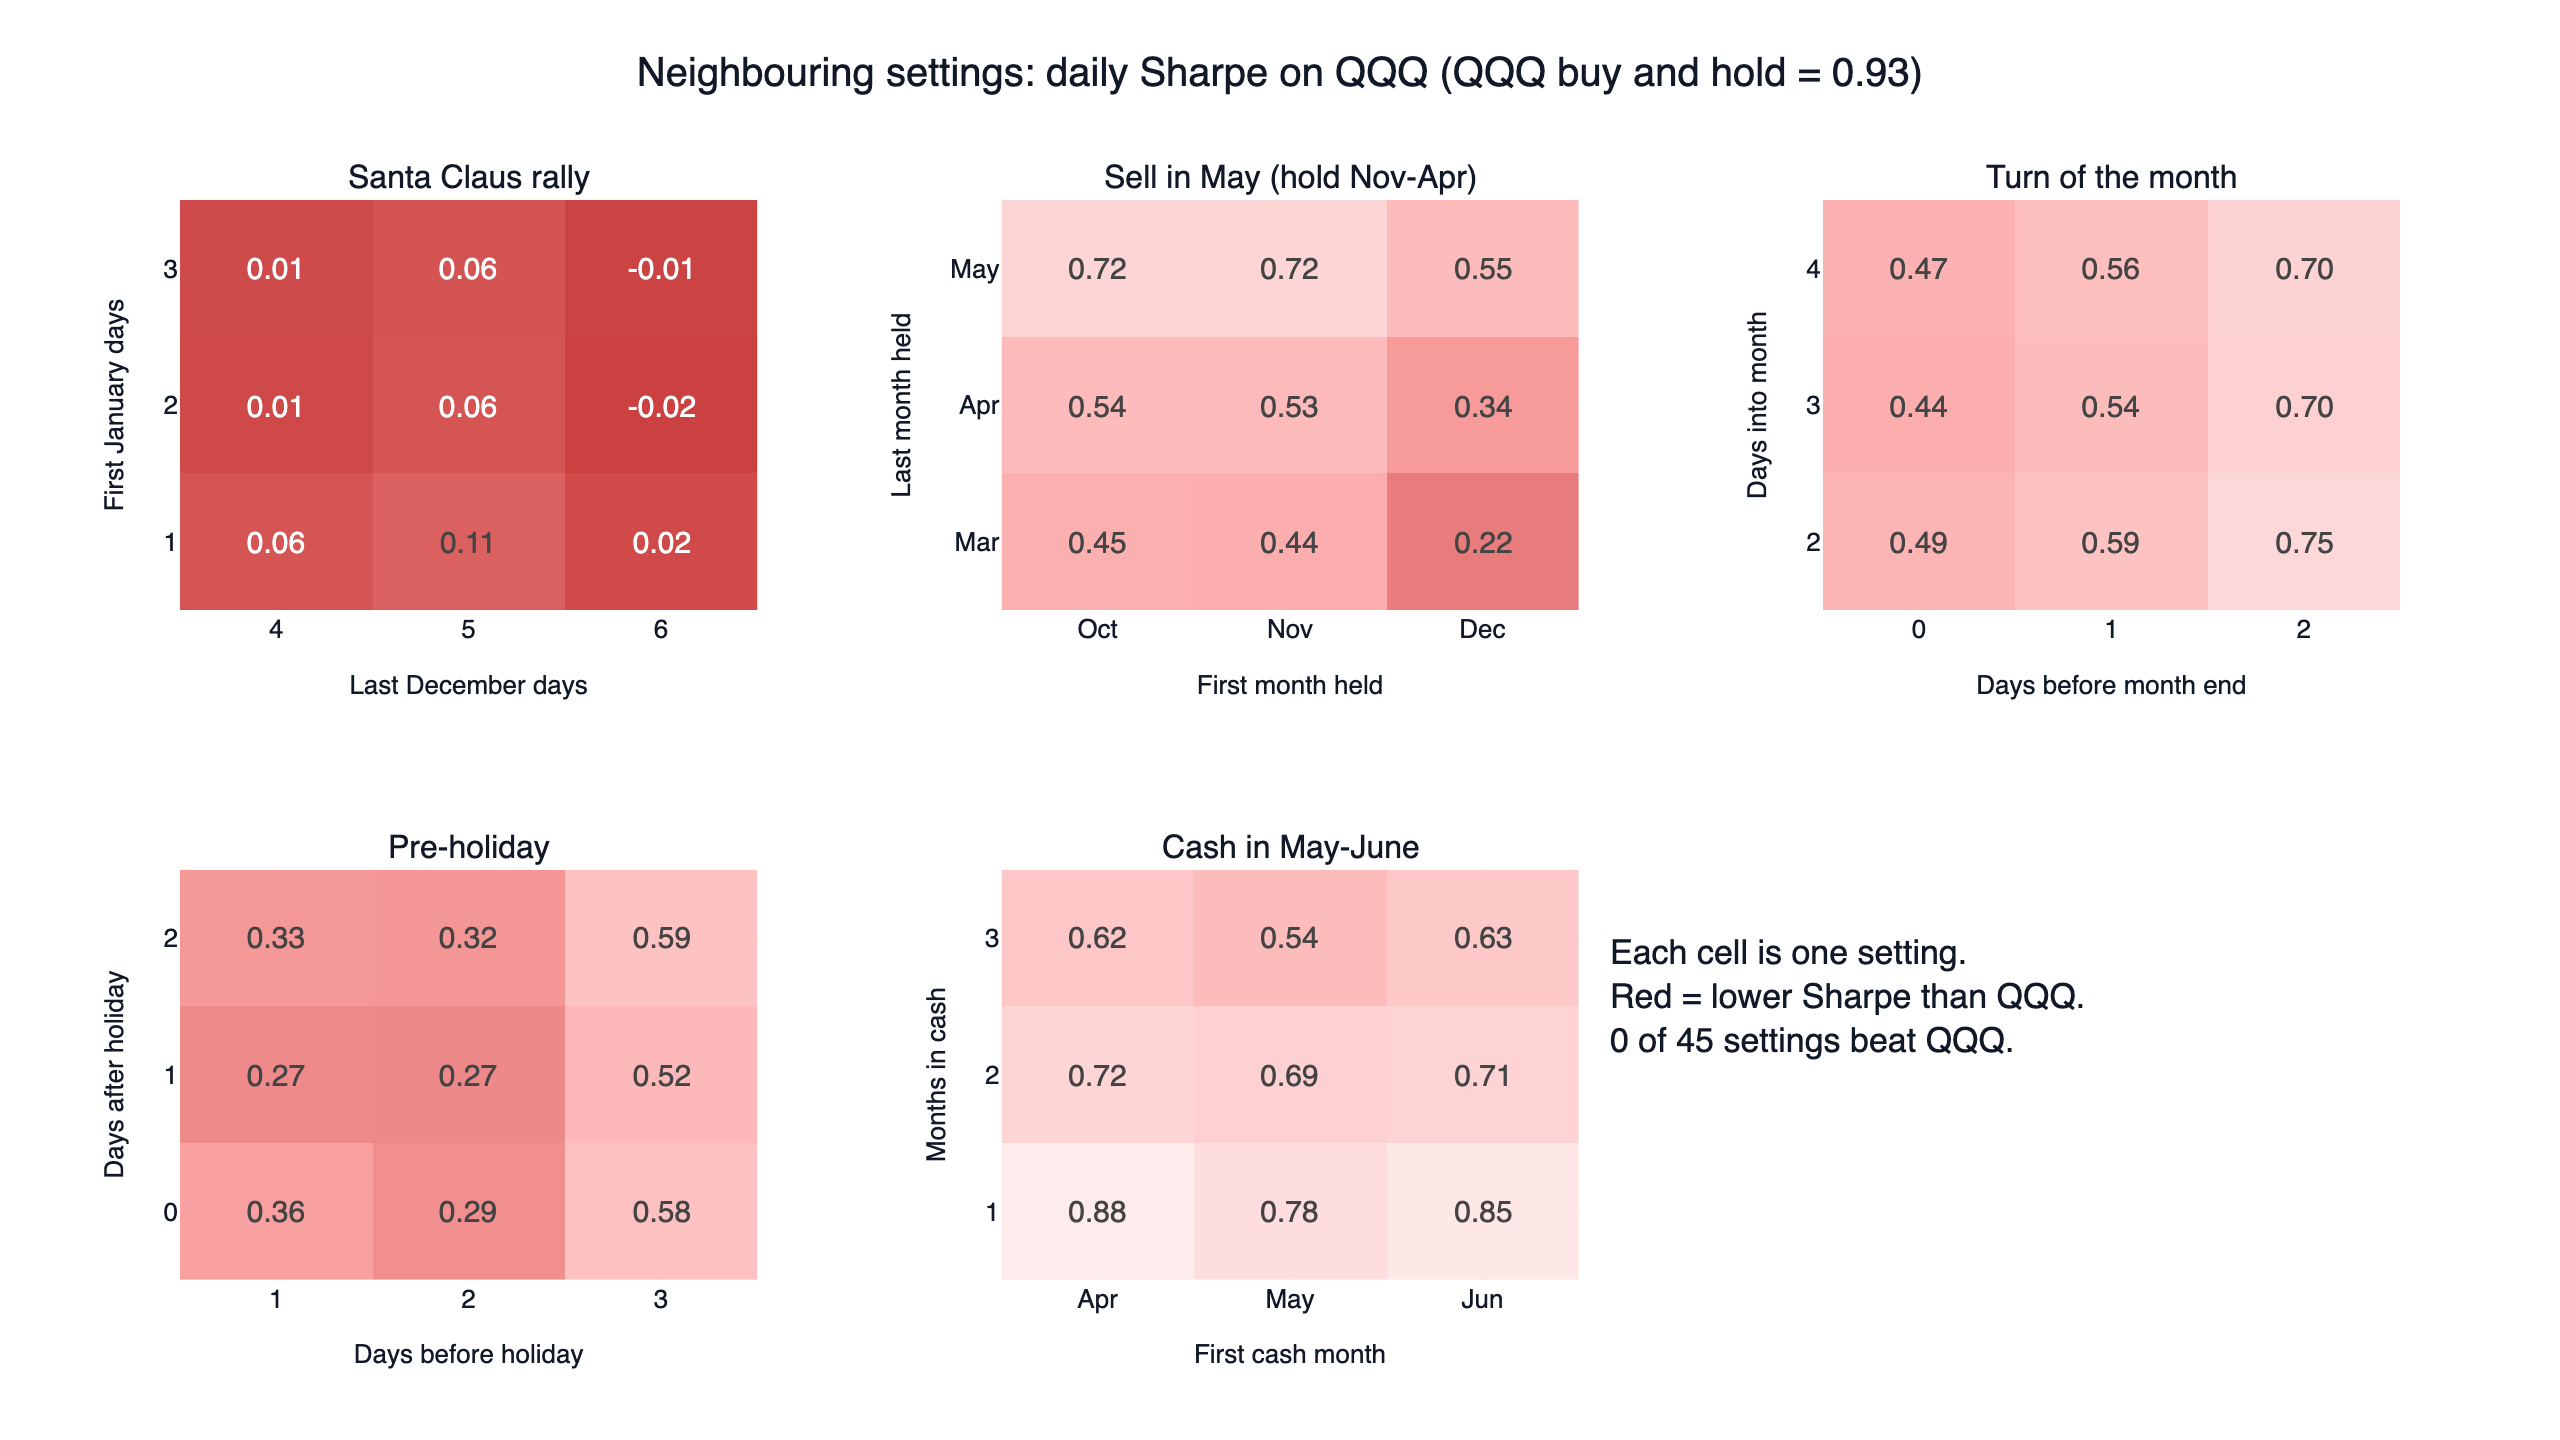
Each grid is one rule; the number in each cell is that setting's Sharpe on QQQ, and the colour is the gap to QQQ's 0.93. All 45 cells are below it, and so are all 45 SPY settings. The best single setting was one month in cash starting in April: 0.88 on QQQ and 0.83 on SPY. The Santa Claus grid is uniformly poor, from -0.02 to 0.11. Sell in May improves when the holding period runs into May (0.72), which means the rule does better the less of "sell in May" it actually does.
Result 3: the halves and the costs
QQQ's own Sharpe was 1.09 in the first half (January 2016 to May 2021) and 0.78 in the second. No rule beat it in the first half. In the second half, only the SPY version of the pre-holiday rule did (0.89 against 0.78); on QQQ the same rule scored 0.02 and 0.69. The other four rules weakened after May 2021, and the Santa Claus rally on QQQ turned negative (-0.32).
The cost check hits the rules that trade often. The turn-of-the-month rule makes 12 round trips a year; at 0.1% per side that is about 2.4% a year, and its CAGR on QQQ fell from 4.8% to 2.3% and its Sharpe from 0.54 to 0.29. The pre-holiday rule trades about nine times a year, and costs turned its 1.1% CAGR into -0.8%. The two slow rules barely moved: Sell in May went from 0.53 to 0.52 and cash in May-June from 0.69 to 0.68.
Why calendar rules struggle to beat QQQ: time in the market
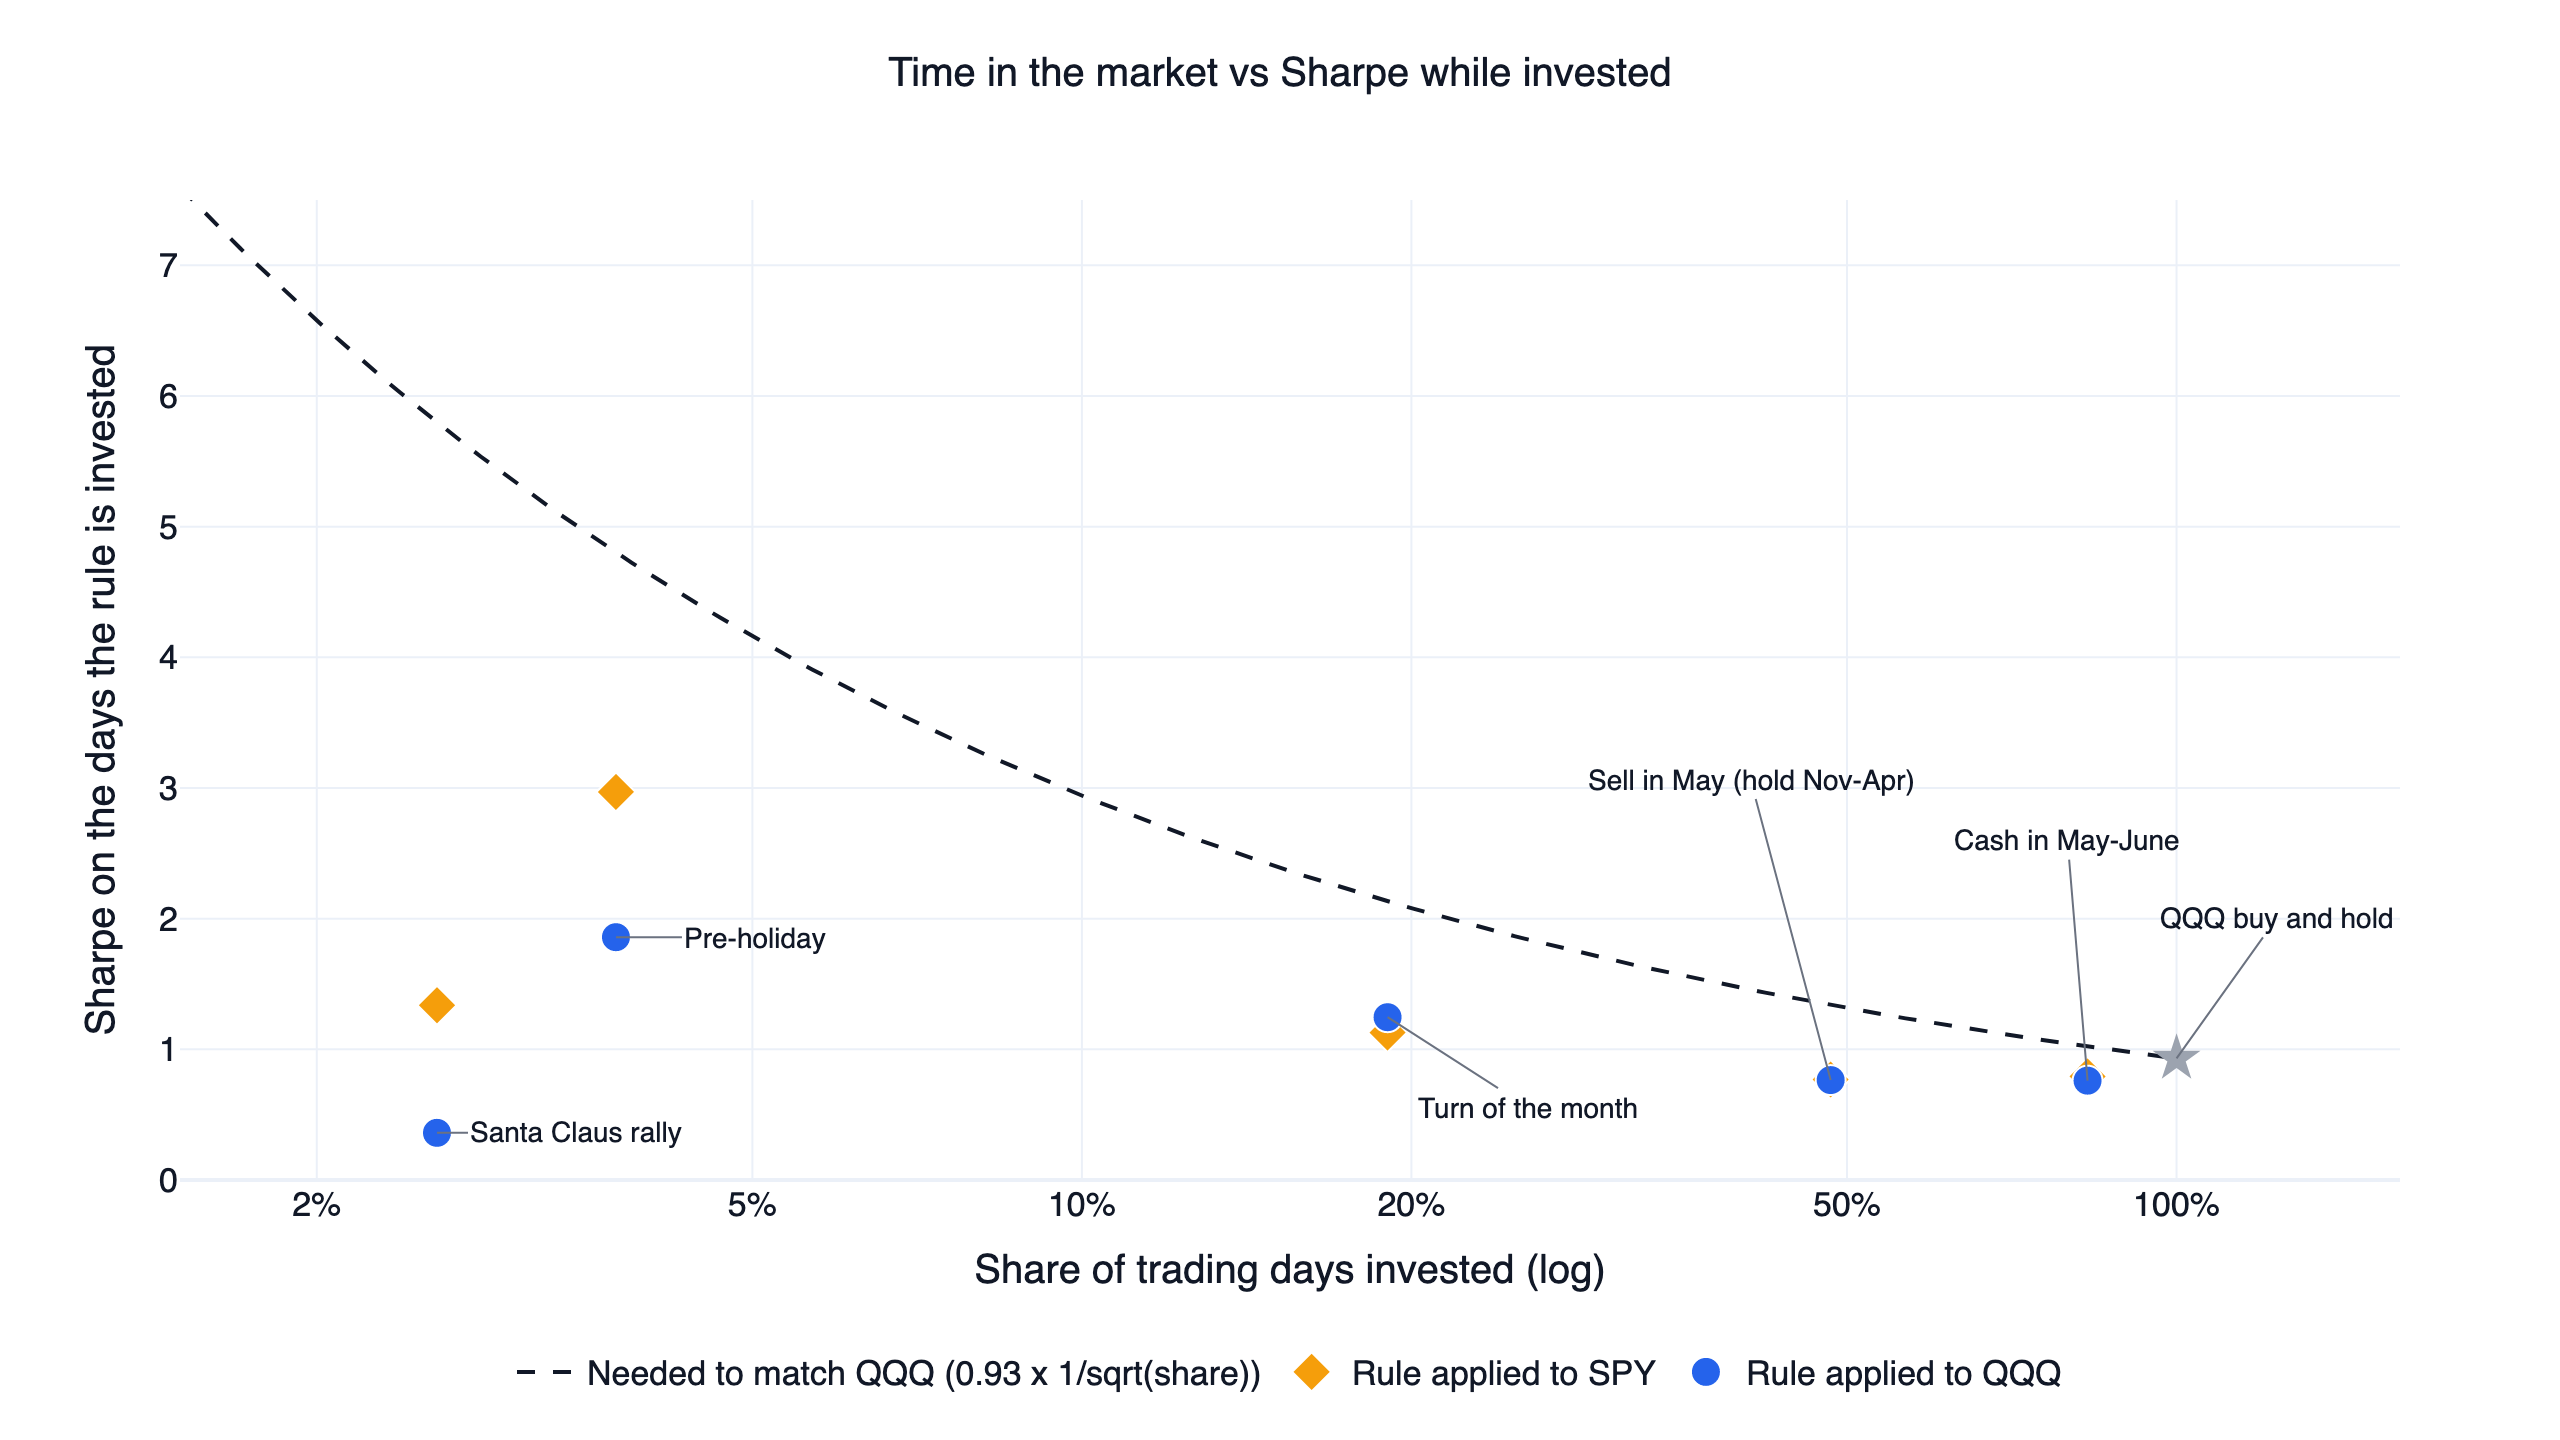
A rule that is invested on a fraction of days and earns nothing in between has a full-period Sharpe of roughly √(fraction) × its Sharpe on the invested days. To match QQQ's 0.93, the Santa Claus rally, invested 2.6% of the time, would need a Sharpe of about 5.8 during its seven days. The pre-holiday rule (3.8% invested) would need 4.8, the turn of the month (19%) 2.1, Sell in May (48%) 1.3, and cash in May-June (83%) 1.0.
The chart plots what each rule actually achieved on its invested days. The pre-holiday day on SPY had the highest Sharpe on its invested days, 3.0, and the turn of the month on QQQ reached 1.25, both above QQQ's 0.93 over all days. Those days were good days. The rules still lose because they give up every other day, and in a decade when QQQ compounded at 19.9% a year, the other days carried most of the return: the turn-of-the-month days were 19% of all trading days and produced 26% of QQQ's total log return.
Effect by effect: what is still there
The three checks ask whether a rule beats the index. A separate question is whether the calendar pattern itself still shows up in the daily returns. Across the five, none of the in-window versus out-of-window differences was statistically significant; the largest t-statistic was 1.23, for May and June, and it points the opposite way from the saying.
Santa Claus rally: weaker than the average seven-day stretch
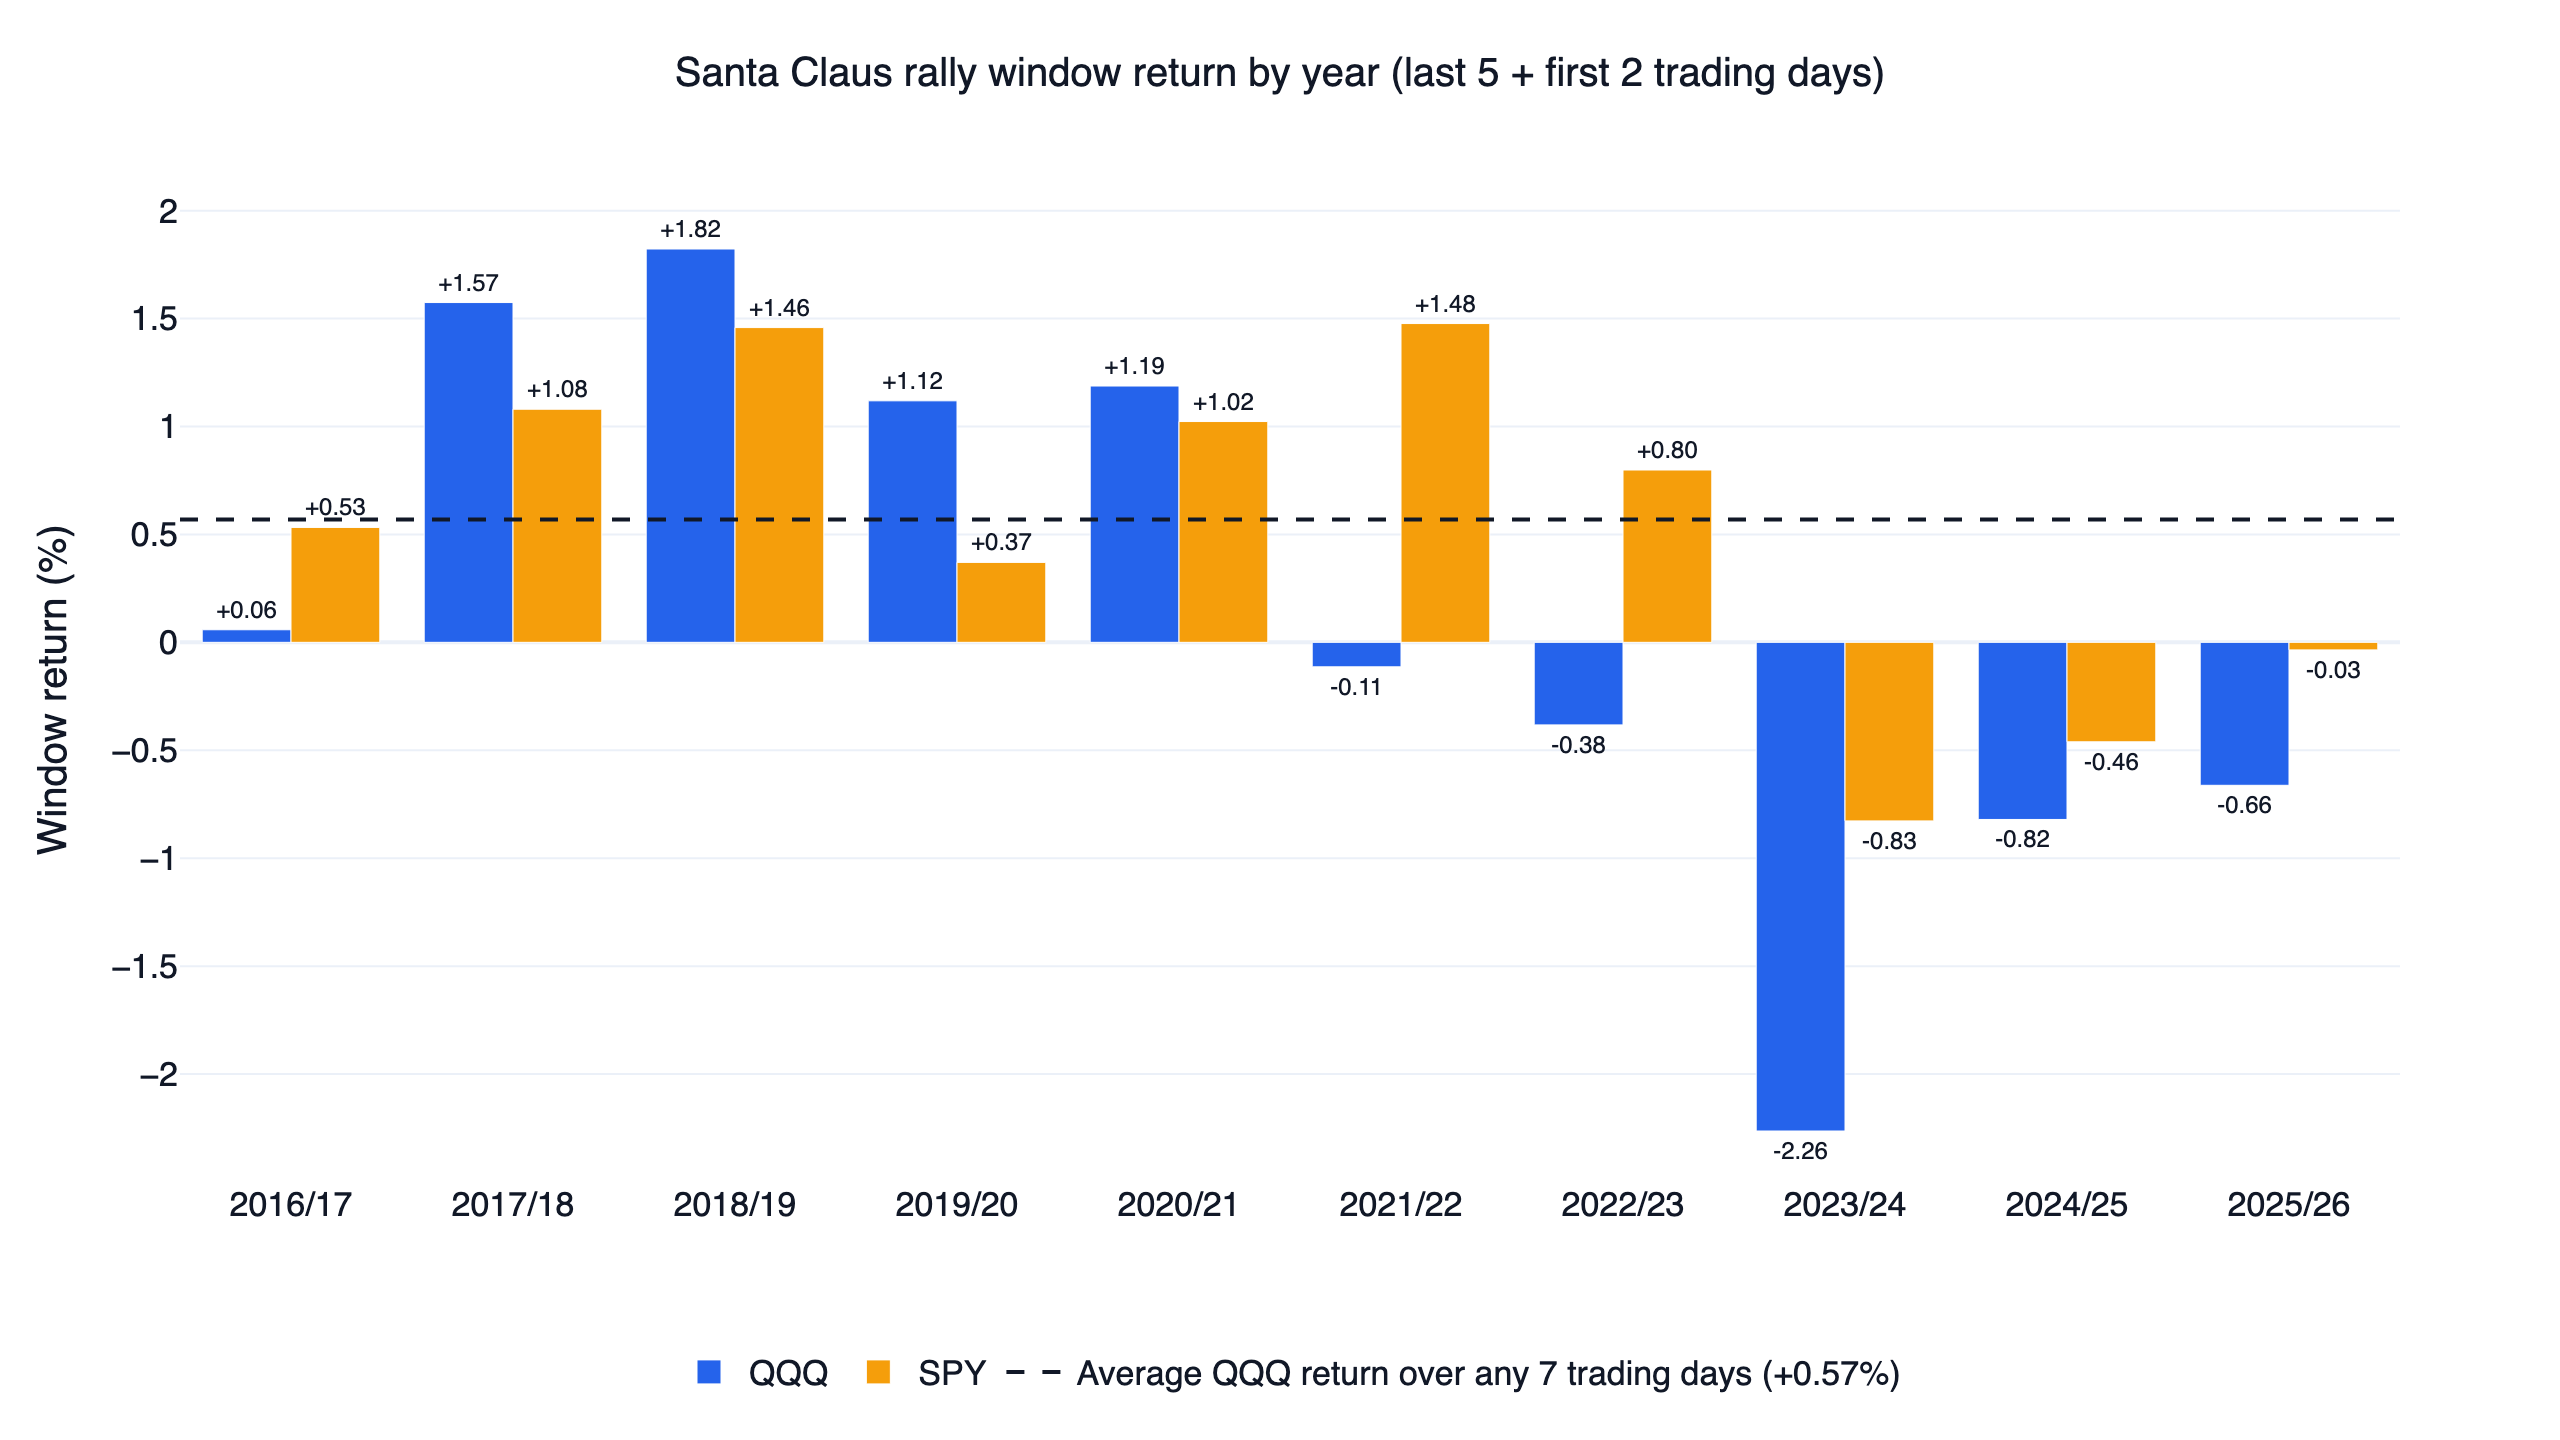
On QQQ the seven-day window rose in 5 of 10 years, by 0.15% on average (median -0.03%). Any seven consecutive trading days in the same decade averaged 0.57% and rose 62% of the time. The first five windows were all positive and the last five all negative, the worst being -2.3% in 2023/24. SPY did better, rising in 7 of 10 years with an average of 0.54%, slightly above its average seven-day stretch (0.44%), but its last three windows were also negative, the latest by only 0.03%. The QQQ rule finished the decade with a total gain of 1.5%.
Turn of the month: the days are better, but not enough
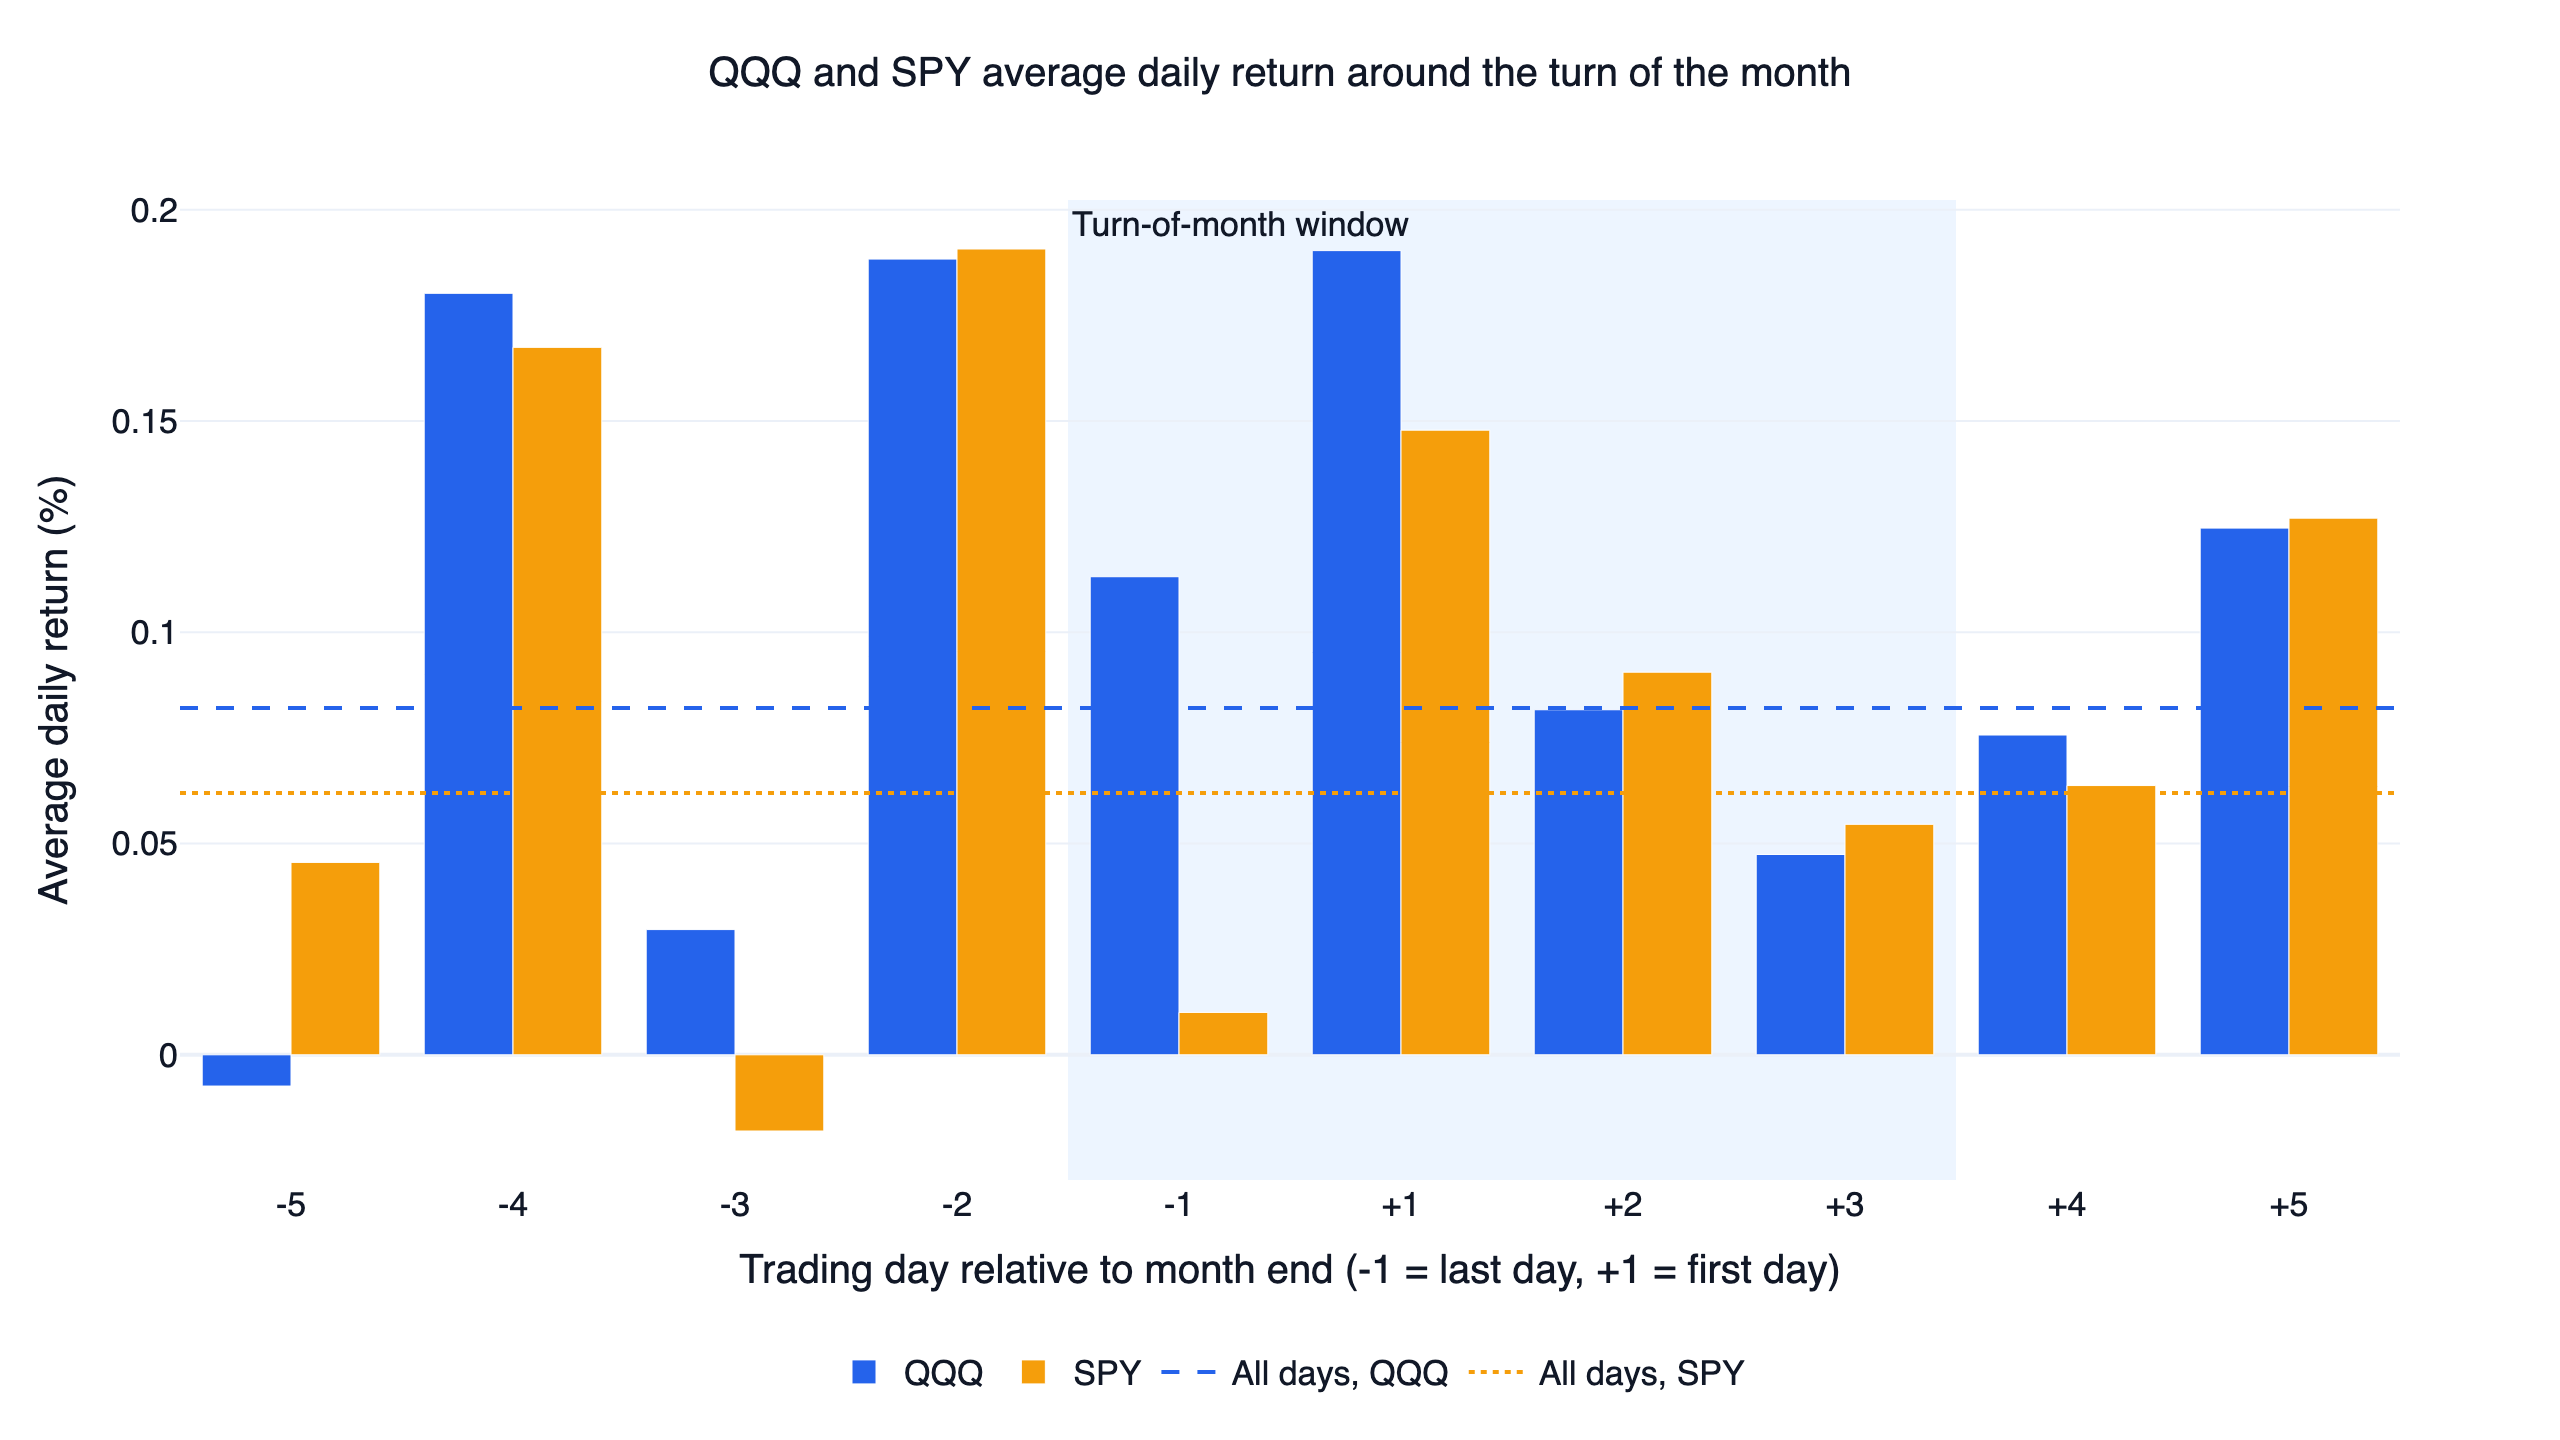
The first trading day of the month was among the best days for QQQ (0.19% on average) and SPY (0.15%). Across the four-day window, QQQ averaged 0.108% a day against 0.076% on the other days (t = 0.47), and SPY 0.076% against 0.059%. The chart also shows that two days just outside the window, the fourth-to-last and second-to-last trading days of the month, were as strong as the first day of the month, so the edge in this decade was spread over the last week of the month more than concentrated in the four days the papers describe. The four-day window rose in 60% of months, the same rate as any four days.
Pre-holiday: still positive, too rare to matter
The day before a holiday averaged 0.12% on QQQ and 0.15% on SPY, against 0.08% and 0.06% on other days, and rose 66% and 65% of the time. On SPY that is about 2.5 times an average day, closer to Ariel's finding than any other result in this test, though with 102 holidays it is not significant (t = 1.09). It is also not enough to cover the cost check: 0.2% of round-trip cost is more than the 0.15% average gain. The day after a holiday was weak on SPY (-0.07%).
Sell in May and May-June: the wrong half of the year
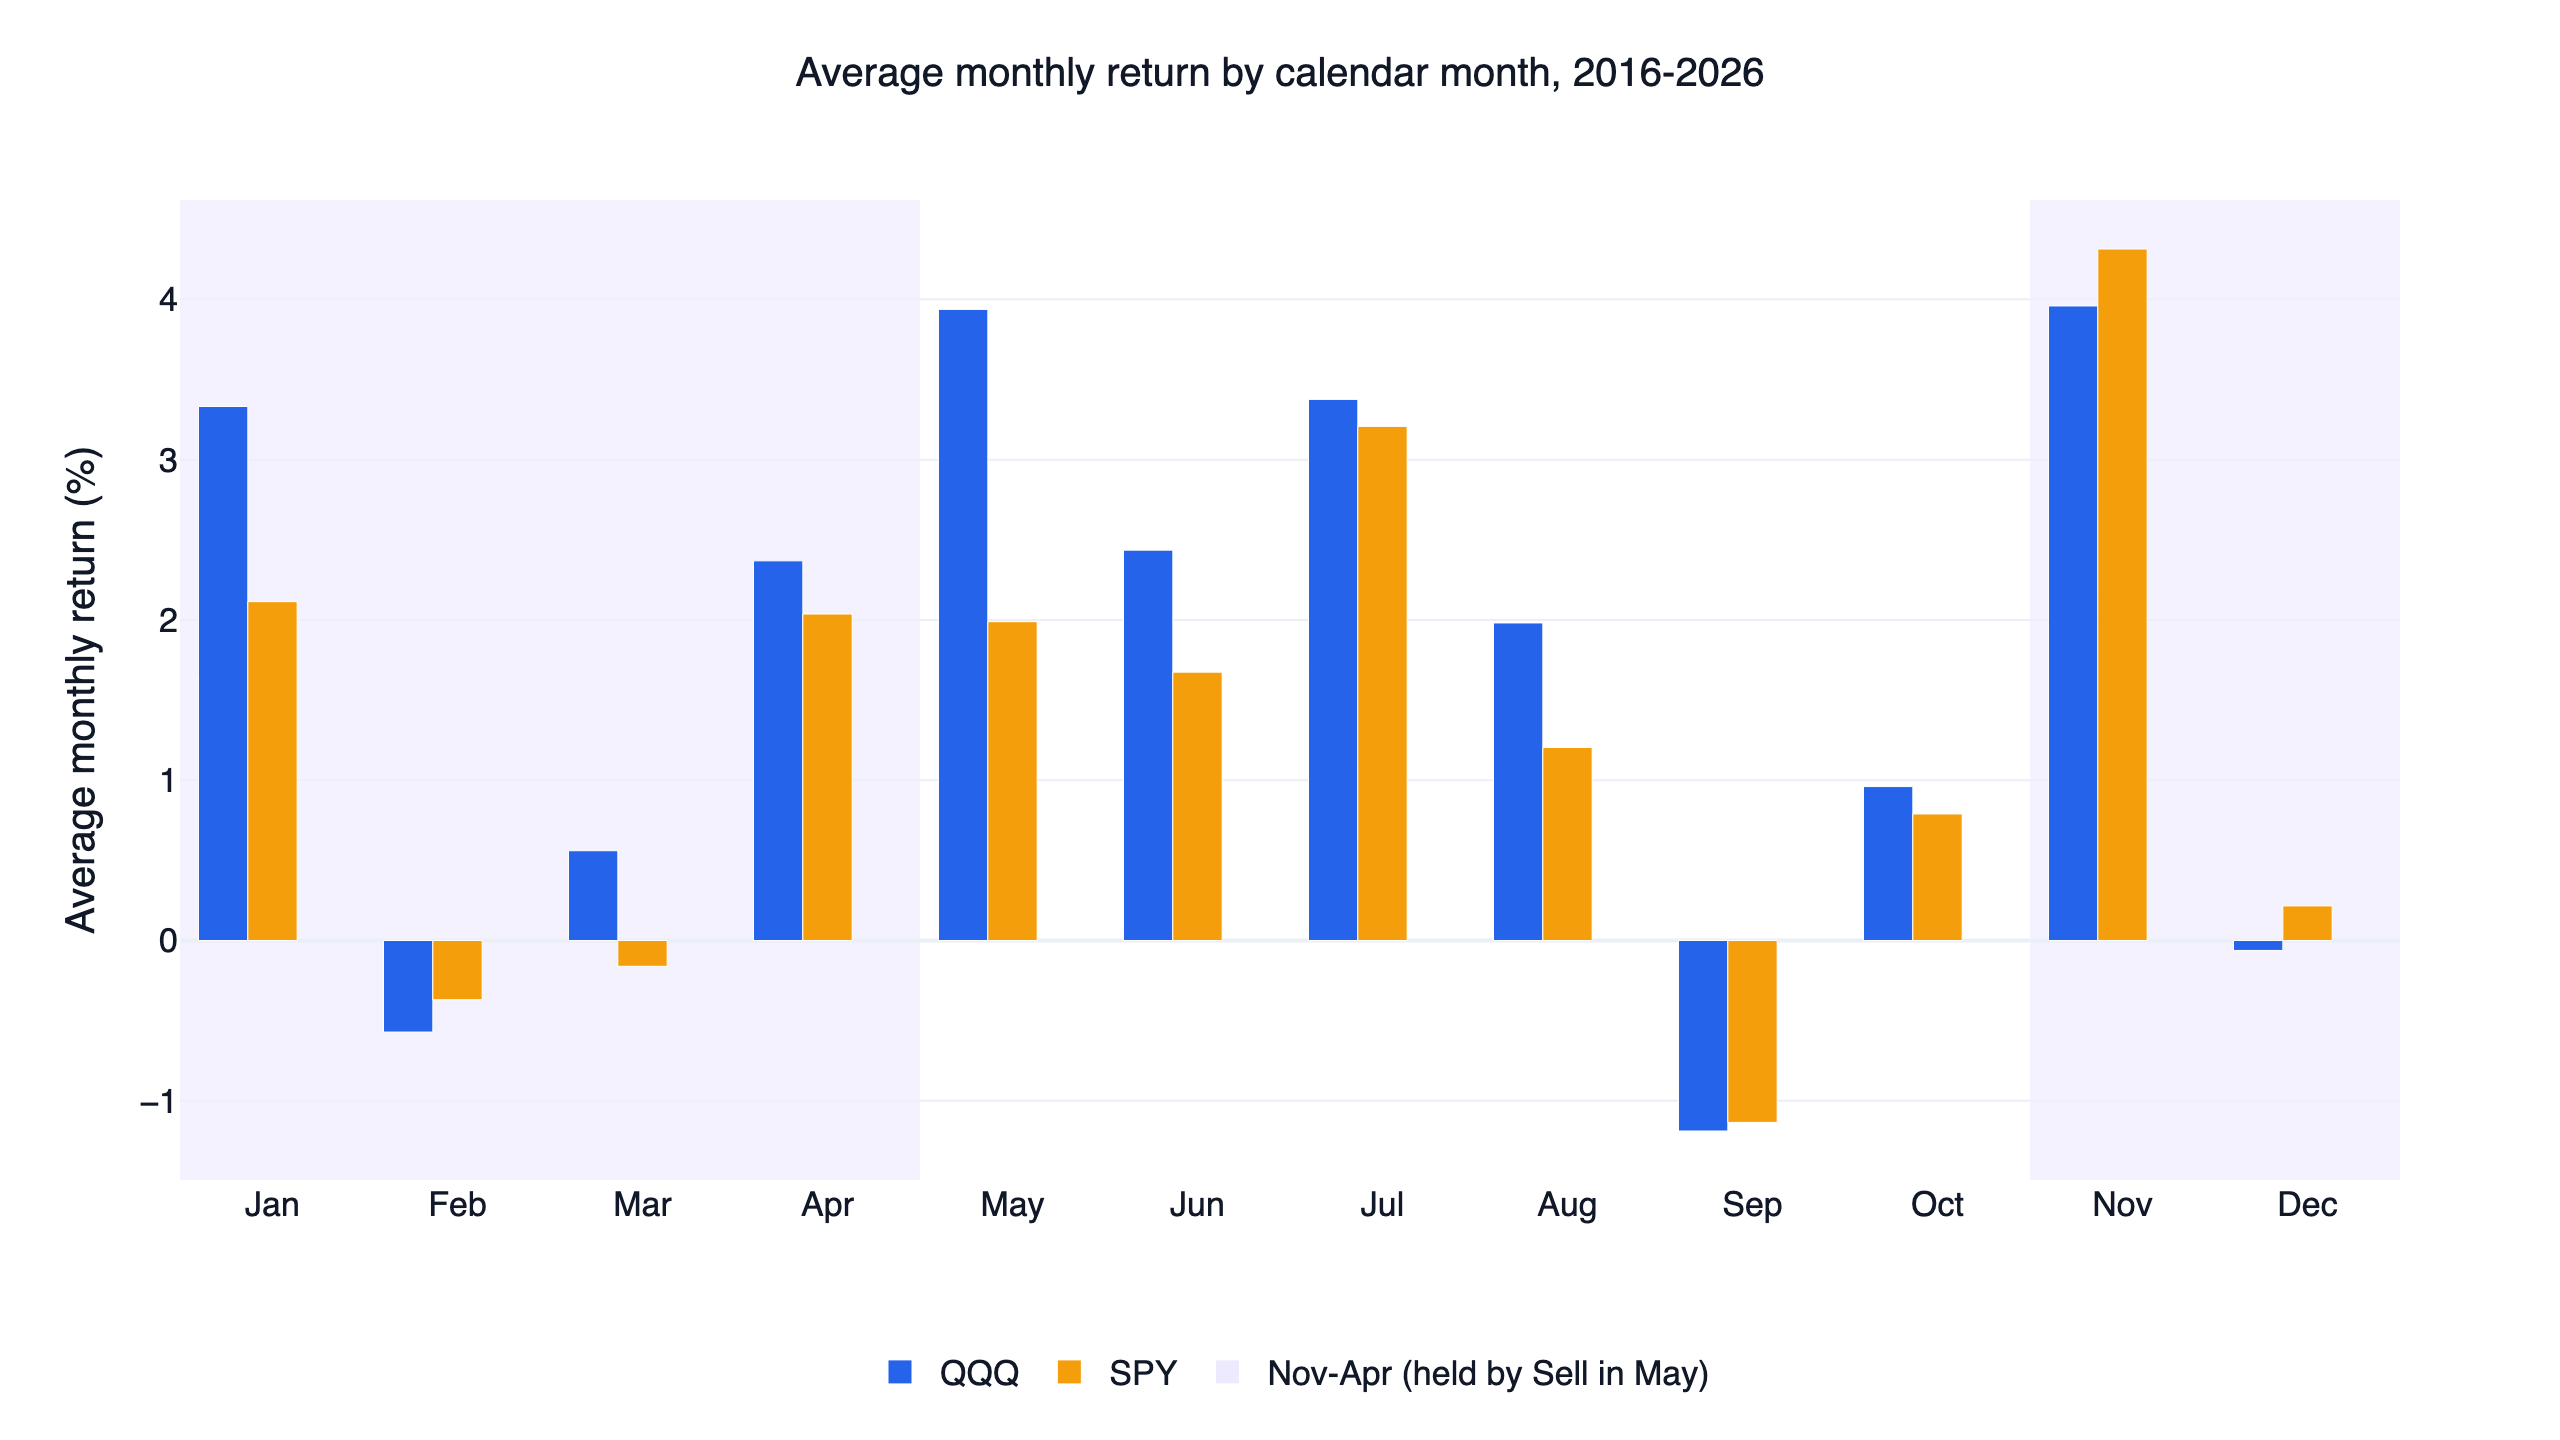
In this decade the "summer" months were not weak. QQQ's average daily return from November to April was 0.075% against 0.089% from May to October; for SPY the two halves were equal (0.063% and 0.061%). November to April beat the preceding May to October in 6 of 10 years for QQQ and 5 of 10 for SPY. The biggest miss was 2025: QQQ rose 32.6% from May to October, all of which the rule sat out.
For QQQ, May and June were the strongest stretch of the year. May was QQQ's second-best month on average (3.9%, just behind November's 4.0%) and June averaged 2.4%. QQQ fell over May and June in only 2 of 11 years (2019 and 2022), and SPY in 1 of 11 (2022). September was the weakest month, averaging -1.2% for QQQ and -1.1% for SPY.
The code
The core of the Santa Claus test fits in a few steps: mark the window on the trading calendar, give finlab's sim() a position that owns QQQ on exactly those days, and compare with QQQ buy and hold.
Show Code
import pandas as pd
import finlab
from finlab import data
from finlab.backtest import sim

finlab.login()  # finlab guides you through login automatically
data.set_market("us_fund")

# 1. QQQ with dividends reinvested, and its trading days
close = data.get("us_fund_price:adj_close")["QQQ"].dropna()
days = close.index

# 2. Mark the Santa Claus rally window:
#    the last 5 trading days of December and the first 2 of January
counter = pd.Series(1, index=days)
month = days.to_period("M")
day_in_month = counter.groupby(month).cumcount() + 1
days_to_month_end = counter.groupby(month).cumcount(ascending=False) + 1
december = (days.month == 12) & (days_to_month_end <= 5)
january = (days.month == 1) & (day_in_month <= 2)
in_window = december | january

# 3. sim() trades a signal at the next trading day's close, so the signal
#    goes in two trading days early: buy at the close before the window,
#    sell at the close of its last day.
signal = in_window.shift(-2, fill_value=False)
position = signal.astype(float).to_frame("QQQ")
report = sim(position, resample=None, trade_at_price="close", upload=False)

# 4. Daily Sharpe of the rule vs buying and holding QQQ over the same days
equity = report.creturn.reindex(days).ffill().fillna(1.0)
for name, curve in [("Santa Claus rally", equity), ("QQQ buy and hold", close / close.iloc[0])]:
    daily = curve.pct_change().dropna()
    print(name, round(daily.mean() / daily.std() * 252 ** 0.5, 2))
With data through 2026-10-27 this prints 0.06 and 0.93. Shifting the signal two days earlier does not peek at future prices: the trading calendar is published years ahead. The full strategy.py runs all five rules on QQQ and SPY, adds the next two months of scheduled NYSE sessions so the last rows know where the month ends, and with --validate reproduces every grid, half and cost figure in this article.
Install the FinLab skill for your AI agent
You do not need to write the code above yourself. Install the FinLab skill in Claude Code, Codex or Gemini CLI with one command:
Show Code
npx skills add https://github.com/koreal6803/finlab-ai --skill finlabThen ask your agent in plain language, for example "test the Santa Claus rally on SPY, then rerun it with neighbouring parameters, on each half of the window, and with 0.1% cost per trade" or "show QQQ's average return on the day before each holiday". The AI agent setup page walks through each tool, the AI-assisted setup connects your FinLab account, and the same research runs in the browser at studio.finlab.finance.
Backtest method and limits
| Item | How it was handled |
|---|---|
| Window | 2016-01-04 to 2026-10-27, the full history of us_fund_price. Every curve starts on the first data day; QQQ and SPY are measured over the same dates. |
| Instruments | QQQ and SPY, dividend-adjusted closes (us_fund_price:adj_close). One ETF per run, 100% invested inside the window, 0% outside. |
| Cash | Idle cash earns nothing (finlab's default). Parking it in Treasury bills would have added interest, which is not modelled. |
| Signal timing | The calendar is known in advance. sim() executes a signal at the next trading day's close, so each signal is set two trading days early and the rule owns the ETF from the close before the window to the close of its last day. Our hand-computed returns match sim() to within 1e-14. |
| Holidays | 102 weekday market closures, taken from the trading days in the data. The two unscheduled closures (2018-12-05, 2025-01-09) were announced days ahead. |
| Costs | Default run: finlab USFundMarket defaults, zero commission and zero tax. Cost check: 0.1% per side. |
| Turnover | Round trips per year: Santa Claus 0.9, Sell in May 1.0, cash in May-June 1.1, pre-holiday 9.4, turn of the month 12.0. |
| Benchmark | QQQ total return, buy and hold, no costs; SPY shown for reference. Daily Sharpe without a risk-free rate. |
| Sample | All results are in-sample over about ten years: 10 Santa Claus windows, 10 Sell in May cycles, 130 month turns, 102 holidays. The halves are a stability check, not out-of-sample validation. Capacity was not estimated; SPY and QQQ are among the most liquid securities in the world. |
What this result does and does not say
It says that from 2016 to 2026, a QQQ or SPY investor who traded only on the calendar would have done worse on a risk-adjusted basis than one who held the index, under every nearby setting we tried. It does not say the original findings were wrong. Lakonishok and Smidt used 90 years of data and Bouman and Jacobsen 29 years across 37 markets; ten years is a short sample, especially for an effect that happens once a year. It is also consistent with what happens to published anomalies in general: McLean & Pontiff (2016) found that returns to 97 published cross-sectional stock predictors were 58% lower after publication; calendar effects were not part of that study, but the weaker results here fit the same pattern.
The practical reading is narrower. The turn of the month and the day before a holiday still had better-than-average returns in this sample, but the differences were not statistically significant, which makes them weak grounds for timing new money. As stand-alone strategies they hold the market too rarely to keep up with it. A timing rule that did pass all three checks against QQQ since May 2016 is the US ETF rotation strategy, which trades on QQQ's trend and momentum and ignores the calendar. It holds 2x leveraged ETFs (QLD and SSO) in risk-on months, which adds leverage risk and volatility decay, and it reports a 19.3% maximum drawdown. Other US research is collected in the US quant strategies overview and the 10-factor study, which found the same thing for stock-picking factors: none beat QQQ.
FAQ
Does the Santa Claus rally still work? Not on QQQ in this decade. The window rose in 5 of 10 years with an average gain of 0.15%, less than the 0.57% average of any seven trading days, and it fell in each of the last five years. On SPY it rose in 7 of 10 years, but a rule that only holds those seven days had a Sharpe of 0.22 against 0.93 for QQQ.
What are the Santa Claus rally dates? In Hirsch's definition, the last five trading days of December and the first two trading days of January. For 2026 that means buying at the close on December 23 and selling at the close on January 5, 2027, because Christmas Day and New Year's Day are market holidays.
Is "sell in May and go away" true? Not for US large caps over 2016-2026. QQQ's average daily return from May to October was higher than from November to April, and holding only November to April had a Sharpe of 0.53 against 0.93 for QQQ. May was QQQ's second-best month on average.
What is the turn-of-the-month effect? The tendency for stocks to rise in the last trading day of a month and the first three of the next, documented by Lakonishok and Smidt (1988) and McConnell and Xu (2008). In this test those days still beat the average day (0.108% against 0.076% a day on QQQ), but holding only them returned 4.8% a year against QQQ's 19.9%.
Do stocks go up before holidays? On average, yes, in this sample: the day before a market holiday averaged 0.15% on SPY, about 2.5 times an ordinary day, and rose 65% of the time. It happens only about nine times a year, so trading it alone earned 1.4% a year before costs and lost money after 0.1% per side.
Which month is best for stocks? For QQQ from 2016 to 2026, November (3.96%) and May (3.94%) had the highest average returns, followed by July and January. September was the worst at -1.2%. These are averages of 10 or 11 observations each and say little about any single year.
Why compare with QQQ instead of the S&P 500? QQQ is the benchmark FinLab uses for every US strategy, so results are comparable across the site. SPY buy and hold (Sharpe 0.88) is in the summary table and the first chart, and every rule was also run on SPY; none of the 45 SPY settings beat QQQ.
Can I rerun this myself?
Yes. Install the FinLab skill through the AI-assisted setup, download strategy.py below, and run python strategy.py --validate.
Reproduce it yourself
- strategy.py: all five rules on QQQ and SPY, the 90-setting grid, both halves and the cost check.
- data.csv: daily equity curves of every rule on QQQ and SPY, plus QQQ and SPY buy and hold.
- metrics.json: every statistic quoted in this article, including all 90 grid settings.
More US research is on the FinLab blog. The team behind it is on the about page, examples of what users build are on use cases, and metric definitions are in the glossary.
Last updated: 2026-10 | Backtest window: 2016-01 to 2026-10 | Benchmark: QQQ total return | Author: FinLab Quant Research (reviewed by a quantitative researcher)
Past performance does not represent future results, and every result here is an in-sample backtest. This content is for education only, is not investment advice, and does not constitute investment advice.
FinLab AI
Want to build your own strategy?
Describe your stock-picking ideas in natural language. AI automatically validates, backtests, and gives you answers
Start Free