Run this strategy
Copy the prompt to reproduce the evidence above with the article’s data, assumptions, and risk checks.
Tell your AI:
Help me set up FinLab and reproduce this article. Please read: https://finlab.finance/en/setup?relatedUrl=/en/blog/vix-us-stock-crash-investing-python
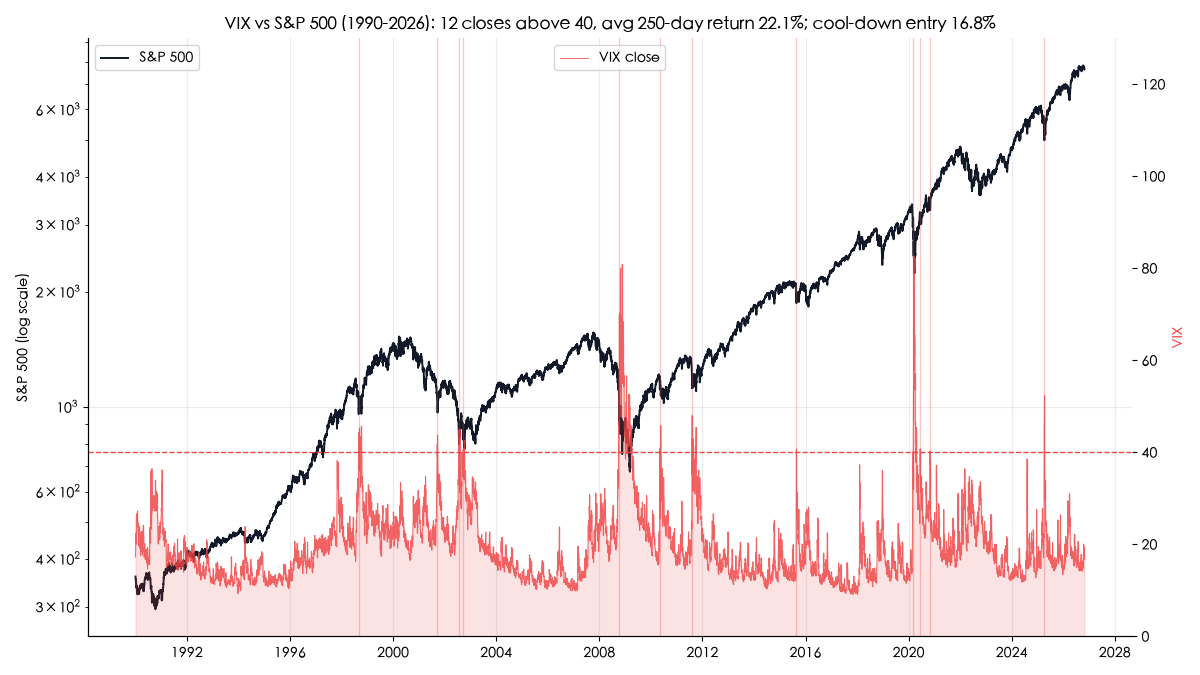
Between January 1990 and October 2026, the VIX closed above 40 in a fresh panic only 12 times. Buying the S&P 500 at the close on each of those days and holding for 250 trading days (about a year) returned +22.1% on average, more than double the +10.1% you got from buying on any day at random. That part of the "buy when the VIX is above 40" rule holds up well.
What does not hold up is the idea that the signal can replace owning the index. Turned into a rule-based strategy that buys SPY after the panic cools and holds it for a year, it compounded at 4.70% a year against 10.80% for SPY buy-and-hold from 1993. In three robustness checks against QQQ it passed only the trading-cost test and failed both the neighbouring-parameter test and the two-halves test. The signal is a reasonable guide for when to put spare cash to work; it is a poor substitute for staying invested.
FinLab first ran this test in Chinese in July 2020, when the data ended in 2019 and the signal had fired only four times. This version applies the same rules, unchanged, to the full record from January 1990 to 26 October 2026, and checks each of the original conclusions against it.
The numbers at a glance
| Entry rule (S&P 500, 1990-2026) | Signals | Average 250-day return | Win rate | Worst case |
|---|---|---|---|---|
| Signal A: buy the day the VIX first closes above 40 | 12 | +22.1% | 83% | -14.3% (2001) |
| Signal B: VIX was above 40, buy when it closes back below 30 | 10 | +16.8% | 90% | -18.5% (2001) |
| Any day (unconditional baseline) | 9,000+ days | +10.1% | 81% | n/a |
Three findings stand out:
- The edge is in the size of the gain, not the odds. An average of +22.1% is more than twice the +10.1% baseline, but the win rate (83%) is barely above what a random day gives you (81%).
- Waiting for the VIX to cool down did not help. Signal B had a slightly higher win rate but a lower average return, and its worst trade (-18.5% in 2001) was deeper than anything Signal A produced.
- As a standalone strategy it lags buy-and-hold by a wide margin, mainly because a VIX close above 40 is so rare that the strategy sits in cash about three-quarters of the time.
What changed in the October 2026 update: four more months of data (through 2026-10-26). The VIX has not closed above 40 since 10 April 2025; its highest close from May 2025 onward was 31.05 on 27 March 2026, so neither event table gained a new entry. The three robustness checks are new in this version.
What the VIX actually measures
The VIX (Cboe Volatility Index) is the market's estimate of S&P 500 volatility over the next 30 days, annualized and backed out of S&P 500 option prices. Because investors pay up for put protection when stocks fall, it spikes in sell-offs, which is why it is called the fear index. It is a forward-looking 30-day measure, not a 12-month forecast.
The Cboe methodology prices a basket of out-of-the-money options across strikes to approximate a 30-day variance swap:
Here is the mid-quote of the option at strike , is the forward index level, is time to expiry (about 30 days) and is the risk-free rate. The intuition fits in one line: the more investors are willing to pay for insurance, the higher the VIX.
To translate the number into something tangible, divide by the square root of 12. A VIX of 20 implies an expected one-month move of about 20% / √12 ≈ 5.8% either way. A VIX of 40 implies about 11.5%: the options market is pricing a real chance of another 10% drop within a month. (This is an illustration of the units, not a quote.)
Since 1990 the median VIX close is 17.6, and the record close is 82.69 on 16 March 2020.
| VIX close | Typical market state |
|---|---|
| Below 15 | Calm, cheap insurance |
| 15 to 20 | Normal (the 36-year median of 17.6 sits here) |
| 20 to 30 | Nervous, usually during a visible pullback |
| 30 to 40 | Fear; most bear-market peaks in the VIX land here |
| Above 40 | Extreme fear: 12 first-time breaks in 36 years, about one every three years |
How the test works
"Buy when the VIX is high" cannot be tested until it is written down as a rule. The two rules below are the ones from the 2020 study, with no parameter changed:
- Signal A (buy the panic): buy at the close on the day the VIX first closes above 40. "First" means there was no close above 40 in the previous 30 trading days, so one panic is not counted several times.
- Signal B (buy the cool-down): the VIX closed above 40 at least once in the last 120 trading days, and today it closes back below 30. The same 30-day de-duplication applies. This was the 2020 study's preferred version: wait until the fear subsides.
Each signal buys the S&P 500 and holds for 250 trading days. The score is the forward return:
where is the index close on the signal day and is the holding period in trading days. The comparison is the average forward return from buying on every day in the sample and holding the same 250 days, which is a fairer yardstick than the index's annual return because it measures the same holding behaviour. Data are the ^VIX and ^GSPC series from Yahoo Finance (sourced from Cboe and S&P). Over the full sample the S&P 500 price index compounded at 8.7% a year without dividends; SPY, with dividends reinvested, compounded at 10.80% a year from its 1993 launch.
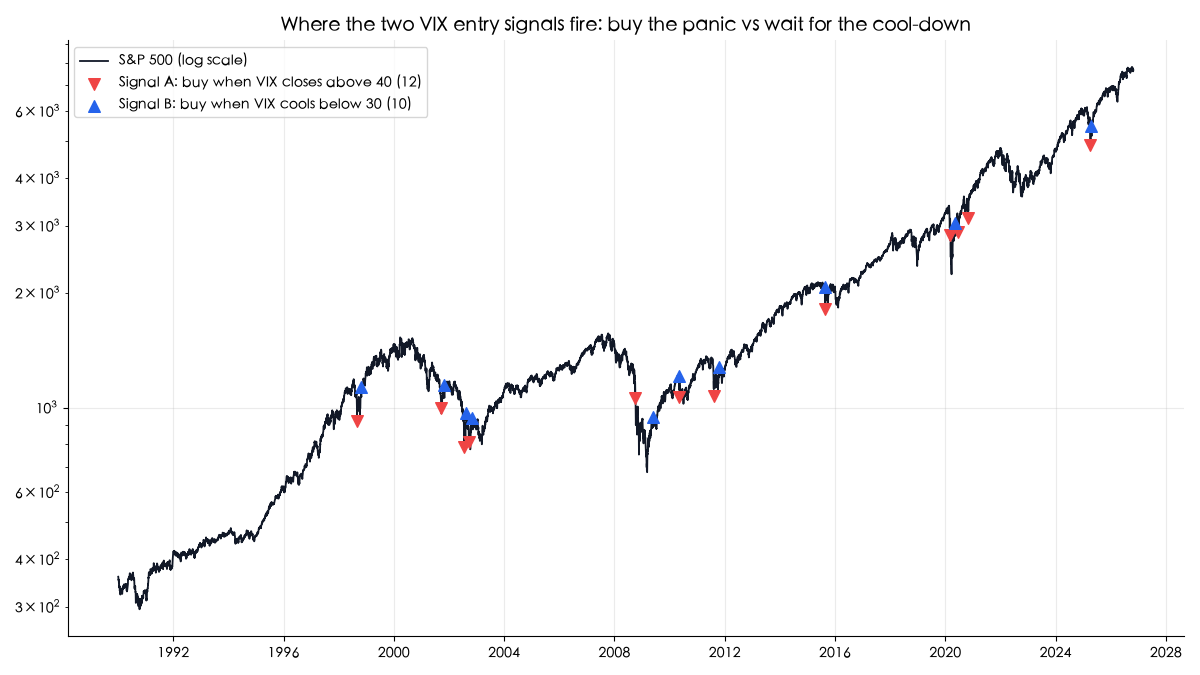
Signal A: all 12 times the VIX closed above 40
| Entry date | Event | VIX close | 250-day return | Deepest drawdown during hold |
|---|---|---|---|---|
| 1998-08-31 | LTCM and Russian default | 44.28 | +40.8% | 0.0% |
| 2001-09-17 | Market reopens after 9/11 | 41.76 | -14.3% | -23.2% |
| 2002-07-22 | Late dot-com bear market | 41.87 | +21.2% | -5.3% |
| 2002-09-19 | End of the dot-com bear | 40.65 | +21.7% | -7.9% |
| 2008-09-29 | Financial crisis, House rejects TARP | 46.72 | -5.6% | -38.9% |
| 2010-05-07 | Flash crash and euro debt crisis | 40.95 | +21.3% | -7.9% |
| 2011-08-08 | US credit downgrade | 48.00 | +24.3% | -1.8% |
| 2015-08-24 | Yuan devaluation sell-off | 40.74 | +15.4% | -3.4% |
| 2020-02-28 | Start of the COVID crash | 40.11 | +29.6% | -24.3% |
| 2020-06-11 | Second COVID scare | 40.79 | +40.6% | 0.0% |
| 2020-10-28 | Pre-election sell-off | 40.28 | +39.9% | 0.0% |
| 2025-04-04 | Tariff shock | 45.31 | +30.3% | -1.8% |
Average +22.1%, median +23.0%, 10 wins and 2 losses. Shorter holds give smaller gains with even better odds: +13.1% after 125 days and +8.2% after 60 days, both with a 92% win rate, against a 60-day baseline of +2.3%.
The two losses are the instructive part. Buying on 29 September 2008, the day the House first voted down the bank rescue, meant sitting through another 38.9% decline before the bottom, and the position was still down 5.6% a year later. September 2001 makes the same point differently: the trade was up 9.4% after 60 days, but the dot-com bear market had not finished, and a year later it was down 14.3%. A VIX above 40 marks a panic peak, which is not necessarily the trend low. In 2001 and 2008 the two were months apart.
Also note that 2020 produced three signals (February, June and October) whose holding periods overlap and rode the same V-shaped recovery. Counting them as three independent results overstates how reliable the signal is, a point the method section returns to.
Signal B: waiting for the VIX to cool down
The 2020 study concluded that a VIX above 40 means the panic is still running and that it is better to wait until it falls back below 30. Its four signals at the time were all winners. The longer record cuts that conclusion in half:
| Entry date | VIX close | 250-day return | Deepest drawdown during hold |
|---|---|---|---|
| 1998-10-29 | 29.50 | +19.4% | 0.0% |
| 2001-10-25 | 29.46 | -18.5% | -29.4% |
| 2002-08-15 | 29.43 | +5.8% | -16.5% |
| 2002-11-01 | 29.30 | +16.2% | -11.1% |
| 2009-05-19 | 28.80 | +25.2% | -3.2% |
| 2010-05-10 | 28.84 | +15.1% | -11.8% |
| 2011-10-14 | 28.24 | +17.0% | -5.4% |
| 2015-08-27 | 26.10 | +9.4% | -8.0% |
| 2020-05-08 | 27.98 | +43.4% | -3.7% |
| 2025-04-17 | 29.65 | +34.9% | -2.4% |
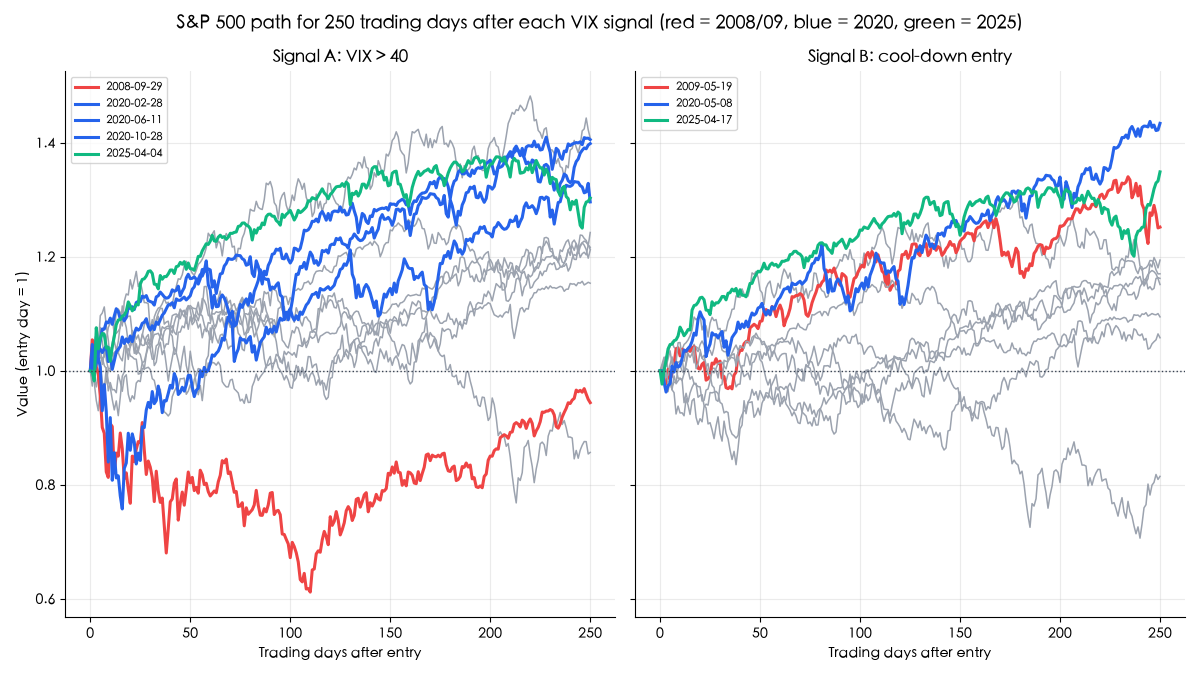
Waiting worked beautifully in 2008: the cool-down signal did not fire until 19 May 2009, which skipped the 38.9% slide that followed Signal A's entry, and the trade gained 25.2% with a worst dip of 3.2%. In 2001 it caught a different falling knife. The VIX cooled on 25 October 2001, the dot-com decline resumed into October 2002, and the trade lost 18.5%, with a 29.4% drawdown along the way.
Side by side, Signal B has the higher win rate (90% vs 83%), the lower average (+16.8% vs +22.1%) and the deeper worst case. Waiting moved the pain from 2008 to 2001 rather than removing it. With 10 and 12 events, a gap of this size is well within noise. The 2020 claim that the cool-down entry "may be the better approach" was an over-reading of four data points, and the full sample does not support it.
Threshold and holding period: 40 is panic, 30 is just nerves
A single parameter set can look good by luck, so the event study was rerun with thresholds of 30, 40 and 50 and holding periods of 60, 125 and 250 trading days.
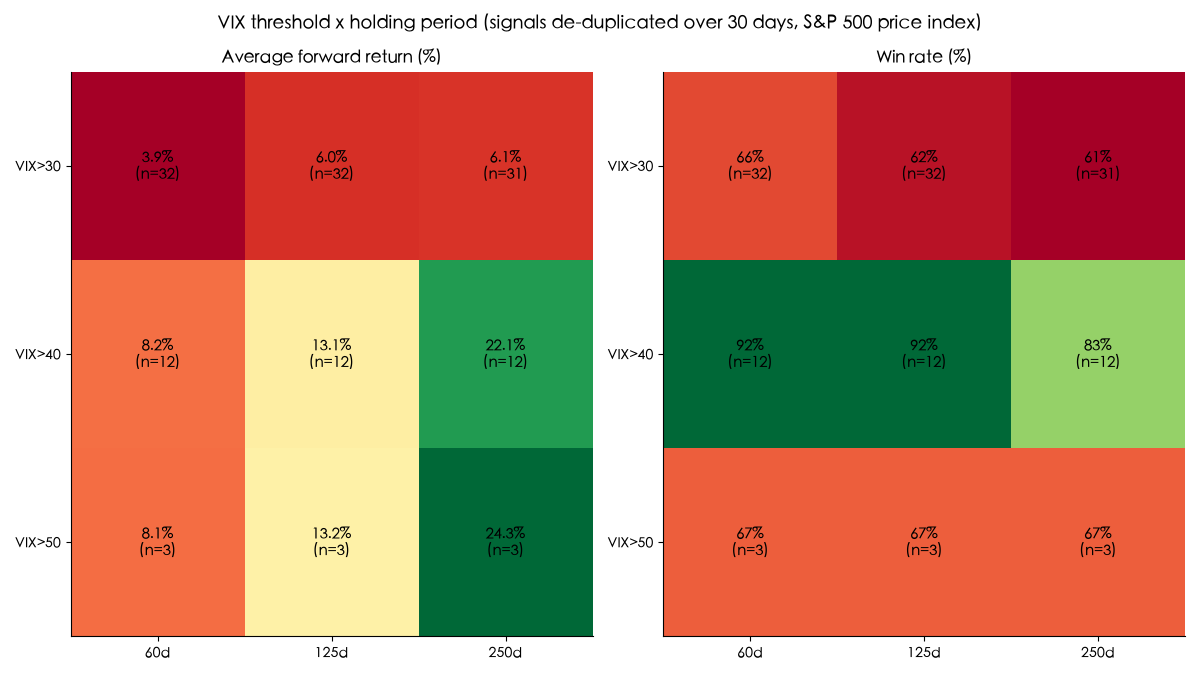
| Threshold | Signals | 60-day hold | 125-day hold | 250-day hold |
|---|---|---|---|---|
| VIX > 30 | 32 (31 for 250 days) | +3.9% (66% win) | +6.0% (62% win) | +6.1% (61% win) |
| VIX > 40 | 12 | +8.2% (92% win) | +13.1% (92% win) | +22.1% (83% win) |
| VIX > 50 | 3 | +8.1% (67% win) | +13.2% (67% win) | +24.3% (67% win) |
Two readings matter:
- A threshold of 30 does worse than buying at random: +6.1% after 250 days with a 61% win rate, against +10.1% and 81% for any day. A VIX in the low 30s usually means a decline is still under way. The latest VIX>30 event, a 31.05 close on 27 March 2026, is included in the 60- and 125-day columns; its 250-day window has not finished yet.
- A threshold of 50 looks better but rests on three events (one each in 2008, 2020 and 2025), which is not evidence of anything. Forty is a reasonable balance between sample size and signal strength, and it is the original 2020 parameter, which avoids choosing a threshold after seeing the results.
Turning the signal into a strategy: it lags buy-and-hold
The event study answers "what happens on average after a signal". The practical question is different: what happens if you trade it for decades? The continuous version buys SPY (with dividends) whenever Signal B fires, holds for 250 trading days, extends the hold if another signal arrives, and otherwise sits in cash at zero return. Every entry and every exit is charged 0.1%.
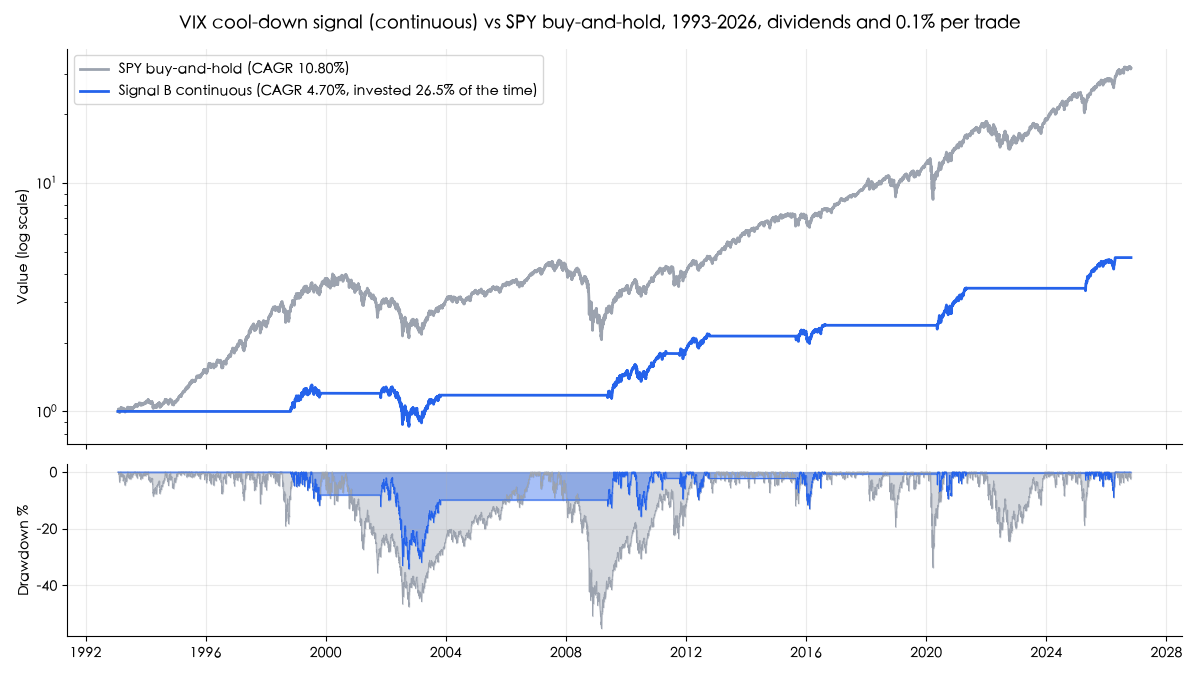
| Metric (1993-2026) | Signal B, continuous | SPY buy-and-hold |
|---|---|---|
| Total return | +371.6% | +3,081.9% |
| CAGR | 4.70% | 10.80% |
| Daily Sharpe ratio | 0.54 | 0.65 |
| Maximum drawdown | -34.2% | -55.2% |
| Time invested | 26.5% | 100% |
| Round trips | 7 | 0 |
Over 33 years, one dollar grew to 31.82 in SPY. The signal itself did not fail: returns while invested were above average. The problem is that panic signals are rare. The strategy spent 73.5% of the time in cash watching the market rise, and the compounding it missed dwarfs the extra return it earned after panics. Paying interest on idle cash would lift the strategy's CAGR somewhat, but not enough to change the order of magnitude. It does not win on a risk-adjusted basis either: a daily Sharpe of 0.54 against 0.65 for buy-and-hold.
The one thing it does deliver is a shallower drawdown (-34.2% vs -55.2%), which is consistent with how the signal should be used: as a guide for when to deploy spare cash, not as a replacement for a long-term position.
Robustness checks: neighbouring parameters, two halves, trading costs
The continuous version was then put through three checks to see whether its results depend on one lucky parameter set or one stretch of market history. "Beats QQQ" means a higher daily Sharpe ratio (mean daily return divided by its standard deviation, annualized with √252, no risk-free rate) than buying and holding QQQ with dividends over exactly the same dates. QQQ started trading on 10 March 1999, so every check runs from 1999-03-11, its first daily return, to 2026-10-26, which is later than the 1993 start of the table above.
Over that window the original version compounded at 5.13% with a daily Sharpe of 0.55, while QQQ compounded at 10.70% with a Sharpe of 0.51. The Sharpe ratio favours the timing strategy despite half the return because QQQ's window starts just before the dot-com bust; its maximum drawdown over the period is -83.0%.
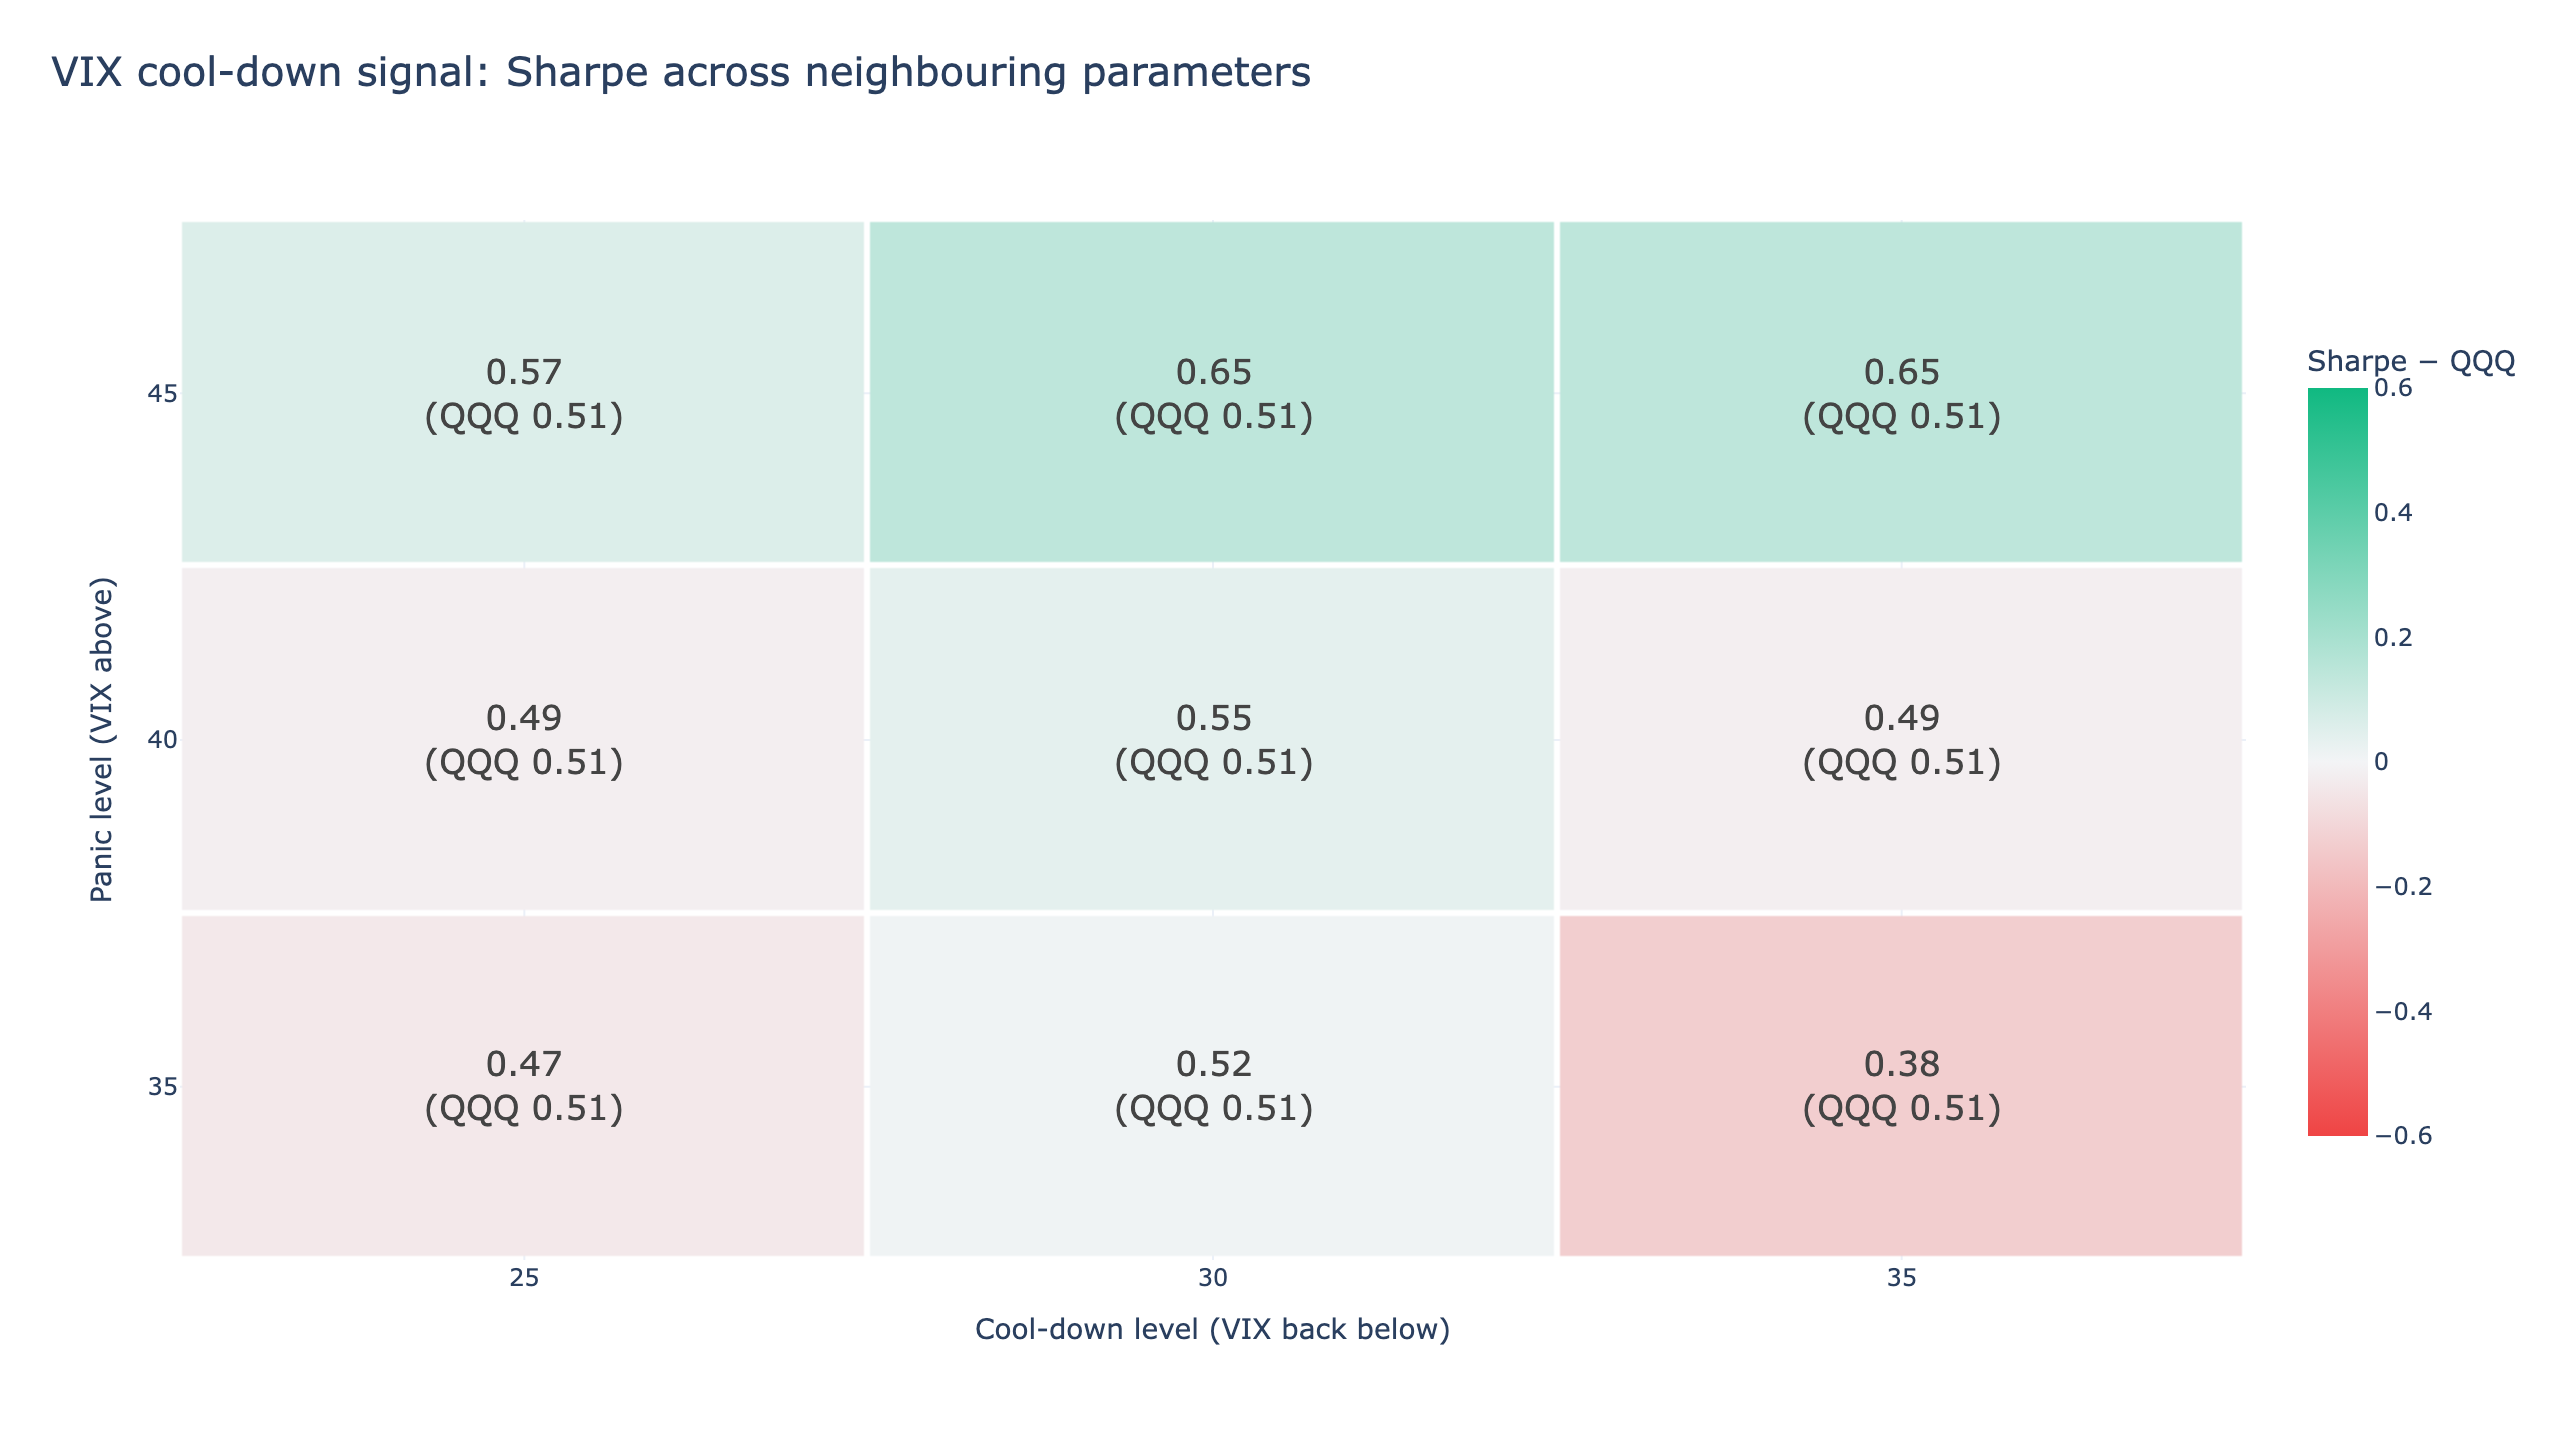
Neighbouring parameters: 5 of 9 beat QQQ, short of the 7 required. Two parameters were varied: the panic level the VIX must have closed above (35, 40, 45) and the cool-down level it must fall back below before buying (25, 30, 35); the originals are 40 and 30. The five winners are the original 40/30 (0.55), 35/30 (0.52) and all three combinations with a panic level of 45 (0.57, 0.65, 0.65). The four losers are 35/25 (0.47), 35/35 (0.38), 40/25 (0.49) and 40/35 (0.49), against 0.51 for QQQ in every cell. Moving the original cool-down level by five points in either direction pushes the Sharpe below QQQ.
Two halves: wins the first, loses the second. The window was split in half by trading days:
| Period | Strategy daily Sharpe | QQQ daily Sharpe | Result |
|---|---|---|---|
| 1999-03-11 to 2013-01-02 | 0.41 | 0.23 | Beats QQQ |
| 2013-01-02 to 2026-10-26 | 0.84 | 0.98 | Loses to QQQ |
In the first half QQQ went through the 2000-2002 crash and 2008 and compounded at only 2.45% a year, while the strategy made 4.37% with annualized volatility of 12.2% against QQQ's 31.8%. In the second half QQQ compounded at 19.88% a year against the strategy's 5.89%, and won on Sharpe as well.
Trading costs: passes. Charging 0.1% on every buy and every sell, the strategy compounds at 5.13% with a daily Sharpe of 0.55. With no costs at all it is 5.18% and 0.56. QQQ over the same dates: 10.70% and 0.51. With only seven round trips in 33 years, costs barely matter.
Verdict: fails. It passes the cost check and fails the neighbouring-parameter check (5 of 9) and the two-halves check (loses after 2013). For a reader, this means the timing strategy's slight Sharpe edge over QQQ since 1999 is fragile: four of the nine nearby settings lose to QQQ, and the edge comes mostly from QQQ's collapse in the early 2000s. Since 2013, simply holding QQQ has been better on both return and risk-adjusted return. That matches the conclusion above: use the signal to time spare cash, not to replace an index position.
Reproduce the checks with python strategy.py --validate.
The 2022 blind spot: a full bear market with no signal
The longer sample exposes a limitation the 2020 study could not see. In 2022 the S&P 500 fell 25.4% from its 3 January close to its 12 October close, one of the longest bear markets since 2008, yet the VIX's highest close all year was 36.45 on 7 March. Neither signal fired. Anyone waiting for a panic signal sat out the entire decline and missed the start of the 2023 recovery.
5 August 2024, the yen carry-trade unwind, shows a second kind of miss. The VIX hit 65.73 intraday but closed at 38.57, so a rule based on closing prices did nothing, and in hindsight that day was a good entry.
Both cases point to the same structural limit: VIX event signals catch crashes, not slow grinds, and not panics that fade by the close. A 2022-style decline has no fear spike, so the whole move is invisible to these rules. If your entry plan depends entirely on a panic signal, some bear markets will never give you one.
What the research says about the VIX and forward returns
The panic-buying idea has an academic lineage, and each paper supports a different part of the mechanism:
- Whaley (2000) introduced the VIX as "the investor fear gauge" and showed that extreme highs tend to coincide with short-term market bottoms. This is the source of the "high VIX means buy" intuition.
- Giot (2005) sorted days by implied-volatility level and found that very high VIX readings were followed by significantly positive medium- and long-horizon index returns. The shape of the results here, strong after 40 and weak after 30, points the same way.
- Bekaert & Hoerova (2014) split the squared VIX into expected realized variance and the variance risk premium, and found that the predictive power for future stock returns comes mainly from the premium. That gives a mechanism: when the VIX spikes, investors demand extra compensation for bearing risk, and that compensation shows up later as higher returns.
None of these papers claims that VIX timing beats buy-and-hold, which is consistent with the continuous-strategy result above.
Backtest method and limits
| Item | How it was handled |
|---|---|
| Transaction costs | The event study has no fees, commissions or taxes. The continuous version charges 0.1% per entry and per exit as a stand-in for spread and slippage, since US brokers mostly charge zero commission on ETFs. The cost check shows a daily Sharpe of 0.56 with no costs and 0.55 with them |
| Slippage | Not modelled separately. Signals are read at the close and assumed filled at that close; in practice you would estimate the VIX intraday or enter at the next open |
| Instrument | No stock selection. The event study uses ^GSPC, a price index without dividends, which understates 250-day returns by roughly 2 percentage points; the continuous version uses SPY's dividend-adjusted close |
| Liquidity | SPY is among the most liquid ETFs in the world; the index itself is not directly tradable |
| Survivorship | Not an issue at this level: S&P maintains index membership, so delisted stocks are already handled inside the index |
| Look-ahead | VIX and index both use the same day's close; no earnings or announcement dates are involved |
| Position sizing | One position, 100% invested or 100% cash |
| Turnover | Seven round trips in 33 years; idle cash earns zero, with no interest credited |
| Out-of-sample | Full-period in-sample with no rolling test. The 40/30 thresholds and 250-day hold are the 2020 settings, not re-optimized, but 12 and 10 events carry limited statistical power, and the three 2020 signals overlap. The two-halves split above shows the continuous version beating QQQ in 1999-2013 and losing in 2013-2026 |
Reproduce the event study in Python
The core logic is under 20 lines: download the data, define the signal, measure forward returns.
Show Code
import pandas as pd
import yfinance as yf

# Download VIX and S&P 500 (price index) closes
vix = yf.download("^VIX", start="1990-01-01", auto_adjust=True)["Close"].squeeze()
sp500 = yf.download("^GSPC", start="1990-01-01", auto_adjust=True)["Close"].squeeze()

# Align the two series on common trading days
common = vix.index.intersection(sp500.index)
vix = vix.reindex(common)
sp500 = sp500.reindex(common)

# Signal A: first VIX close above 40 (no close above 40 in the prior 30 days)
panic = vix > 40
first_panic = panic & (panic.shift(1).rolling(30, min_periods=1).sum() == 0)

# Forward return after holding 250 trading days
forward_250 = sp500.shift(-250) / sp500 - 1
event_returns = forward_250[first_panic].dropna()

print(event_returns.round(3))
print("Average return:", round(event_returns.mean() * 100, 1), "%")
print("Win rate:", round((event_returns > 0).mean() * 100), "%")
The full script with Signal B, the sensitivity matrix, the continuous version and the three checks is here: strategy.py. Its DATA_END is pinned to 2026-10-26, so python strategy.py prints the tables in this article and python strategy.py --validate prints the three checks. Change DATA_END to today's date to run on the latest data; the numbers will move slightly. The comments in the script are in Chinese; the code itself is plain pandas.
Install the FinLab skill for your AI agent
The script needs only yfinance and pandas, but most of the useful follow-up work, such as rerunning on fresh data, swapping SPY for another ETF, or crediting T-bill interest to the cash days, is faster if you describe it to an AI coding agent than if you edit the code yourself. The FinLab skill teaches the agent how to pull US price and fundamental data with the finlab package, run backtests, and report CAGR, Sharpe and drawdown against a benchmark. Install it with one command:
Show Code
npx skills add https://github.com/koreal6803/finlab-ai --skill finlabIt works with Claude Code, Codex and Gemini CLI. The agent install guide covers each one, and if you would rather not touch a terminal, the AI-assisted setup flow lets the agent read the setup page and install everything itself. For research in the browser, FinLab Studio runs the same workflow without a local Python setup.
Then ask in plain language, for example: "Download strategy.py from this article, run it with --validate, then add a 3-month T-bill return on cash days and show me how much the CAGR gap to SPY closes." The agent runs the code and returns the tables, so you check the evidence yourself.
Who this is for
The signal is useful if you hold cash on the side and want a rule for when to add to a long-term index position, and if you can live with the possibility of another 40% drop after you buy, as in 2008. It is not useful as a complete strategy, and it is no help in a slow bear market like 2022. If you want a full rules-based US system that is invested most of the time, the strategies in the US quant trading strategies comparison are built for that: the ETF rotation strategy and the breakout trend strategy switch between risk-on and risk-off holdings, and the low volatility strategy shows what a volatility regime filter can and cannot predict.
FAQ
What does the VIX measure, and how is it related to the S&P 500?
The VIX is the 30-day implied volatility of the S&P 500, backed out of option prices and annualized. It moves inversely to the index: sharp sell-offs drive up demand for protection and push the VIX higher, while steady rallies usually keep it below 20.
What VIX level counts as high or extreme?
The median close since 1990 is 17.6. Readings of 20 to 30 signal nervousness, 30 to 40 signal fear, and a close above 40 is extreme; it has happened as a fresh event only 12 times in 36 years. The record close is 82.69 on 16 March 2020.
Should I buy stocks when the VIX is above 40?
History favours buying: after the 12 closes above 40, the S&P 500 was up 22.1% on average 250 trading days later, with an 83% win rate. But the 2008 entry fell another 38.9% before the bottom, and the 2001 entry was down 14.3% a year later. Treat it as a good moment for spare cash you can leave alone through another deep drop.
Is it better to wait for the VIX to fall back below 30?
Not on the full record. The cool-down entry had a higher win rate (90%) but a lower average return (+16.8% vs +22.1%) and a deeper worst case (-18.5% in 2001).
Can VIX timing beat buying and holding SPY or QQQ?
Not in this backtest. The continuous cool-down strategy compounded at 4.70% from 1993 against 10.80% for SPY, and at 5.13% from QQQ's 1999 launch against 10.70% for QQQ. Its daily Sharpe of 0.55 was slightly above QQQ's 0.51 over that window, but the edge held in only 5 of 9 neighbouring parameter sets and disappeared after 2013 (0.84 vs 0.98).
Why did the VIX not signal a buy in the 2022 bear market?
The 2022 decline was gradual: the S&P 500 fell 25.4% from January to October without a single panic day, and the VIX peaked at a 36.45 close. Panic signals only catch fast crashes.
Can I buy the VIX itself?
No. The VIX is a calculated index. VIX futures, options and the ETNs built on them are tradable, but they suffer from roll costs and contango and lose value over long holding periods, which makes them a poor fit for the one-year framework in this article.
Where can I download historical VIX data?
Cboe publishes daily history back to 1990, and in Python the simplest route is yfinance with the ticker ^VIX, as in the code above. Definitions of the metrics used here are in the glossary.
Further reading
- US quant trading strategies compared: ten backtested US systems on the same QQQ benchmark
- ETF rotation strategy backtest: one risk-on/risk-off signal driving 2x and 3x ETF rotations
- Short-term mean reversion strategy: buying recent laggards inside an uptrend, a faster cousin of buying the dip
- US momentum strategy: full cross-sectional factor analysis with deciles and rank IC
- US stock backtesting with finlab, price-to-book case study: the end-to-end finlab workflow on US data, and a factor that did not transfer
- FinLab research blog: all US strategy research
- Use cases and about the FinLab team
Last updated: 2026-10 | Backtest window: 1990-01 to 2026-10 (data through 2026-10-26) | Benchmarks: unconditional S&P 500 baseline, SPY and QQQ total return | Author: FinLab Quant Research (reviewed by a quantitative researcher)
Investing involves risk, and past performance does not represent future results. This content is for educational purposes only and is not investment advice; evaluate any strategy against your own risk tolerance.
FinLab AI
Want to build your own strategy?
Describe your stock-picking ideas in natural language. AI automatically validates, backtests, and gives you answers
Start Free