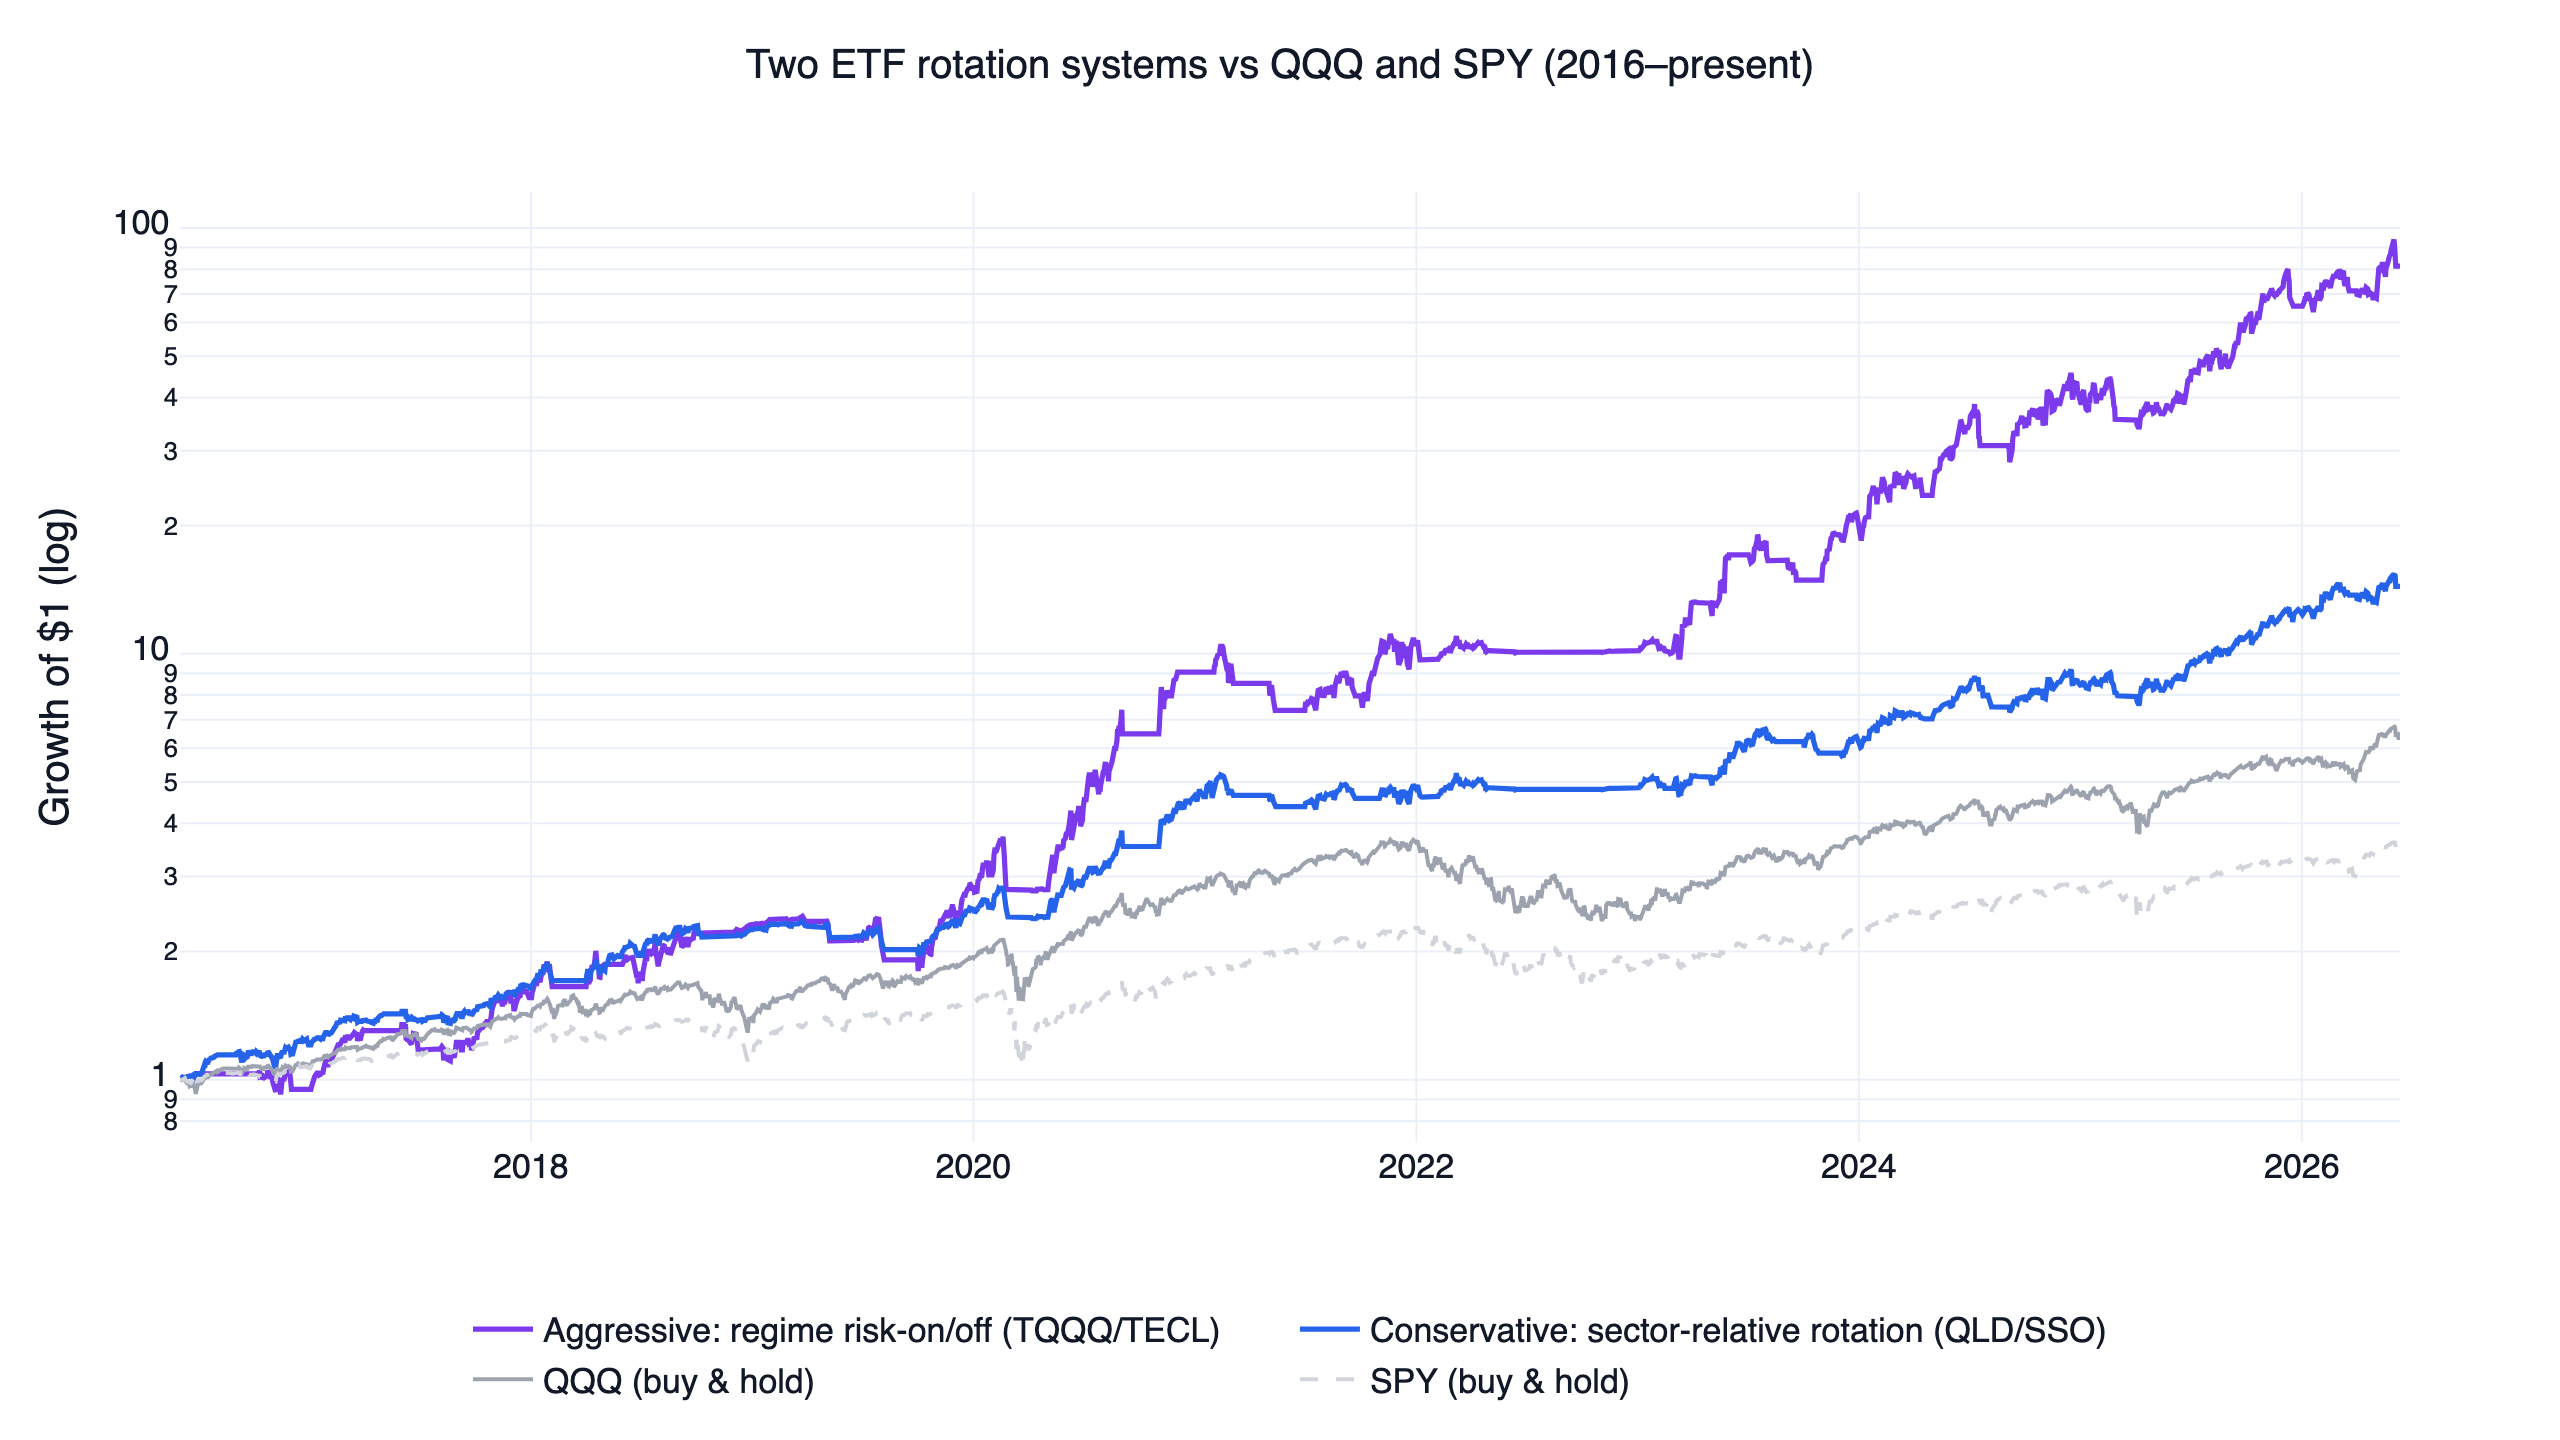
An ETF rotation strategy backtest usually shows one set of rules and one equity curve. This one tests a single risk-on/risk-off signal at two different risk budgets, because the signal and the leverage are separate decisions and deserve separate evidence. The signal is read entirely from QQQ: risk-on when QQQ closes above its 200-day moving average and its trailing 126-day return is positive, risk-off otherwise. The conservative version expresses that signal through two 2x index ETFs (QLD and SSO); the aggressive version holds a single 3x growth ETF (TQQQ or TECL). In risk-off, both rotate into the same defensive sleeve of treasuries, gold, or cash-like bonds.
Over June 2016 to June 2026, the conservative rotation compounded at a 30.5% CAGR with a -17.9% maximum drawdown, roughly half of QQQ's -35.6% buy-and-hold loss. The aggressive version compounded at 55.1% with a -29.3% drawdown, turning 81 versus QQQ's $6.5. The numbers come from finlab backtests with downloadable code, and the most useful finding is about the signal itself: it does not predict lower returns in risk-off months. What it predicts is volatility, and that distinction decides whether leveraged ETFs are survivable at all. These two systems are part of a ten-strategy family that shares one execution model; the US quant trading strategies overview explains that shared engine in full and compares all ten.
The numbers at a glance
| Metric | Conservative (QLD/SSO) | Aggressive (TQQQ/TECL) | QQQ (buy & hold) | SPY (buy & hold) |
|---|---|---|---|---|
| CAGR | 30.5% | 55.1% | 20.6% | 13.4% |
| Total return | 1,341% | 8,033% | 554% | 253% |
| Monthly Sharpe | 1.38 | 1.33 | 1.11 | 0.90 |
| Monthly Sortino | 3.31 | 3.29 | 1.75 | 1.27 |
| Max drawdown | -17.9% | -29.3% | -35.6% | -34.1% |
| Annualized volatility | 19.1% | 34.2% | 22.4% | 18.0% |
| Turnover (per year) | 2.5x | 5.0x | — | — |
| Trades | 175 | 94 | — | — |
| Holdings at a time | 2 | 1 | 1 | 1 |
Benchmarks use total-return (dividend-adjusted) prices over the identical 2016-06-01 to 2026-06-12 window. The leveraged ETF series already embed each fund's daily-reset behavior and expense ratio, so the volatility drag of 2x and 3x products is in the results rather than assumed away.
The two systems are deliberately one idea at two leverage levels, and you should read them that way. They share the identical regime signal and the identical defensive sleeve; only the risk-on holdings and the stop differ. Running both does not diversify the signal risk: if the regime call is wrong, both are wrong together.
What "ETF rotation" means here
Rotation in this design has two layers. The first layer is the risk-on/risk-off switch: hold equity exposure when the trend regime supports it, rotate to defensive assets when it does not. Rules of this shape have a long public record: Faber (2007) showed that a simple 10-month moving-average switch on major asset classes historically cut drawdowns dramatically while keeping equity-like returns, and the positive 126-day-return condition used here is a direct application of the time-series momentum effect documented across assets by Moskowitz, Ooi & Pedersen (2012). The economic motivation for switching at all is that market returns and risk cluster into regimes, and ignoring regime shifts is costly for allocation, as modeled by Ang & Bekaert (2002).
The second layer is rotation within each sleeve. In risk-on, the conservative system ranks QLD (2x Nasdaq-100) against SSO (2x S&P 500) by 126-day return and holds the two strongest; with only two candidates, that means it held both 50/50 almost whenever it was invested. One naming clarification matters: despite the "sector rotation" label this system carries in the family table, its instruments are index ETFs, so it is an index-relative rotation between growth-tilted and broad-market exposure, with no sector SPDR funds involved. The aggressive system ranks TQQQ (3x Nasdaq-100) against TECL (3x technology) by 3-month-minus-1-month momentum and holds only the strongest. In risk-off, both systems rank IEF (7-10 year treasuries), GLD (gold), and SHY (short-term treasuries) by the same 3-month-minus-1-month momentum and hold the single strongest; in practice that defensive time went mostly to gold — measured at the monthly rebalance snapshots, GLD was held in 10.7% of months, SHY in 4.1%, and IEF in 2.5%.
Copy this prompt to your AI agent
FinLab's setup path is now one prompt. Paste it into Codex app or Claude cowork, and the AI will read https://finlab.finance/en/setup, install the FinLab skill when needed, then run or modify the strategy in this article.
Show Code
Help me set up FinLab and build an ETF rotation strategy: https://finlab.finance/en/setupThe setup page is https://finlab.finance/en/setup.
What the signal actually knows
These are ETF-timing systems with no stock universe underneath, so the stock-level decile sorts used in the US momentum strategy study do not apply here. The equivalent test is to interrogate the signal directly: when the regime flag flips, what does QQQ actually do next?
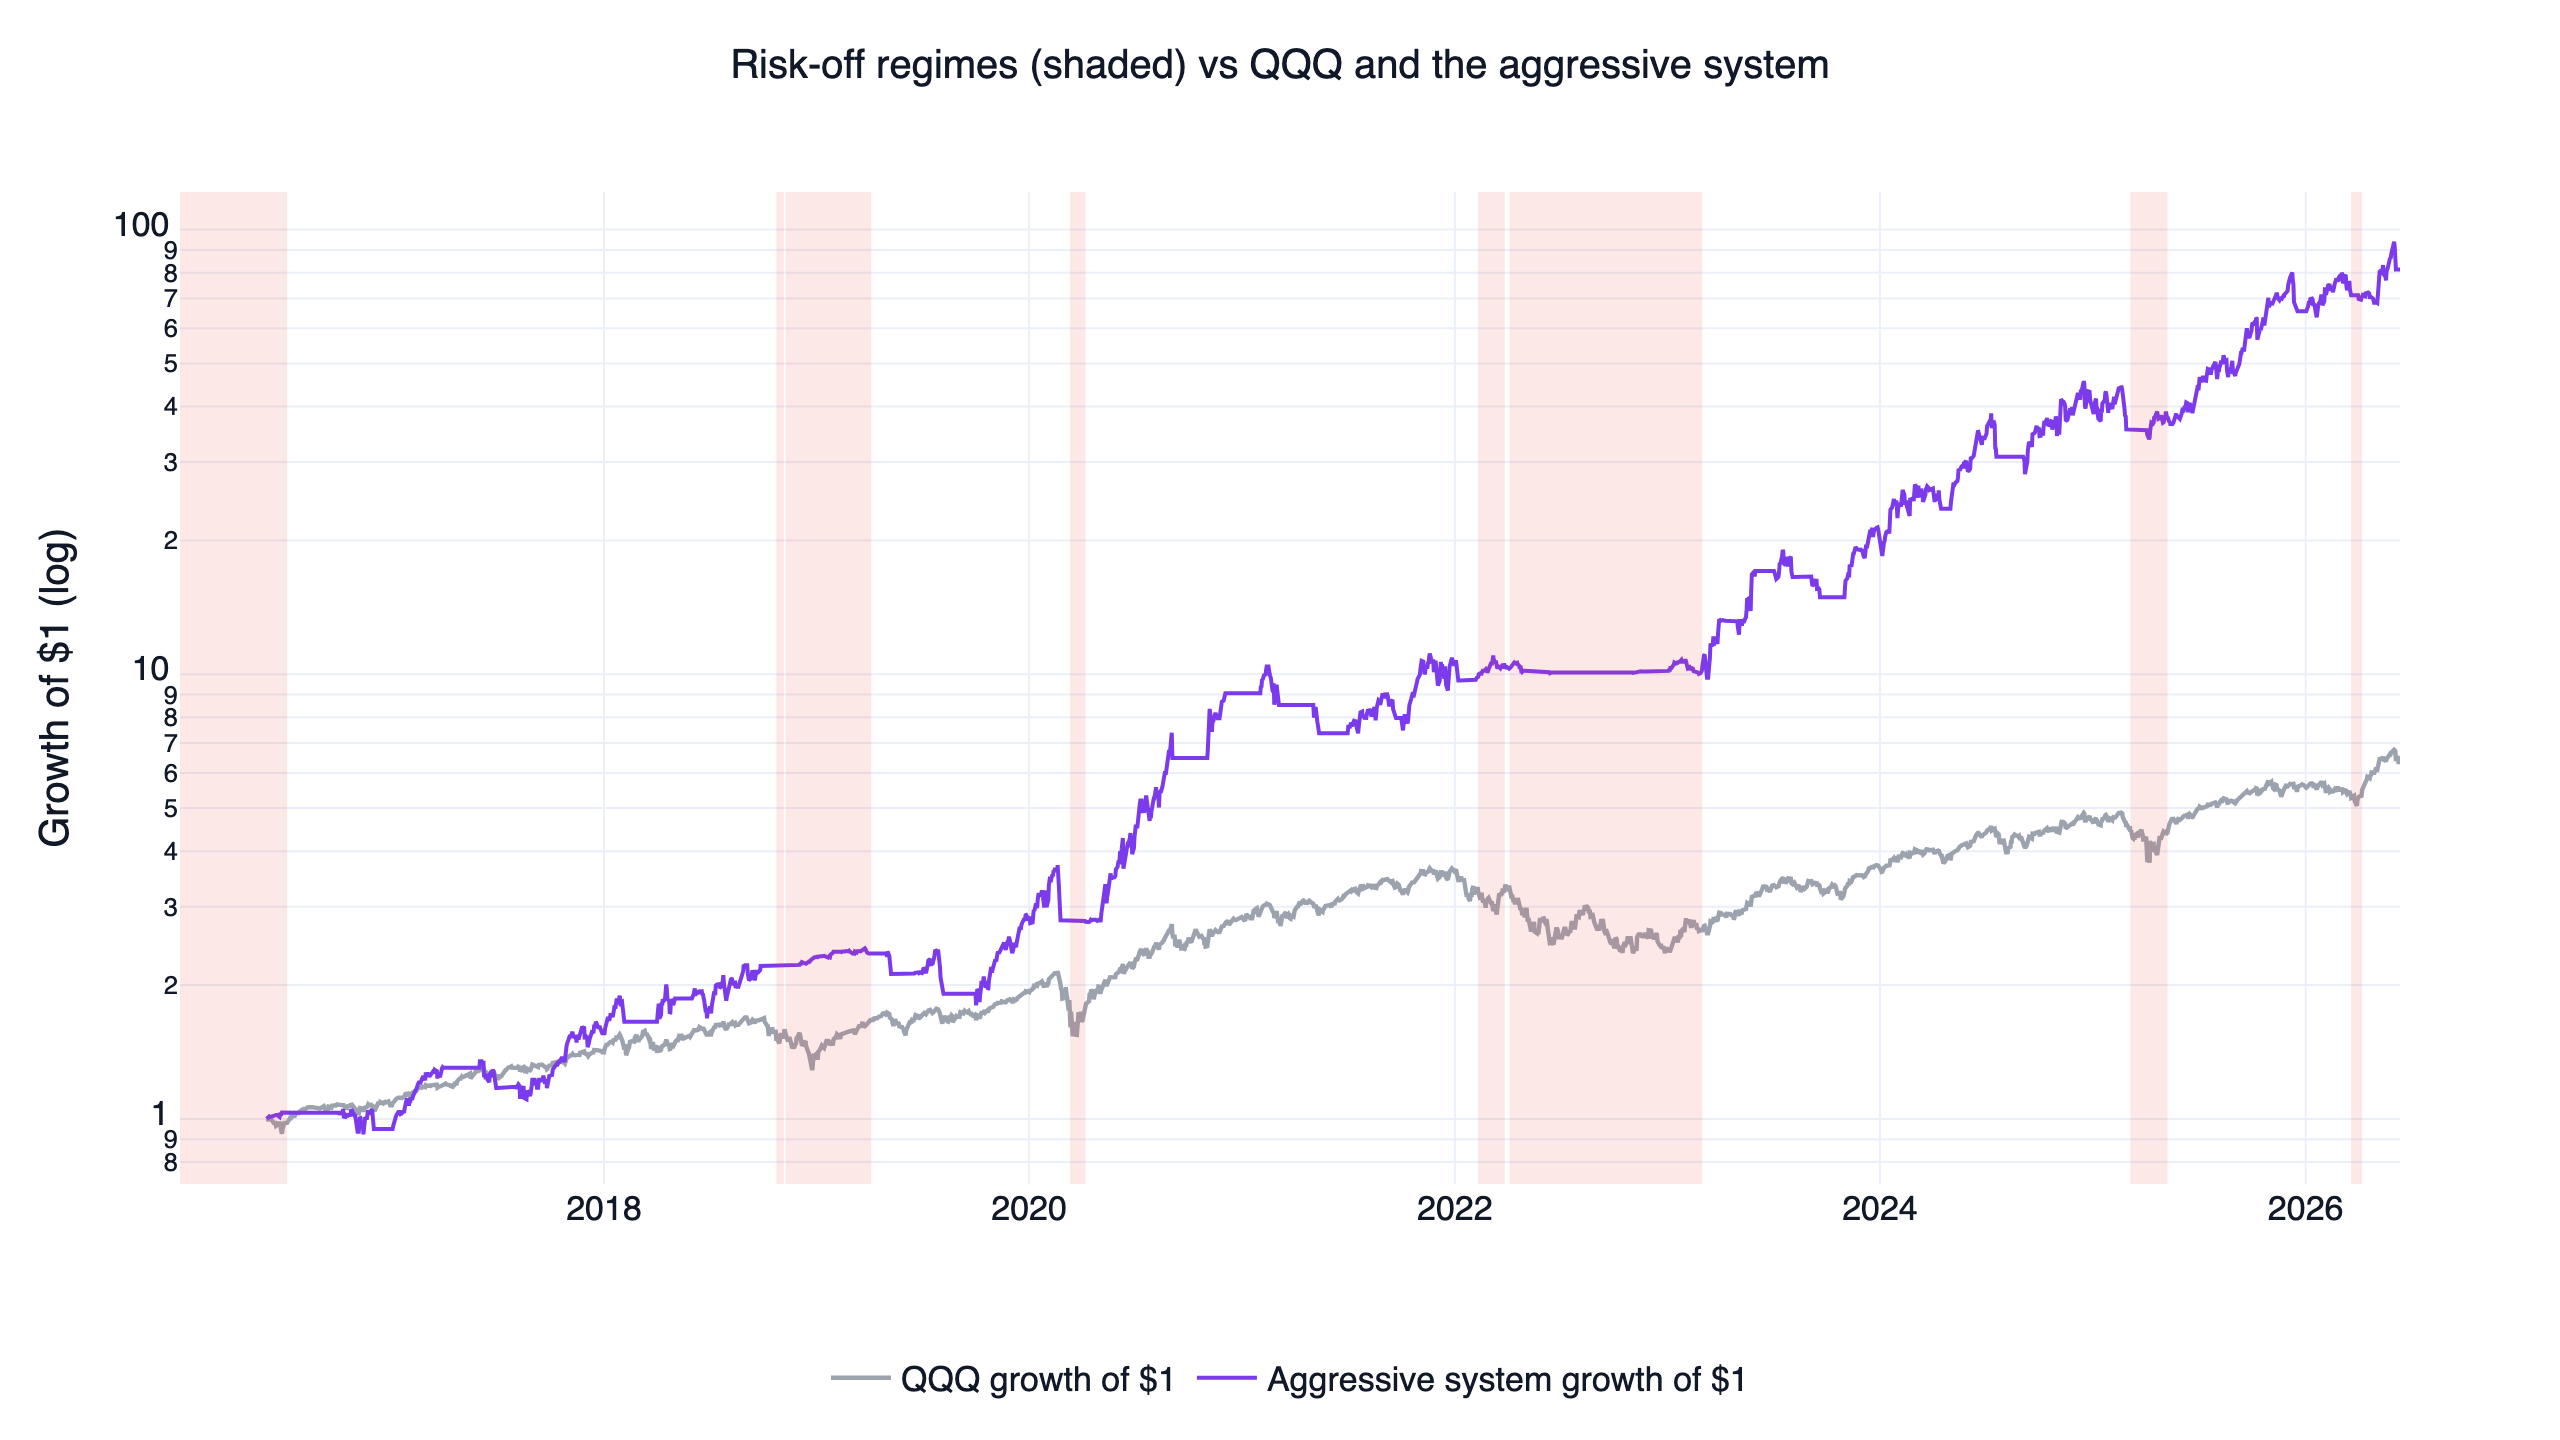
The timeline above shades the 8 risk-off spells that lasted at least 10 trading days. The signal stepped aside for the late-2018 correction, the February-March 2020 crash, and most of the 2022 bear market — the three episodes that did the most damage to buy-and-hold over this decade.
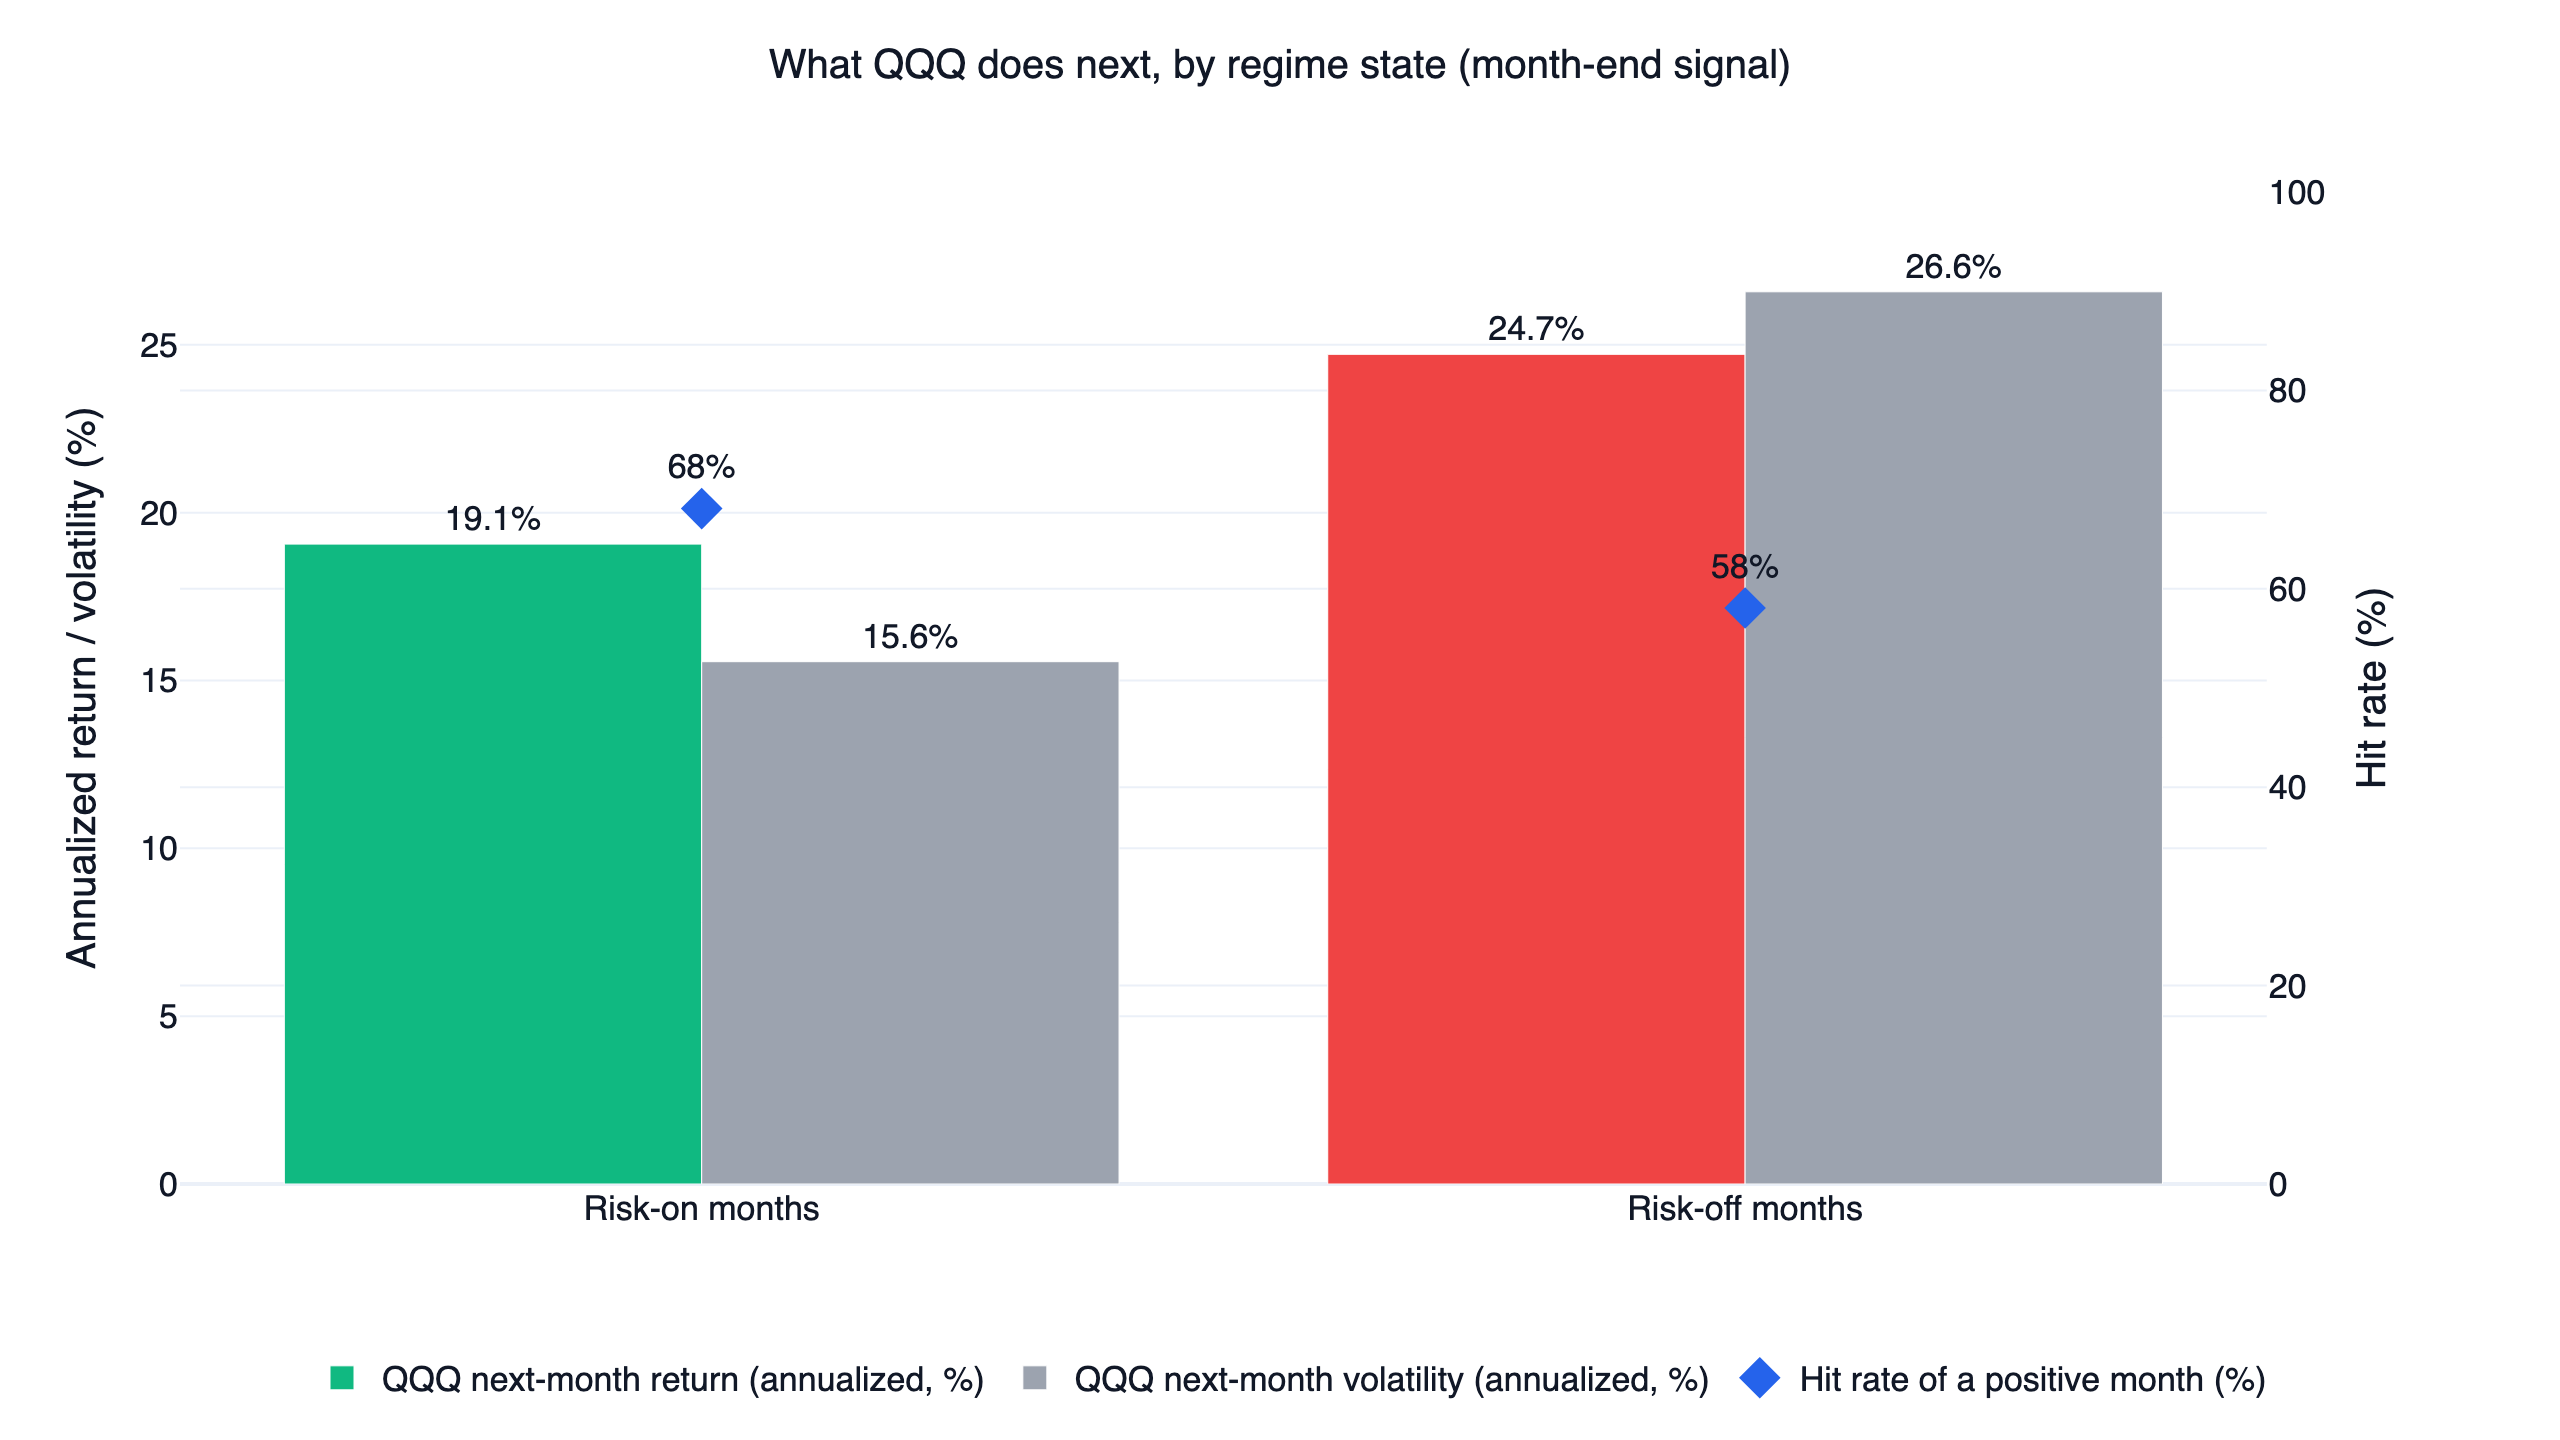
The next chart is the part most rotation write-ups skip, and it cuts against the intuitive story. Sorting every month by its month-end regime state and measuring QQQ's next month:
| Next-month QQQ behavior | Risk-on months (94) | Risk-off months (31) |
|---|---|---|
| Annualized return | 19.1% | 24.7% |
| Annualized volatility | 15.6% | 26.6% |
| Positive-month hit rate | 68% | 58% |
| Worst single month | -8.7% | -13.6% |
Risk-off months averaged a higher QQQ return than risk-on months, 24.7% versus 19.1% annualized, because the most violent rebounds start while the trend signal is still negative. Anyone selling this signal as a return predictor is misreading it. Its real product is risk filtering: risk-off months ran 26.6% annualized volatility against 15.6% in risk-on, hit a positive month only 58% of the time against 68%, and produced the deeper worst month (-13.6% versus -8.7%). For an unleveraged index investor, that trade-off is debatable. For a holder of 2x and 3x daily-reset ETFs it is decisive, because volatility drag grows with the square of volatility. Avoiding the high-volatility months is precisely what makes leveraged compounding survivable, even at the price of missing some rebound upside.
How often does the signal actually let you stay invested?
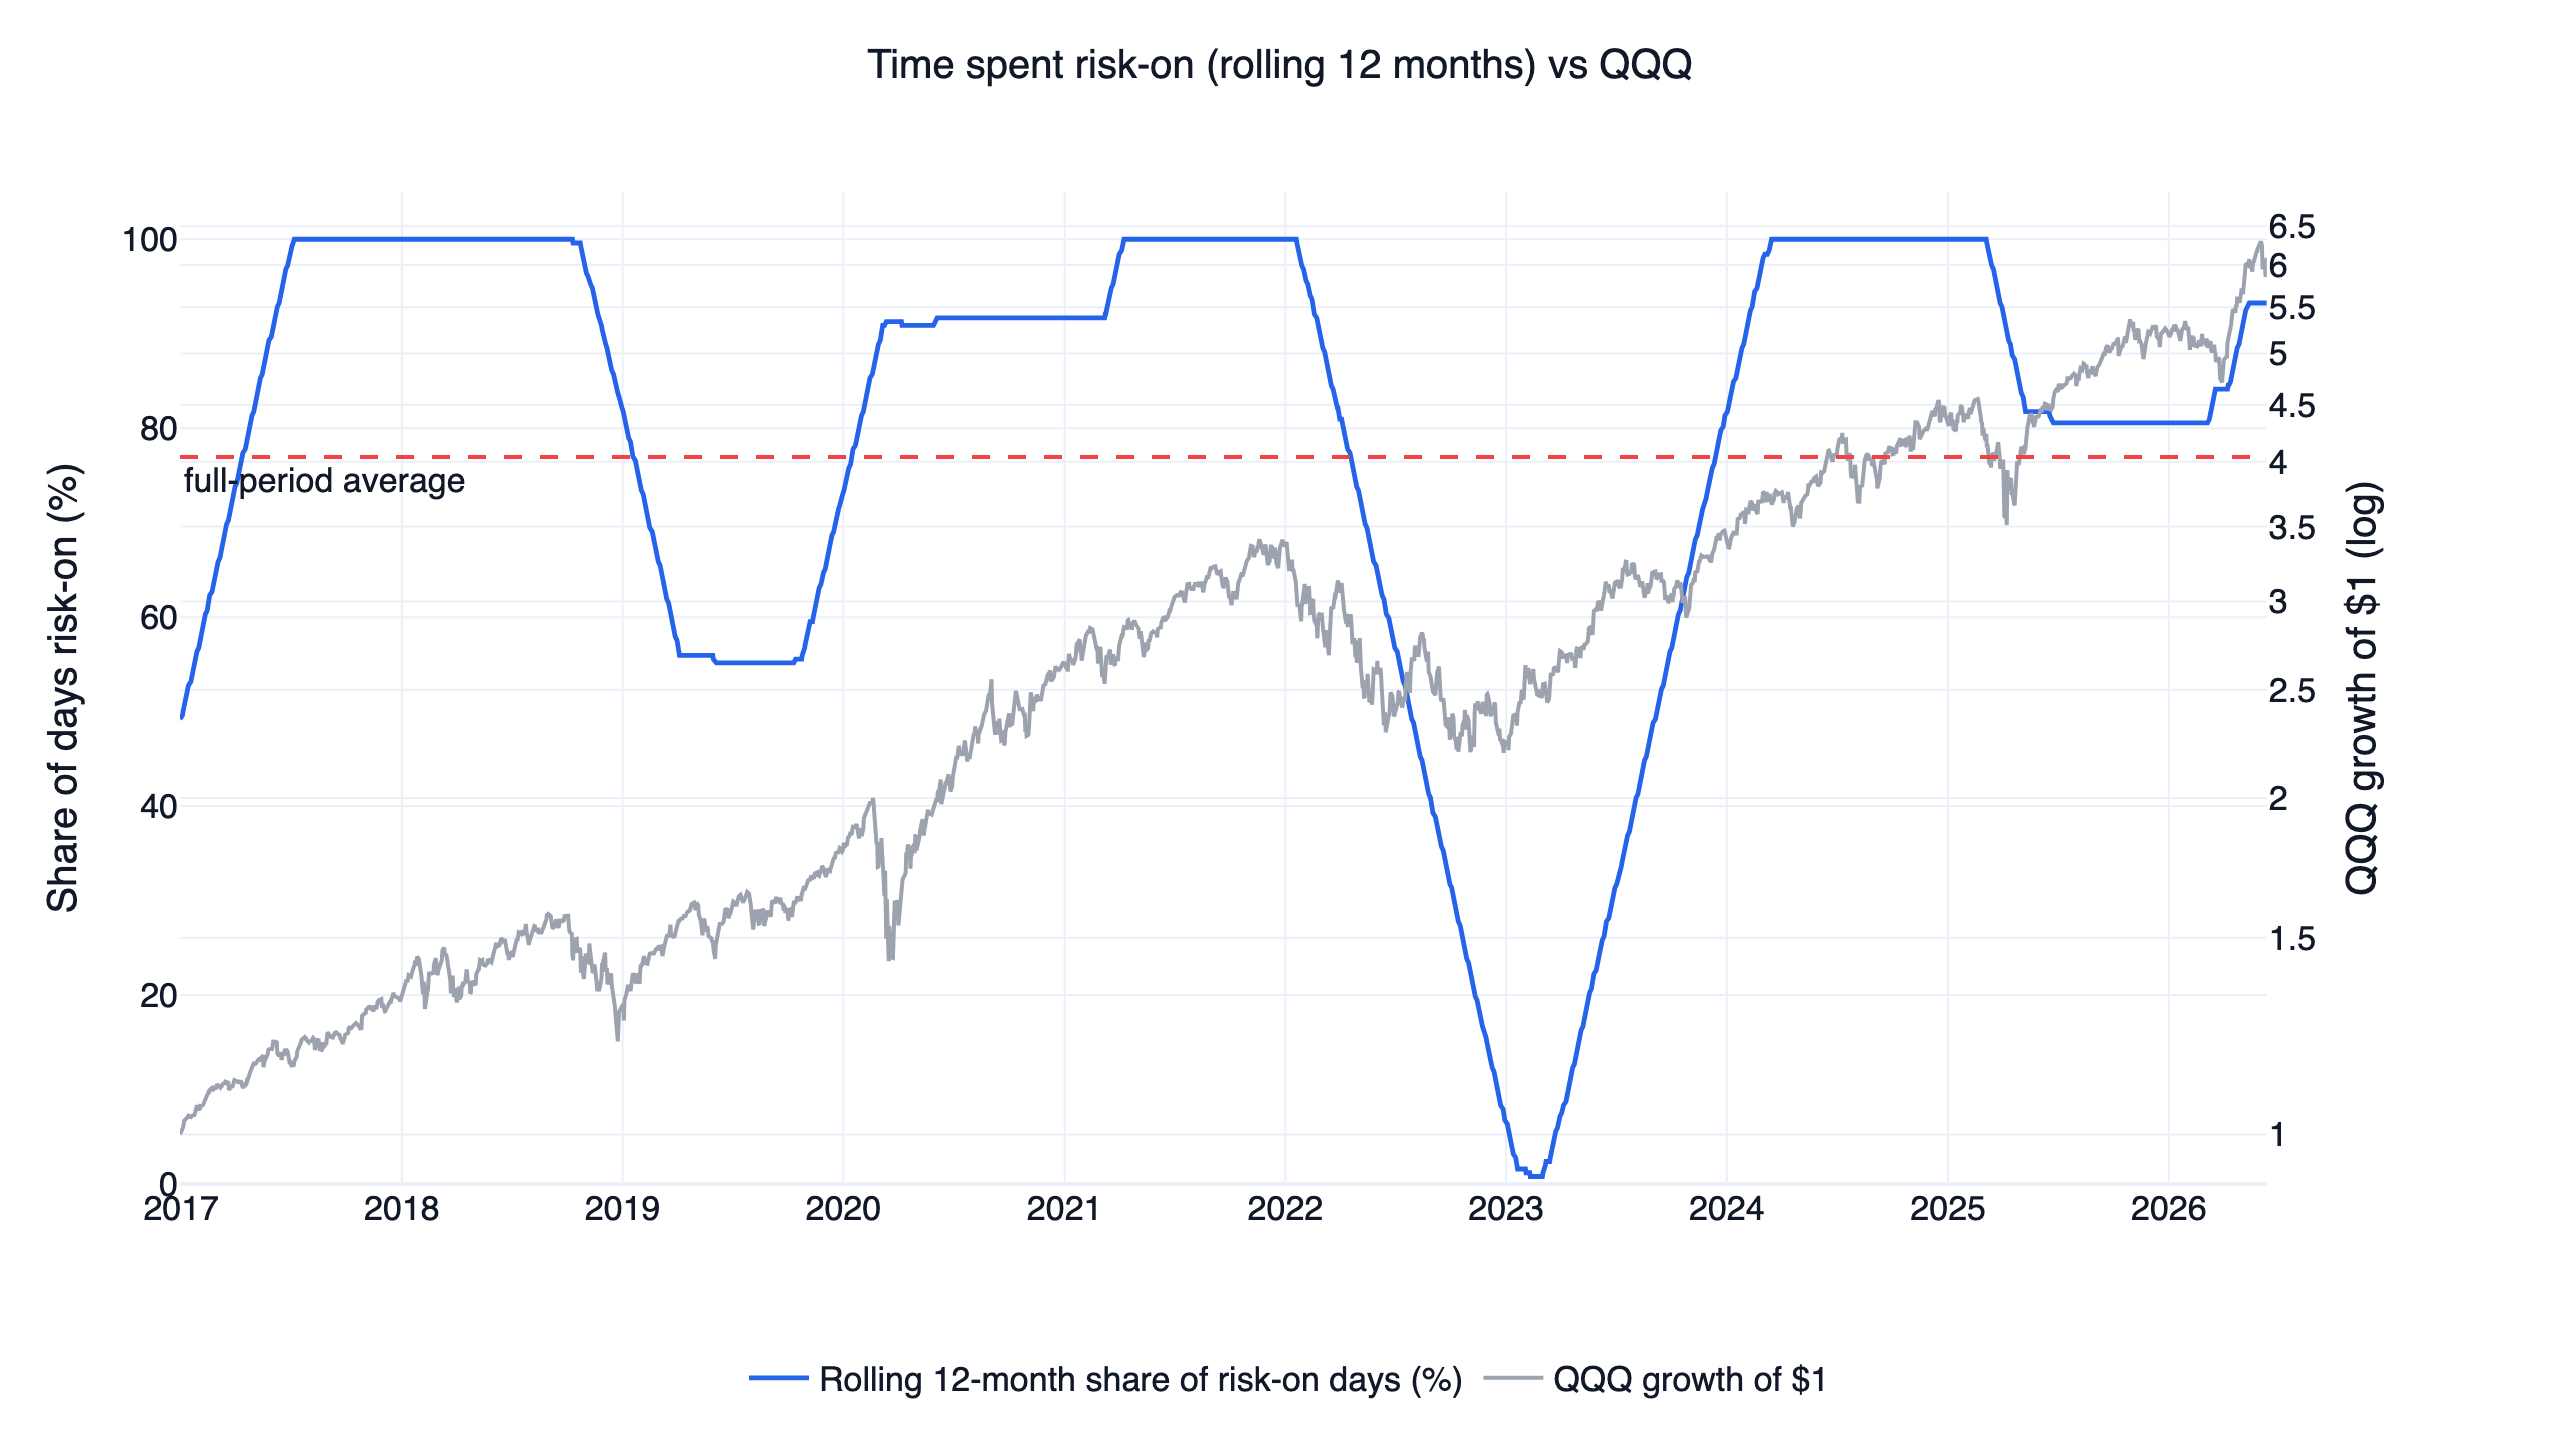
The signal was risk-on 77% of all trading days. The yearly extremes tell the story: 100% of 2017, 2021, and 2024 were risk-on, while 2022 collapsed to 6.4%, and the system spent almost that entire bear market in gold and treasuries. The sample splits into 17 risk-on and 17 risk-off spells. The mean risk-on spell lasted 119 trading days (the longest ran 571), but the median spell on both sides was only 8-9 days: regime boundaries come with whipsaw clusters where the signal flips repeatedly before a trend establishes itself. Those whipsaws, not the deep bear markets, are where this family of systems pays its tuition.
The data behind it
Both systems need only FinLab's US fund market: seven ETF price series and nothing else.
Show Code
import finlab
from finlab import data

finlab.login()  # finlab guides you through login automatically

data.set_market("us_fund")
tickers = ["QQQ", "QLD", "SSO", "TQQQ", "TECL", "IEF", "GLD", "SHY"]
close = data.get("us_fund_price:adj_close")[tickers]

# Regime signal: QQQ above its 200-day average AND a positive 126-day return
qqq_trend = close["QQQ"] > close["QQQ"].rolling(200, min_periods=100).mean()
qqq_momentum = close["QQQ"] / close["QQQ"].shift(126) - 1
risk_on = qqq_trend & (qqq_momentum > 0)
us_fund_price:adj_close is total-return adjusted, so dividends and splits do not distort the signal or the benchmark. The full position construction — ranking the risk sleeve, ranking the defensive sleeve, and the monthly sim() call with the touched stop — is in the downloadable strategy.py, which switches between the two versions with a single STRATEGY = "conservative" or "aggressive" line.
Results: the conservative rotation
The equity curves at the top of this article show both systems against QQQ and SPY, all rebased to 14.4 and the aggressive system about 6.5 for QQQ and $3.5 for SPY. Here is the interactive finlab report for the conservative system — drawdowns, monthly returns, and the trade list — so you can inspect it directly rather than trust a summary:
Drawdown is where the regime gate earns its keep:
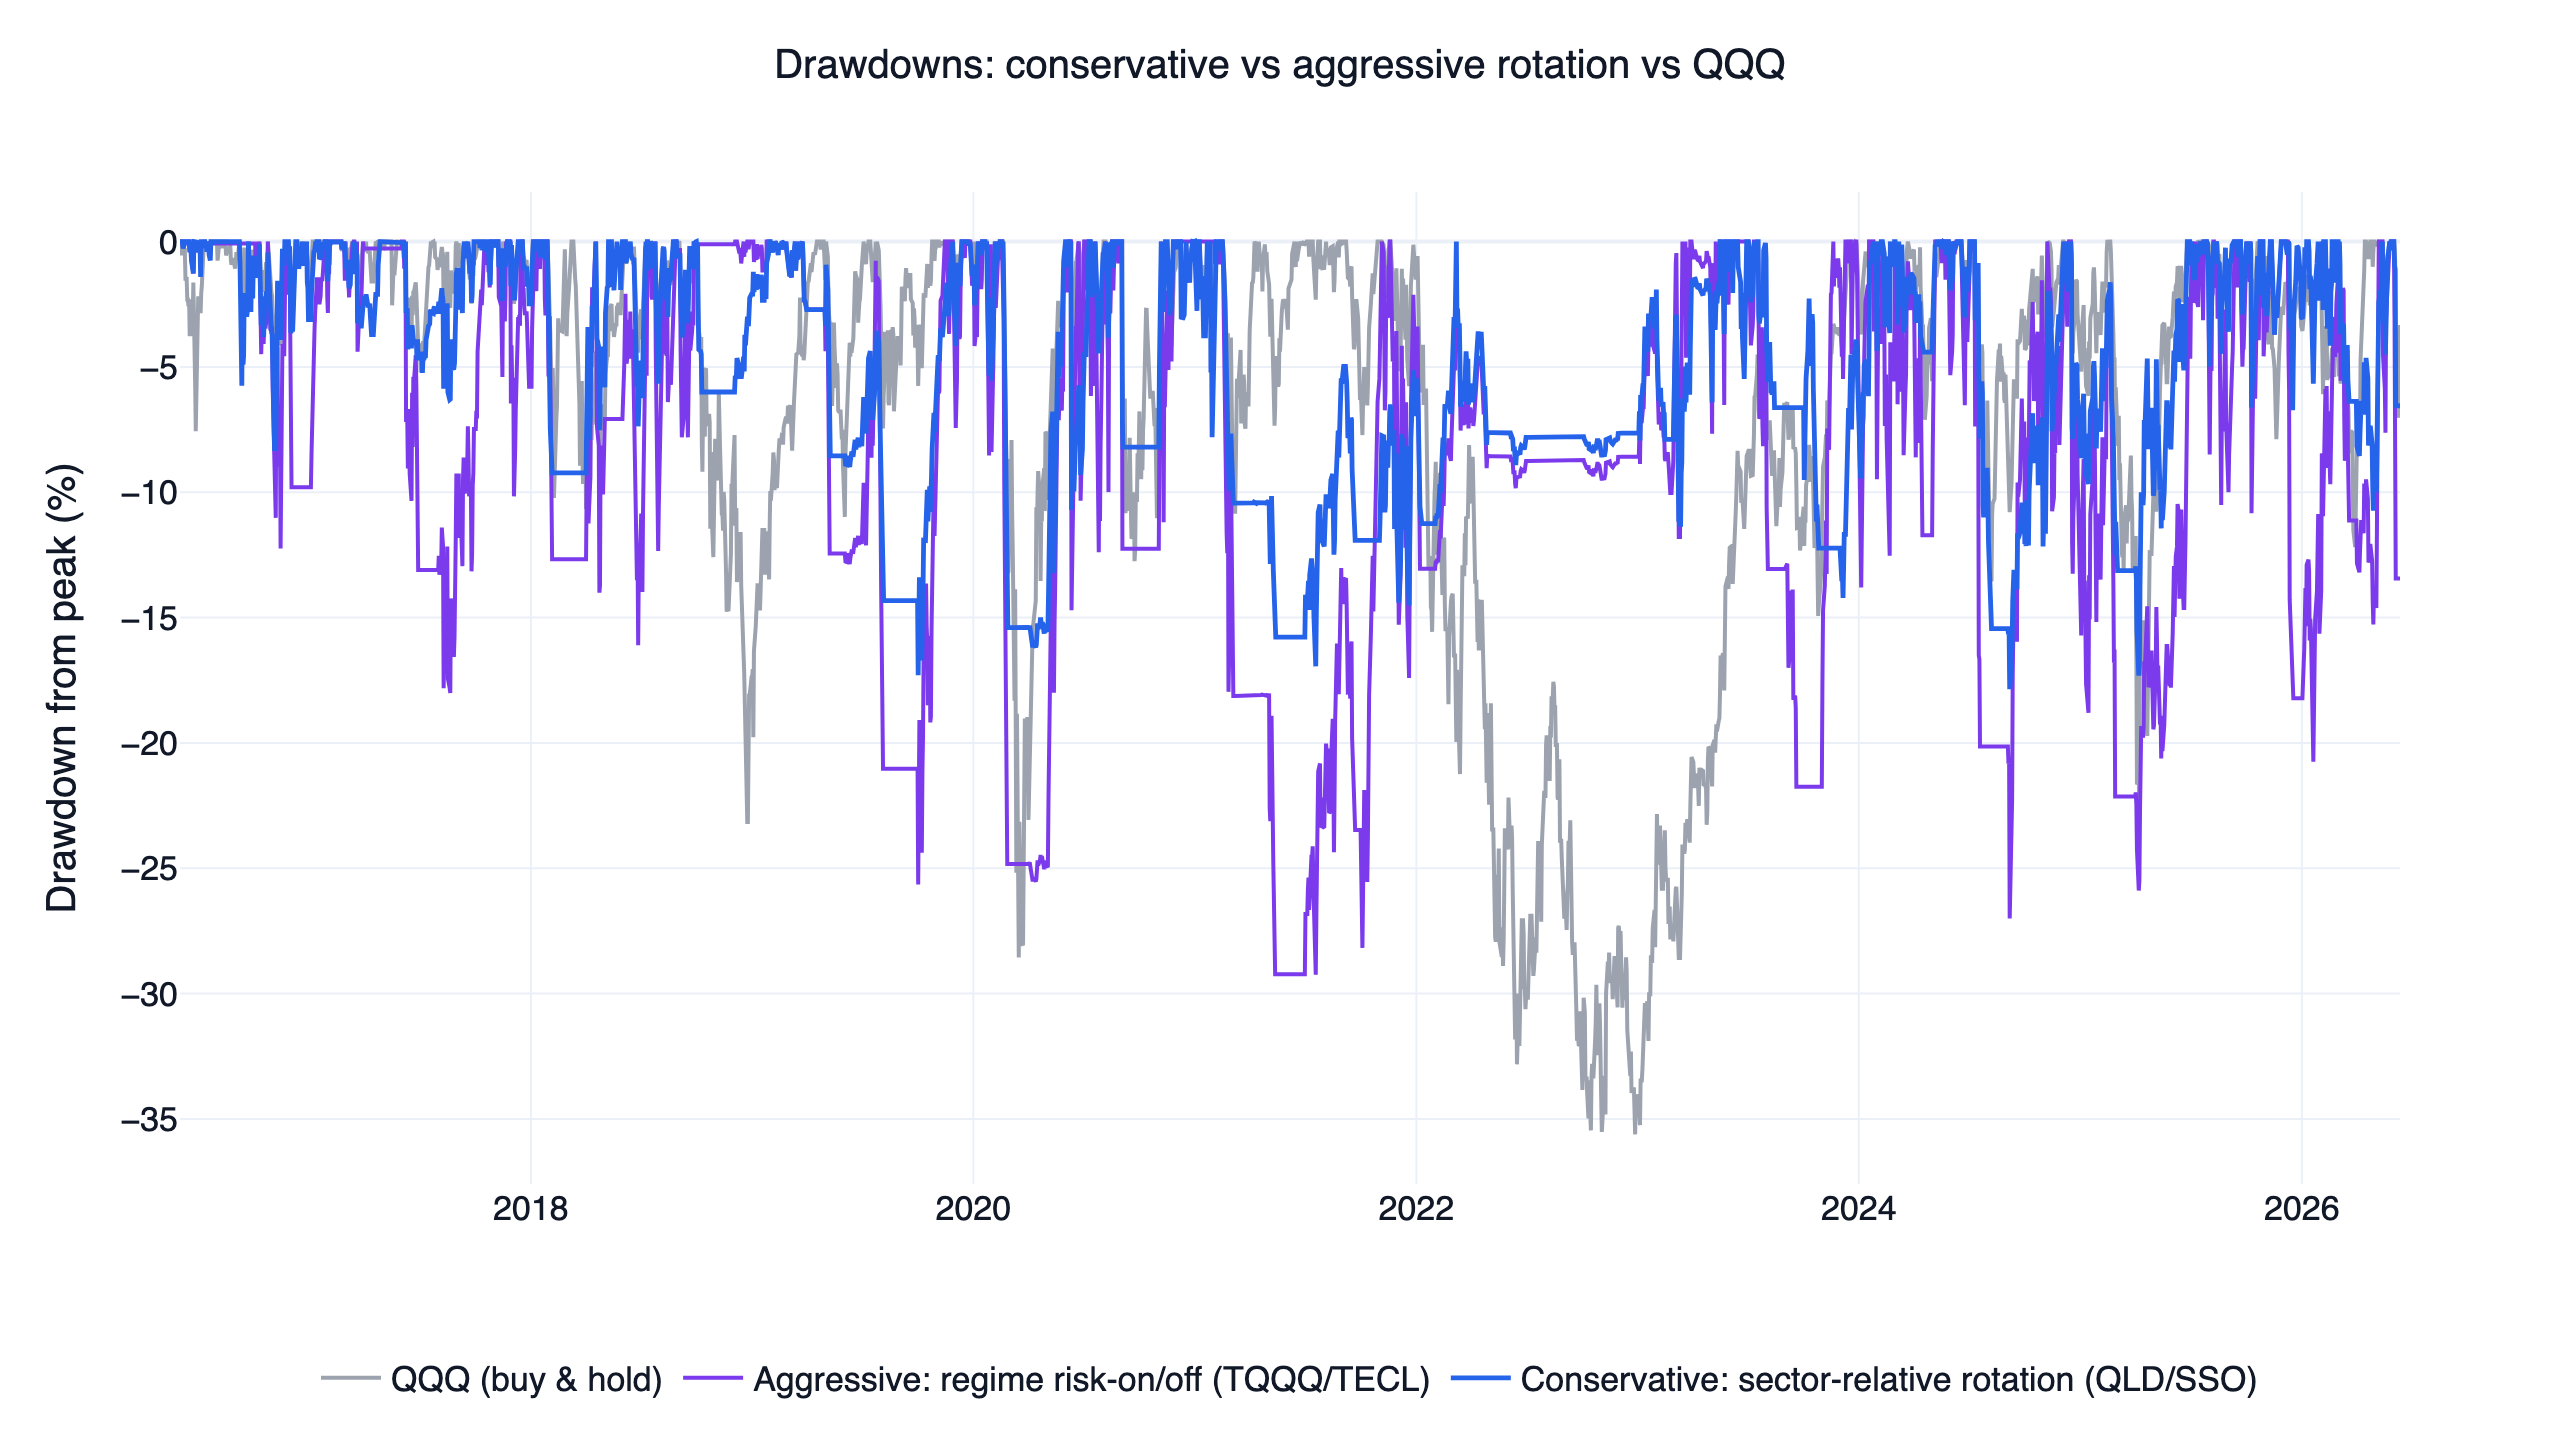
The conservative rotation's worst loss was -17.9%, the shallowest drawdown in the entire ten-strategy family, achieved while holding 2x leveraged funds for most of the decade. The aggressive system bottomed at -29.3%. Both stayed shallower than QQQ's unleveraged -35.6% in the 2022 bear market, which is the cleanest single illustration of what the regime switch buys.
What each system actually held also confirms the "one idea, two budgets" framing:
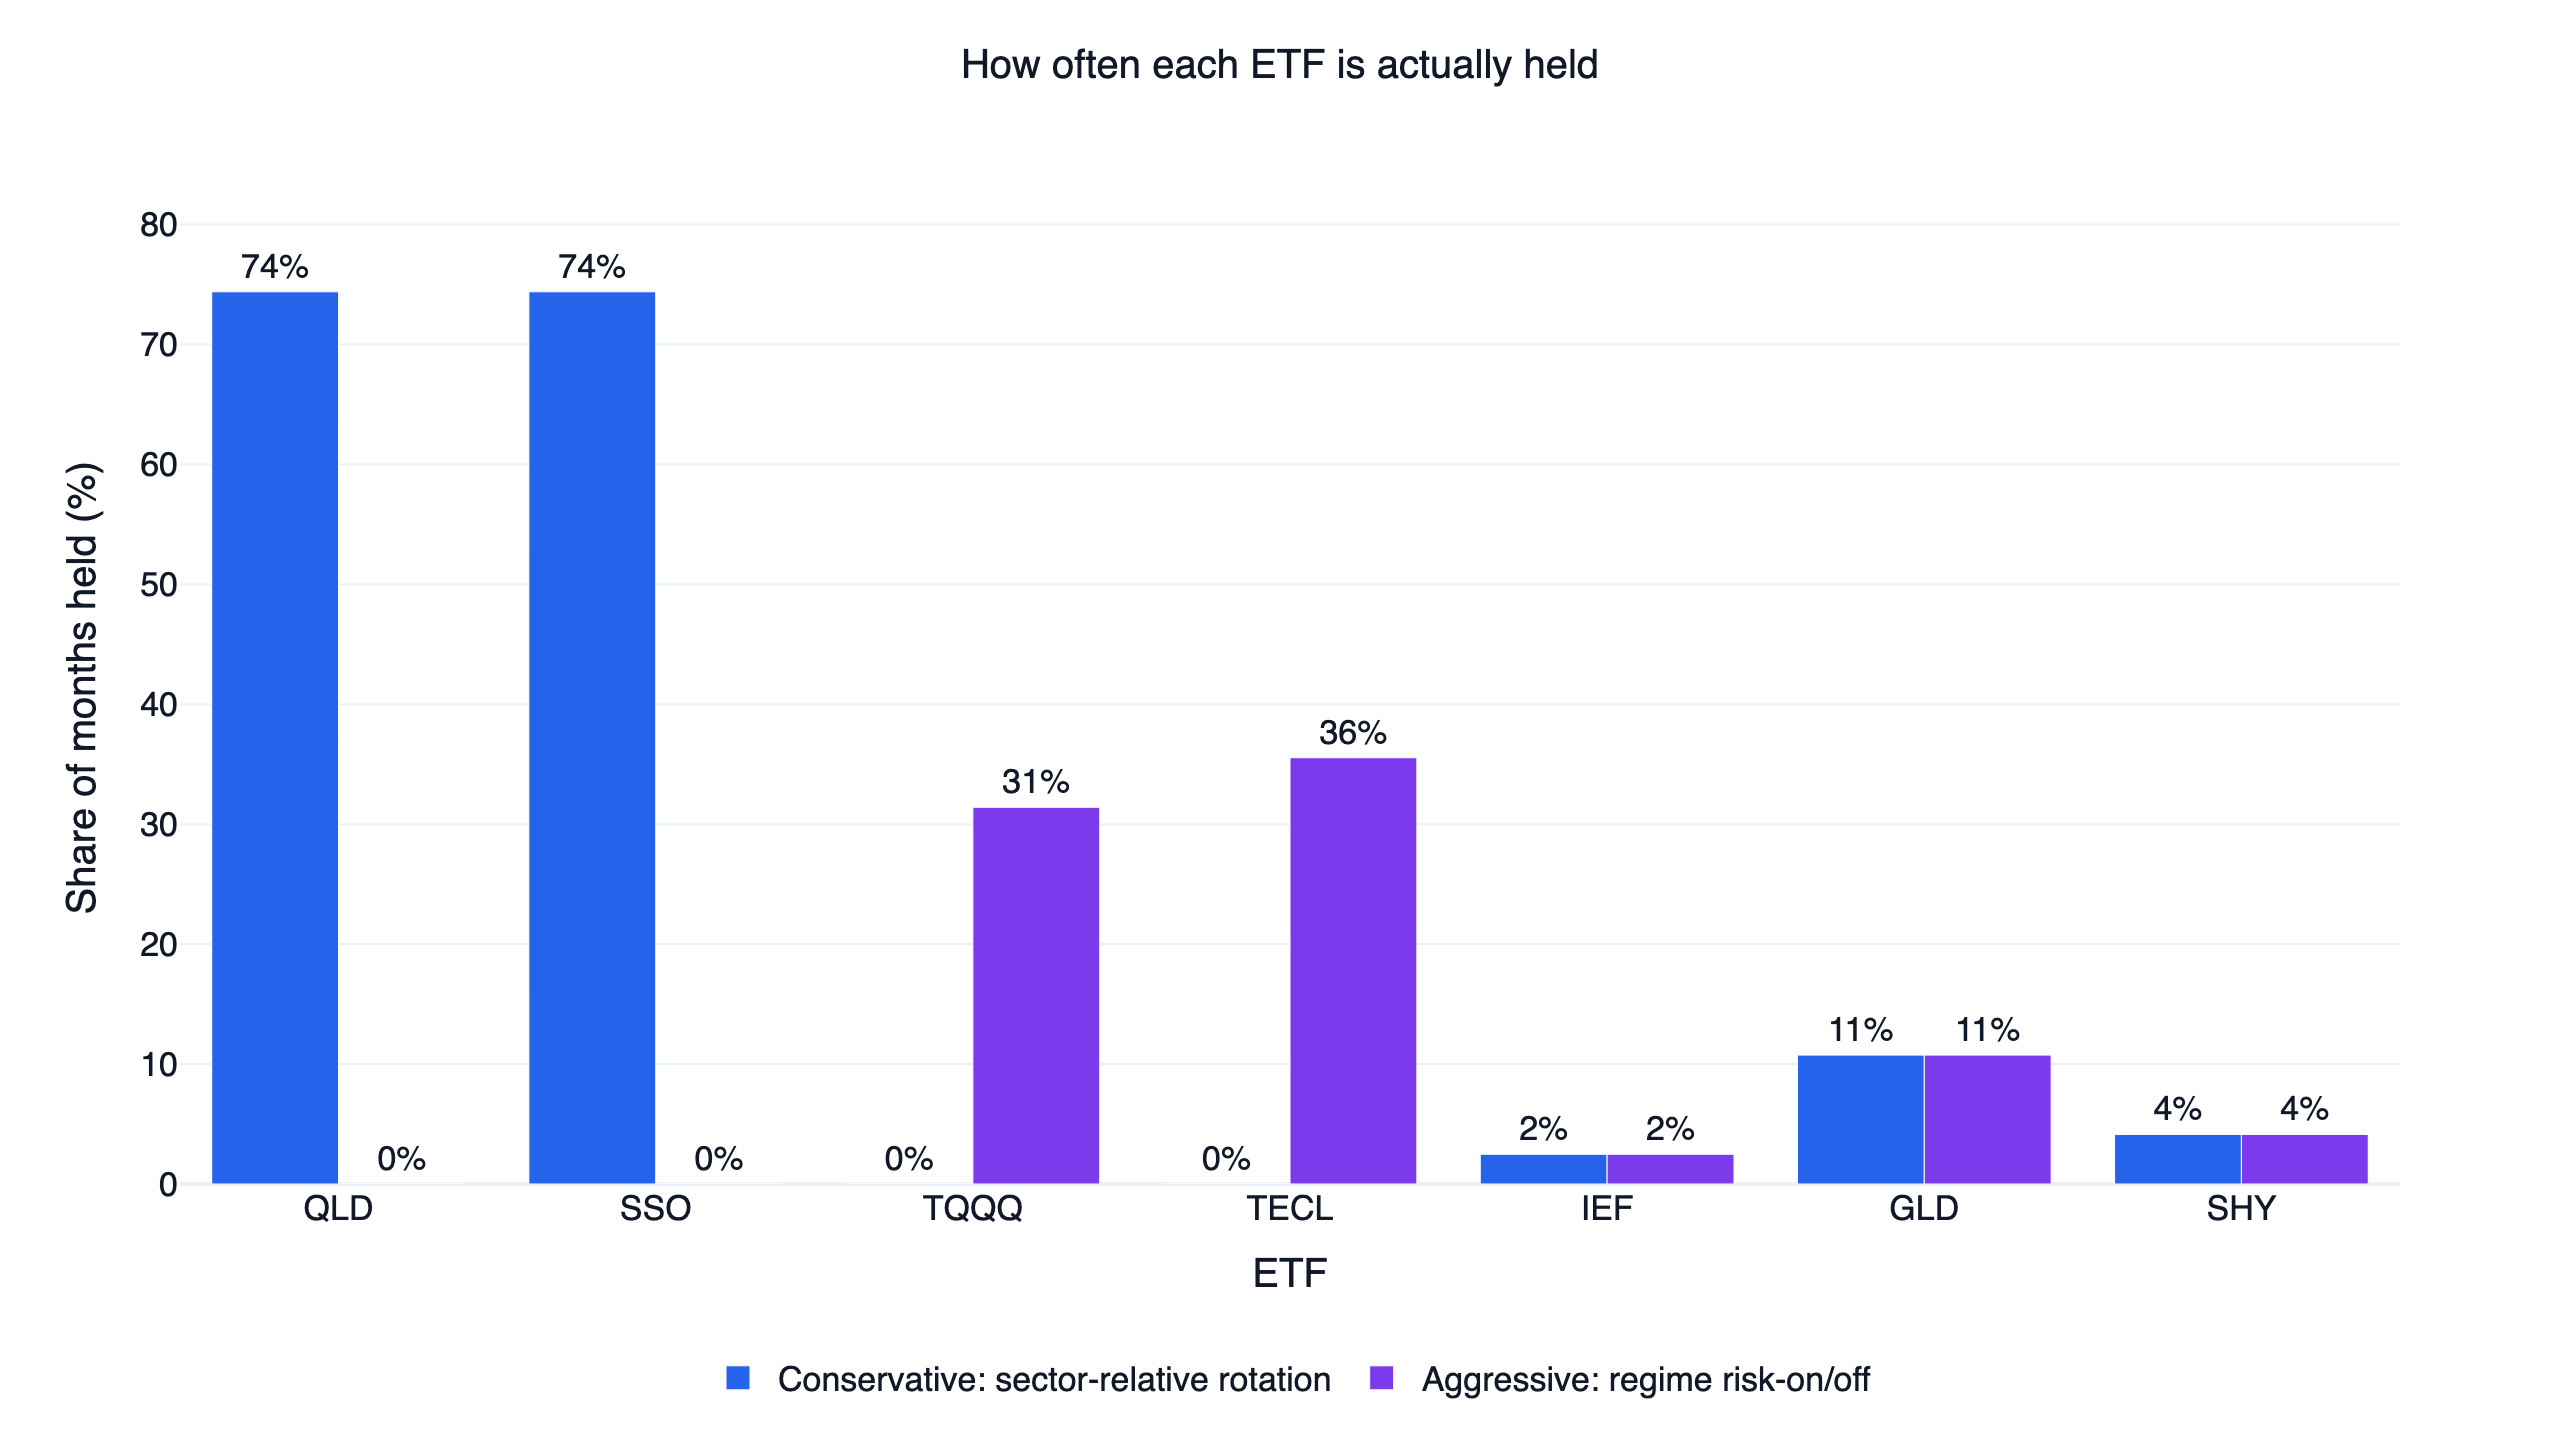
The conservative system held QLD and SSO simultaneously in 74% of months, so it behaves like a 2x index basket with a regime exit rather than an active picker. The aggressive system split its risk-on months between TECL (36%) and TQQQ (31%). Both parked in the same defensive sleeve for about 17% of months. The gap to 100% is cash forced by stops: the conservative system's tight 6% stop left it un-invested in roughly 8% of monthly snapshots, the aggressive system's 10% stop in roughly 16%. (Occupancy is measured at the 121 month-end rebalance snapshots, which approximates but is not literally the share of trading days.)
Out-of-sample: 2022 onward, untouched
Both systems were calibrated on 2016-2021 data and then left untouched on 2022-present, an unseen stretch that includes the 2022 bear market and the recovery after it.
| Period | Conservative CAGR / Sharpe | Aggressive CAGR / Sharpe | QQQ CAGR / Sharpe |
|---|---|---|---|
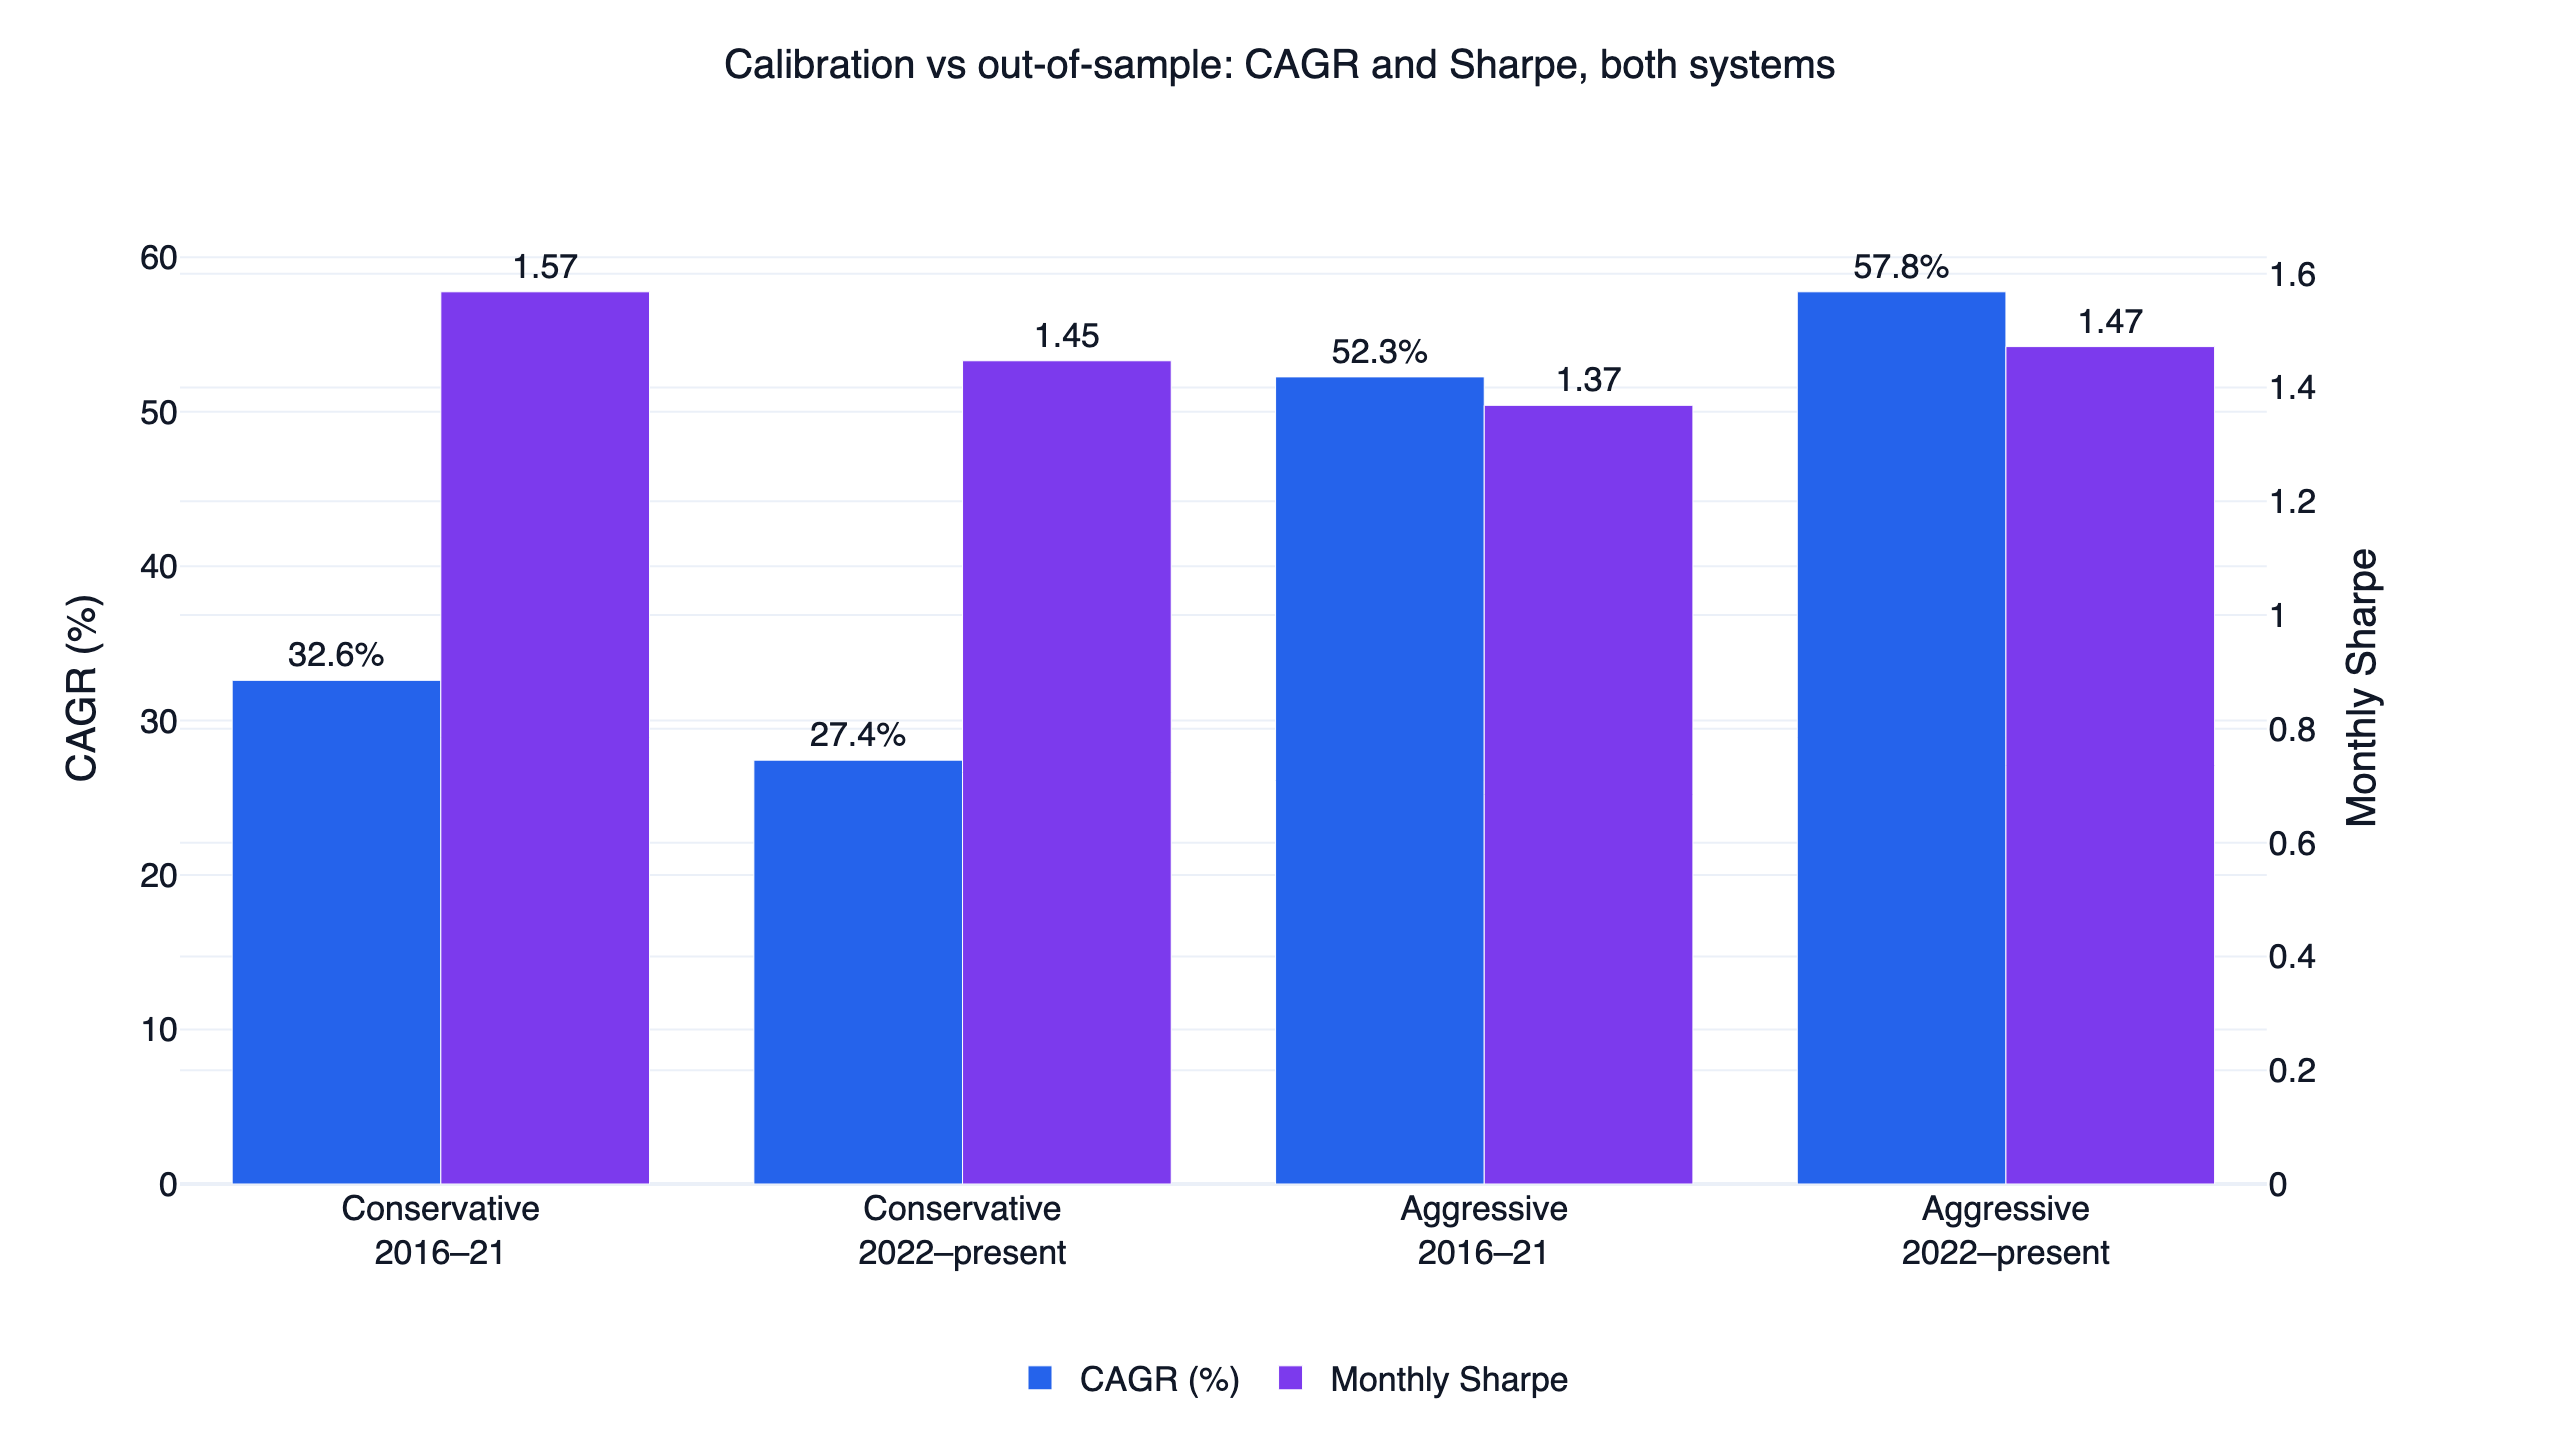
| Research (2016-2021) | 32.6% / 1.57 | 52.3% / 1.37 | 25.8% / 1.52 |
| Out-of-sample (2022-present) | 27.4% / 1.45 | 57.8% / 1.47 | 14.1% / 0.84 |
The conservative system gave back a little CAGR out of sample (32.6% to 27.4%) while QQQ's own CAGR nearly halved over the same stretch, so its relative edge widened. Note what the research column says about the benchmark: simply holding QQQ delivered a 1.52 monthly Sharpe in 2016-2021, ahead of the aggressive system's 1.37 and only a touch behind the conservative system's 1.57 — in a strong bull market, the rotation's risk-adjusted edge over buy-and-hold was thin. The separation came out of sample: the aggressive system actually improved (52.3% to 57.8% CAGR, Sharpe 1.37 to 1.47) while QQQ fell to 0.84, mostly because sitting in gold and treasuries through 2022 avoided the period that crushed everything leveraged. One unseen market cycle is supportive evidence, and it is still only one cycle.
Backtest method and limits
| Item | These backtests |
|---|---|
| Transaction costs | Not modeled (fee_ratio=0, tax_ratio=0). At 2.5x (conservative) and 5.0x (aggressive) annual turnover with commission-free US brokers the impact is small, but spreads and slippage on leveraged ETFs would reduce live returns below these figures. |
| Leverage decay | Already reflected — the QLD/SSO/TQQQ/TECL price series include daily-reset drag and expense ratios. |
| Instruments | A fixed set of 7 ETFs; no stock universe and no survivorship issue in the signal, which reads QQQ only. |
| Rebalance / execution | Monthly rebalance at the close; touched stop of 6% (conservative) or 10% (aggressive) on the held ETF. |
| Sample | 2016-06 to 2021-12 calibration; 2022-01 to present out-of-sample. The mid-2016 start reflects the 200-day moving-average and 126-day momentum warmup; benchmark statistics use this identical window. |
| Benchmark | QQQ total return over the identical window, with SPY as a broad-market reference. |
| Capacity | Not estimated. Leveraged ETF liquidity is large, but real impact depends on your size. |
Each strategy in this family is judged against a risk-adjusted gate of at least 1.5. Both systems clear it on monthly Sortino — 3.31 full-period and 3.44 out-of-sample for the conservative rotation, 3.29 and 3.82 for the aggressive system — and the conservative system's research-period monthly Sharpe of 1.57 clears it as well (though QQQ itself posted 1.52 over the same research window, so that figure says more about the 2016-2021 bull market than about the strategy). The full-period monthly Sharpe figures alone (1.38 and 1.33) sit below 1.5, so the Sortino and drawdown numbers, not the Sharpe, are the risk-adjusted case here. That reads as: the volatility these systems do retain is concentrated on the upside, while symmetric volatility-per-unit-return is only moderately better than QQQ's 1.11.
The leveraged-ETF risk you must understand
Everything above rides on 2x and 3x daily-reset products, and the leverage is the main thing that can hurt you:
- Daily reset and volatility drag. Leveraged ETFs compound daily, so a choppy, sideways market erodes value even if the index ends flat; the rebalancing mechanics are laid out in Cheng & Madhavan (2009). The regime filter reduces the time spent in exactly those high-volatility conditions; it does not repeal the mechanism.
- 3x path dependency and gaps. The aggressive system holds a single 3x fund. A fast crash inside a month is taken at full leverage until the stop or the next monthly rebalance reacts, and a large overnight gap can fill well below the 10% touched-stop level assumed in the backtest. Its -29.3% maximum drawdown dates to the 2016-2021 calibration period, and the unseen 2022-present stretch still reached -27.0%: drawdowns of that depth are a recurring cost of this risk budget, not a one-off.
- Whipsaw cost on the tight stop. The conservative system's 6% stop repeatedly knocked it out during volatile but ultimately profitable risk-on recoveries. Those forced exits are why it sat in cash in about 8% of monthly snapshots and traded 175 times against the aggressive system's 94.
- Concentration. One or two ETFs means single-theme (large-cap US growth) exposure; the defensive sleeve concentrated in gold for most of its 17% of months.
If a -29.3% drawdown at 34% annualized volatility is outside what you can hold, the conservative version exists for exactly that reason, and an unleveraged variant of the same signal (QQQ in risk-on, defensive otherwise) is a one-line change in the downloadable script your AI agent can run.
Who this is for
The conservative rotation fits an investor who wants index-like simplicity with a rules-based exit, accepts 2x leverage, and values the shallowest drawdown in this strategy family over the highest return. The aggressive version fits someone who can genuinely tolerate a roughly -30% loss and a single 3x holding in exchange for the family's second-highest compounding. Neither fits anyone who needs capital stability, cannot monitor a monthly rebalance, or is uncomfortable holding leveraged products at any time.
FAQ
What is a risk-on/risk-off ETF rotation strategy? A rules-based system that holds equity ETFs while a market-regime signal is positive and rotates into defensive ETFs (treasuries, gold, cash-like funds) when it turns negative. Here the signal is QQQ above its 200-day moving average with a positive 126-day return, checked at a monthly rebalance.
Does the signal predict crashes? No. Risk-off months actually averaged higher QQQ returns (24.7% versus 19.1% annualized) because rebounds begin inside risk-off. What the signal filters is volatility (26.6% versus 15.6%) and tail risk (worst month -13.6% versus -8.7%), which is what matters for holding leveraged ETFs.
Which version should I look at first? The conservative one. It has the shallower drawdown (-17.9%), the higher full-period Sharpe (1.38), and held simple 2x index exposure 74% of the time. The aggressive version is the same signal with a bigger risk budget, and its extra 24 points of CAGR were paid for with a -29.3% drawdown and 34% volatility.
Why monthly rebalancing instead of daily? Monthly checking keeps turnover at 2.5x to 5x per year and avoids reacting to every whipsaw; the median regime spell lasted only 8-9 trading days. The cost is that fast crashes inside a month are absorbed at full leverage until the stop triggers.
What data do I need to run it?
Only FinLab's us_fund_price:* ETF series; there is no single-stock data in either system. A standard FinLab account covers it.
Can I run this myself? Yes — use the AI-assisted setup flow, or download the script below and run it after setup.
Reproduce it yourself
Two files reproduce everything above:
- strategy.py — both systems in one script; set
STRATEGY = "conservative"or"aggressive"and run it with AI-assisted setup flow. - data.csv — daily rebased equity curves for both systems, QQQ, and SPY, plus the daily risk-on flag.
The fastest path is to use the AI-assisted setup flow and ask your AI agent to modify it: drop the leverage, swap GLD for IEF in the defensive sleeve, or change the 126-day lookback, and let the agent re-run the backtest. To see how these two systems compare with the other eight in the family, read the US quant trading strategies overview; the stock-factor side of the family starts with the US momentum strategy. For related research, see the new-high momentum study, the AI quant research workflow, and the PEG value strategy; definitions for the metrics used here are in the glossary. For more write-ups, browse the FinLab research blog, the use cases, and the team behind FinLab.
Last updated: 2026-06 | Backtest window: 2016-06 to 2026-06 | Benchmark: QQQ total return | Author: FinLab Quant Research (reviewed by a quantitative researcher)
Investing involves risk, and past performance does not represent future results. Leveraged ETFs carry additional risks including volatility decay and amplified losses. This content is for educational purposes only and is not investment advice and does not constitute investment advice; evaluate any strategy against your own risk tolerance.
FinLab AI
Want to build your own strategy?
Describe your stock-picking ideas in natural language. AI automatically validates, backtests, and gives you answers
Start Free