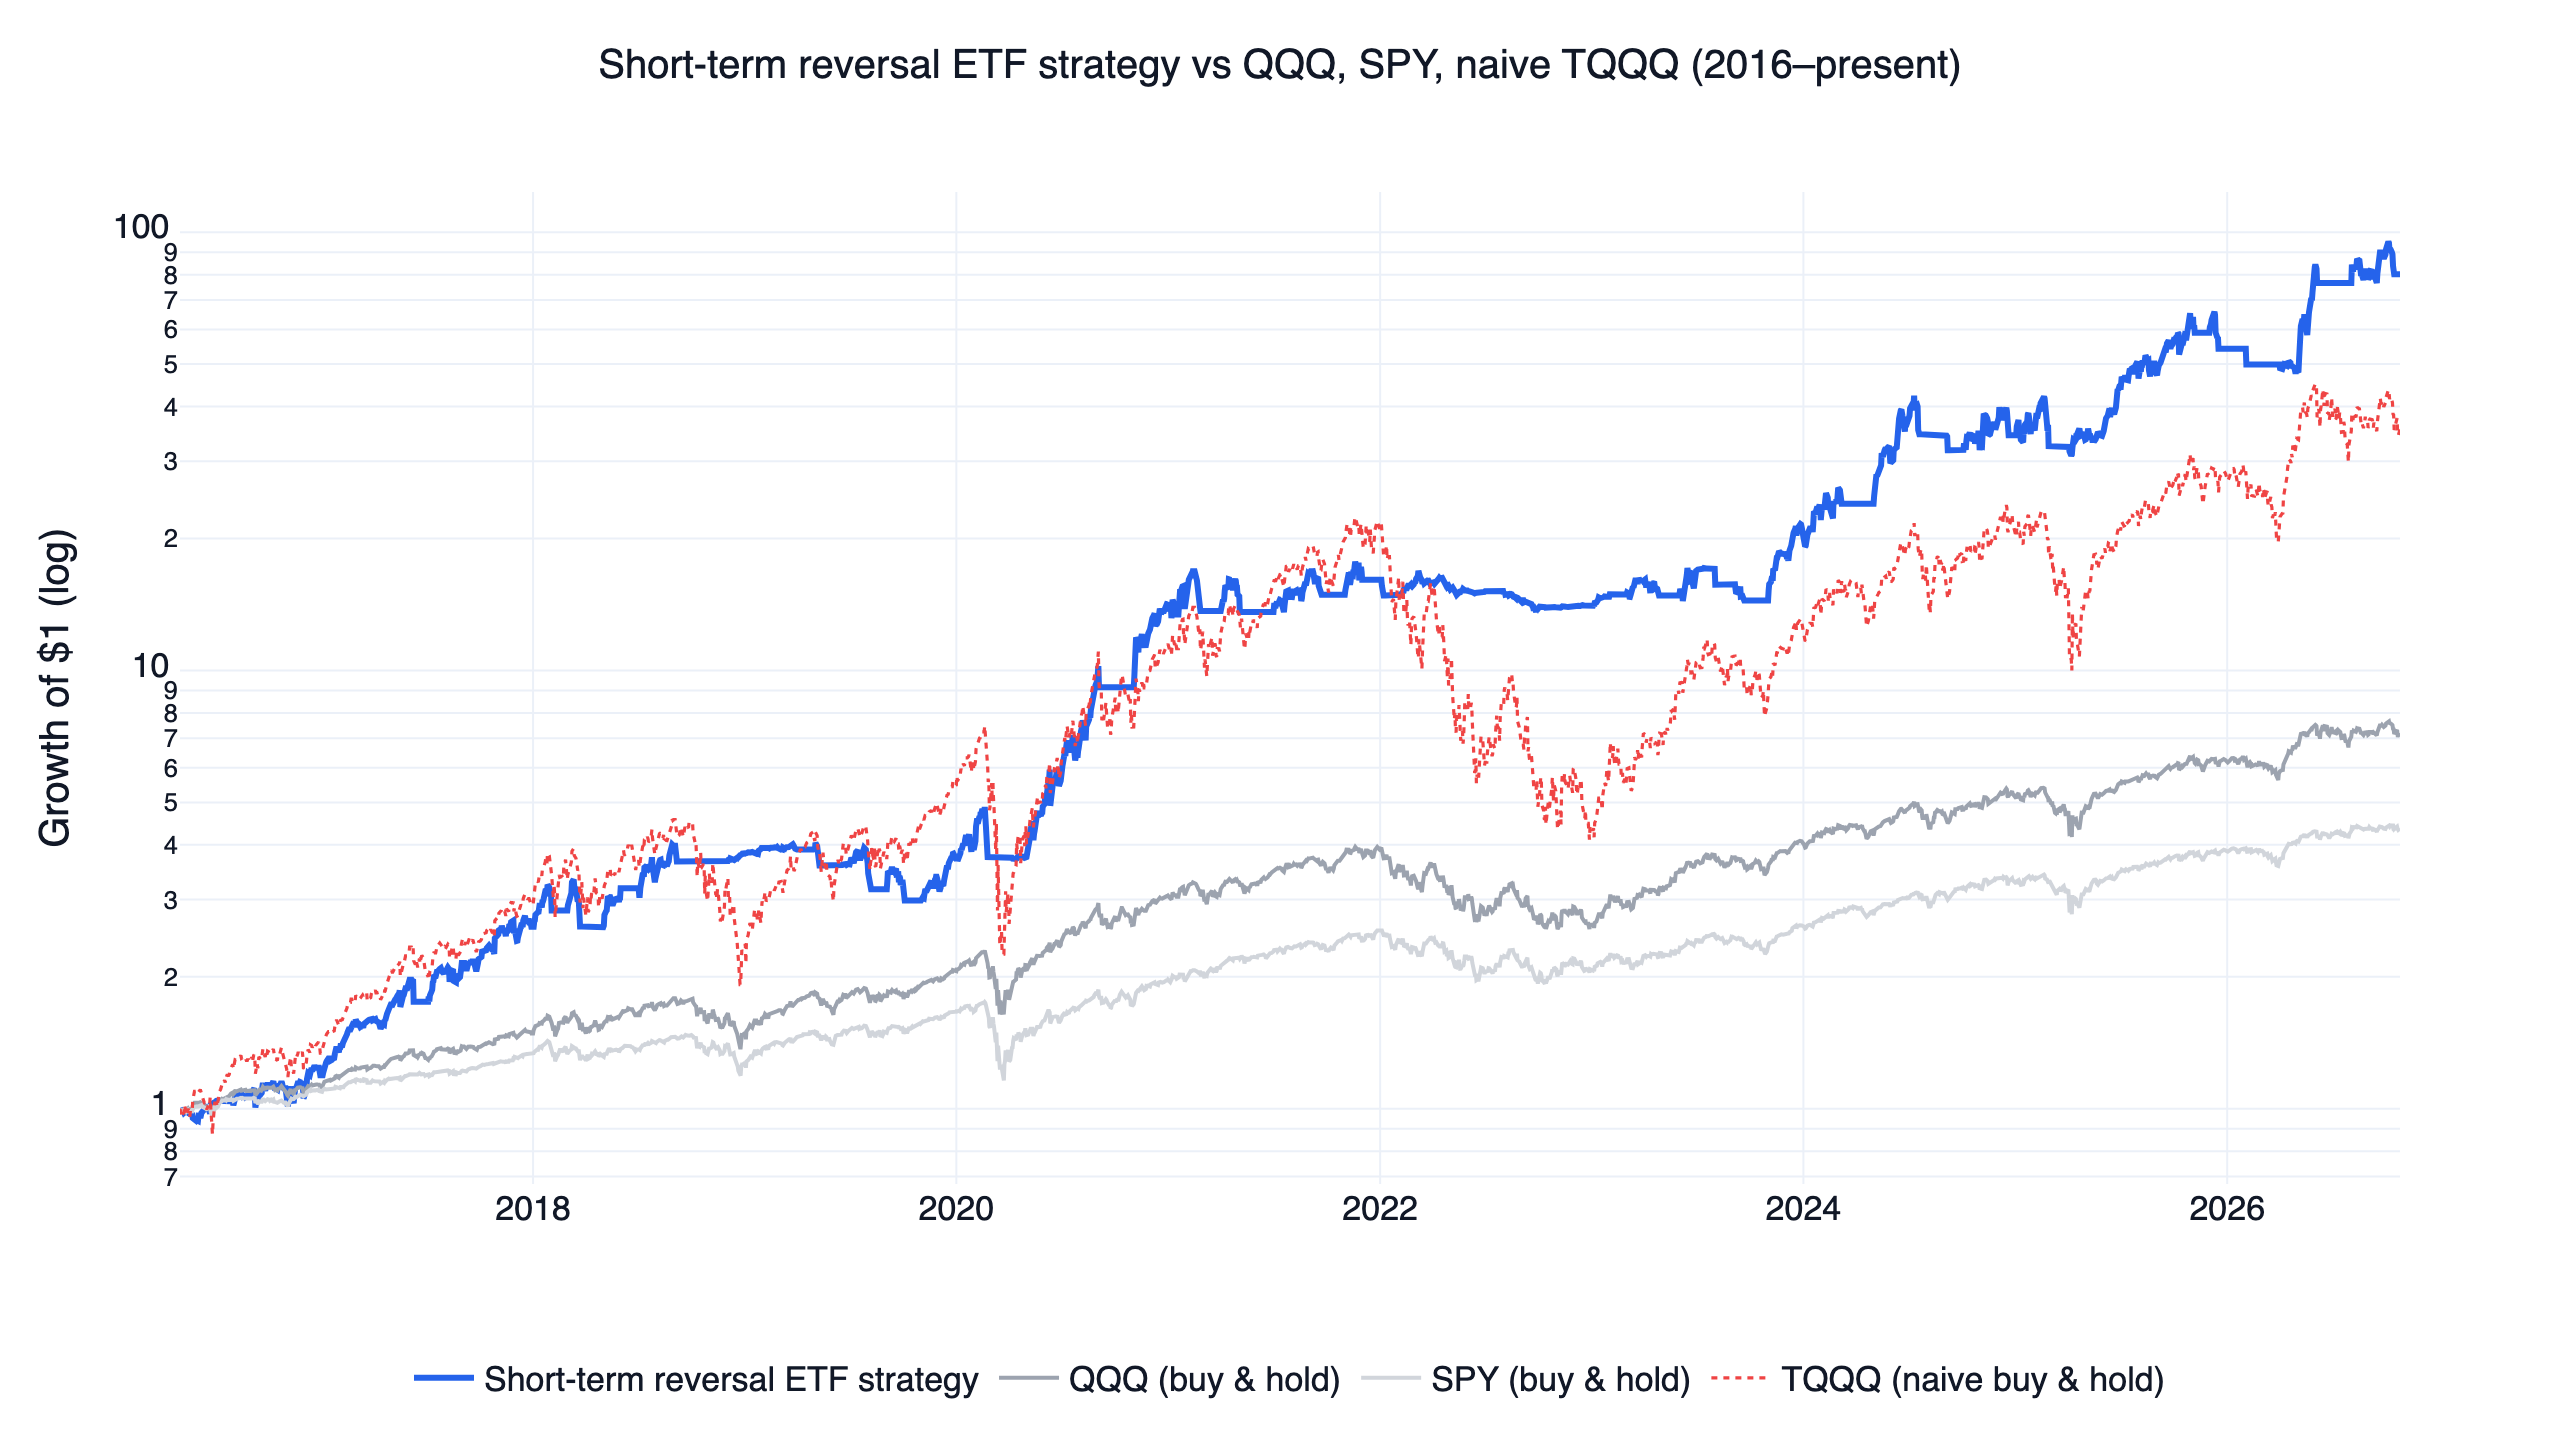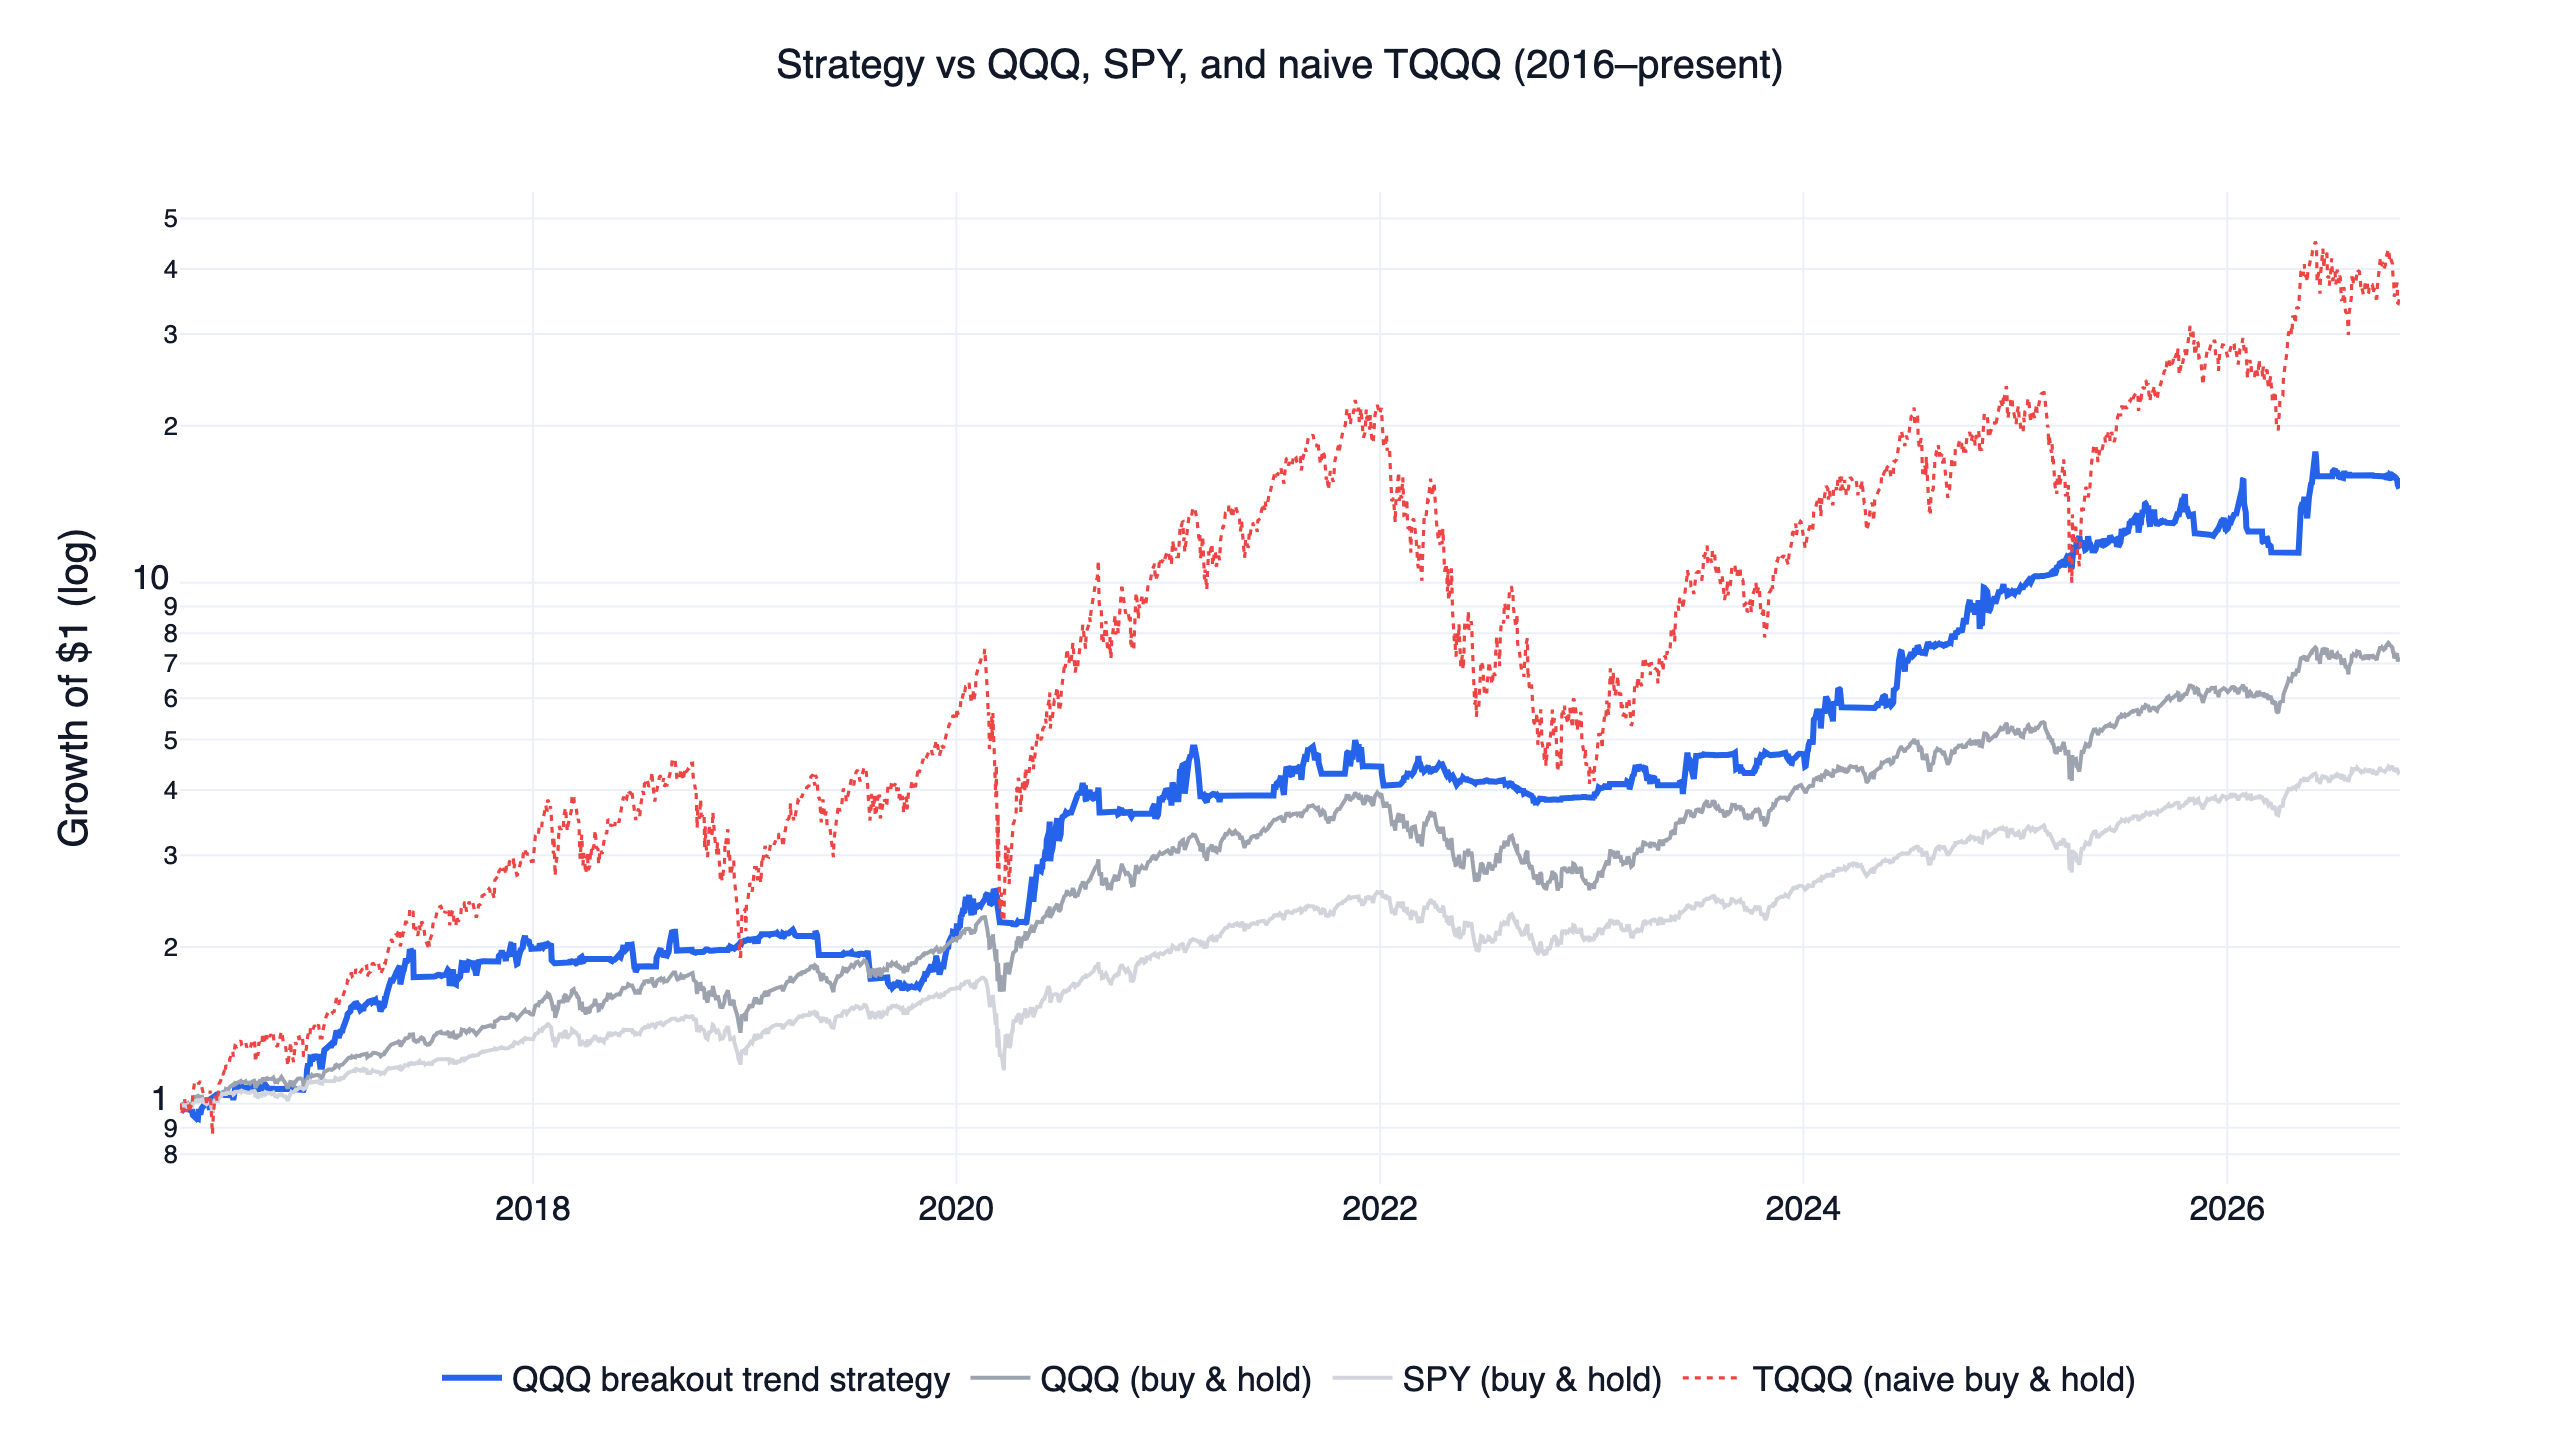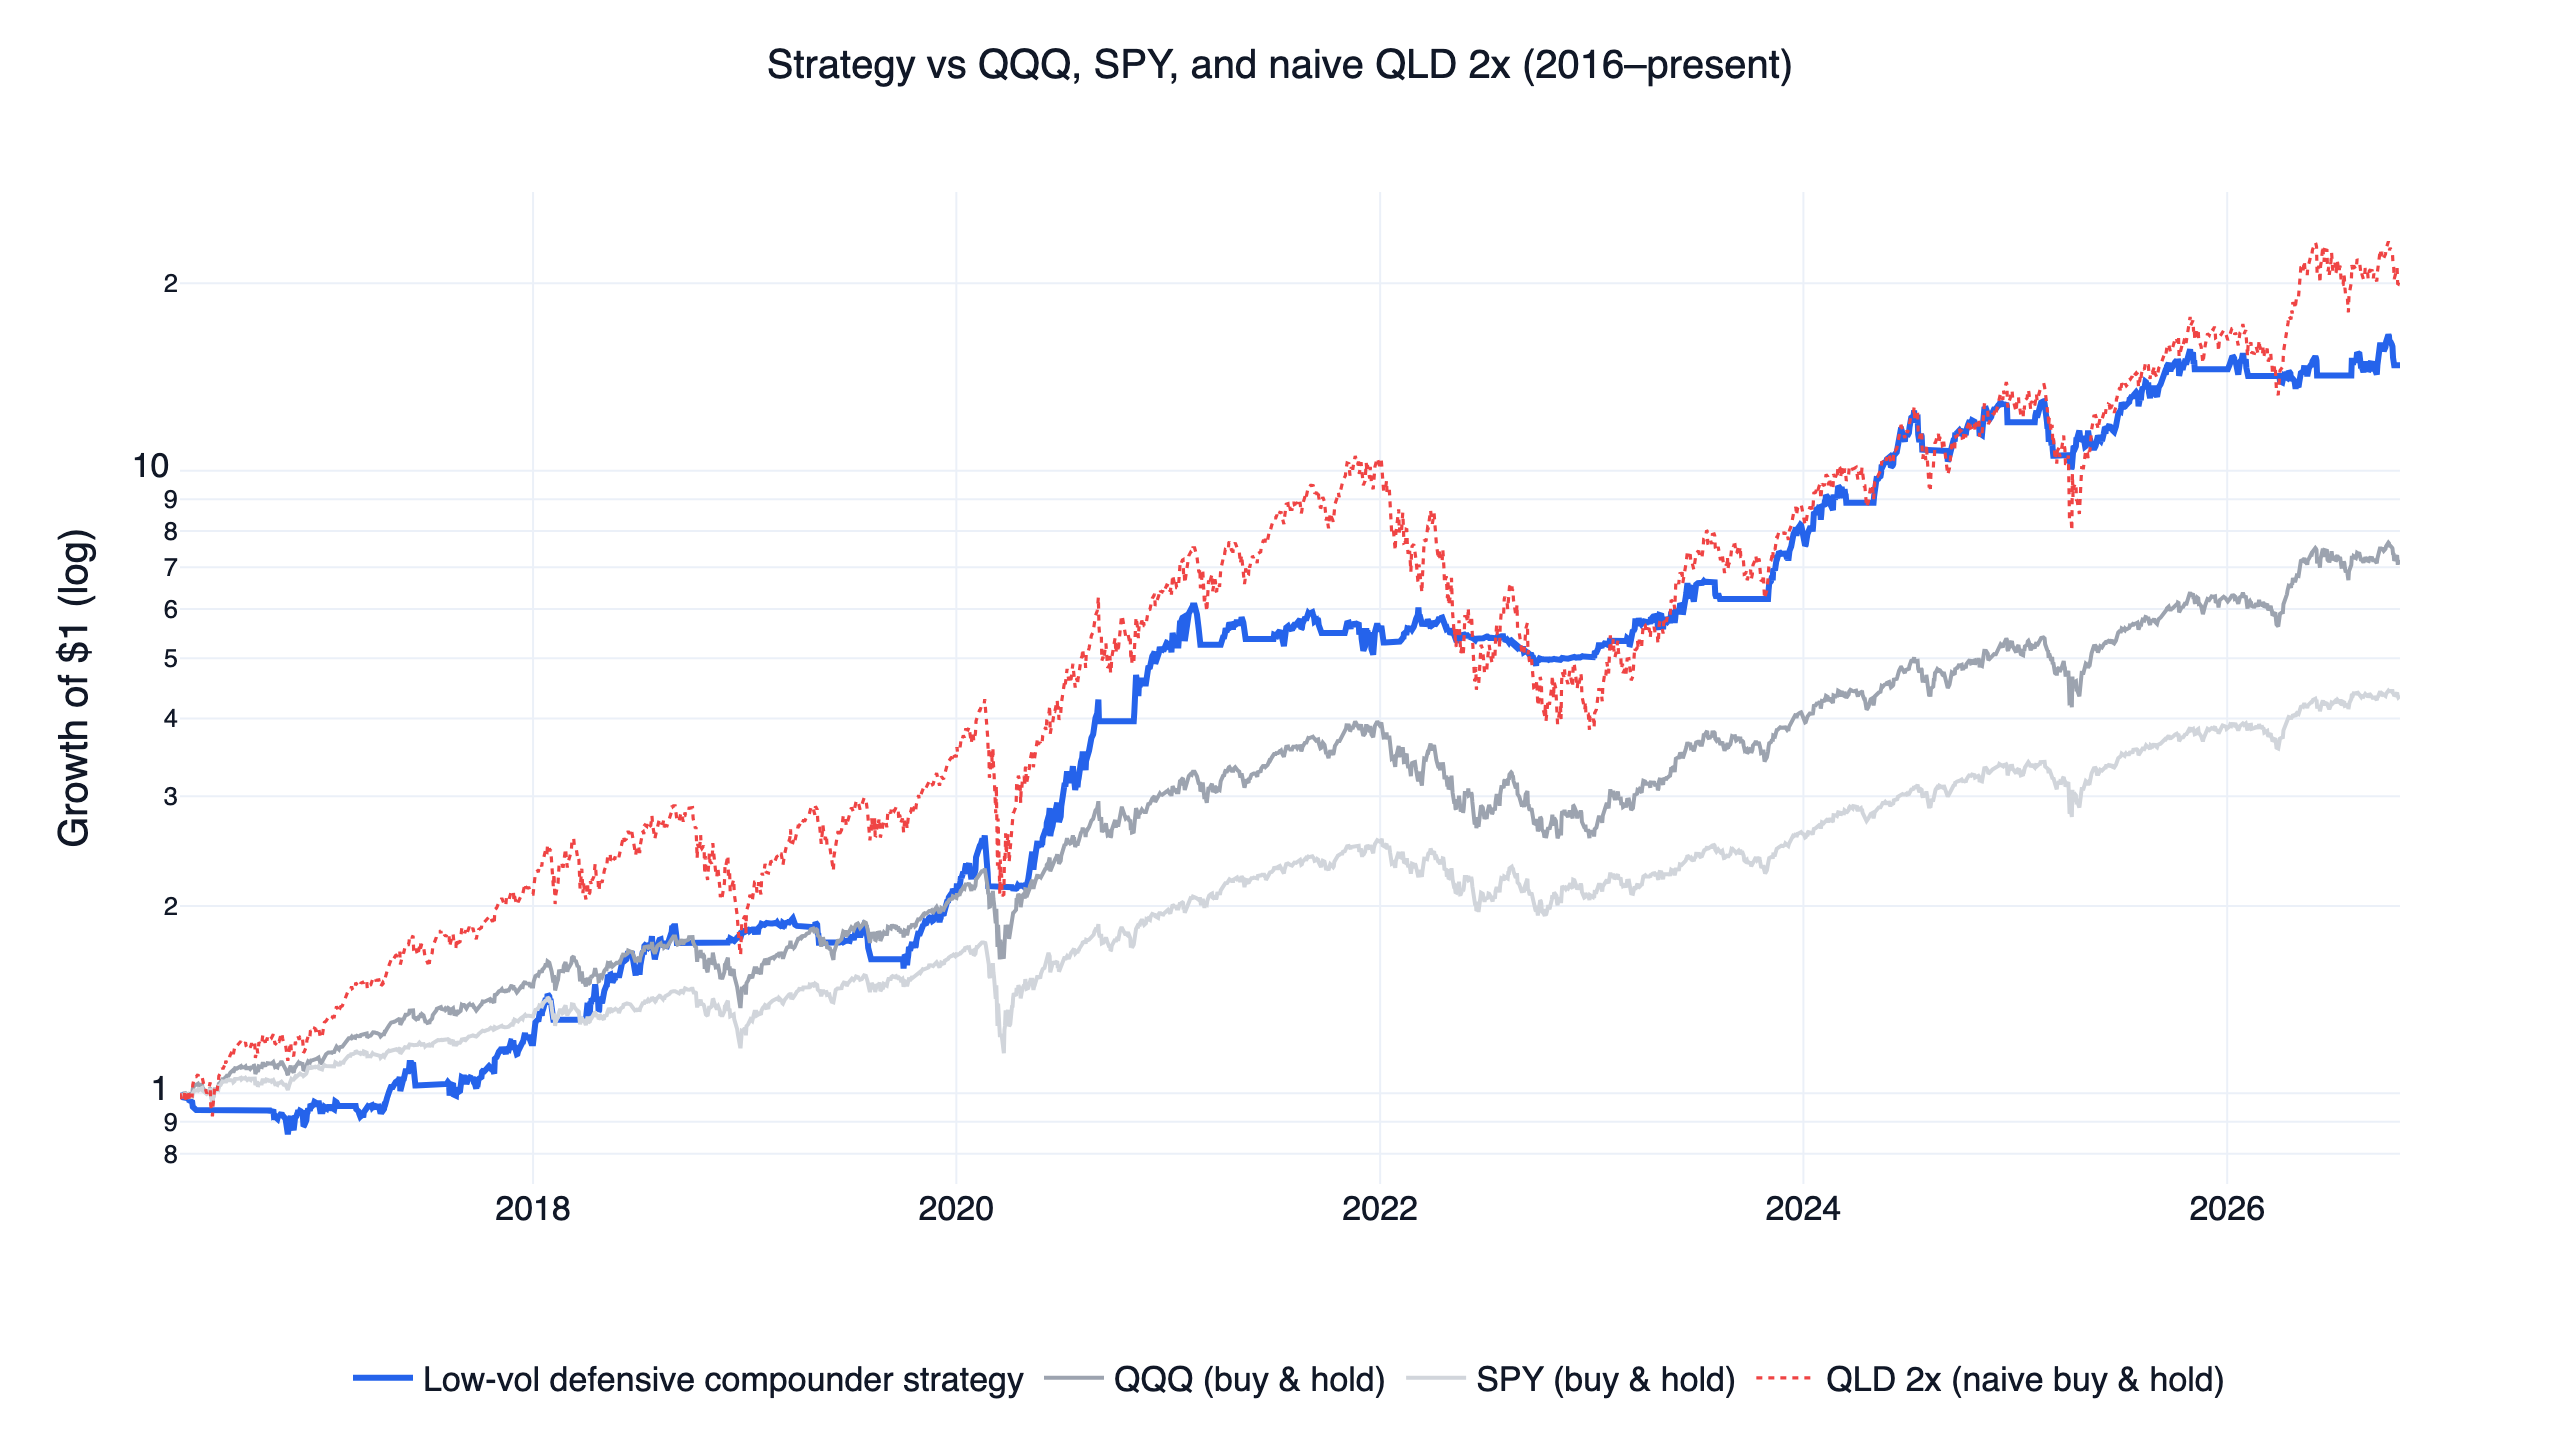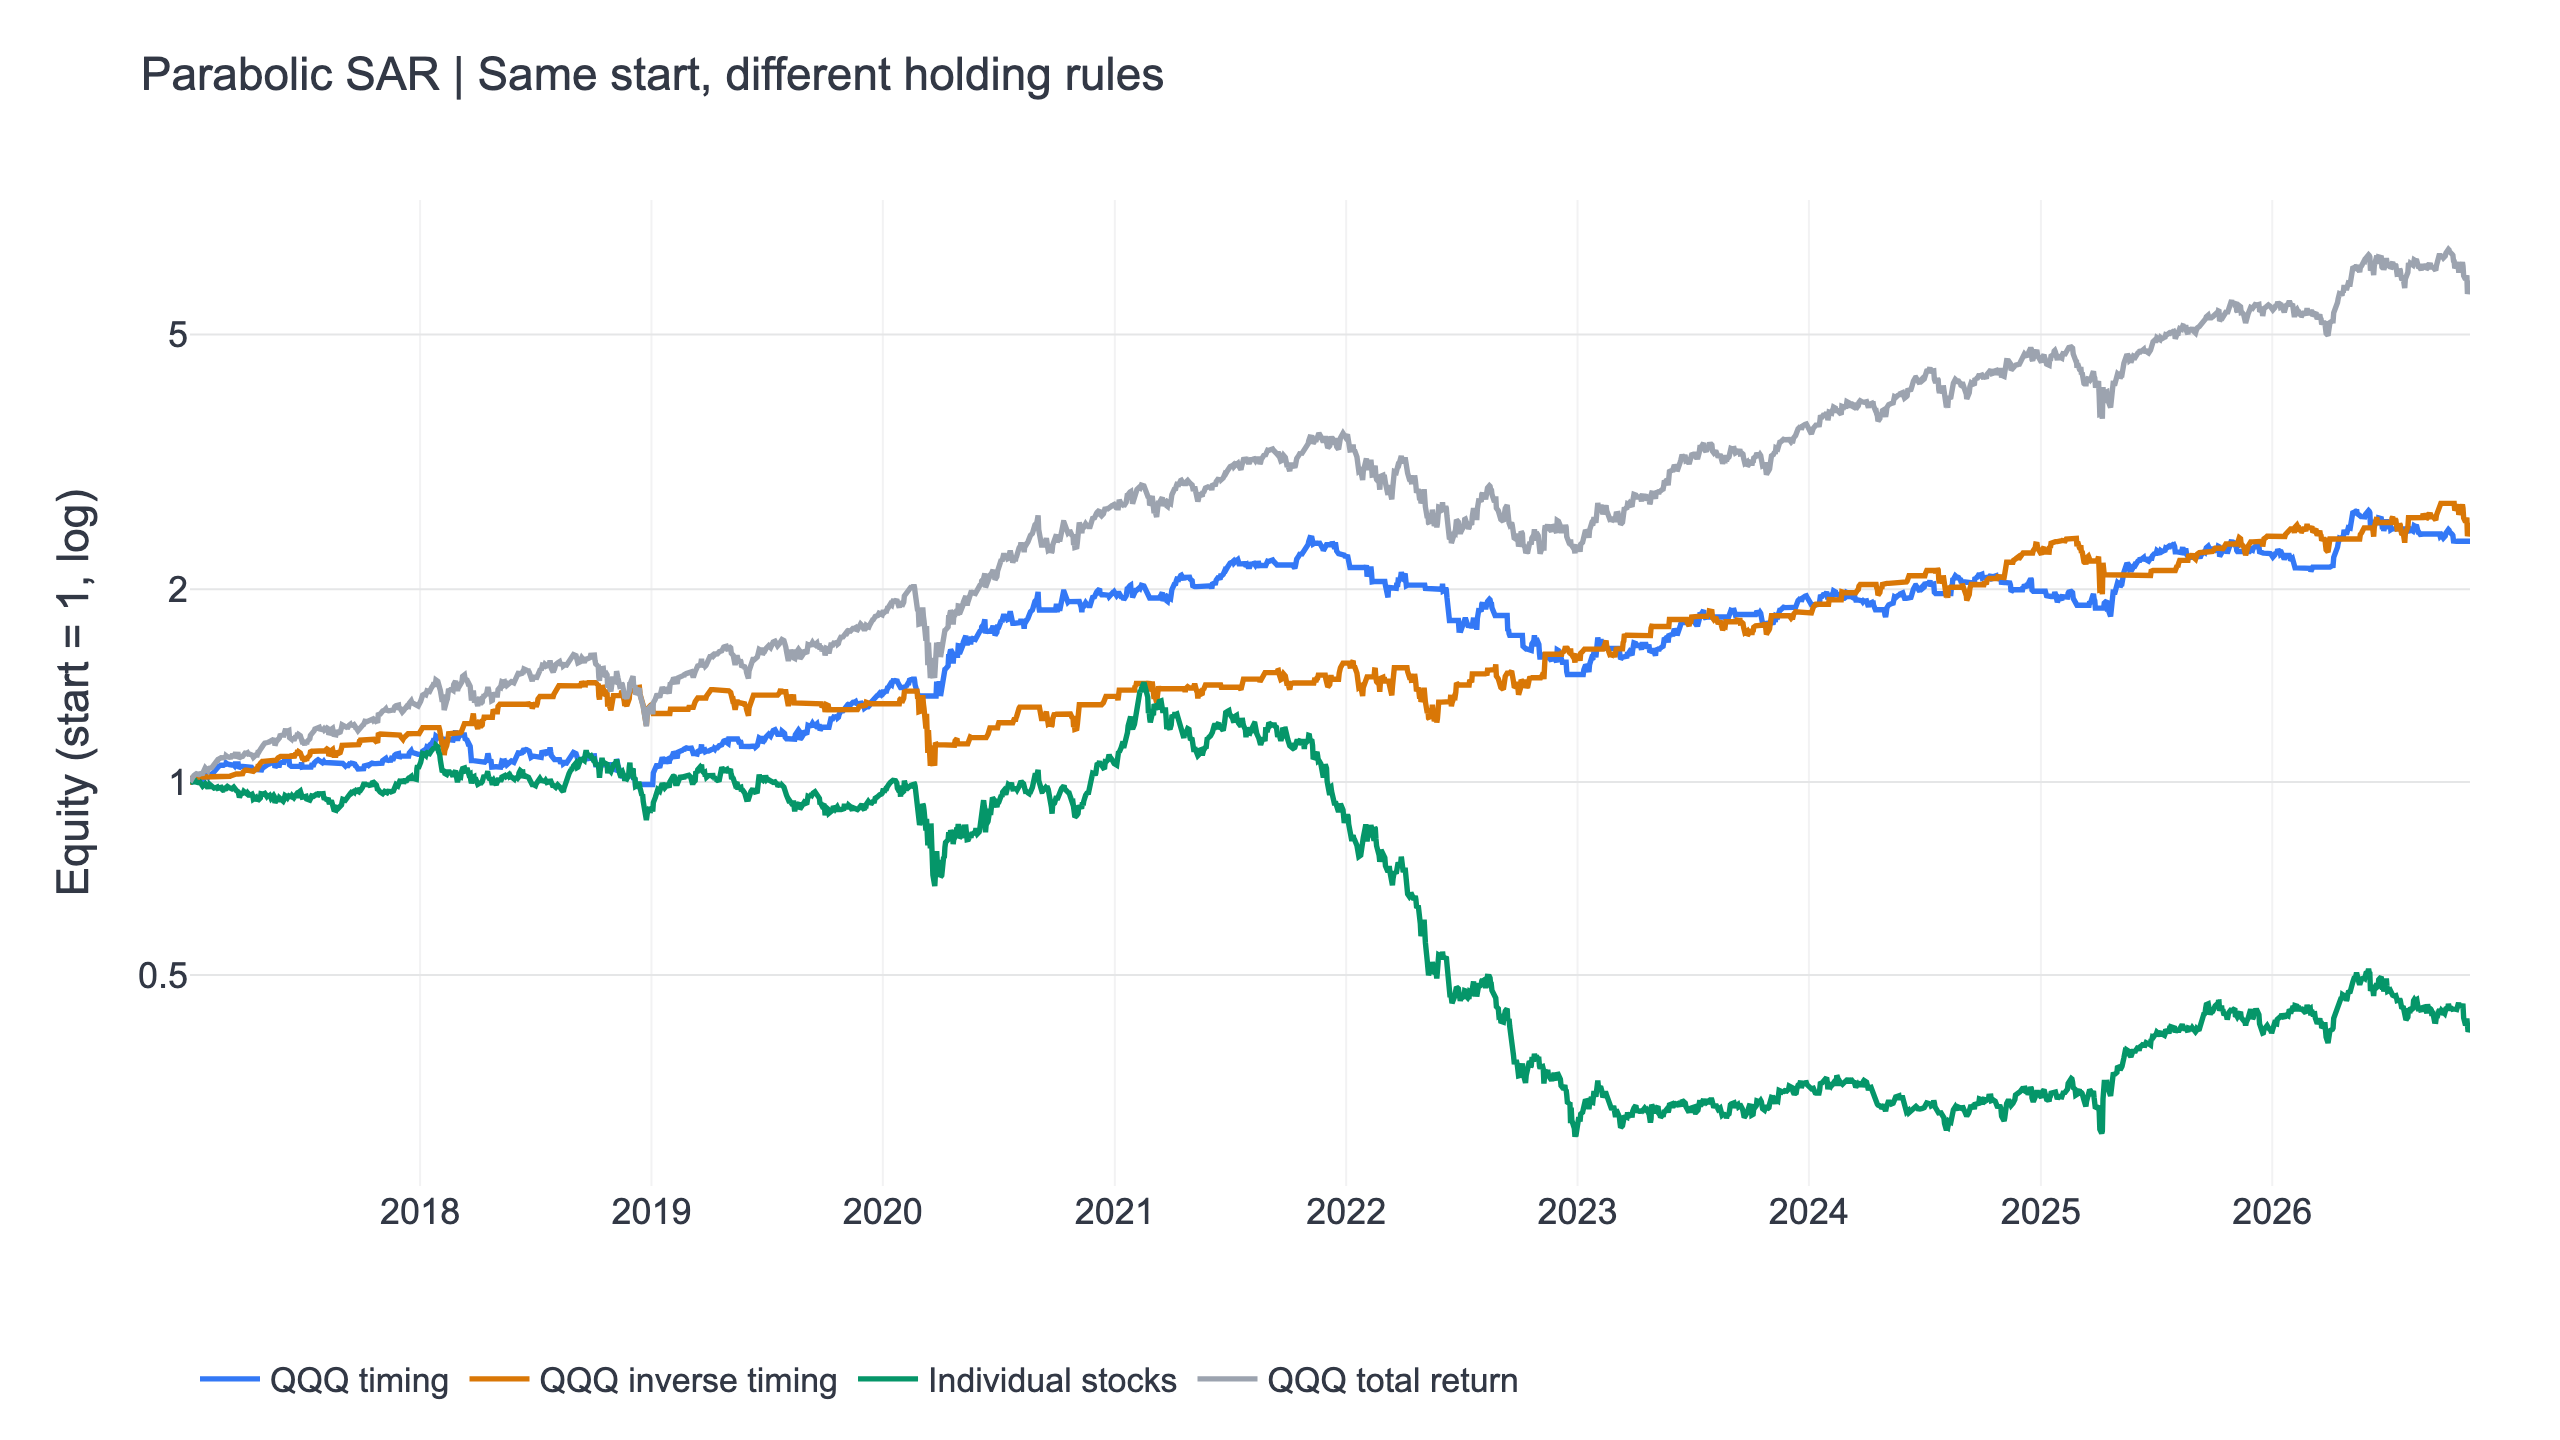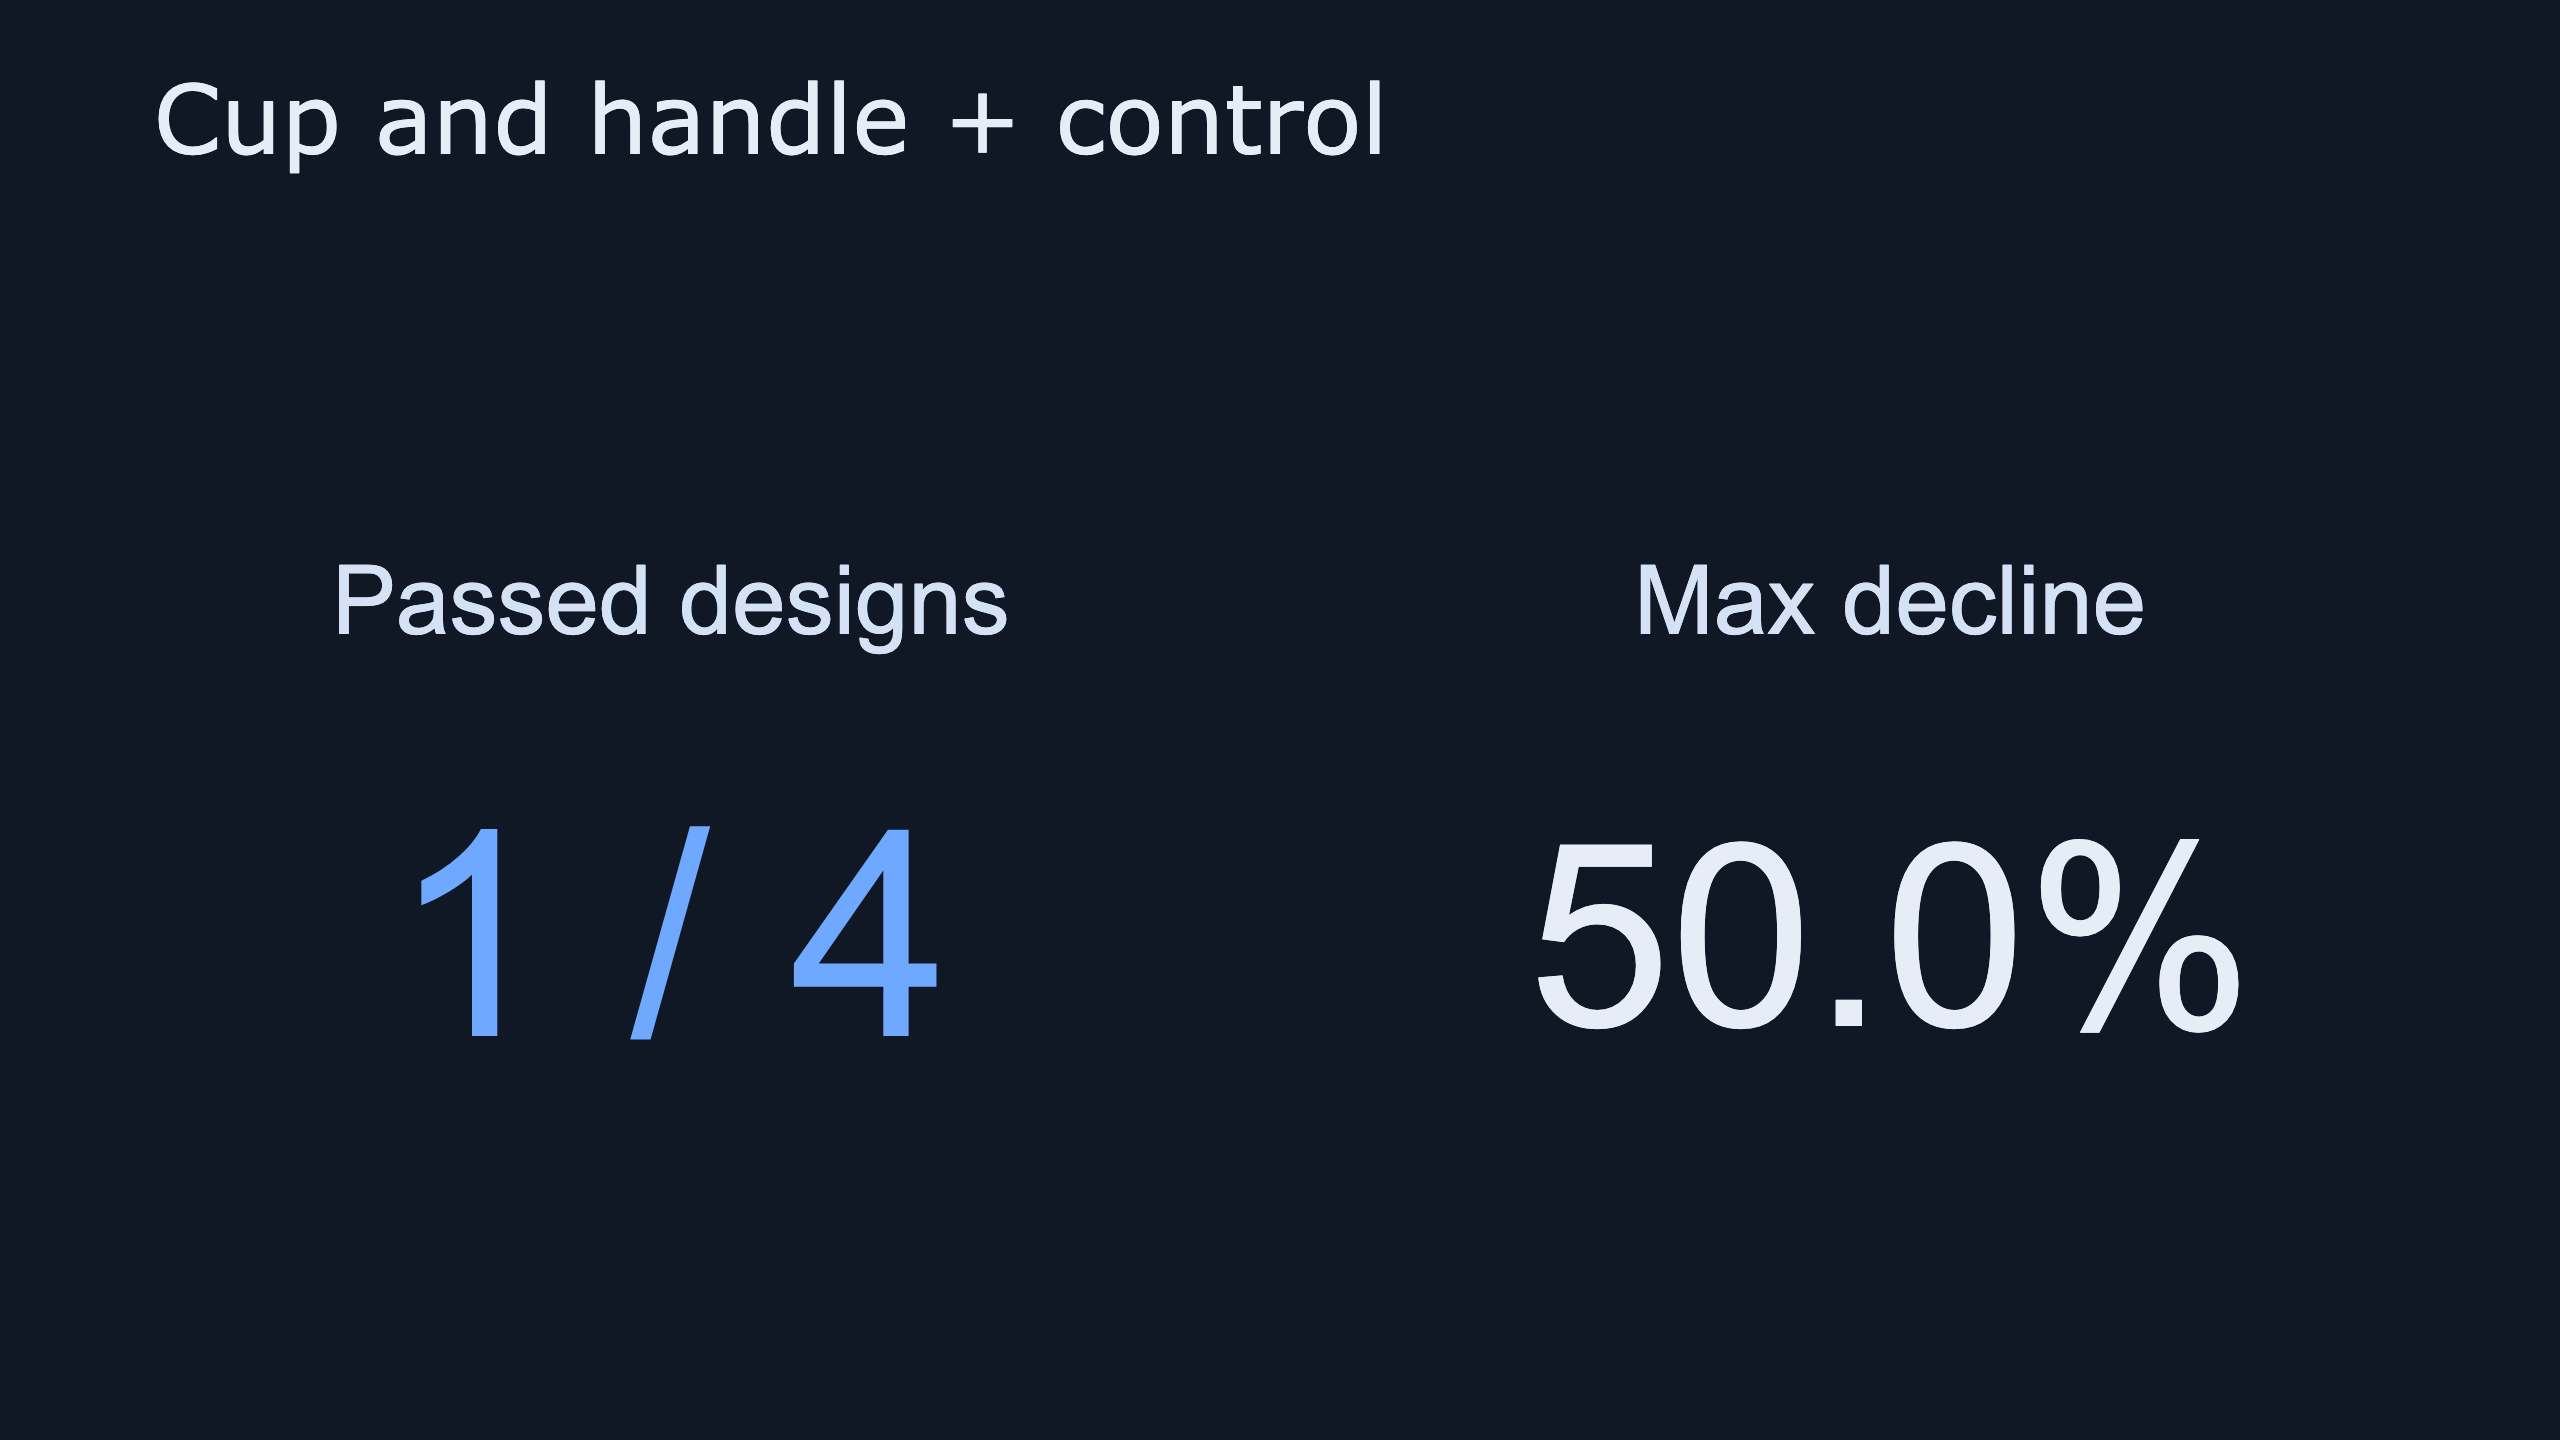
Cup rules failed; only the head-and-shoulders exclusion control passed. Its largest historical loss was about 50%.
The cup and handle pattern did not pass this study's validation checks. Its long version produced only six eligible buy signals and invested less than 1% of capital on average. One head-and-shoulders control did pass: exclude stocks while their inverse-head-and-shoulders long state is active, then hold the most liquid remaining names. That portfolio returned about 28.0% a year with a 0.95 daily Sharpe, but its maximum drawdown was approximately 50%, against 35.1% for QQQ. These are different trading rules, and the passing result belongs to the exclusion portfolio.
Run this strategy
Copy the prompt to reproduce the evidence above with the article’s data, assumptions, and risk checks.
Tell your AI:
Help me set up FinLab and rerun the validated U.S. head-and-shoulders exclusion portfolio. Please read: https://finlab.finance/en/setup?relatedUrl=/en/blog/cup-and-handle-backtest
What is a cup and handle pattern?
A cup and handle is a continuation shape after a prior advance: a correction and recovery form the cup, a smaller pullback forms the handle, and a breakout completes the signal. The reference is William O'Neil's How to Make Money in Stocks, fourth edition (2009). This experiment tests a mechanical price-shape proxy. It does not reproduce the earnings, sales, volume analysis or market judgement of the full CAN SLIM method.
| Component | Central rule | Purpose |
|---|---|---|
| Prior advance | Left rim at least 30% above the price 63 sessions earlier | Require an established advance |
| Cup length | 35–325 trading sessions | Exclude very short formations |
| Cup depth | 12–33% below the left rim | Bound the correction |
| Bottom location | Between 20% and 80% of cup duration | Avoid a bottom at either edge |
| Right rim | Within 5% of the left rim | Require a recovery near the old high |
| Handle | 5–25 sessions, at most 12% deep, in the cup's upper half | Require a smaller final pullback |
| Entry | New close above the right rim after handle-low confirmation | Avoid backdating the breakout |
Four turning points cannot capture every judgement a human chart reader makes. The bottom-location rule does not measure curvature, so a detected cup need not have a perfectly rounded bottom. Neither handle-volume contraction nor breakout-volume expansion is required. Those omissions describe the scope of the proxy; they should not be read as conclusions about every discretionary use of the pattern.
Results: two cup rules and two controls
Return and drawdown
H&S denotes the head-and-shoulders control. The two numbers are annualized return and the largest historical decline.
| Design | Annual return Max decline |
|---|---|
| Cup buy | 0.6% / -2.3% |
| Cup exclude | 27.4% / -50.0% |
| H&S buy | 7.1% / -29.6% |
| H&S exclude | 28.0% / -50.0% |
| QQQ | 20.1% / -35.1% |
The full table below scrolls horizontally to show Sharpe, parameter wins and exposure.
Full comparison
| Design | CAGR | Daily Sharpe | Max drawdown | First / second half Sharpe | Grid wins | Avg. exposure |
|---|---|---|---|---|---|---|
| US stocks / Cup / Long | 0.6% | 0.41 | -2.3% | 0.04 / 0.72 | 0/9 | 0.8% |
| US stocks / Cup / Avoid | 27.4% | 0.93 | -50.0% | 1.21 / 0.71 | 9/9 | 100.0% |
| US stocks / H&S / Long | 7.1% | 0.53 | -29.6% | 0.53 / 0.54 | 0/9 | 71.4% |
| US stocks / H&S / Avoid | 28.0% | 0.95 | -50.0% | 1.23 / 0.72 | 9/9 | 100.0% |
| QQQ total return | 20.1% | 0.92 | -35.1% | 1.22 / 0.63 | — | 100.0% |
The long cup version earned roughly 0.6% annually while mostly holding cash. Avoiding the cup long state beat QQQ in all nine neighbouring settings, but its first-half daily Sharpe was 1.212 versus QQQ's 1.223. It therefore failed the two-halves check. The long head-and-shoulders control failed too. Only the head-and-shoulders exclusion portfolio cleared the required checks.
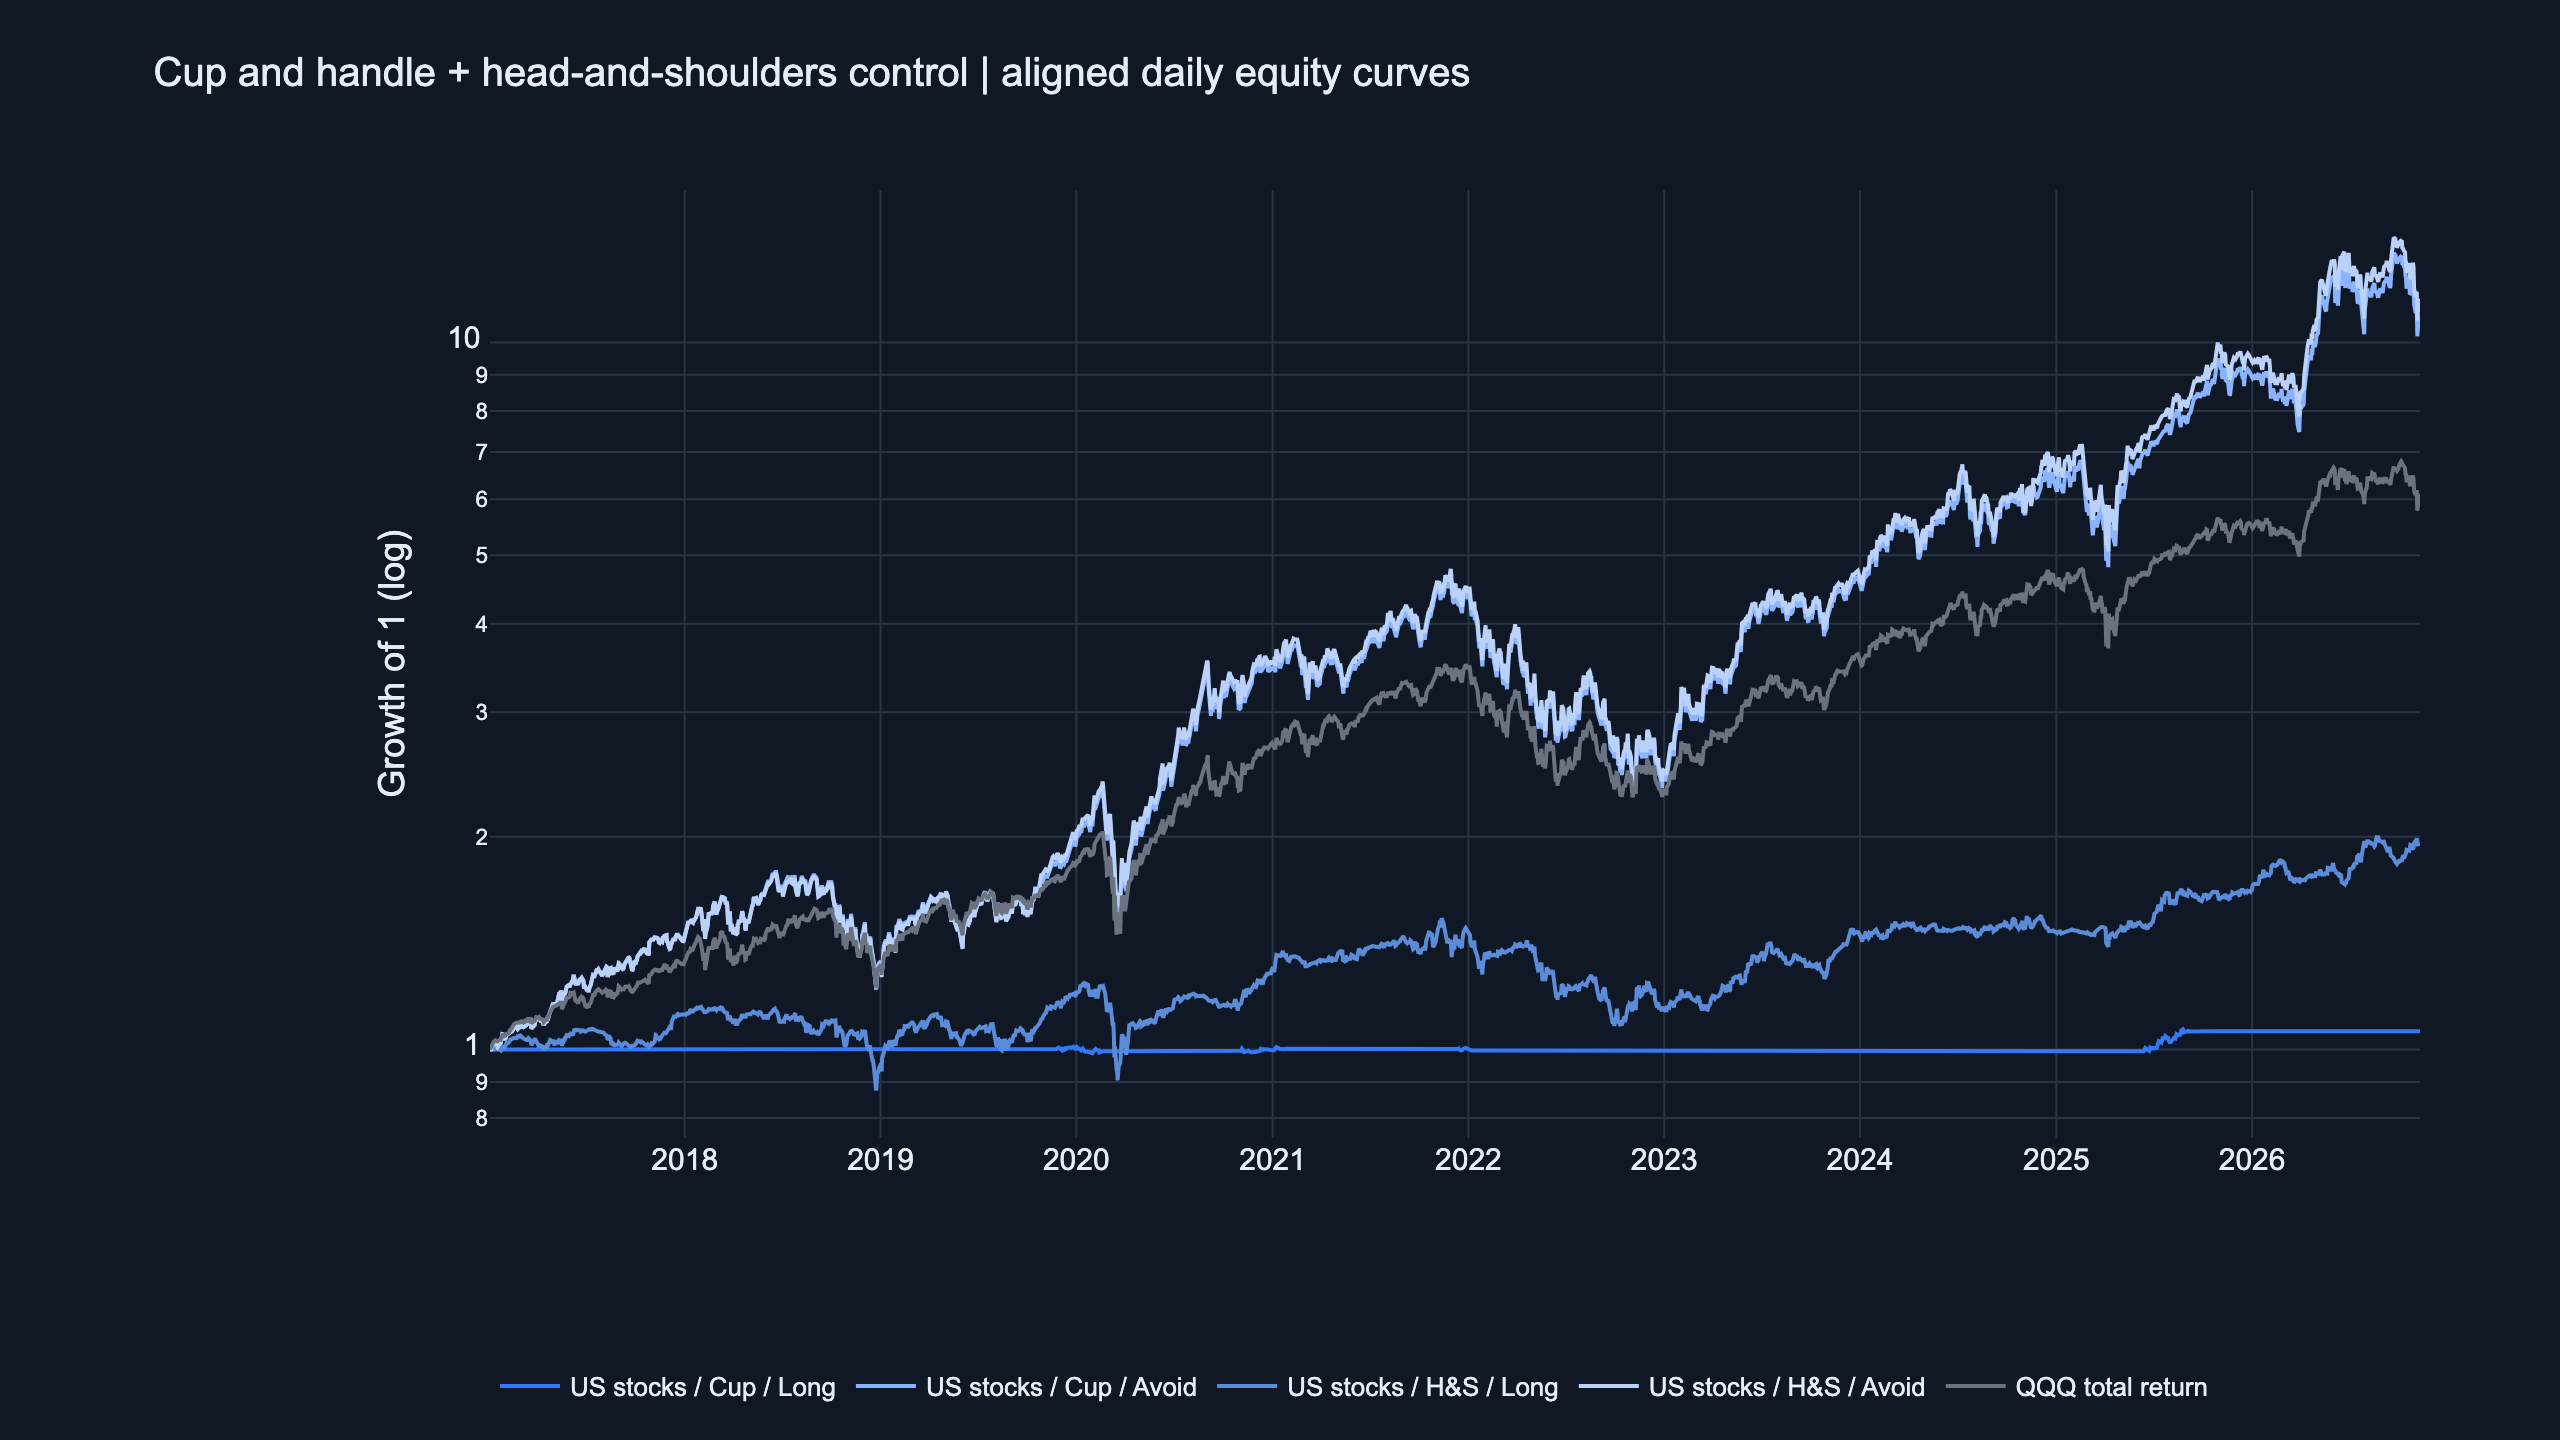
All five equity curves start at 1 on January 3, 2017. The exclusion portfolio's higher return comes with greater volatility and a much deeper drawdown. It holds individual stocks without leverage. Concentration in ten liquid names is sufficient to create substantial risk even without leveraged ETFs. A reader seeking a smaller drawdown would not obtain that benefit from this portfolio.
When can a turning point be known?
Prices are smoothed using a 24-session, one-sided Gaussian kernel. A candidate extremum must be above or below the three smoothed observations on each side. The three later observations become available only three sessions after the candidate date. The signal is timestamped at that confirmation date and requires a subsequent fresh crossing of resistance. A breakout that happened before the handle low was confirmed is not backdated into an earlier purchase.
This distinction matters when comparing historical chart annotations with a tradeable rule. The right edge of a chart often looks cleaner after several more bars arrive. A chart can label the low retrospectively, but a live decision could not have used that label at the low. The code passed a prefix-invariance check: adding later prices left every earlier signal unchanged. It also passed a synthetic double-bottom example that forbids buying before the final trough is confirmed.
Lo, Mamaysky and Wang (2000) formalize technical patterns through smoothed prices and extrema. This study adapts that recognition idea, adding causal confirmation and executable portfolio rules. It does not equate their conditional-return analysis with the performance of this particular stock portfolio. More background is available in the look-ahead bias guide.
Parameters fixed before the runs
For cups, maximum depth is 25%, 33% or 40%; maximum handle depth is 8%, 12% or 16%. All nine combinations are tested. Bandwidth is fixed at three sessions. The central setting is a 33% maximum cup depth and a 12% maximum handle depth. A cup position exits after a close below the handle low, below 92% of the signal-day price, or after 60 sessions. Decisions use the close and execute at the following session's close, so a gap can move the fill beyond the intended stop.
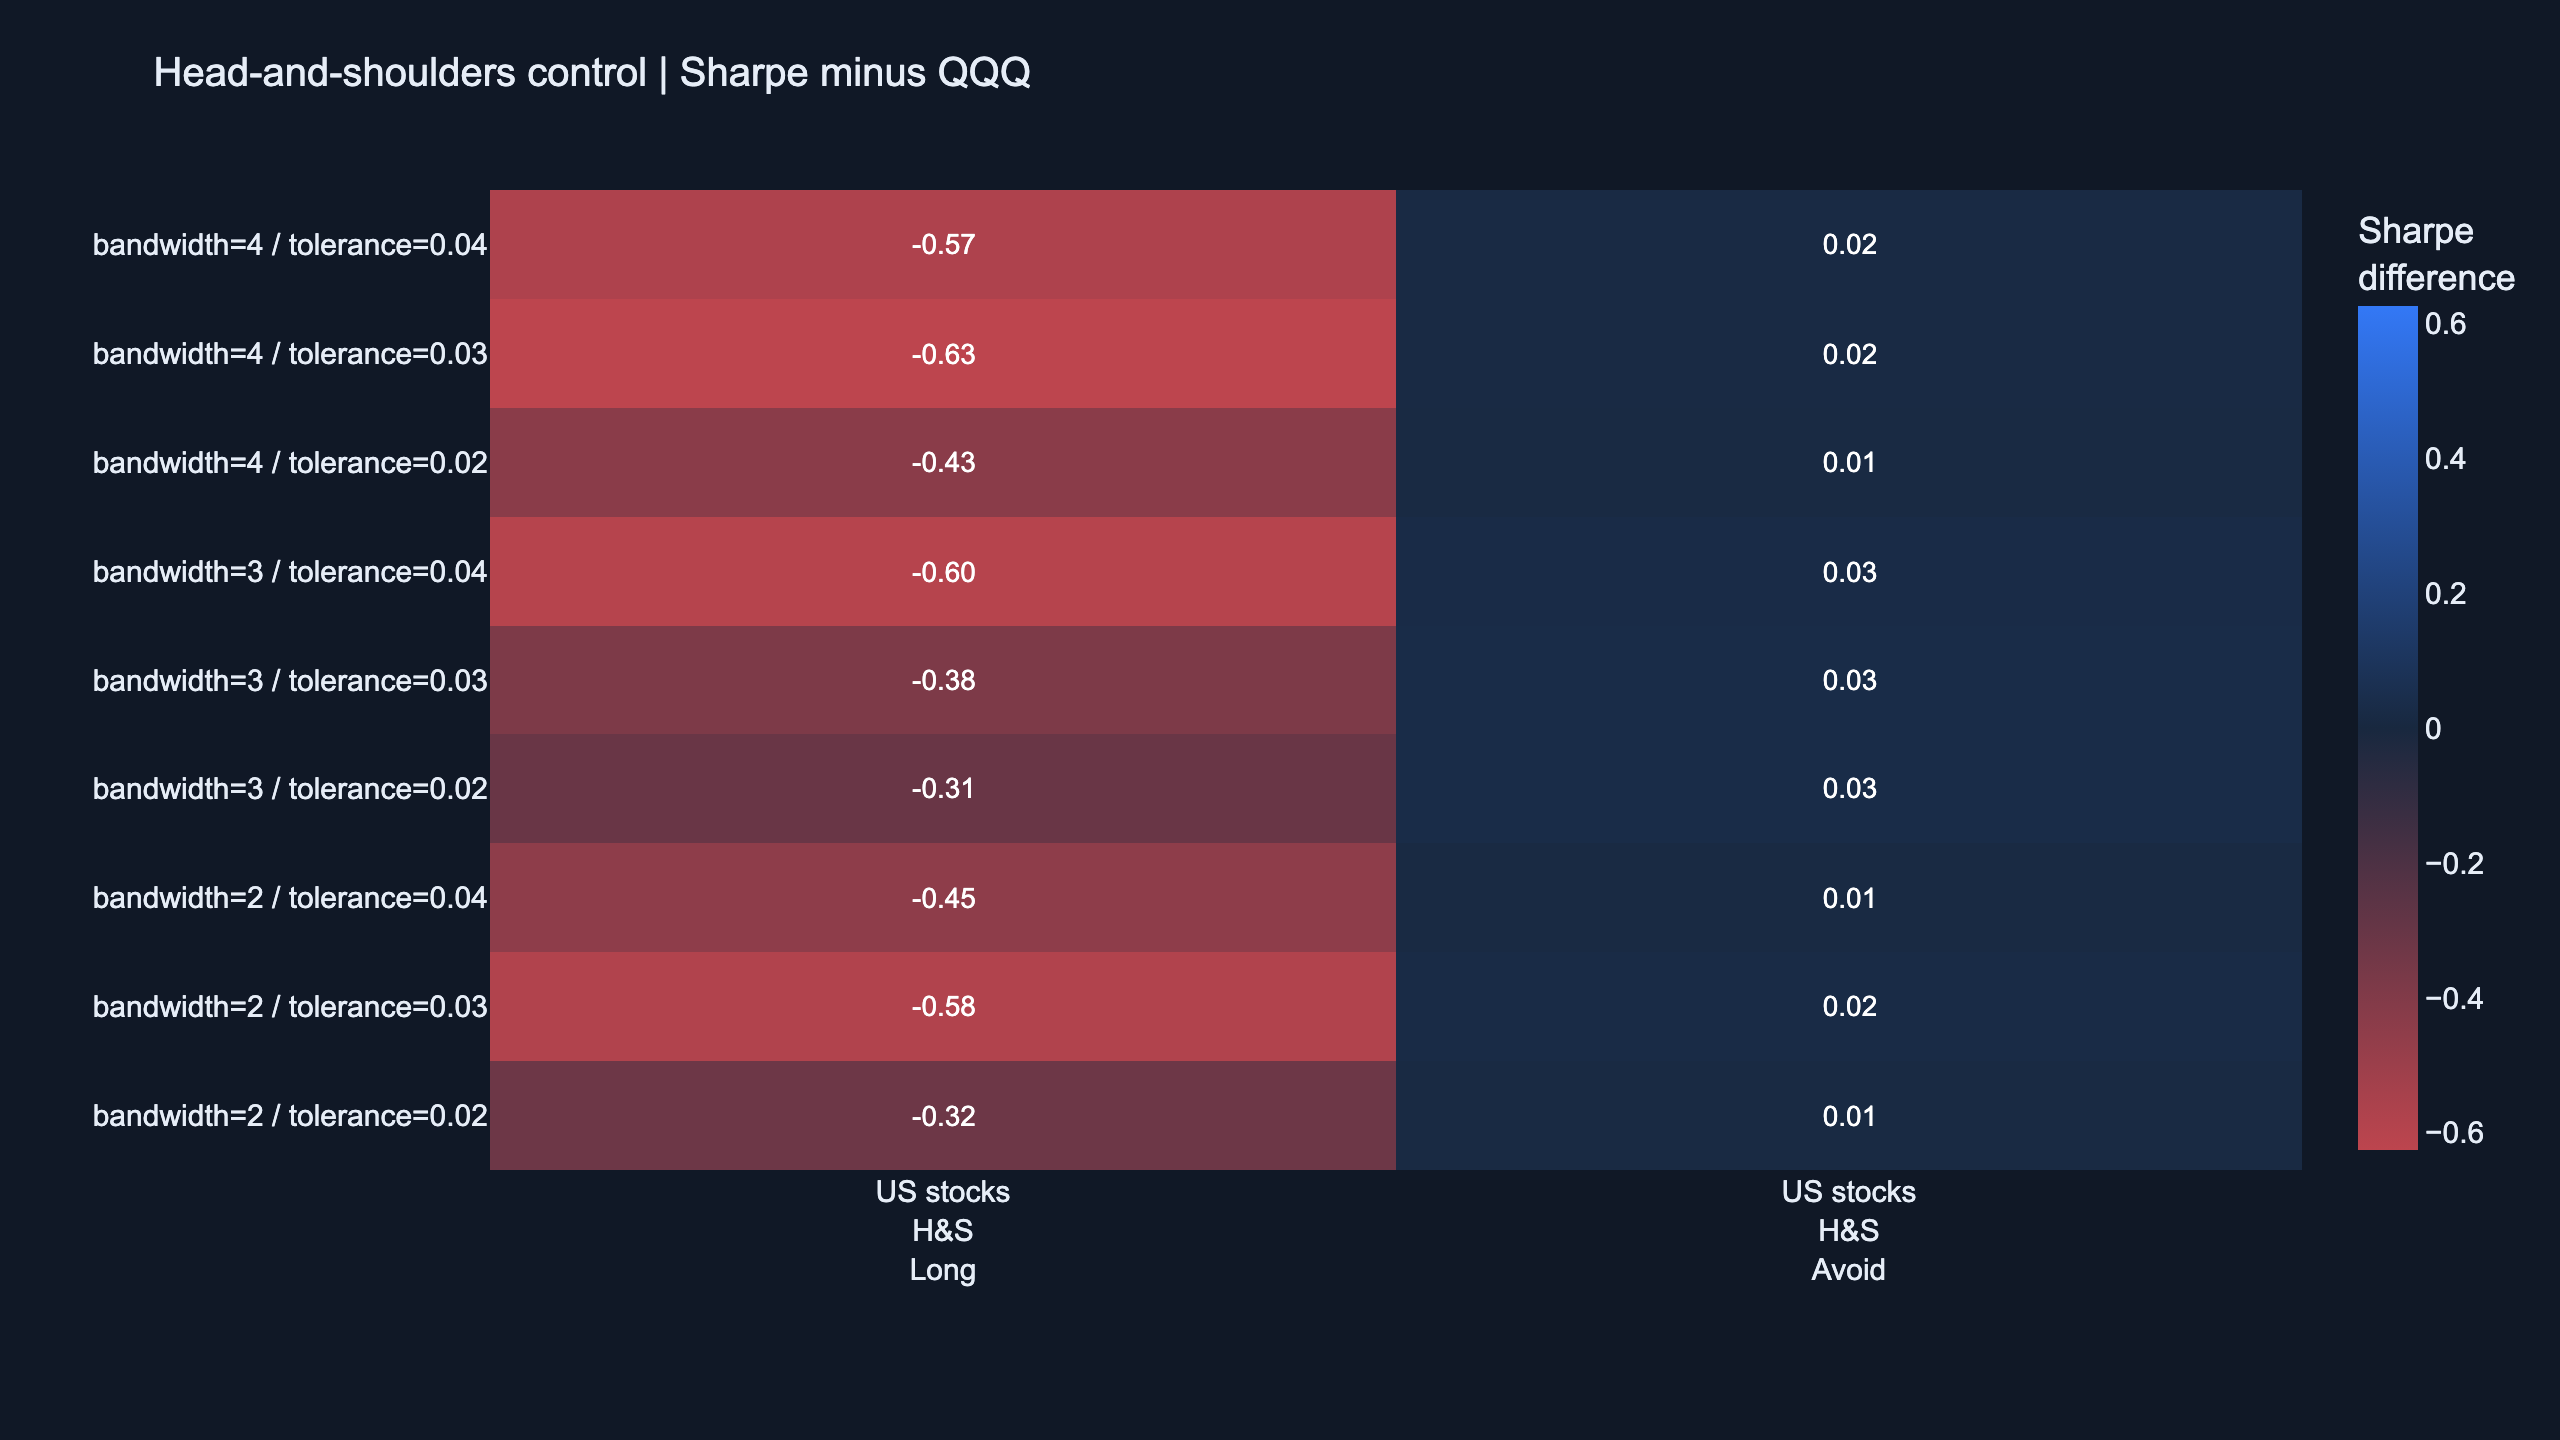
The head-and-shoulders control uses five confirmed extrema. The head must extend at least 3% beyond both shoulders; shoulder and neckline similarity tolerances are 2%, 3% or 4%, combined with bandwidths of two, three or four sessions. Patterns span 22–120 sessions, with at most 20 sessions to cross the neckline after the final extremum. An inverse pattern starts the long state. An ordinary head-and-shoulders breakdown or a 60-session holding limit ends it. The exclusion portfolio removes names in that long state and ranks the rest by liquidity.
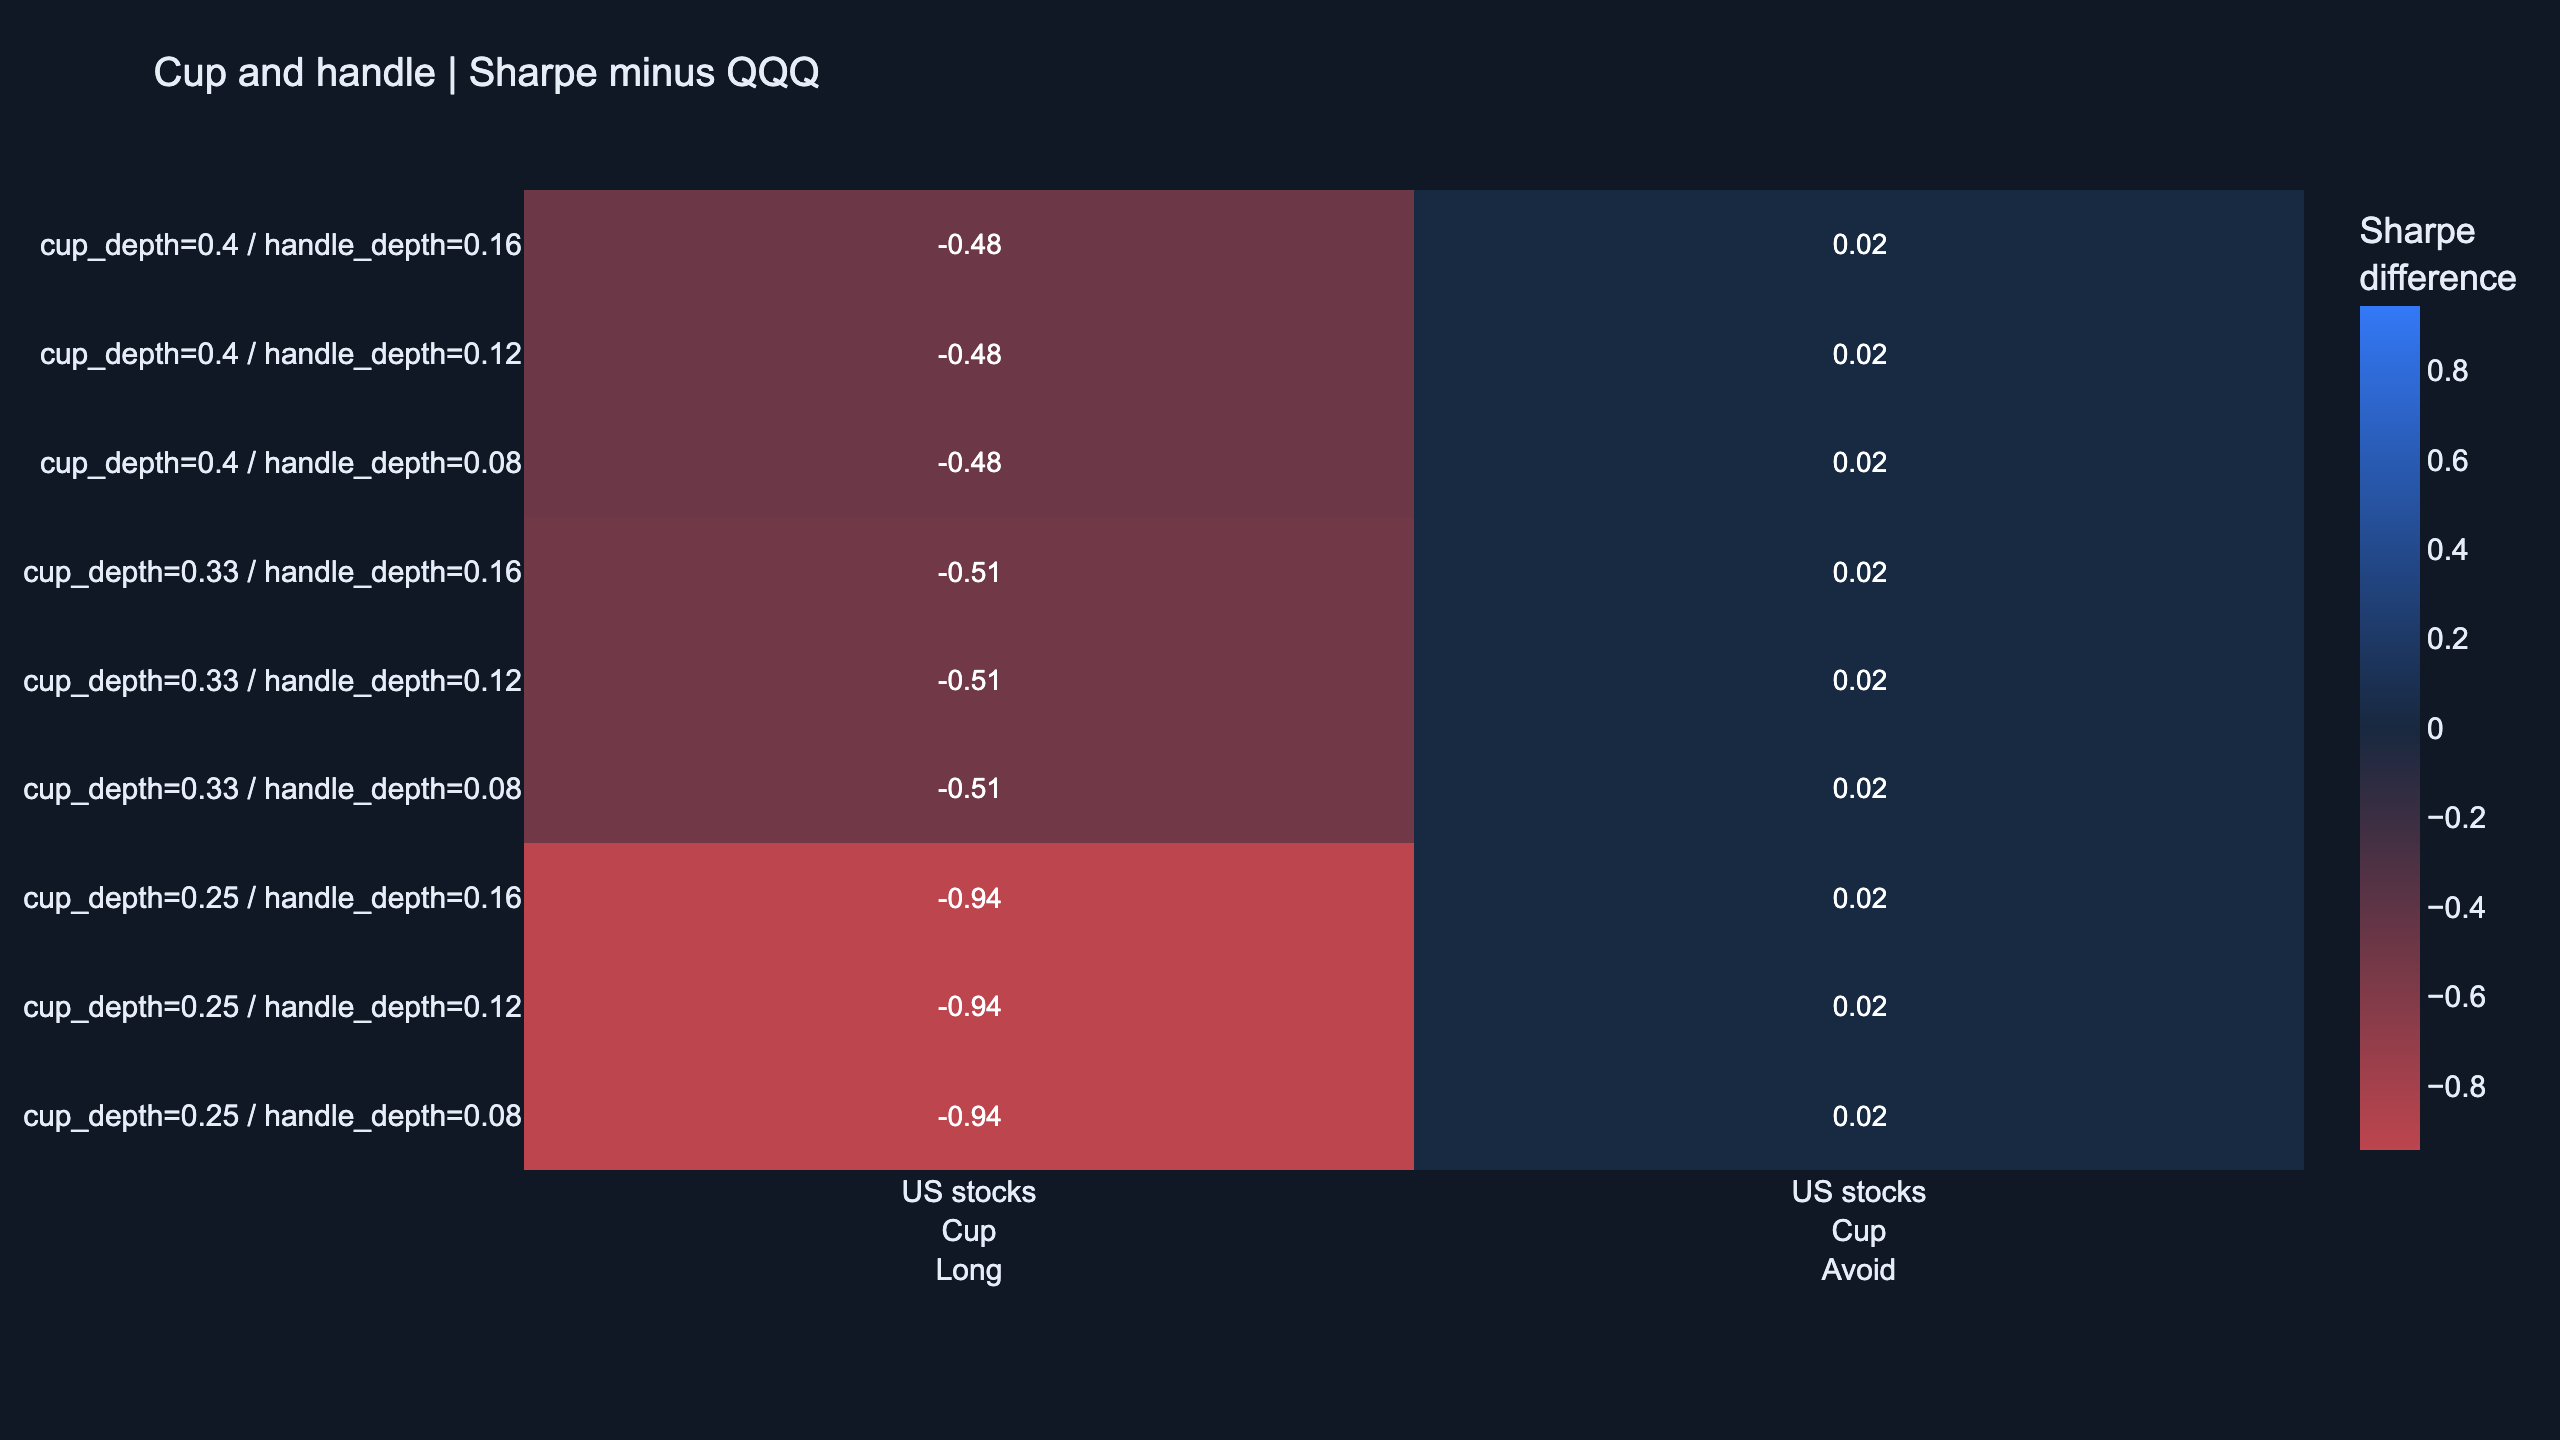
Each heatmap cell is the strategy's daily Sharpe minus QQQ's daily Sharpe. A positive cell is a win; at least seven of nine must win. The head-and-shoulders grid has different axes and is shown separately, rather than labelling a shoulder tolerance as a cup-depth parameter.
Both halves, costs and the strongest year
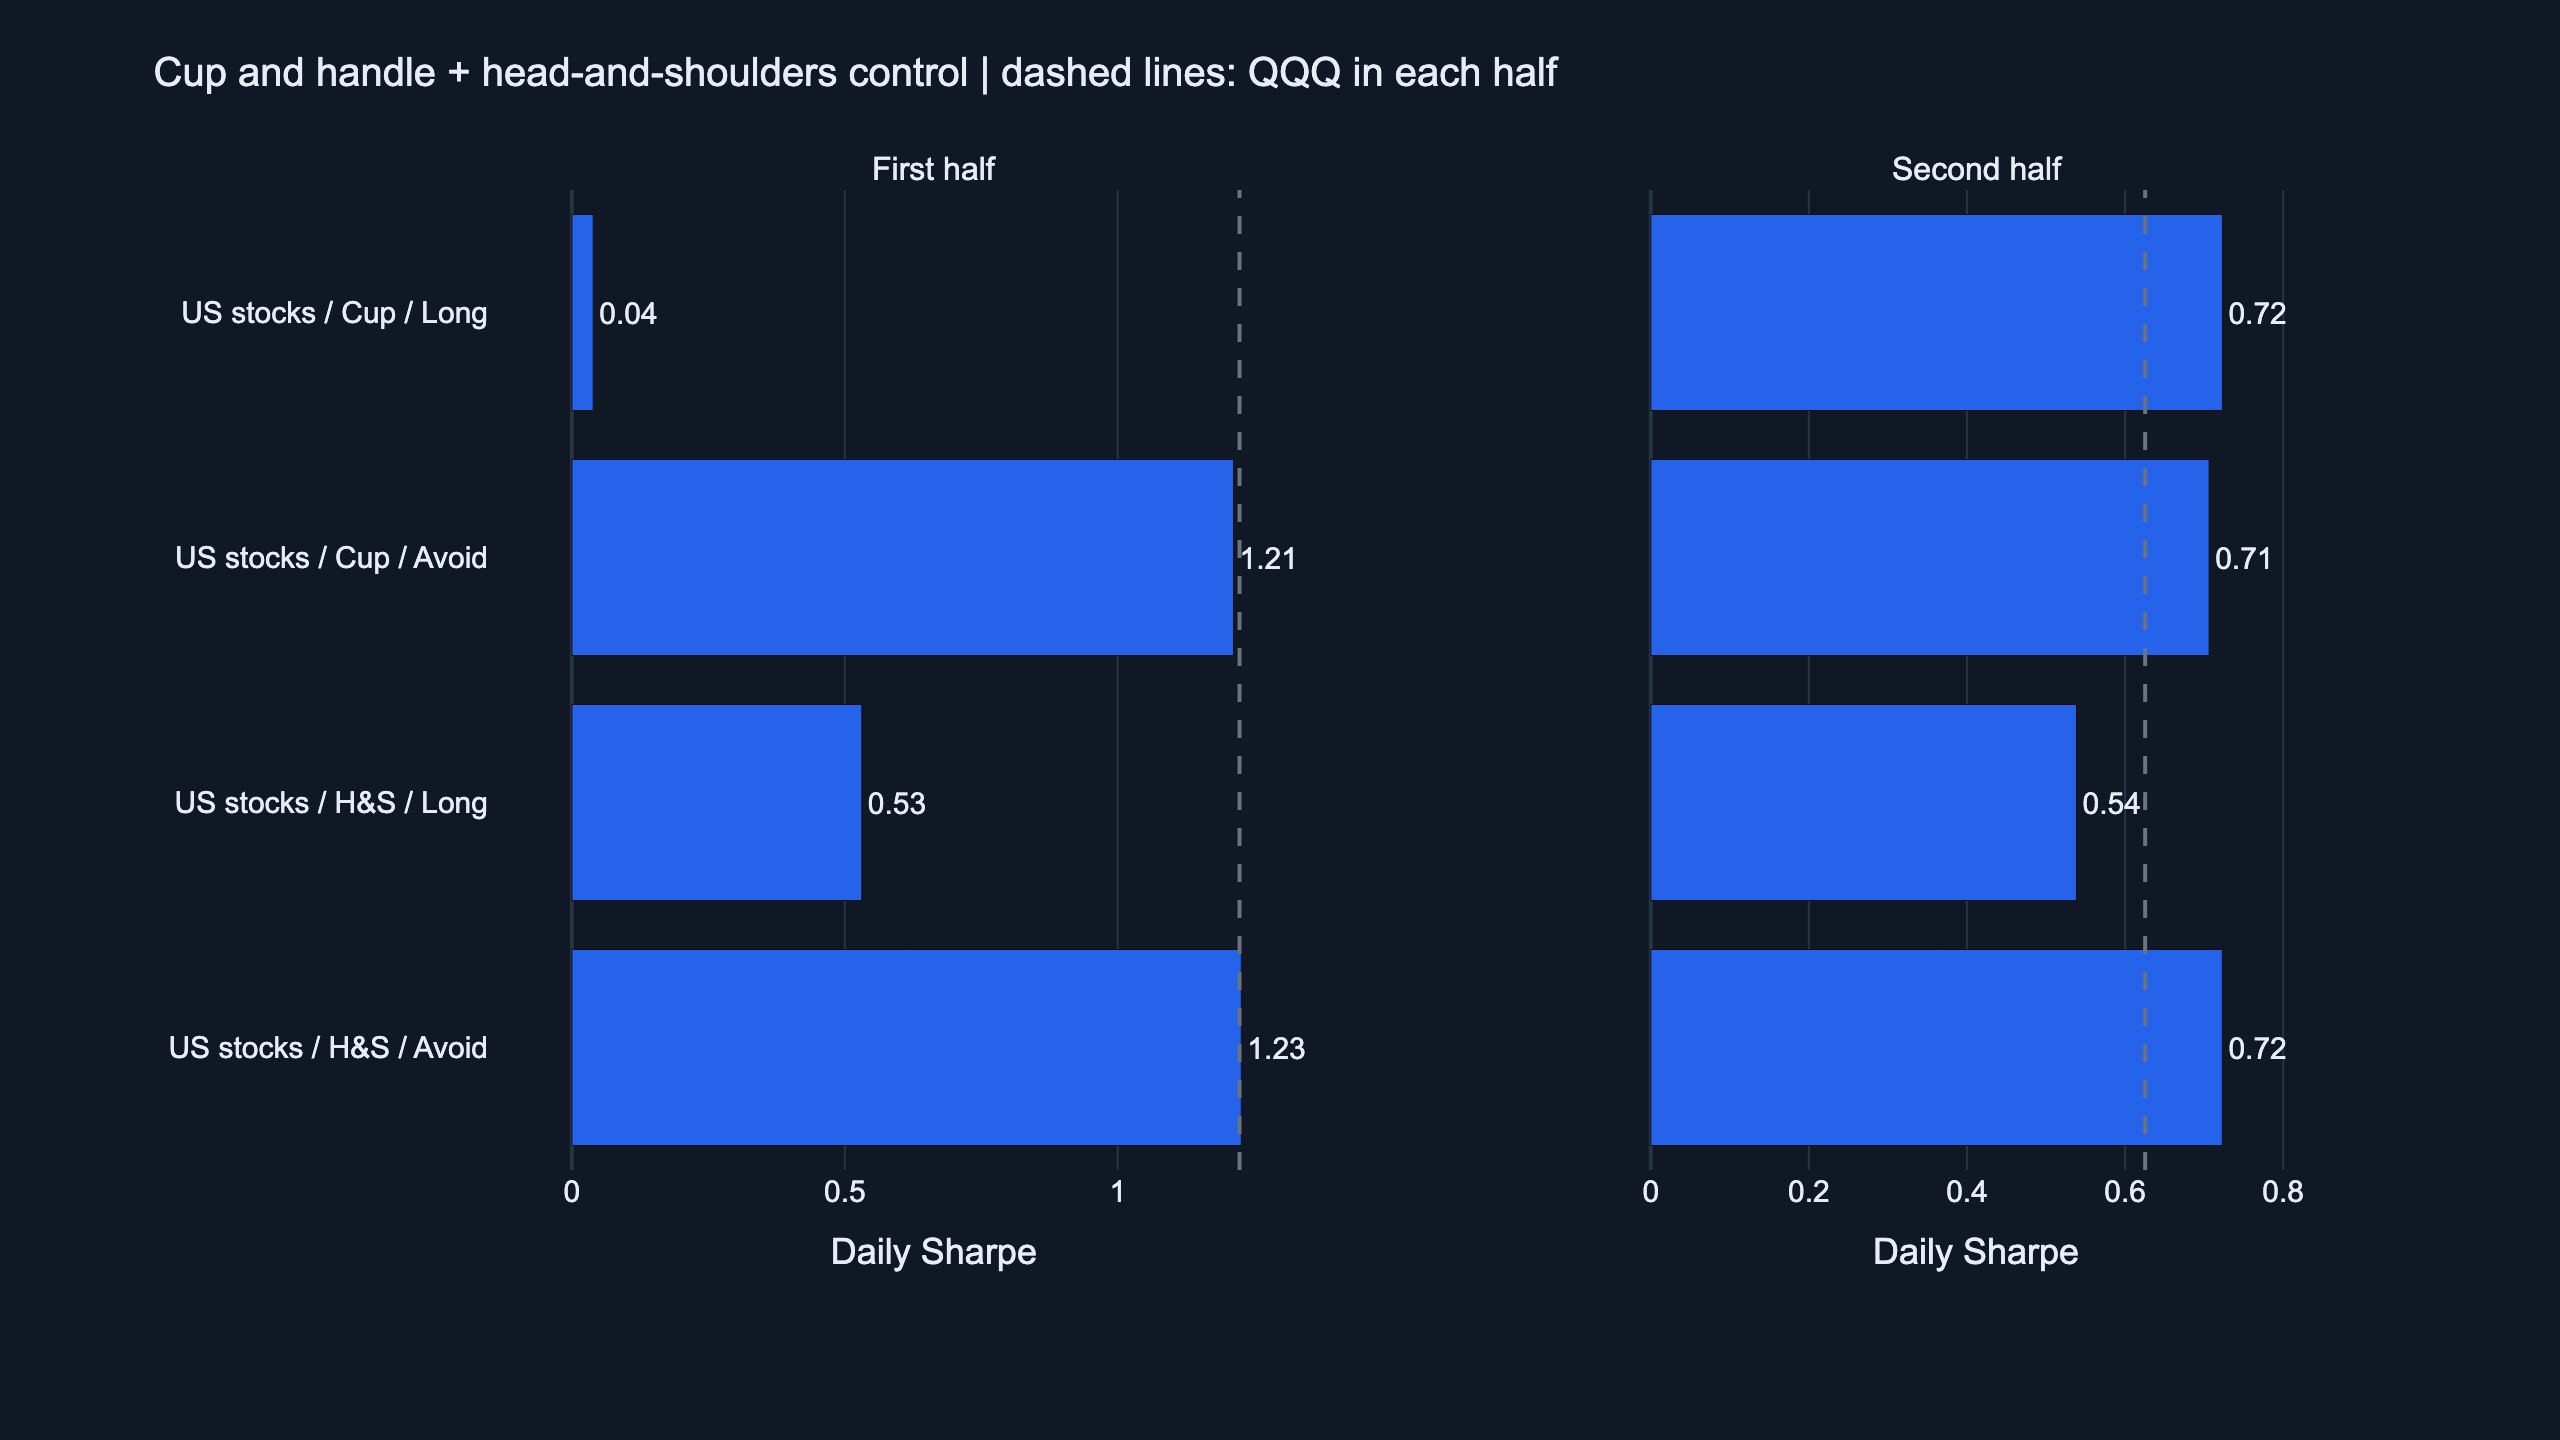
The U.S. sample is split by trading observations: the first half ends December 2, 2021, and the second begins December 3. Existing portfolio state continues across the split. These are historical robustness checks, with no independent out-of-sample or post-publication test. Bailey et al. (2015) discuss how repeated strategy selection can overfit historical data. Publishing the failed designs reduces selective reporting, but does not provide a multiple-testing correction. Sullivan, Timmermann and White (1999) evaluate technical-rule performance while accounting for the broader set of rules searched, directly addressing this selection problem.
The head-and-shoulders exclusion portfolio wins all nine settings. Its two half-sample Sharpes are 1.226 and 0.723, against QQQ's 1.223 and 0.625. The first-half advantage is small. U.S. default simulations use zero commissions and zero transaction tax. Charging 0.1% on each purchase and sale reduces its CAGR to approximately 27.7% and daily Sharpe to 0.939, still above QQQ's 0.917. This is a friction stress test, not a capacity estimate or an estimate of every investor's tax bill.
The monthly Sortino ratio is 1.72. Subtracting BIL's daily total return gives a Sharpe of 0.874 versus QQQ's 0.814. Removing the best calendar year, 2023, leaves daily Sharpes of 0.796 and 0.779. Weekly returns measured on the same snapshot dates have a maximum correlation of 0.896 with the existing QQQ volatility-targeting strategy, below the 0.95 duplication threshold. This is a comparison with existing listed strategies, not a guarantee of future diversification.
Daily Sharpe in the article uses zero risk-free return throughout. FinLab's interactive report deducts its default 2% annual risk-free rate, so the report's displayed Sharpe is different. The benchmark uses adjusted QQQ prices compounded directly, without simulated trading costs. Keeping those conventions visible prevents a low-cost benchmark from being compared with a different risk-free assumption.
Universe, weights and what the signal count means
The universe is the daily top 500 U.S. stocks by 60-session average unadjusted dollar volume. Names need a price of at least USD 10, average dollar volume of at least USD 10 million and 252 price observations. A daily absolute move of at least 50% excludes the name from the following session for 252 sessions. This trailing filter reduces exposure to extreme data artefacts without using future events to remove earlier trades.
No current index membership or current market-cap snapshot is backfilled into the past. Financials, REITs and other sectors are not separately excluded. The historical universe can retain delisted names present in the vendor data, but missing delisted histories can still cause survivorship bias. Adjusted prices determine the shape; raw prices times volume determine liquidity. This separates dividend and split adjustments from the amount that traded at the time.
At each close, candidates are ranked by liquidity and at most ten are selected. Each has a 10% weight cap; unused slots remain cash. Rankings can change daily and create turnover. There is no leverage and no capital-capacity estimate. The turnover definition and slippage guide explain why a commission-free backtest still needs a friction check.
| Design | Eligible buy signals | Portfolio entries | Fixed-weight Sharpe | Annual turnover | Max monthly turnover |
|---|---|---|---|---|---|
| US stocks / Cup / Long | 6 | 6 | 0.99 | 0.06 | 0.15 |
| US stocks / Cup / Avoid | 6 | 123 | 1.20 | 1.15 | 0.90 |
| US stocks / H&S / Long | 353 | 478 | 0.89 | 4.80 | 1.40 |
| US stocks / H&S / Avoid | 353 | 130 | 1.20 | 1.22 | 0.90 |
Eligible buy signals count original long-entry events that satisfy the universe screen that day. The exclusion designs share those event counts, because they avoid the same long state. Portfolio entries also include changes in ranking and later re-entry, so the two counts are not interchangeable. Turnover is half the sum of absolute target-weight changes; annual turnover is the daily mean times 252, and peak monthly turnover is the largest calendar-month sum.
For cash-heavy designs, the study additionally compares constant QQQ exposure at the same average capital weight. It also reports a fixed basket using each stock's full-period average weight. That latter basket uses hindsight and is a diagnostic, not an implementable selection rule. It has a higher Sharpe than the fully invested exclusion portfolio, so the result does not demonstrate that shape exclusion beats those retrospectively selected weights. The evidence supports the defined portfolio against QQQ under the stated checks; it does not isolate a pure chart-pattern premium.
Run the validated portfolio
The U.S. head-and-shoulders exclusion strategy uses individual stocks. Its strategy page and Studio entry use the same strategy.py download. The cup experiment's cup-research.py reproduces the failed cup rule instead. The distinction also separates this stock portfolio from the leveraged-ETF timing systems in the U.S. quantitative strategy overview.
The validated rule avoids stocks while an inverse-head-and-shoulders position would be active, then chooses up to ten liquid alternatives. Rerun the exclusion portfolio in Studio. Sign in with available AI research allowance to run it. The result is a historical performance report and position analysis; it does not place an order.
The AI-agent setup page covers Claude Code, Codex and Gemini CLI. The standard install command is npx skills add koreal6803/finlab-ai --skill finlab -g -y; FinLab Studio provides browser execution. FinLab's workflow lets an AI agent run the downloaded rules and explain the results. Prospective performance, personal taxes and the effect of larger capital remain untested. The research use cases and team background provide context for the research process.
Questions about cup and handle trading
Does a cup breakout require higher volume?
Human implementations commonly consider volume, but this particular mechanical proxy does not require breakout-volume expansion or handle-volume contraction. Its results cannot stand in for the full CAN SLIM process.
Is excluding head-and-shoulders states a cup strategy?
No. The cup rule buys a completed cup breakout. The passing control excludes names during a different pattern's long state. Its name, downloadable code and strategy page identify the exclusion rule.
Do six signals prove cup patterns never work?
Six eligible signals establish that this fixed definition is sparse in this universe. They do not settle every discretionary interpretation. Removing cash days or choosing only successful examples would change the experiment.
Why not use today's S&P 500 constituents?
That would import membership information unavailable at earlier dates. The study uses a rolling liquidity universe to cover the complete 2017–2026 window without relying on current constituents.
Is the passing portfolio lower risk than QQQ?
Its historical maximum drawdown is about 50%, versus 35.1% for QQQ, and its volatility is higher. The passing tests concern risk-adjusted return under the stated convention, not a promise of smaller losses.
How do the research and daily versions differ?
Set DATA_END in strategy.py to 2026-11-10 for the article's historical window. Leave it as None for daily updates. The shape rules, liquidity ranking and 10% position cap stay the same. A new date can change results without changing those rules.
Downloads and the validated program
strategy.py is the passing head-and-shoulders exclusion portfolio. The strategy page and Studio receive this file. Set DATA_END to "2026-11-10" for historical reproduction; leave it as None for daily updates.
Daily equity data, all parameter results and metadata, failed cup-research.py, and the complete batch research.py are available. Use a separate folder for batch research, with its shared engine rather than the passing portfolio file. The batch script needs the shared strategy.py saved beside it. Run with FinLab 2.3.8, pandas 3.1.1, NumPy, SciPy, Numba, Plotly, Kaleido and python-dotenv. The data cutoff is November 10, 2026; the run date is November 11, 2026. Upstream data revisions can change a later rerun.
Show Code
from strategy import build_position
from finlab.backtest import sim

position = build_position(end="2026-11-10")
report = sim(position, position_limit=0.1, upload=False,
             end_date="2026-11-10")
report.to_html("exclusion_report.html")
This snippet requires strategy.py in the same folder. The separate cup-research.py download reproduces the failed cup experiment. For the full batch, run python research.py; it writes every grid result and each central-setting report into a results folder. The FinLab setup guide covers environment setup. FinLab Quant Research develops and tests systematic investment rules; this historical study has not received prospective validation.
Past performance does not predict future results. This material is for research and education and is not investment advice. Trading costs, liquidity constraints and data revisions may make actual outcomes worse.
Last updated: 2026-11 | Backtest window: 2017-01-03 to 2026-11-10 | Author: FinLab Quant Research
FinLab AI
Want to build your own strategy?
Describe your stock-picking ideas in natural language. AI automatically validates, backtests, and gives you answers
Start Free