A short-term mean reversion trading strategy bets that whatever just lagged over a few days snaps back. This article tests the idea in its most concentrated US form: inside a positive QQQ trend regime, hold exactly one of two 3x leveraged growth ETFs — whichever of TQQQ or TECL lagged over the last 3 trading days — and rotate to treasuries, gold, or a cash-like fund when the trend breaks.
Over June 2016 to June 2026 the result is the highest return in the ten-strategy family this system belongs to: a 67.4% CAGR that turned 175, versus roughly 6.6x for QQQ. The price is equally extreme: 33% annualized volatility, a -27.6% maximum drawdown, and a single holding at all times. And the numbers below carry one finding you should keep in mind throughout: the laggard-vs-leader reversal edge is real on average but statistically weak (t-stat 1.33), so most of the return engine is the leveraged-ETF regime timing, with the mean-reversion tilt adding a modest layer on top. This strategy shares that regime-timing engine with nine siblings; the US quant trading strategies overview explains the shared execution model in full and compares all ten on the same data.
The numbers at a glance
| Metric | This strategy | QQQ (buy & hold) | SPY (buy & hold) | TQQQ (naive hold) | TECL (naive hold) |
|---|---|---|---|---|---|
| CAGR | 67.4% | 19.8% | 13.3% | 40.4% | 48.4% |
| Monthly Sharpe | 1.43 | 1.09 | 0.92 | 0.91 | 0.94 |
| Monthly Sortino | 4.63 | 1.76 | 1.27 | 1.53 | 1.74 |
| Max drawdown | -27.6% | -35.6% | -34.1% | -81.8% | -78.0% |
| Annualized volatility | 33.1% | 22.2% | 17.9% | 65.9% | 72.0% |
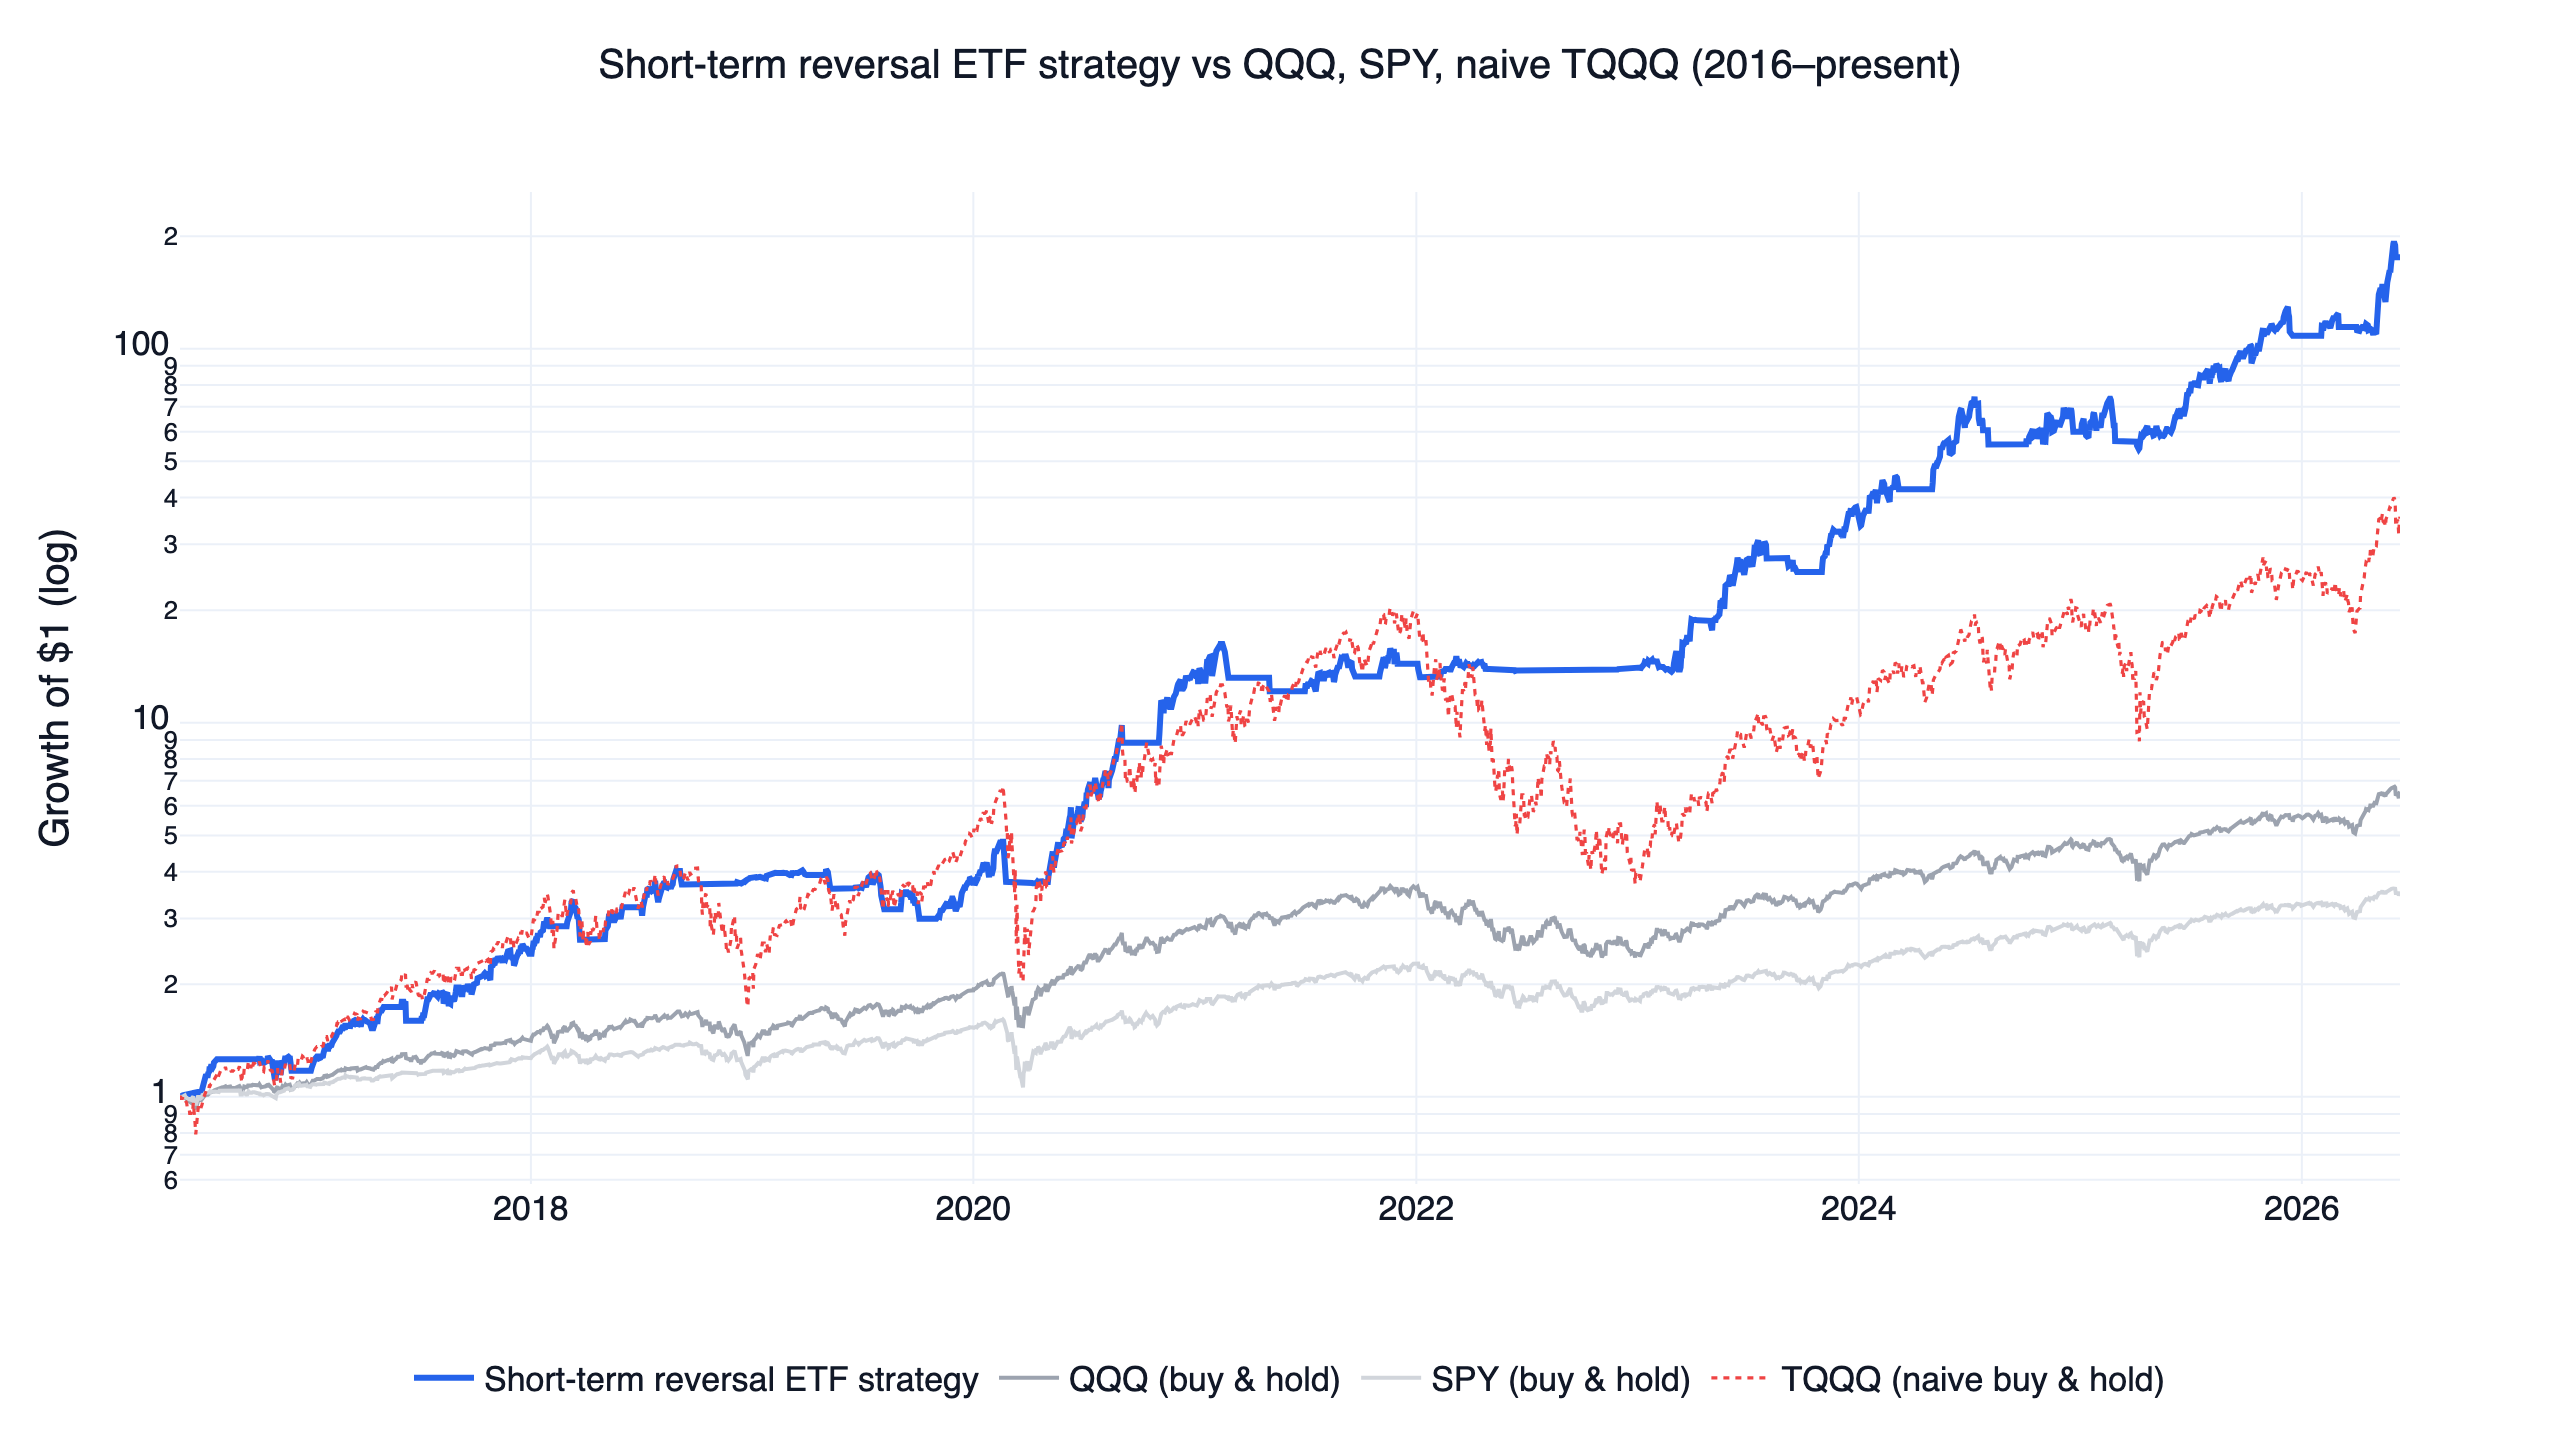
All series are total-return (dividend-adjusted) prices over the same 2016-06 to 2026-06 window. The two naive columns frame the whole exercise: holding TQQQ or TECL outright earned 40-48% a year but went through -78% to -82% drawdowns, which almost no investor survives in practice. The strategy's contribution is keeping most of that leveraged compounding while cutting the worst loss to -27.6%. Its 33% volatility is still half again higher than QQQ's, and the monthly Sharpe of 1.43 is mid-pack in its family. This is the family's return champion; its risk champion is elsewhere.
What short-term mean reversion means here
Short-term mean reversion is the tendency of recent few-day losers to outperform recent few-day winners over the following days to weeks, the mirror image of 12-month momentum. Jegadeesh (1990) documented strong reversals in monthly US stock returns, and Lehmann (1990) showed that portfolios buying one-week losers and selling one-week winners earned consistent contrarian profits. Later work by Da, Liu & Schaumburg (2014) decomposed the effect and found that much of it comes from liquidity provision: reversal profits are compensation for absorbing temporary order-flow imbalances rather than evidence of slow-moving information.
That liquidity interpretation is exactly the mechanism this strategy leans on. TQQQ (3x Nasdaq-100) and TECL (3x technology sector) track heavily overlapping portfolios, so when one lags the other over 3 days, the gap is more plausibly a temporary flow imbalance than a genuine change in leadership. The rule buys the laggard expecting the gap to close.
One framing matter is worth being precise about. This is an ETF-timing strategy with no stock-selection universe: there is no basket of individual stocks underneath, so the cross-sectional validation used for stock-factor systems (decile sorts, rank information coefficients) does not apply here. The momentum study shows what that stock-level validation looks like when it is available. For this strategy, the evidence has to come from a different kind of test, which is what the next section after the rules does.
The three rules
The full logic fits in three layers, applied monthly with a single holding at all times:
| Layer | Rule |
|---|---|
| 1. Regime filter | Risk-on when QQQ is above its 200-day moving average and its 6-month (126-day) return is positive. Risk-on covered 68.4% of trading days since 2016. |
| 2. Reversal rule | In risk-on, hold whichever of TQQQ or TECL lagged over the last 3 trading days. |
| 3. Defensive sleeve | In risk-off, hold the strongest of IEF, GLD, or SHY by 3-month-minus-1-month momentum. |
Execution is shared with the rest of the family: monthly rebalance, one position, and an 8% intramonth stop on the leveraged leg. The overview of all ten US systems covers that engine once in detail; the short version is that the regime gate decides whether to hold leverage at all, and each strategy supplies its own answer to which fund and when.
Copy this prompt to your AI agent
FinLab's setup path is now one prompt. Paste it into Codex app or Claude cowork, and the AI will read https://finlab.finance/en/setup, install the FinLab skill when needed, then run or modify the strategy in this article.
Show Code
Help me set up FinLab and build a mean-reversion strategy: https://finlab.finance/en/setupThe setup page is https://finlab.finance/en/setup.
Does the reversal signal actually add anything?
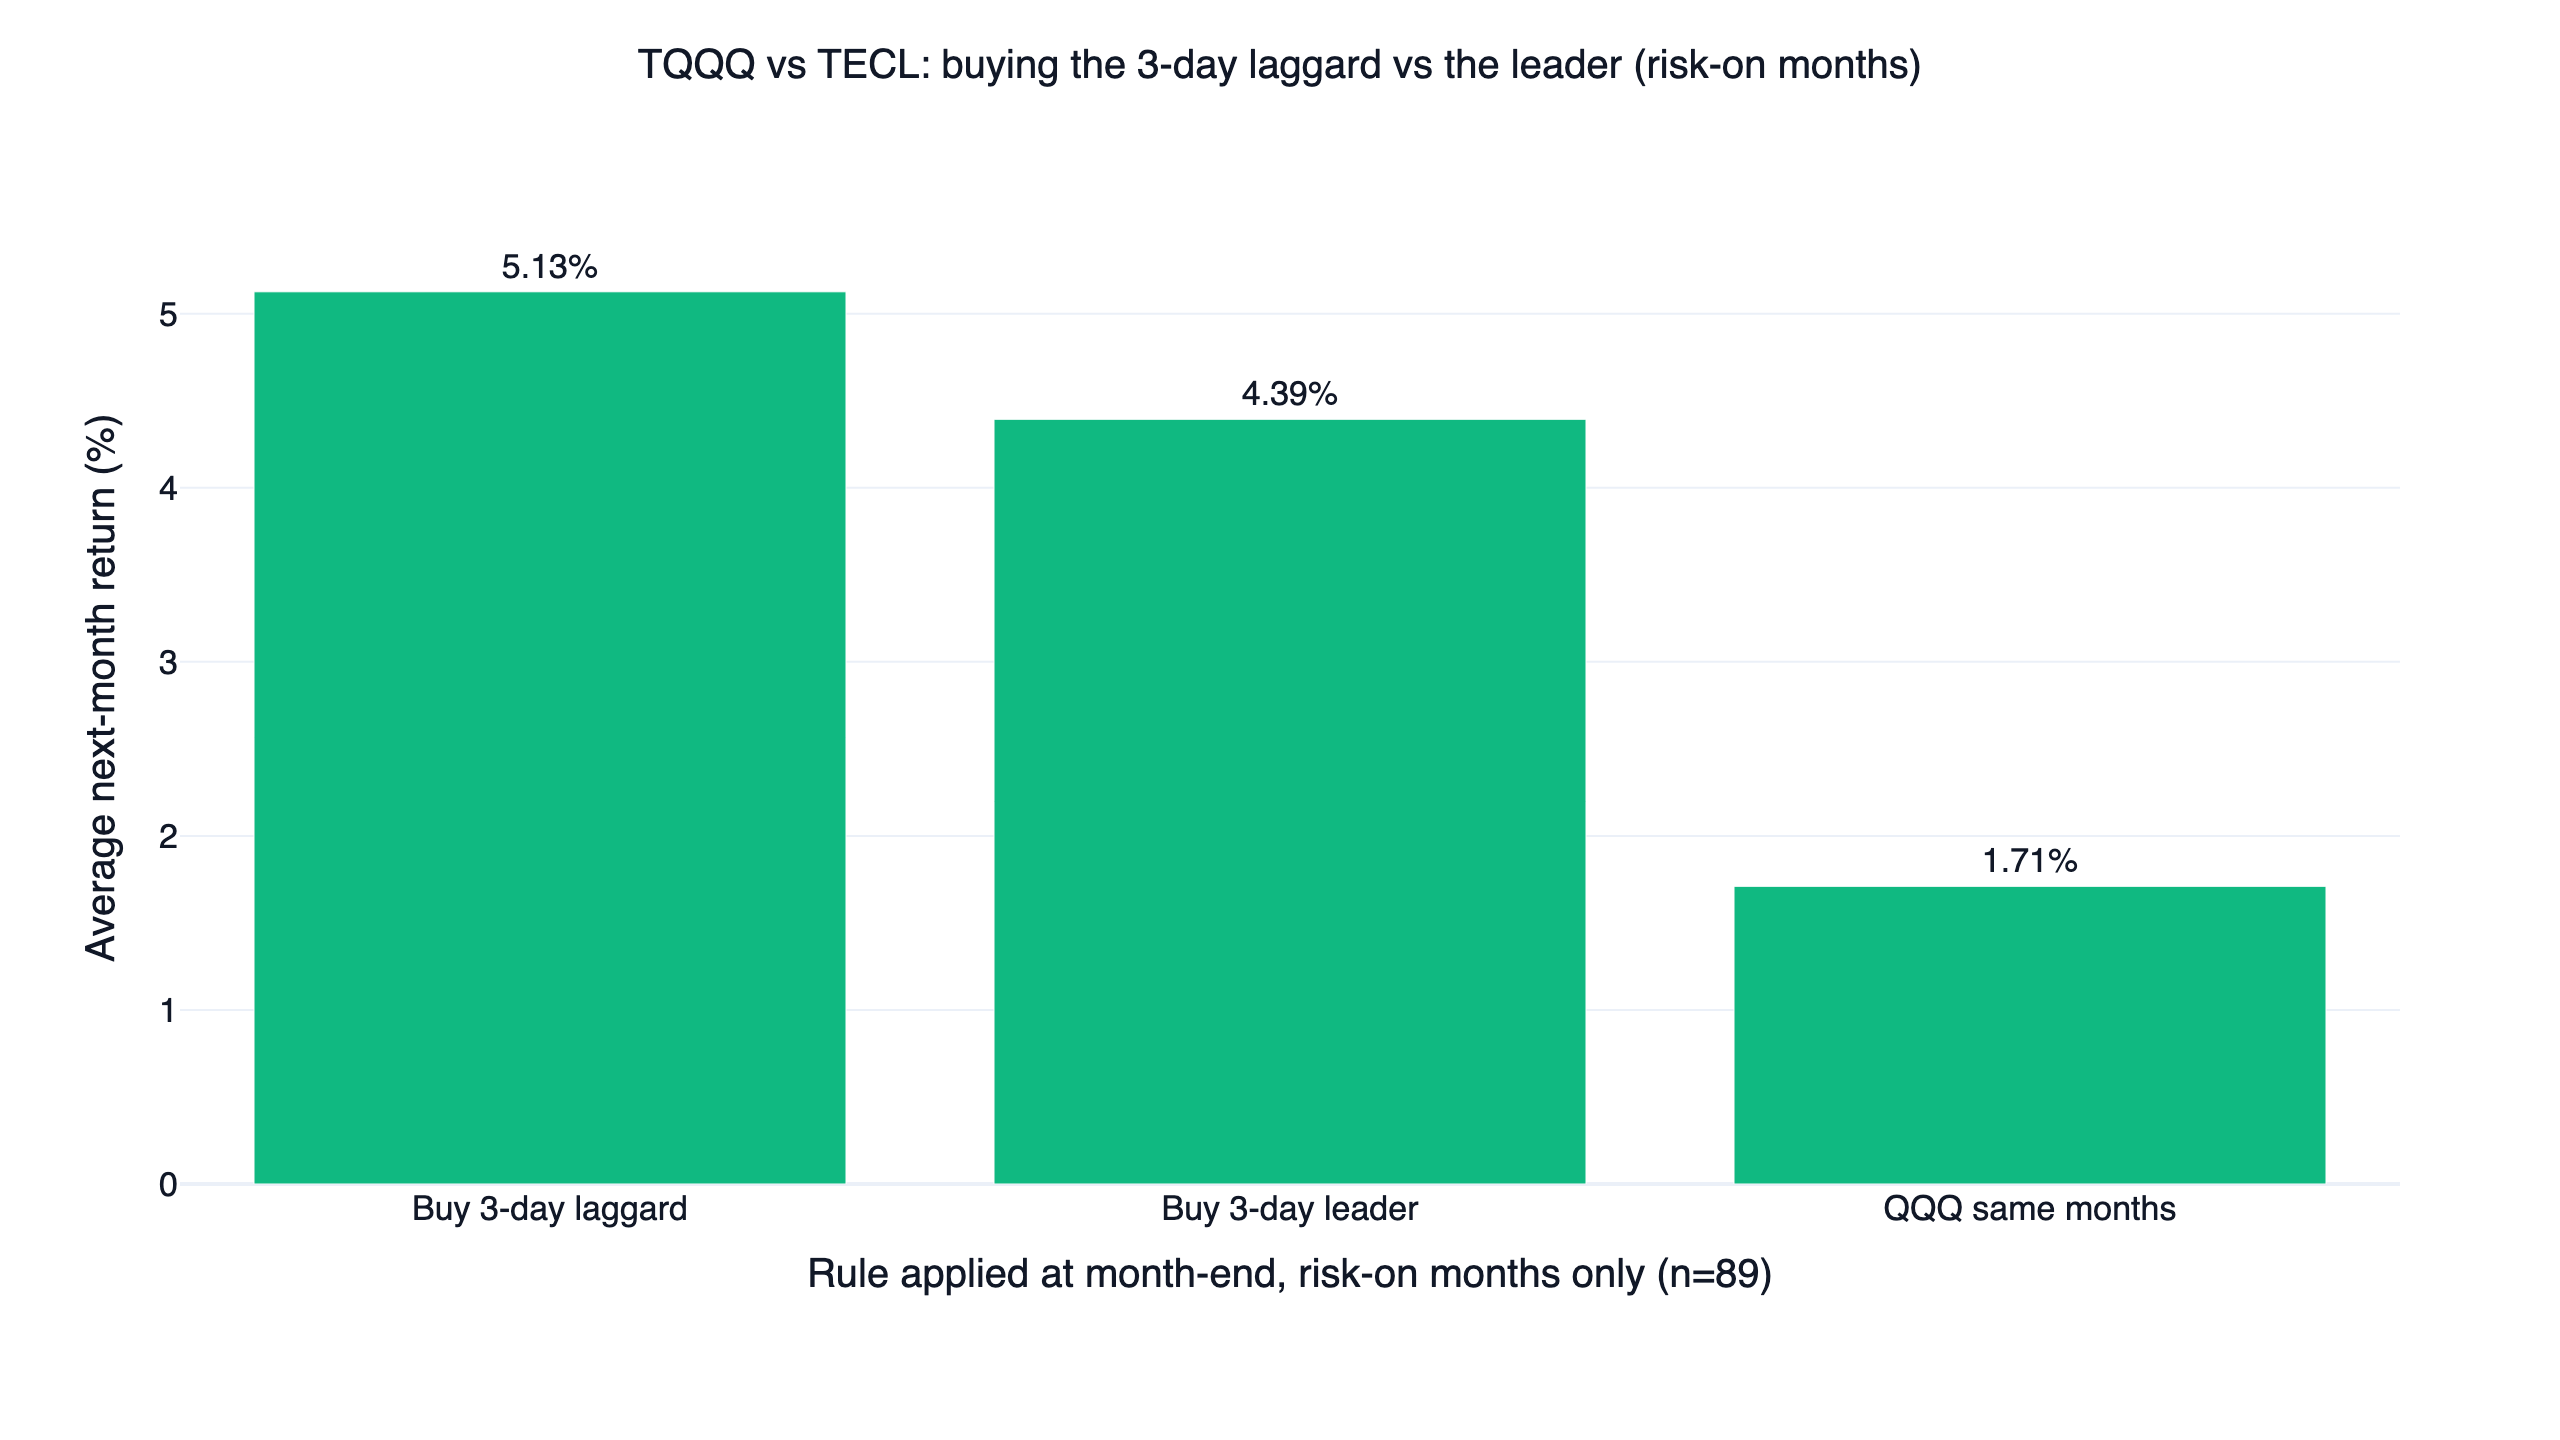
Since there is no stock universe to sort, the cleanest test is an event study at the strategy's own decision points: the 89 month-ends since 2016 when the regime was risk-on. At each of those dates, what did the 3-day laggard return over the next month, versus the 3-day leader, versus QQQ?
| At 89 risk-on month-ends | Avg. next-month return |
|---|---|
| Buy the 3-day laggard (the strategy's pick) | +5.13% |
| Buy the 3-day leader (the opposite rule) | +4.39% |
| QQQ, same months | +1.71% |
Three readings come out of this table, in decreasing order of strength:
- The regime gate does most of the work. Either leveraged fund returned 4-5% in an average risk-on month against QQQ's 1.71%; that is simply 3x exposure held in months the trend filter already screened as favorable. This is the dominant source of the strategy's return.
- The laggard tilt adds a modest layer. Picking the laggard instead of the leader added 0.74 percentage points per month on average (5.13% vs 4.39%), about 0.73% per month or roughly 8.8% annualized as a spread. The laggard beat the leader in 57.3% of risk-on months and posted a positive next month 61.8% of the time.
- The tilt is statistically weak. The laggard-minus-leader spread has a t-statistic of 1.33, below conventional significance thresholds. With 89 monthly observations and two highly correlated funds, the data cannot rule out that the tilt is noise. The strategy's case rests on the spread's consistency with the published reversal literature above, plus the fact that the rule costs nothing extra to apply, since one of the two funds must be held anyway.
The cumulative version of the spread makes the limits visible:
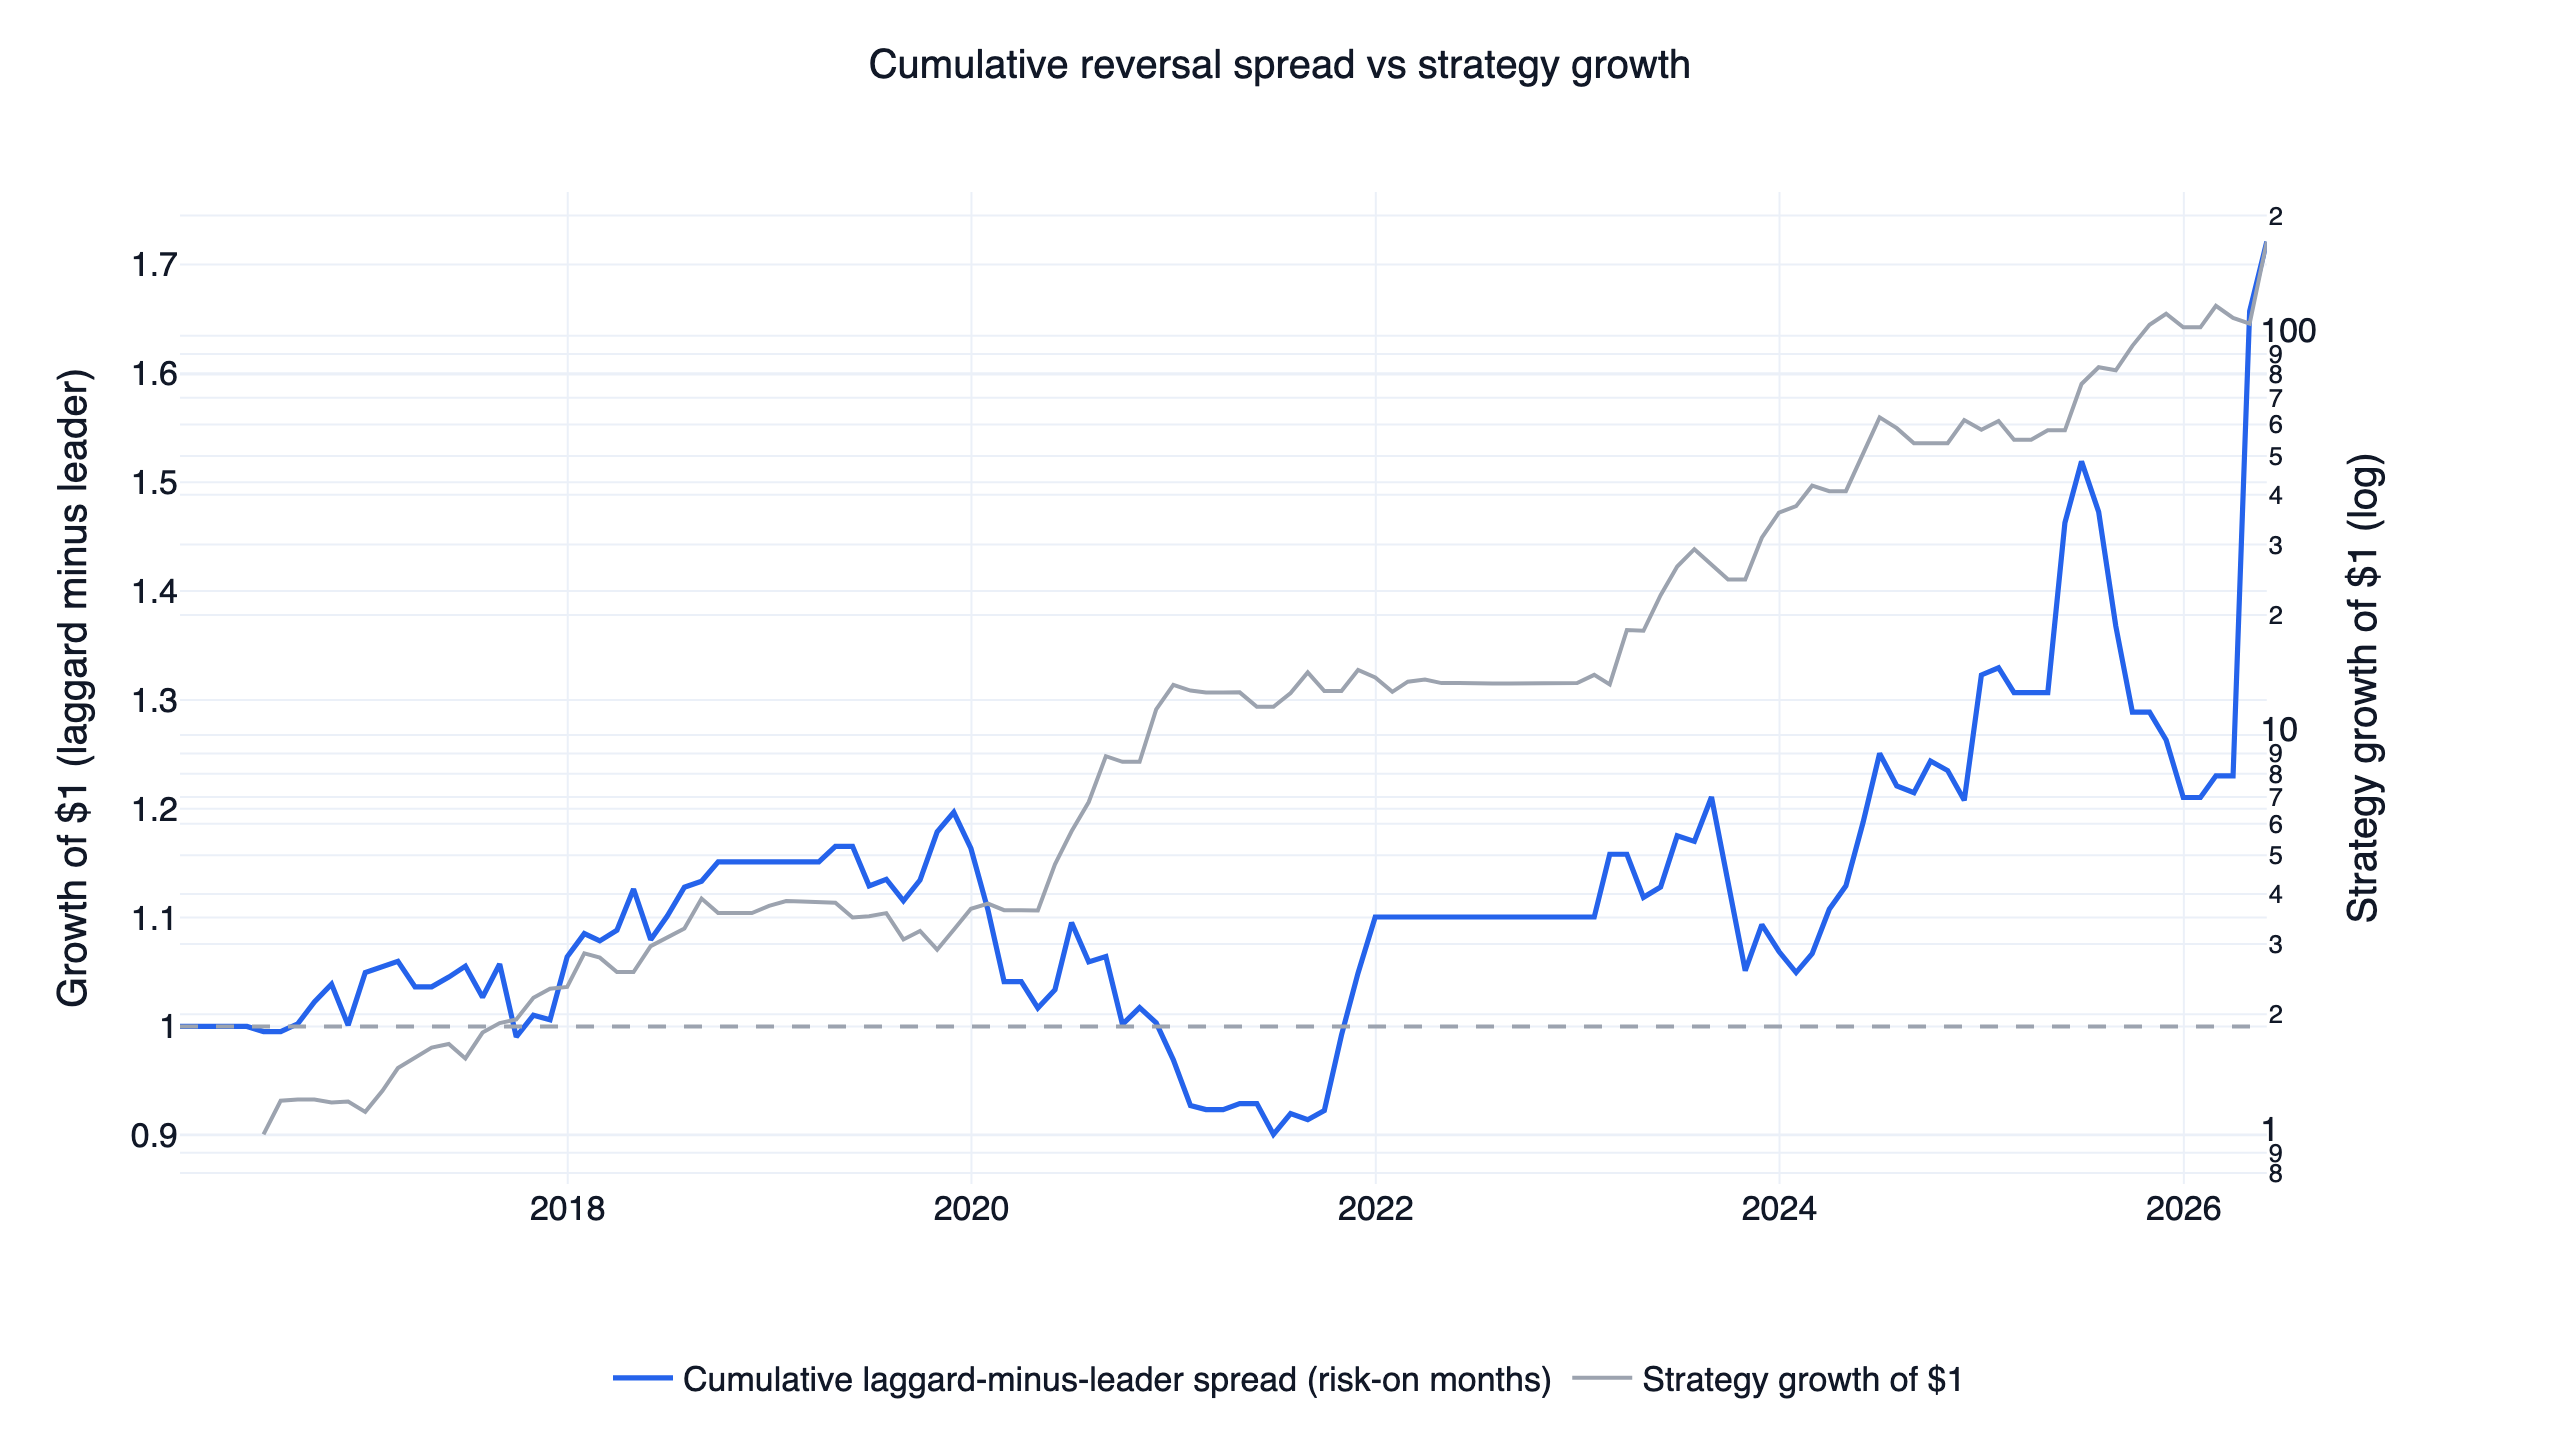
The spread compounds to about 1.7x over the decade, but with long flat-to-negative stretches, most visibly through 2020-21, when leadership between the two funds trended rather than reverted and the laggard rule gave ground for months at a time. Anyone trading this should expect the reversal layer to go quiet, or negative, for extended periods while the regime layer carries the result.
Where the returns come from: the regime timeline
The flip side of a weak reversal edge is that the regime filter has to earn its keep, and the timeline shows it did:
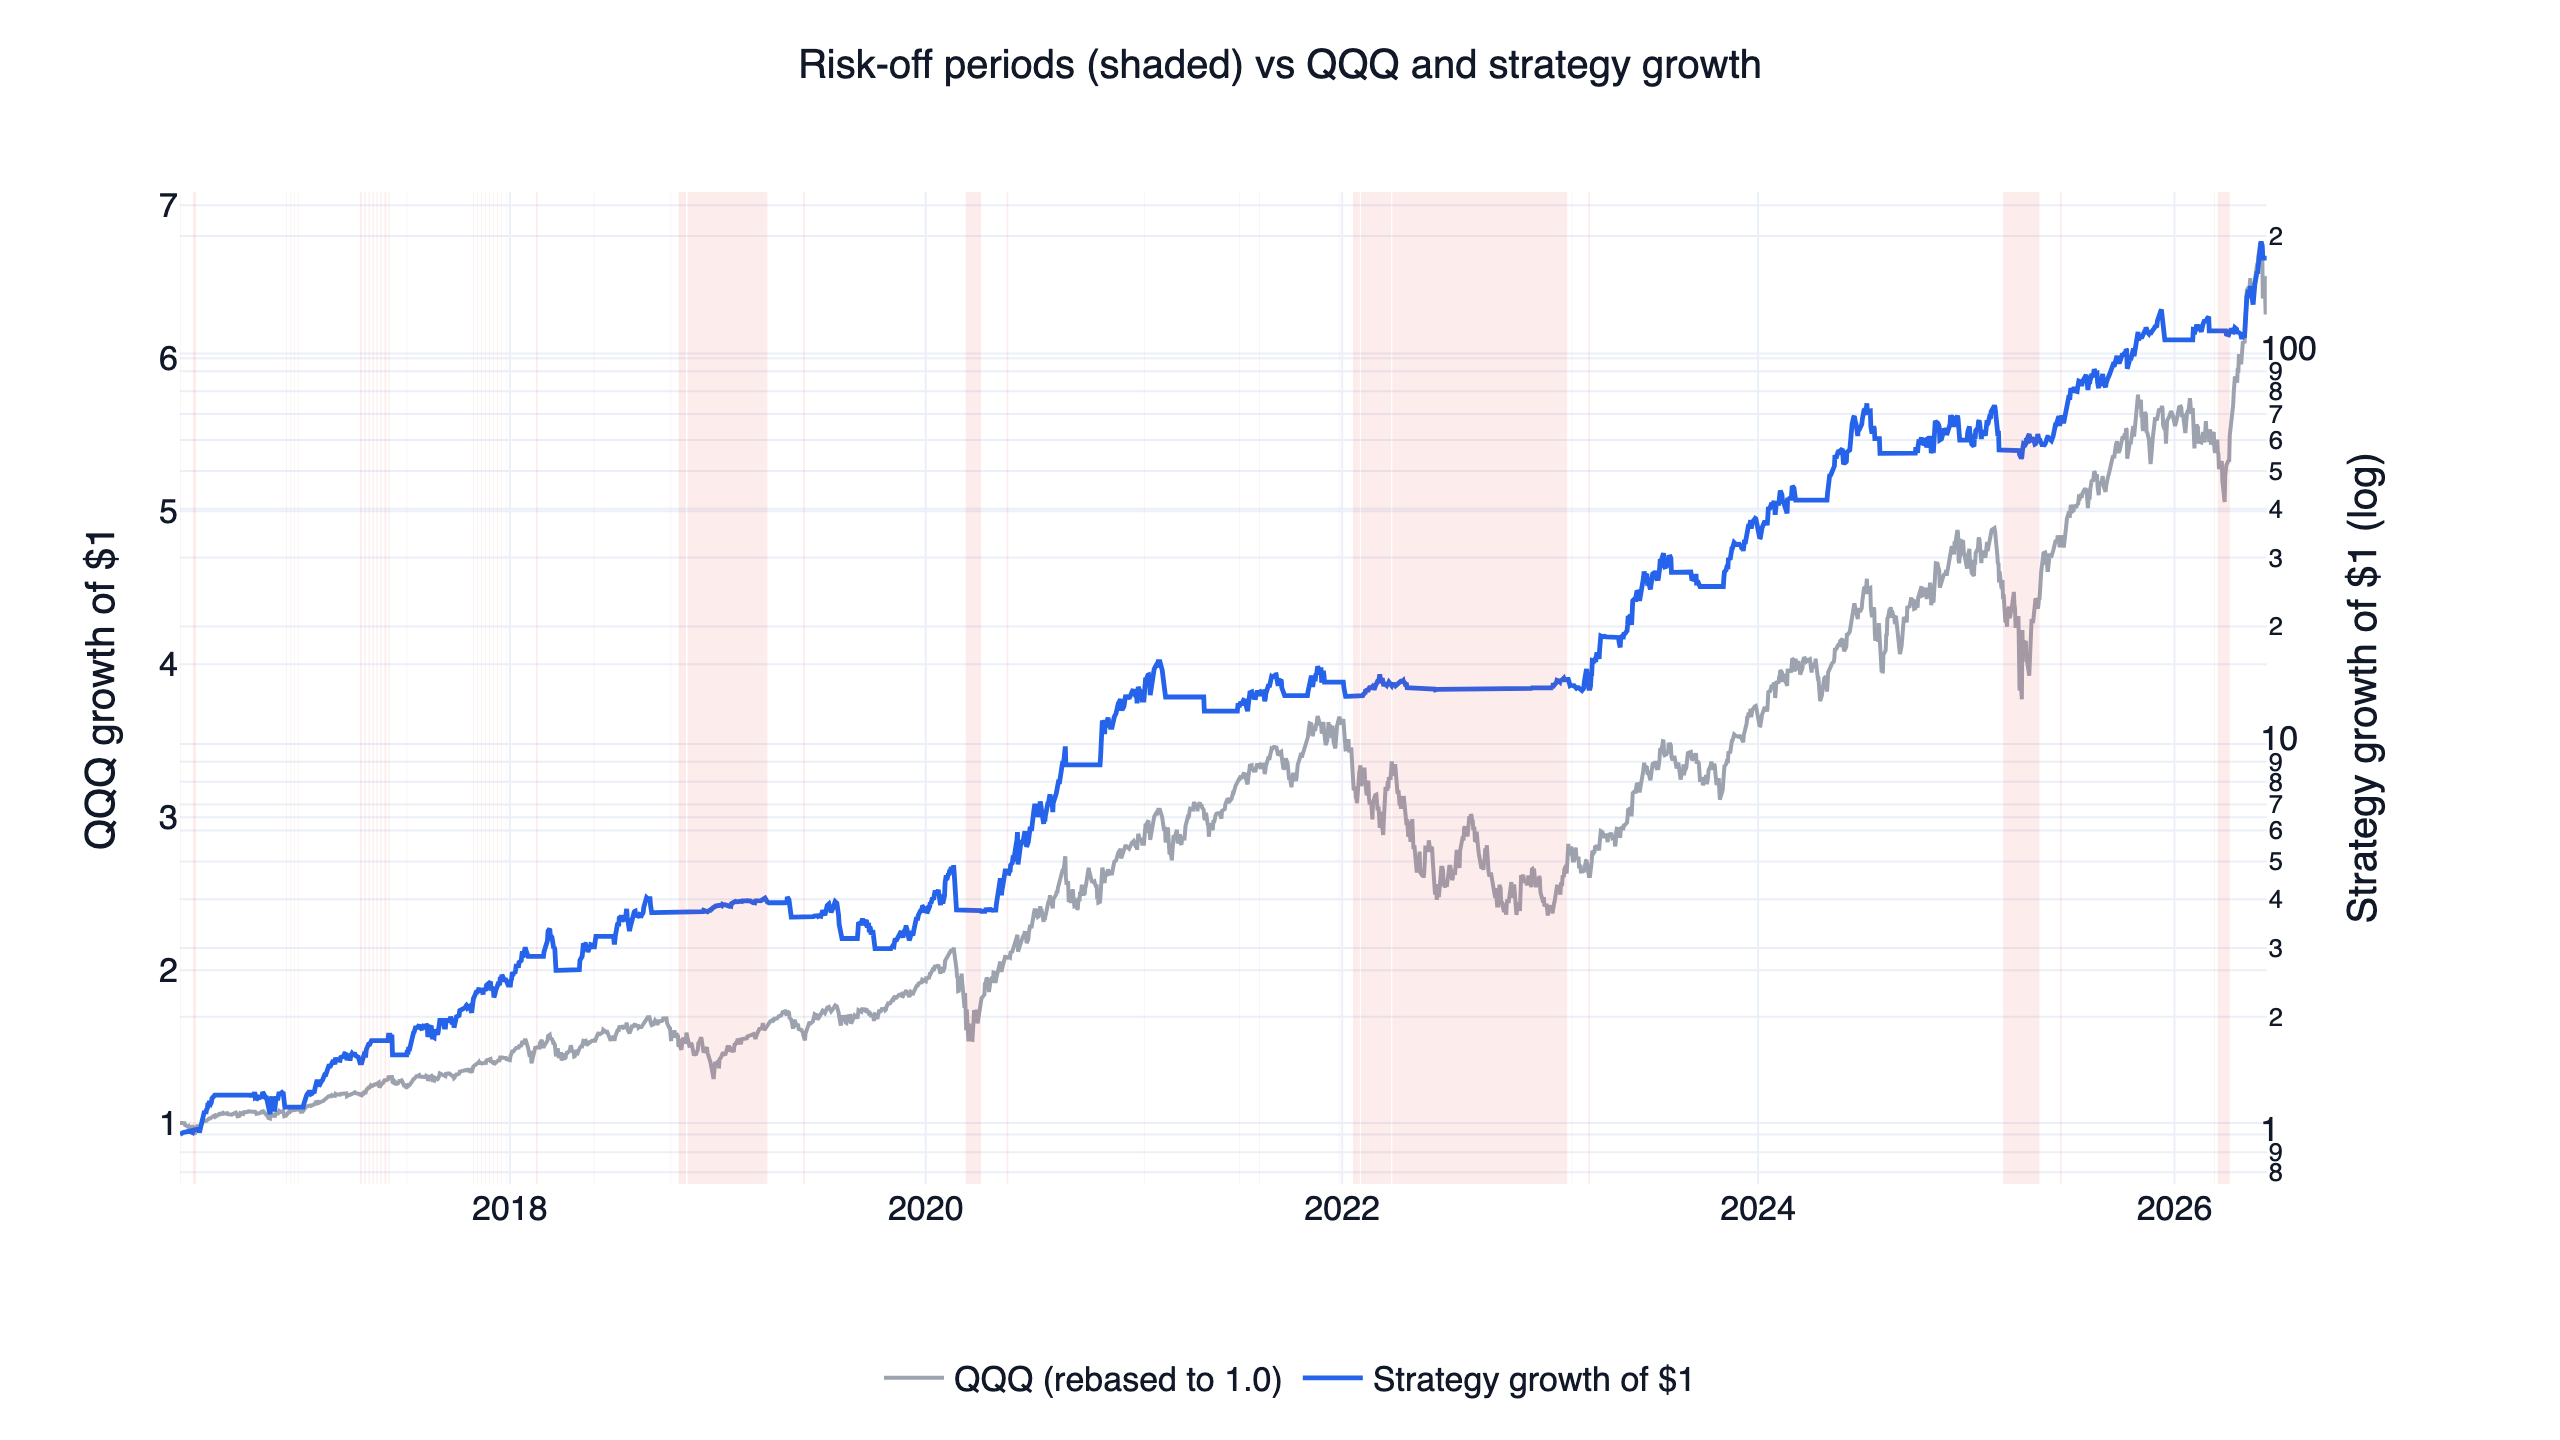
The shaded risk-off spans line up with the periods that destroy naive leveraged holders: late 2018, the COVID crash in 2020, most of 2022, and spring 2025. Through each of them the strategy sat in defensive assets or cash and its equity curve flat-lined instead of collapsing. Where the strategy actually spent its time:
| Holding | Share of trading days |
|---|---|
| TECL | 36.1% |
| TQQQ | 31.8% |
| Cash | 14.9% |
| GLD | 10.7% |
| SHY | 4.3% |
| IEF | 2.3% |
That is 67.8% of days in a 3x leveraged ETF and 17.2% in defensive funds, with the rest in cash around regime transitions and stop-outs. Turnover is about 6.2x per year across 95 round trips in the backtest: monthly switching between a small menu of liquid ETFs, not intraday churn.
The data and the code
Everything runs on FinLab's US fund dataset; the entire strategy needs only ETF prices. us_fund_price:adj_close is total-return adjusted, so dividends and the funds' embedded costs are reflected in every series. The on-page version below shows the three layers; the full position assembly and sim() call are in the downloadable script.
Show Code
import finlab
from finlab import data
from finlab.backtest import sim
from finlab.dataframe import FinlabDataFrame

finlab.login()  # finlab opens a login prompt automatically
data.set_market("us_fund")

close = data.get("us_fund_price:adj_close")[["QQQ", "TQQQ", "TECL", "IEF", "GLD", "SHY"]]

# 1. Regime filter: QQQ above its 200-day average with positive 6-month momentum
qqq_trend = close["QQQ"] > close["QQQ"].rolling(200, min_periods=100).mean()
qqq_momentum = close["QQQ"] / close["QQQ"].shift(126) - 1
risk_on = qqq_trend & (qqq_momentum > 0)

# 2. Reversal rule: score TQQQ and TECL by negative 3-day return,
#    so the recent laggard ranks first
reversal_score = FinlabDataFrame(-close[["TQQQ", "TECL"]].pct_change(3))

# 3. Defensive sleeve: strongest 3-month-minus-1-month momentum among IEF / GLD / SHY
defensive = close[["IEF", "GLD", "SHY"]]
defensive_score = FinlabDataFrame(defensive.pct_change(63) - defensive.pct_change(21))

# Hold exactly one ETF: the laggard when risk-on, the strongest defensive fund otherwise
# (position assembly in the downloadable strategy.py)
report = sim(
    position,
    resample="M",
    position_limit=1,
    stop_loss=0.08,
    touched_exit=True,
    fee_ratio=0,
    tax_ratio=0,
)
The fee_ratio=0, tax_ratio=0 setting reflects commission-free US ETF trading and is discussed under method limits below.
Results and the interactive report
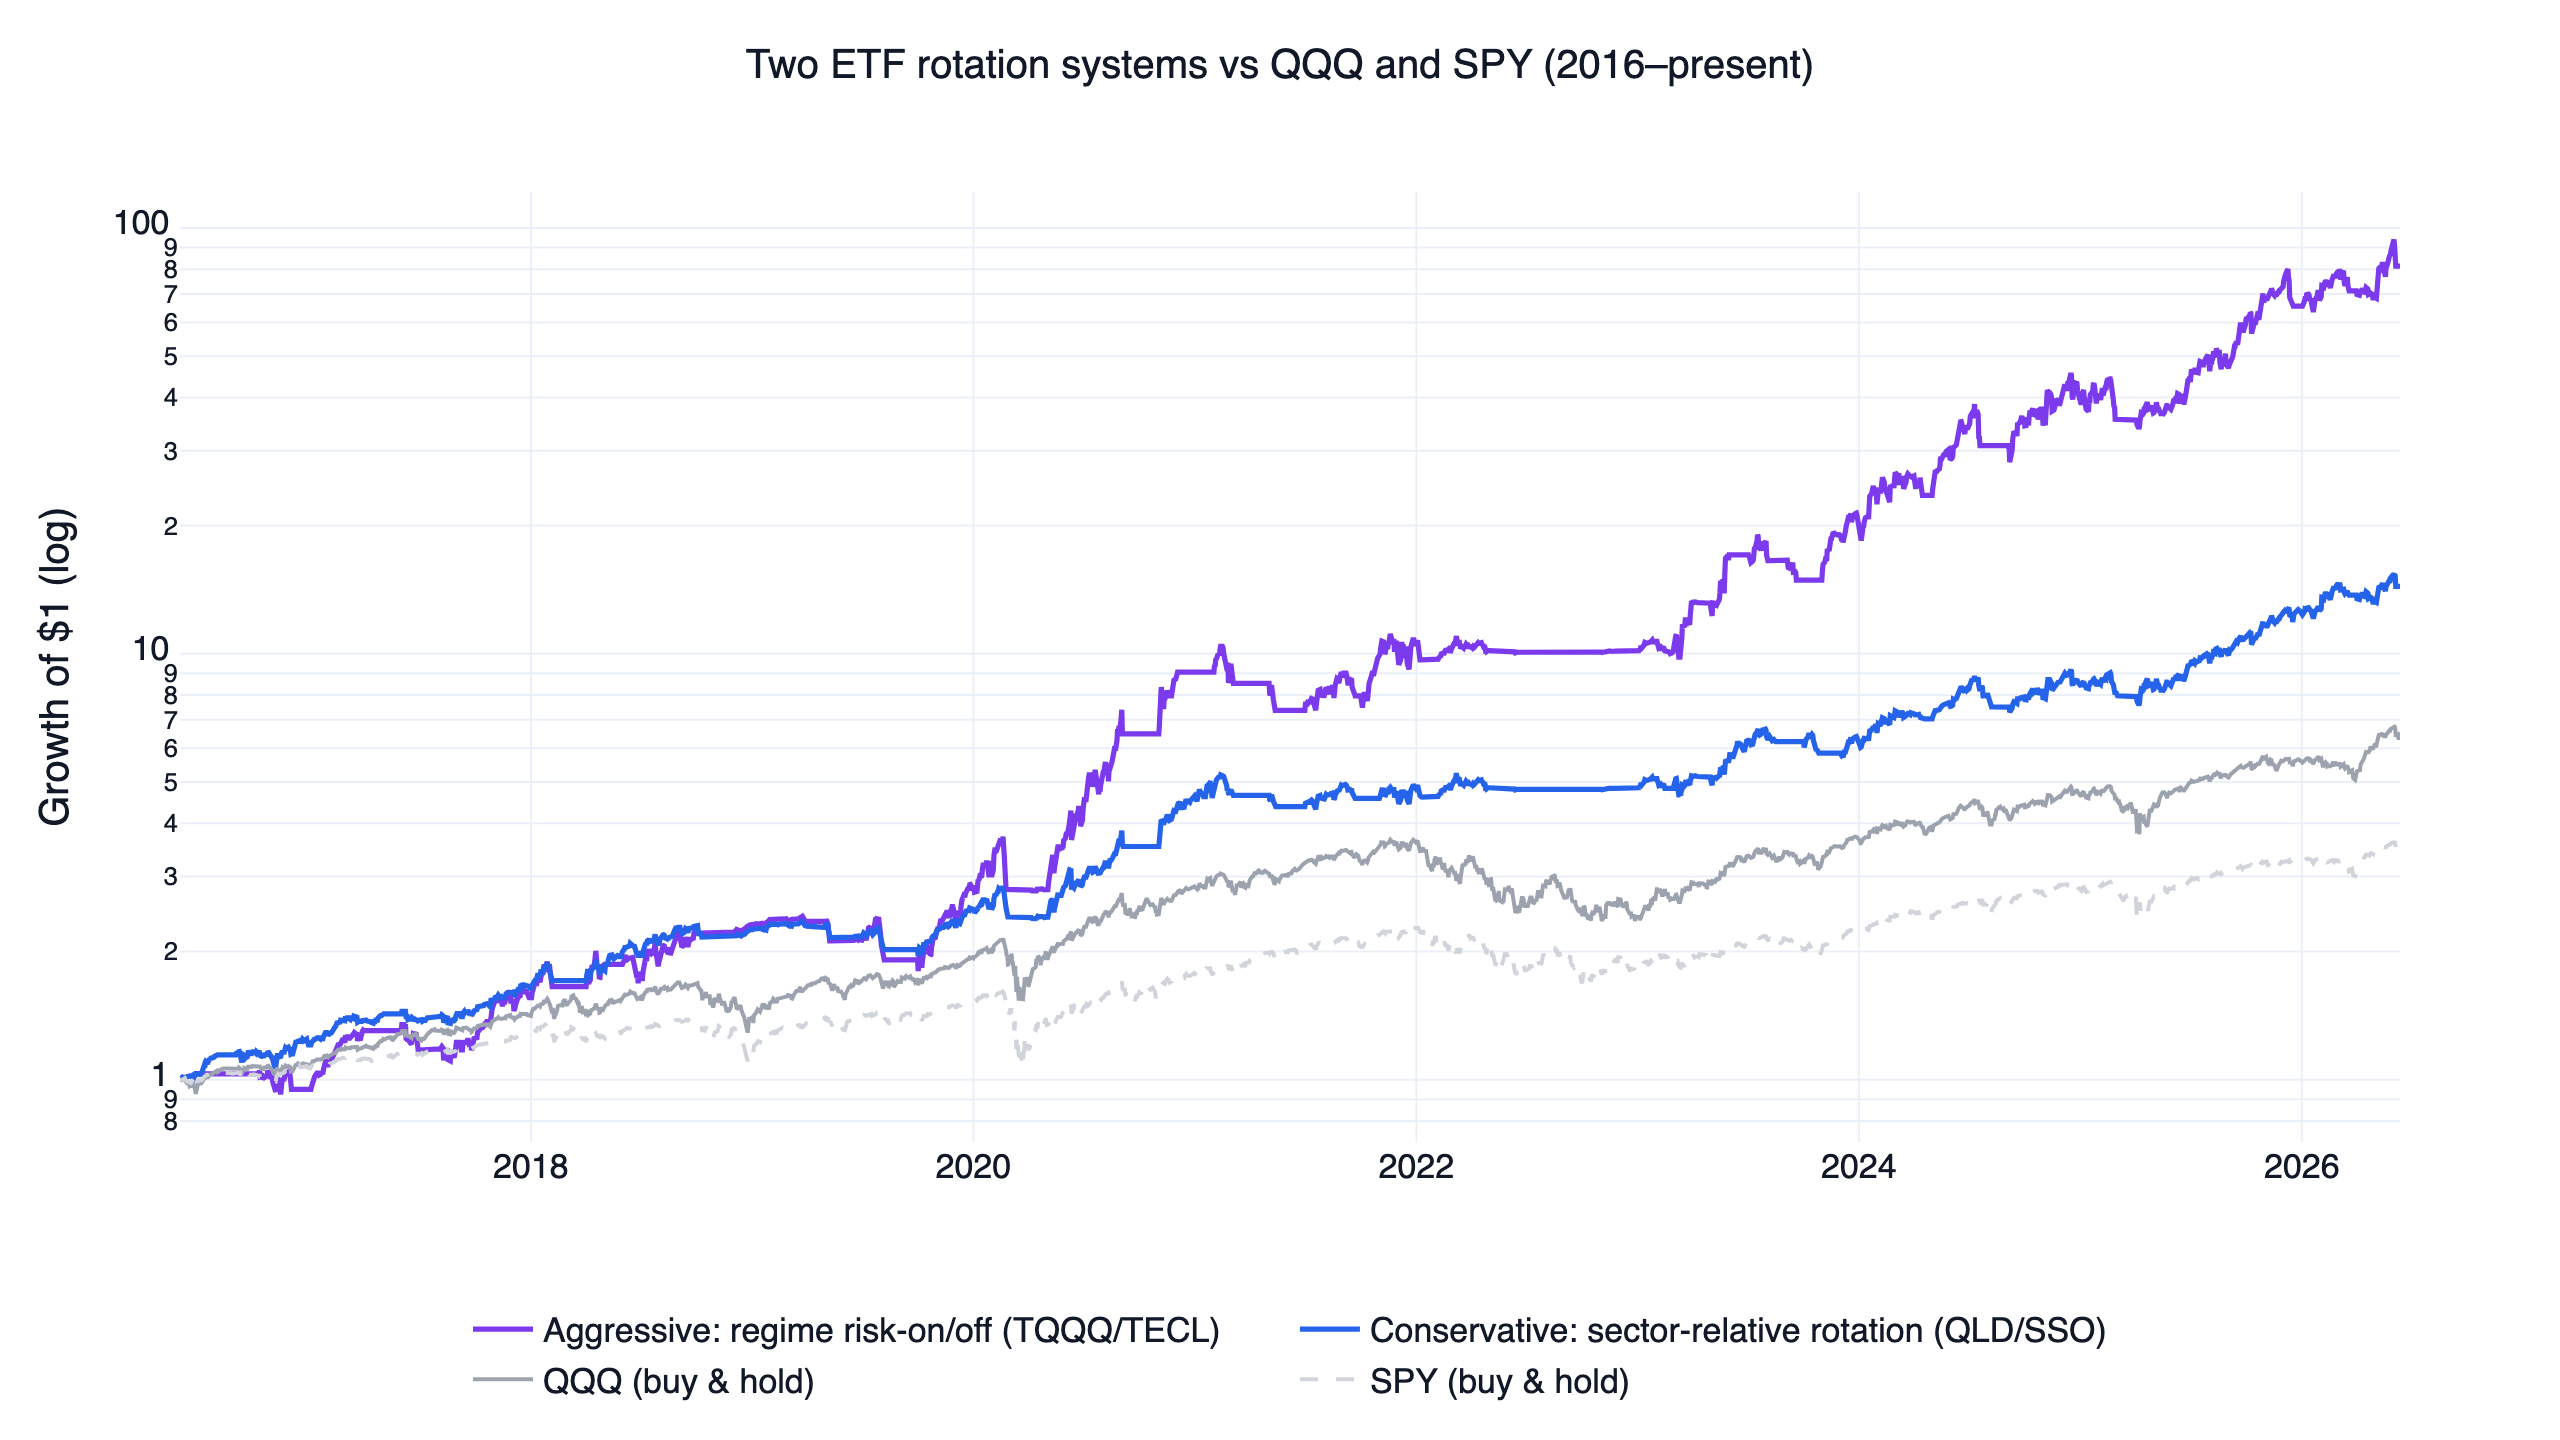
The equity curve at the top of this article shows the full comparison on a log scale: the strategy's 175, versus roughly 6.6 for QQQ, and $3.7 for SPY. Here is the interactive finlab report — drawdowns, monthly returns, and the trade list — so you can inspect the result directly rather than take a summary's word for it:
The drawdown picture deserves its own chart, because it is the strongest argument for timing leverage instead of holding it:
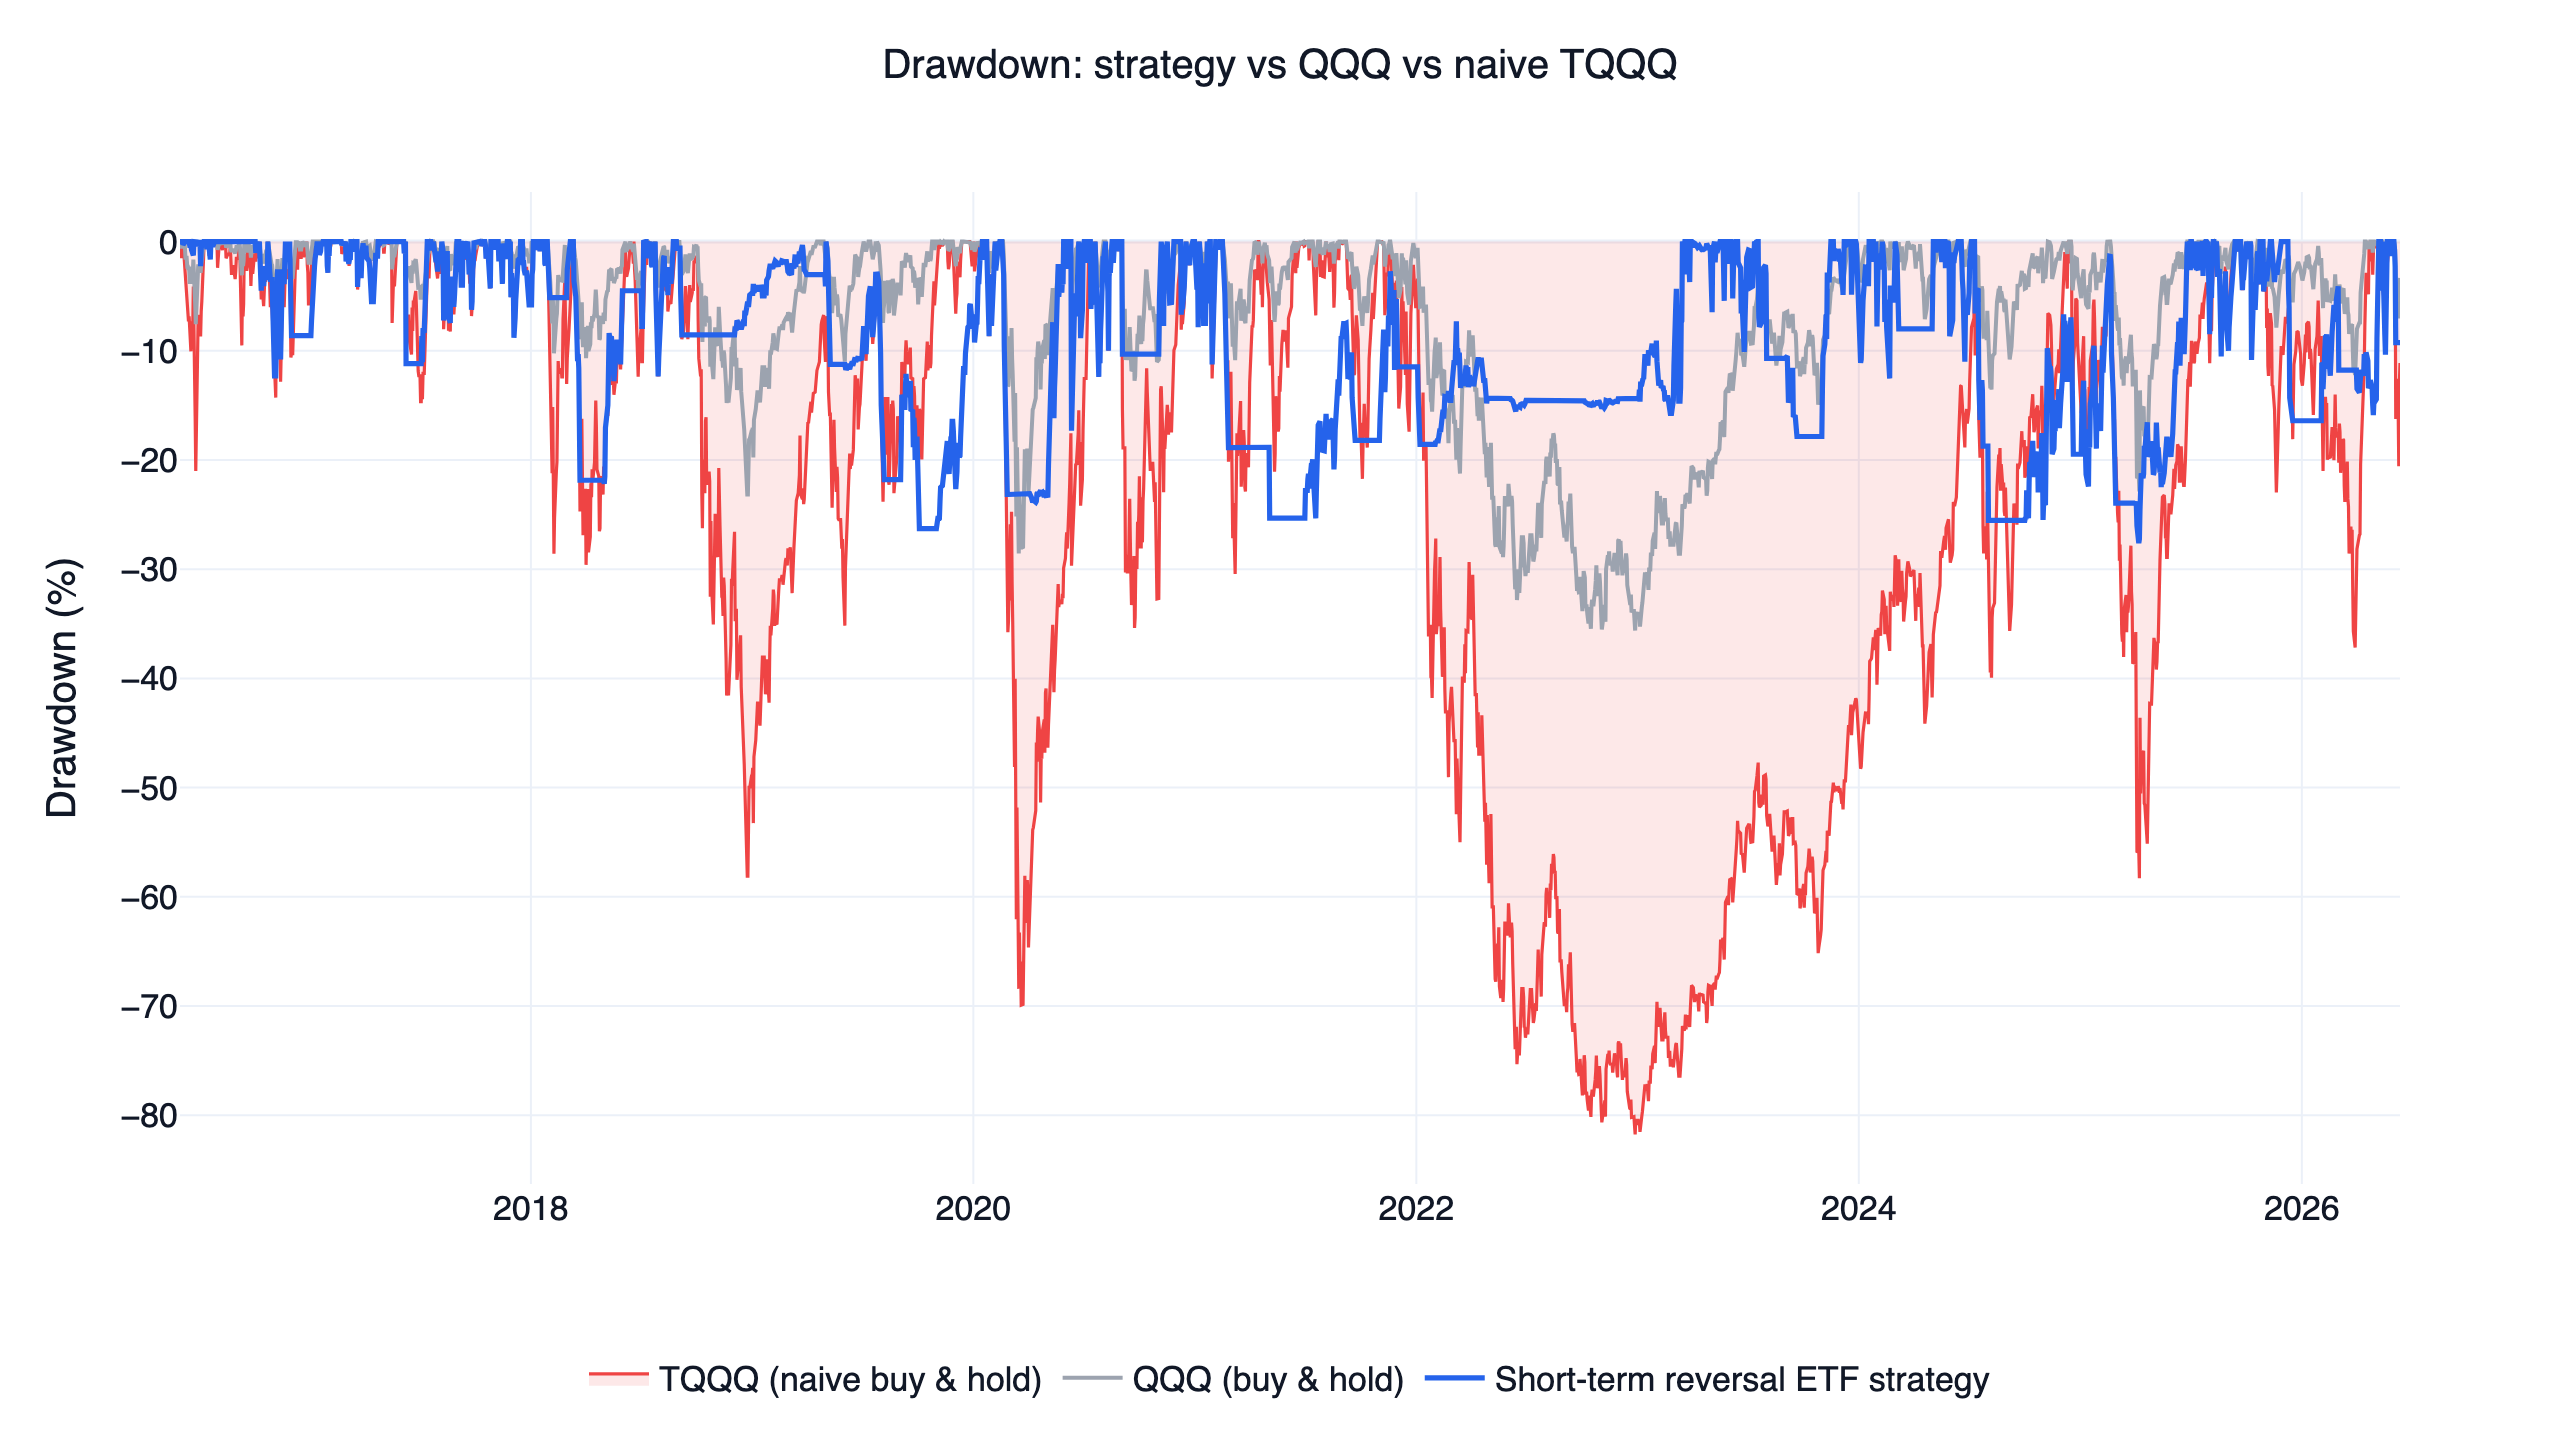
In 2022, naive TQQQ fell -81.8% and QQQ -35.6%, while the strategy's worst drawdown over the whole decade was -27.6%. A -27.6% loss is still severe — it takes a +38% recovery just to break even — but it is a loss a disciplined investor can plausibly sit through, where -81.8% usually ends in capitulation.
Out-of-sample: 2022 to present
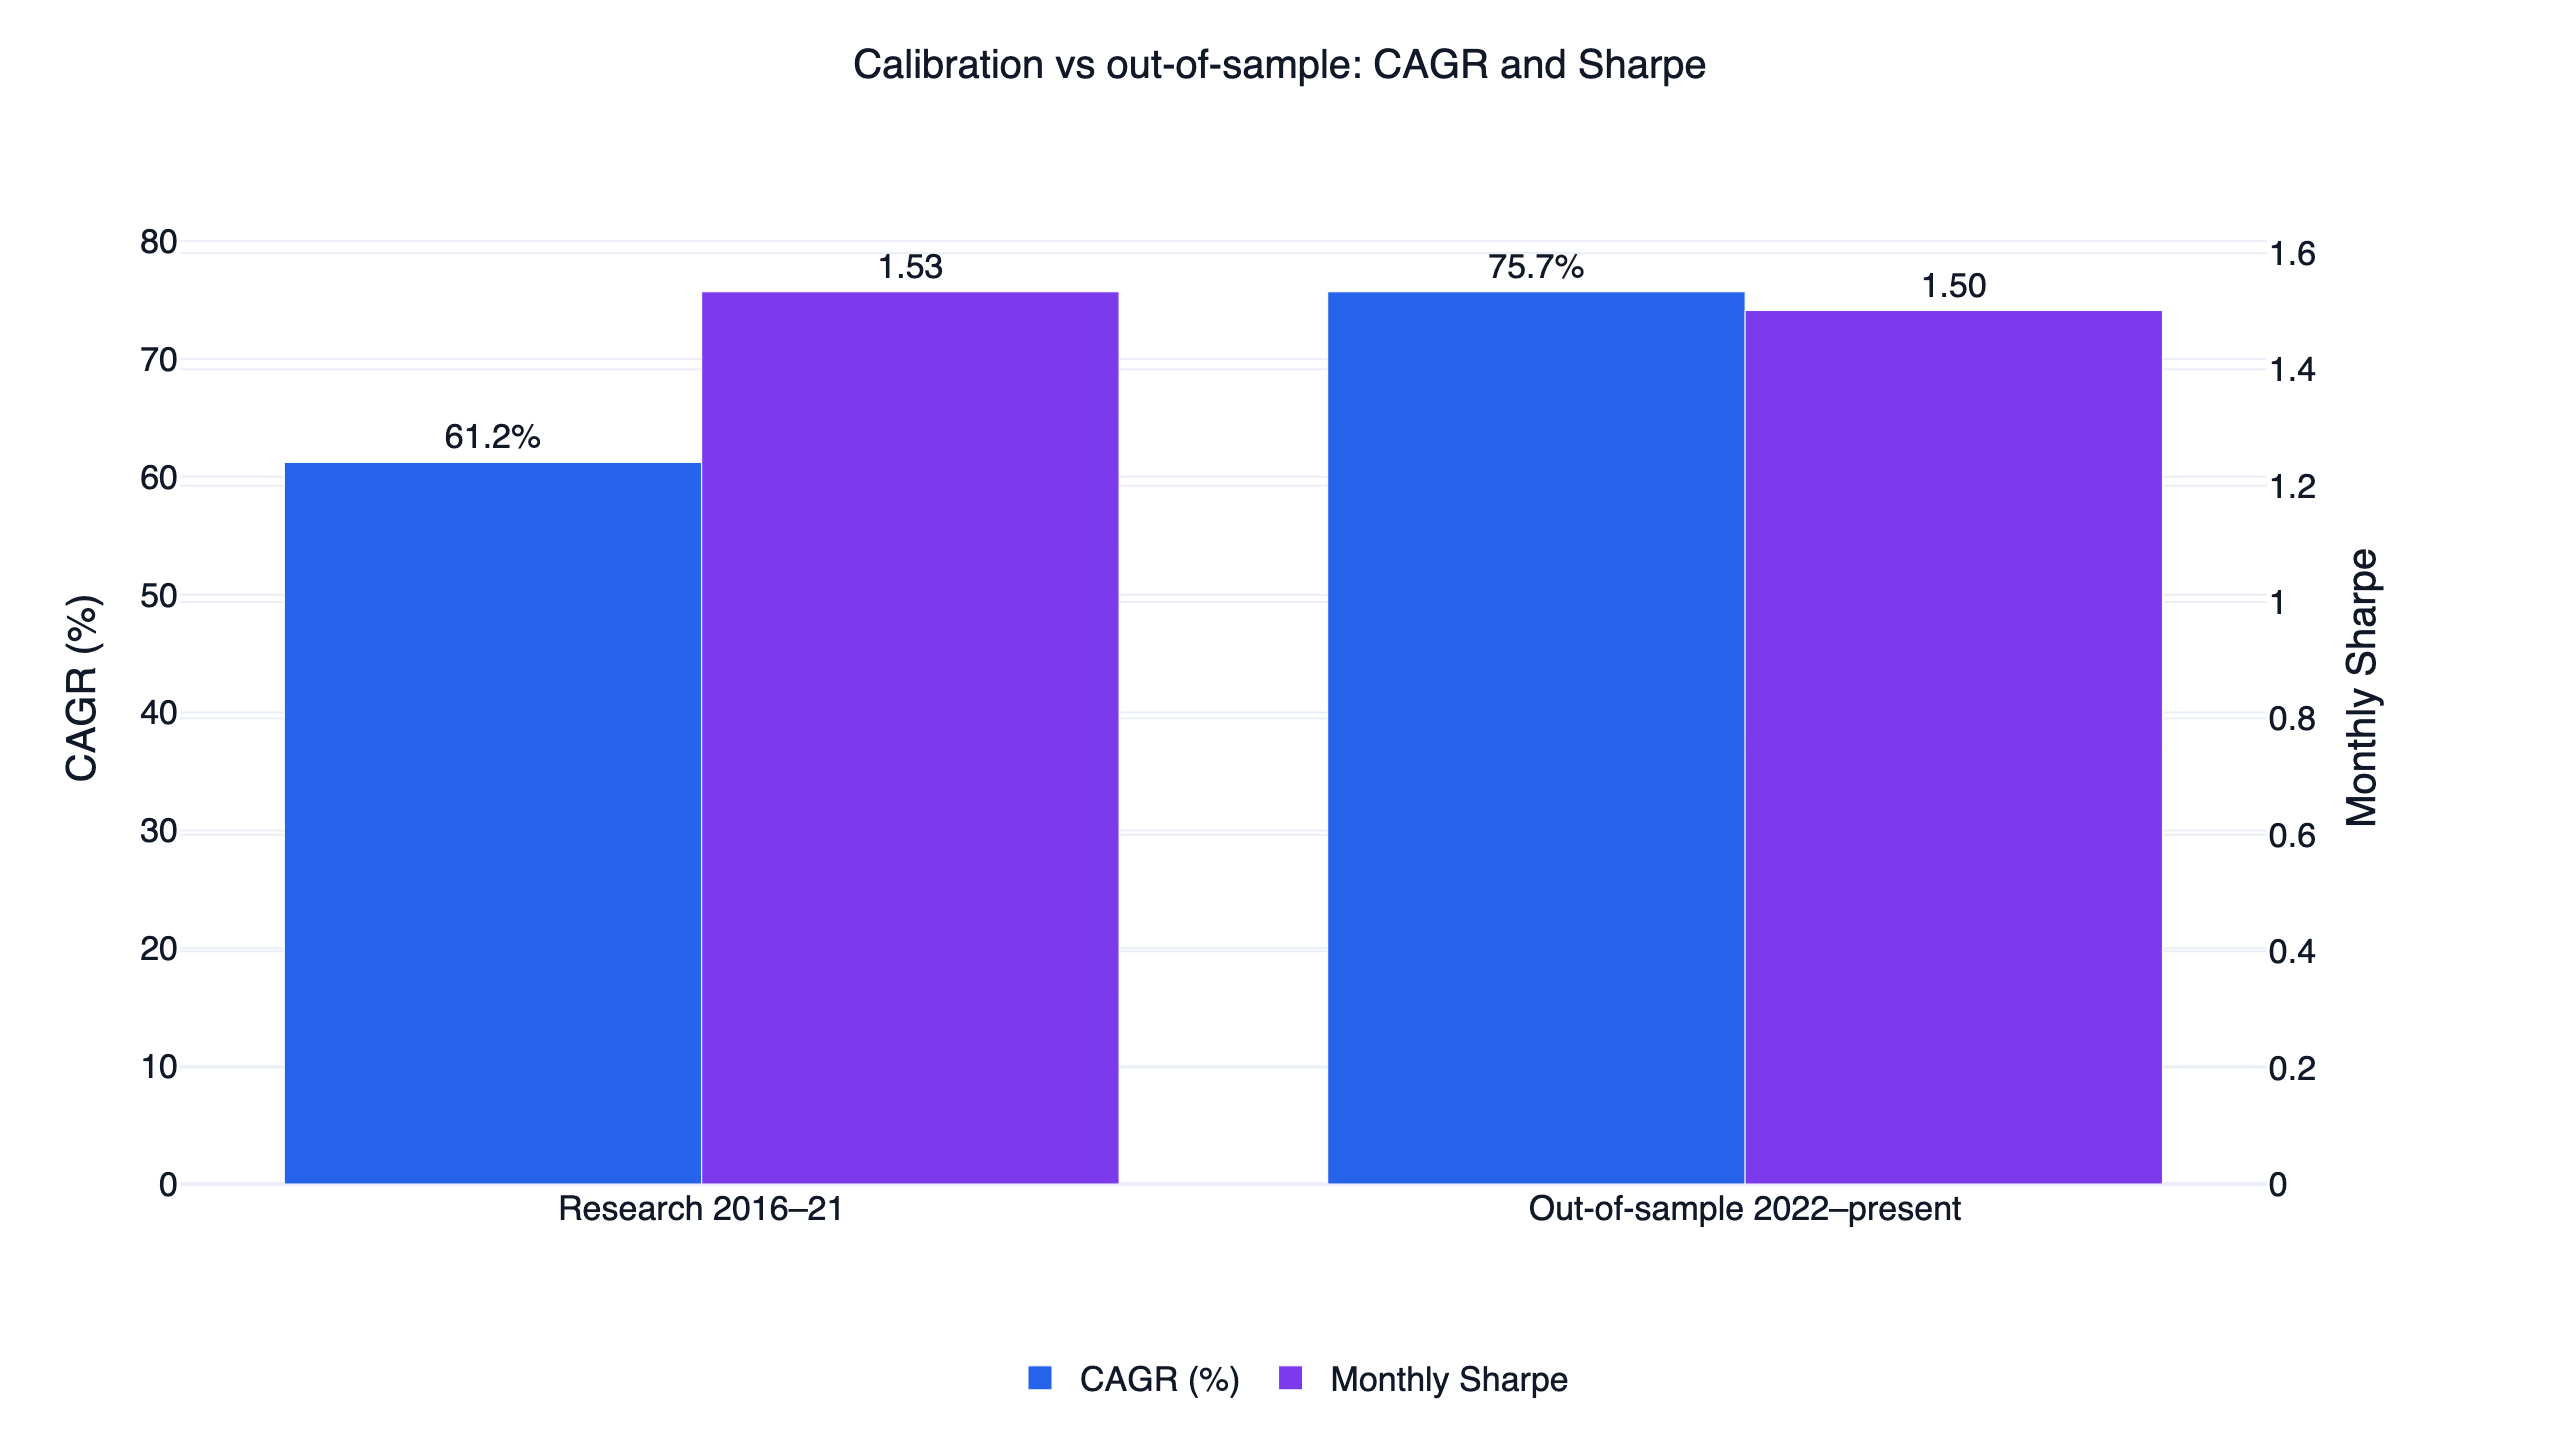
The parameters (200-day trend, 126-day momentum, 3-day lookback, 8% stop) were chosen on 2016-2021 data and then left untouched on 2022-present, an unseen stretch containing a full bear market.
| Period | CAGR | Monthly Sharpe | Max drawdown | QQQ CAGR, same period |
|---|---|---|---|---|
| Research (2016-2021) | 61.2% | 1.53 | -26.3% | 24.0% |
| Out-of-sample (2022-present) | 75.7% | 1.50 | -27.6% | 14.1% |
The out-of-sample period produced a higher CAGR at an almost identical Sharpe, in a stretch where QQQ itself earned far less than in the research years. The regime filter spending most of 2022 in defensive assets explains much of that resilience. One market cycle of out-of-sample evidence is encouraging and still only one cycle.
Backtest method and limits
| Item | This backtest |
|---|---|
| Transaction costs | fee_ratio=0, tax_ratio=0, the commission-free US ETF assumption. Spreads and slippage are not modeled; both funds are highly liquid, but live results would be slightly lower. |
| Fill price | Rebalance trades fill at the close (trade_at_price="close"). |
| Leverage costs | TQQQ and TECL expense ratios (about 0.84-0.94% per year) and daily-reset drag are embedded in the adjusted price series. Borrow-cost drag in sideways markets is therefore reflected, not assumed away. |
| Universe | A fixed six-ETF set; no stock universe and no survivorship question within it. TECL launched in 2008, and all comparison lines are rebased to the common 2016-06-01 start, so the signal's pre-2016 behavior is untested in this report. |
| Turnover | About 6.2x per year, 95 trades over the decade. |
| Position rule | Exactly one holding at all times; 8% touched stop on the leveraged leg. |
| Sample | 2016-2021 calibration, 2022-present out-of-sample. |
| Capacity | Not estimated; both funds carry multi-billion-dollar AUM, but impact depends on your size. |
On the risk-adjusted gate this family is judged against (a ratio of at least 1.5): the full-period monthly Sharpe is 1.43, below the 1.5 line on its own. The strategy passes through its monthly Sortino of 4.63, its out-of-sample monthly Sharpe of 1.50 and Sortino of 5.84, and its research-window monthly Sharpe of 1.53. The Sortino-Sharpe gap is characteristic of regime-gated leverage: most of the volatility that remains is upside volatility in risk-on months.
The leveraged-ETF risk you must understand
A 67% CAGR headline should raise your guard, and the specific risks here are concrete:
- Daily reset and path dependency. A 3x daily ETF compounds daily, so a choppy, sideways market erodes value even if the index ends flat. The naive TQQQ line (-81.8% drawdown) is what unmanaged 3x exposure looks like through one bear market.
- One holding, all the time. This is the most concentrated strategy in its family: a single 3x fund on a single theme (large-cap US growth and technology) for two-thirds of all days. There is no diversification inside the portfolio at any moment.
- The laggard can keep lagging. The rule buys the weaker of two funds into weakness. In sharp technology-led selloffs, short-term laggards can keep underperforming rather than snapping back — the known weak spot of this signal, and the scenario behind its worst stretches.
- Gaps can beat stops. The 8% stop is a touched level in the backtest; a large overnight gap can fill worse in live trading.
- Monthly switching is not crash protection. A fast crash inside a month is taken at full 3x leverage until the stop or the next rebalance triggers.
- The reversal edge itself is unproven at significance. With a t-stat of 1.33, the laggard tilt may contribute nothing in the future; size your expectations around the regime engine, with the tilt as a possible bonus.
If this risk profile is too aggressive, the same regime framework supports gentler expressions: the stock-factor members of the family hold two funds with shallower drawdowns, as compared in the ten-strategy overview.
Who this is for
This strategy fits an investor who wants maximum rules-based compounding from a leveraged-ETF framework, fully understands 3x products, and can hold a single concentrated position through 33% volatility and a -27.6% drawdown without overriding the rules. It does not fit anyone who needs capital stability, diversification within the portfolio, or discomfort-free months — the reversal layer alone can underperform for a year at a time.
FAQ
What is a short-term mean reversion trading strategy? A rule that buys assets that lagged over the past few days and expects them to recover, documented in US stocks by Jegadeesh (1990) and Lehmann (1990). This version applies it between two leveraged growth ETFs inside a trend-regime gate.
Why TQQQ and TECL specifically? They are liquid 3x funds on heavily overlapping exposures, so a 3-day gap between them reads as temporary flow imbalance rather than a leadership change — the liquidity-provision mechanism in Da, Liu & Schaumburg (2014). Since the strategy must hold one of the two in risk-on anyway, the laggard rule costs nothing extra to apply.
Is the 67.4% CAGR mostly from the mean reversion signal? No. The event study above attributes most of the return to holding 3x leverage in trend-filtered risk-on months; the laggard tilt added about 0.73% per month on average with a t-stat of only 1.33.
How risky is this compared to just holding QQQ? Volatility is 33.1% versus QQQ's 22.2%, and the worst drawdown was -27.6% versus QQQ's -35.6%. Higher day-to-day swings, shallower worst loss, driven by stepping aside in risk-off regimes.
How often does it trade? Monthly rebalancing, about 6.2x turnover per year, 95 trades over the decade tested.
Can I run and modify this myself?
Yes. Use the AI-assisted setup flow and ask your agent to rebuild or tweak the rule, or download the script below and run it after setup. Only ETF data (us_fund_price:*) is needed, which is in a standard FinLab account.
Reproduce it yourself
Two files reproduce everything above:
- strategy.py — the full strategy, ready to run after the AI-assisted setup flow.
- data.csv — daily equity curves for the strategy, QQQ, SPY, and naive TQQQ.
A productive next experiment is to vary the reversal lookback (3 vs 5 vs 10 days) or swap the laggard rule for the leader rule and watch the spread: install the FinLab skill and let your agent run the variants. To see how this system compares with its nine siblings on the same data, read the US quant trading strategies overview, and for the stock-level validation this ETF-timing strategy cannot offer, the US momentum study is the template. For more strategy research, see the FinLab research blog, the AI-built PEG value strategy, the new-high momentum study, the AI quant research workflow, the institutional-flow strategy, and the cash-flow quality strategy. Metric definitions are in the glossary; to see what teams build with finlab, browse the use cases and the team behind FinLab.
Last updated: 2026-06 | Backtest window: 2016-06 to 2026-06 | Benchmark: QQQ total return | Author: FinLab Quant Research (reviewed by a quantitative researcher)
Investing involves risk, and past performance does not represent future results. Leveraged ETFs carry additional risks including volatility decay and amplified losses. This content is for educational purposes only and is not investment advice and does not constitute investment advice; evaluate any strategy against your own risk tolerance.
FinLab AI
Want to build your own strategy?
Describe your stock-picking ideas in natural language. AI automatically validates, backtests, and gives you answers
Start Free