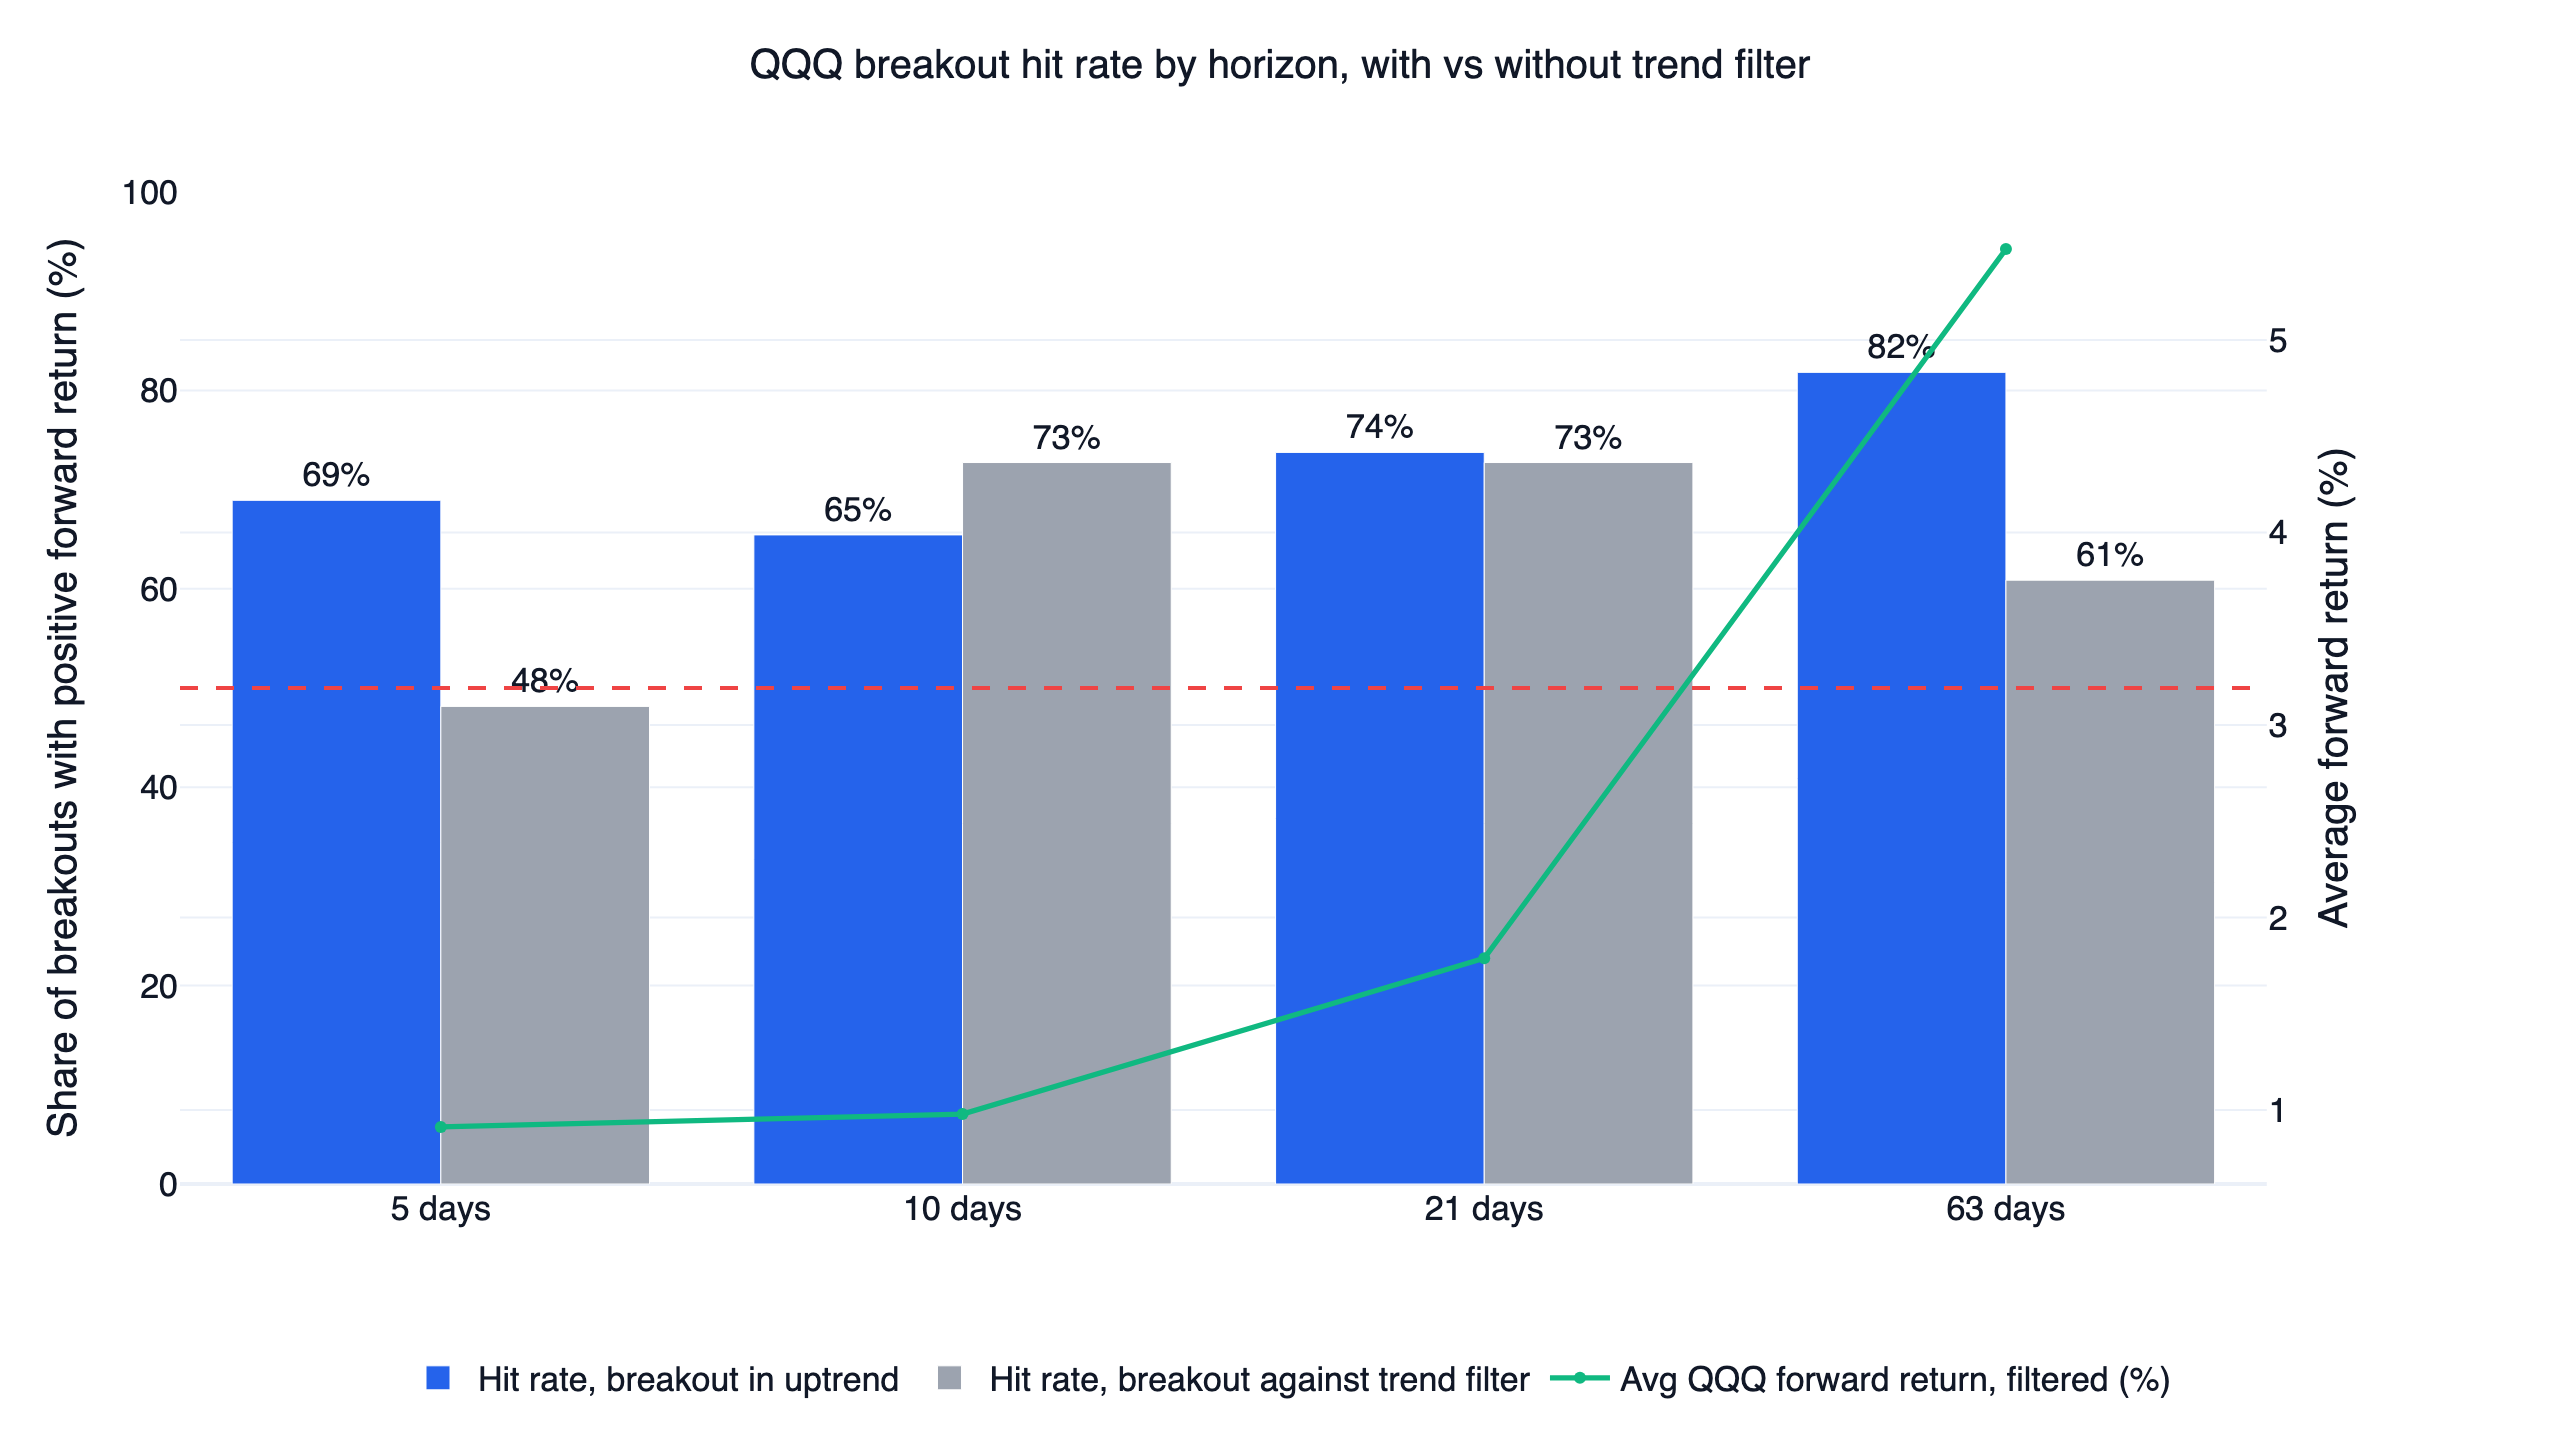
A breakout trend following strategy backtest has to answer one question: when QQQ closes at a fresh high, does the move follow through often enough to pay for the times it doesn't? Over June 2016 to June 2026, finlab data says yes, with a condition that decides everything: the breakout only carries information when the broader trend agrees. Filtered breakouts were positive 82% of the time three months later; breakouts against the trend, only 61%.
The tradable version of that signal earned a 37.2% CAGR with a -28.3% maximum drawdown, against 20.6% and -35.6% for buying and holding QQQ. Two caveats belong up front. First, like the rest of the strategy family this one belongs to, it does not hold QQQ itself: in risk-on it holds two leveraged growth ETFs, and in risk-off it rotates to treasuries, gold, or a cash-like fund. Second, its full-period monthly Sharpe of 1.19 is the weakest of the ten systems in the US quant trading strategies overview. This is a drawdown-control strategy whose risk-adjusted case rests on its monthly Sortino of 2.94 and on the out-of-sample period, where the Sharpe rose to 1.73. That research/out-of-sample asymmetry is the defining fact of this system: trend rules look ordinary in choppy markets and earn their keep when a sustained move finally arrives.
The numbers at a glance
| Metric | This strategy | QQQ (buy & hold) | SPY (buy & hold) | TQQQ (naive buy & hold) |
|---|---|---|---|---|
| CAGR | 37.2% | 20.6% | 13.4% | 42.8% |
| Monthly Sharpe | 1.19 | 1.11 | 0.90 | 0.92 |
| Monthly Sortino | 2.94 | 1.75 | 1.27 | 1.53 |
| Max drawdown | -28.3% | -35.6% | -34.1% | -81.8% |
| Annualized volatility | 25.3% | 22.4% | 18.0% | 66.2% |
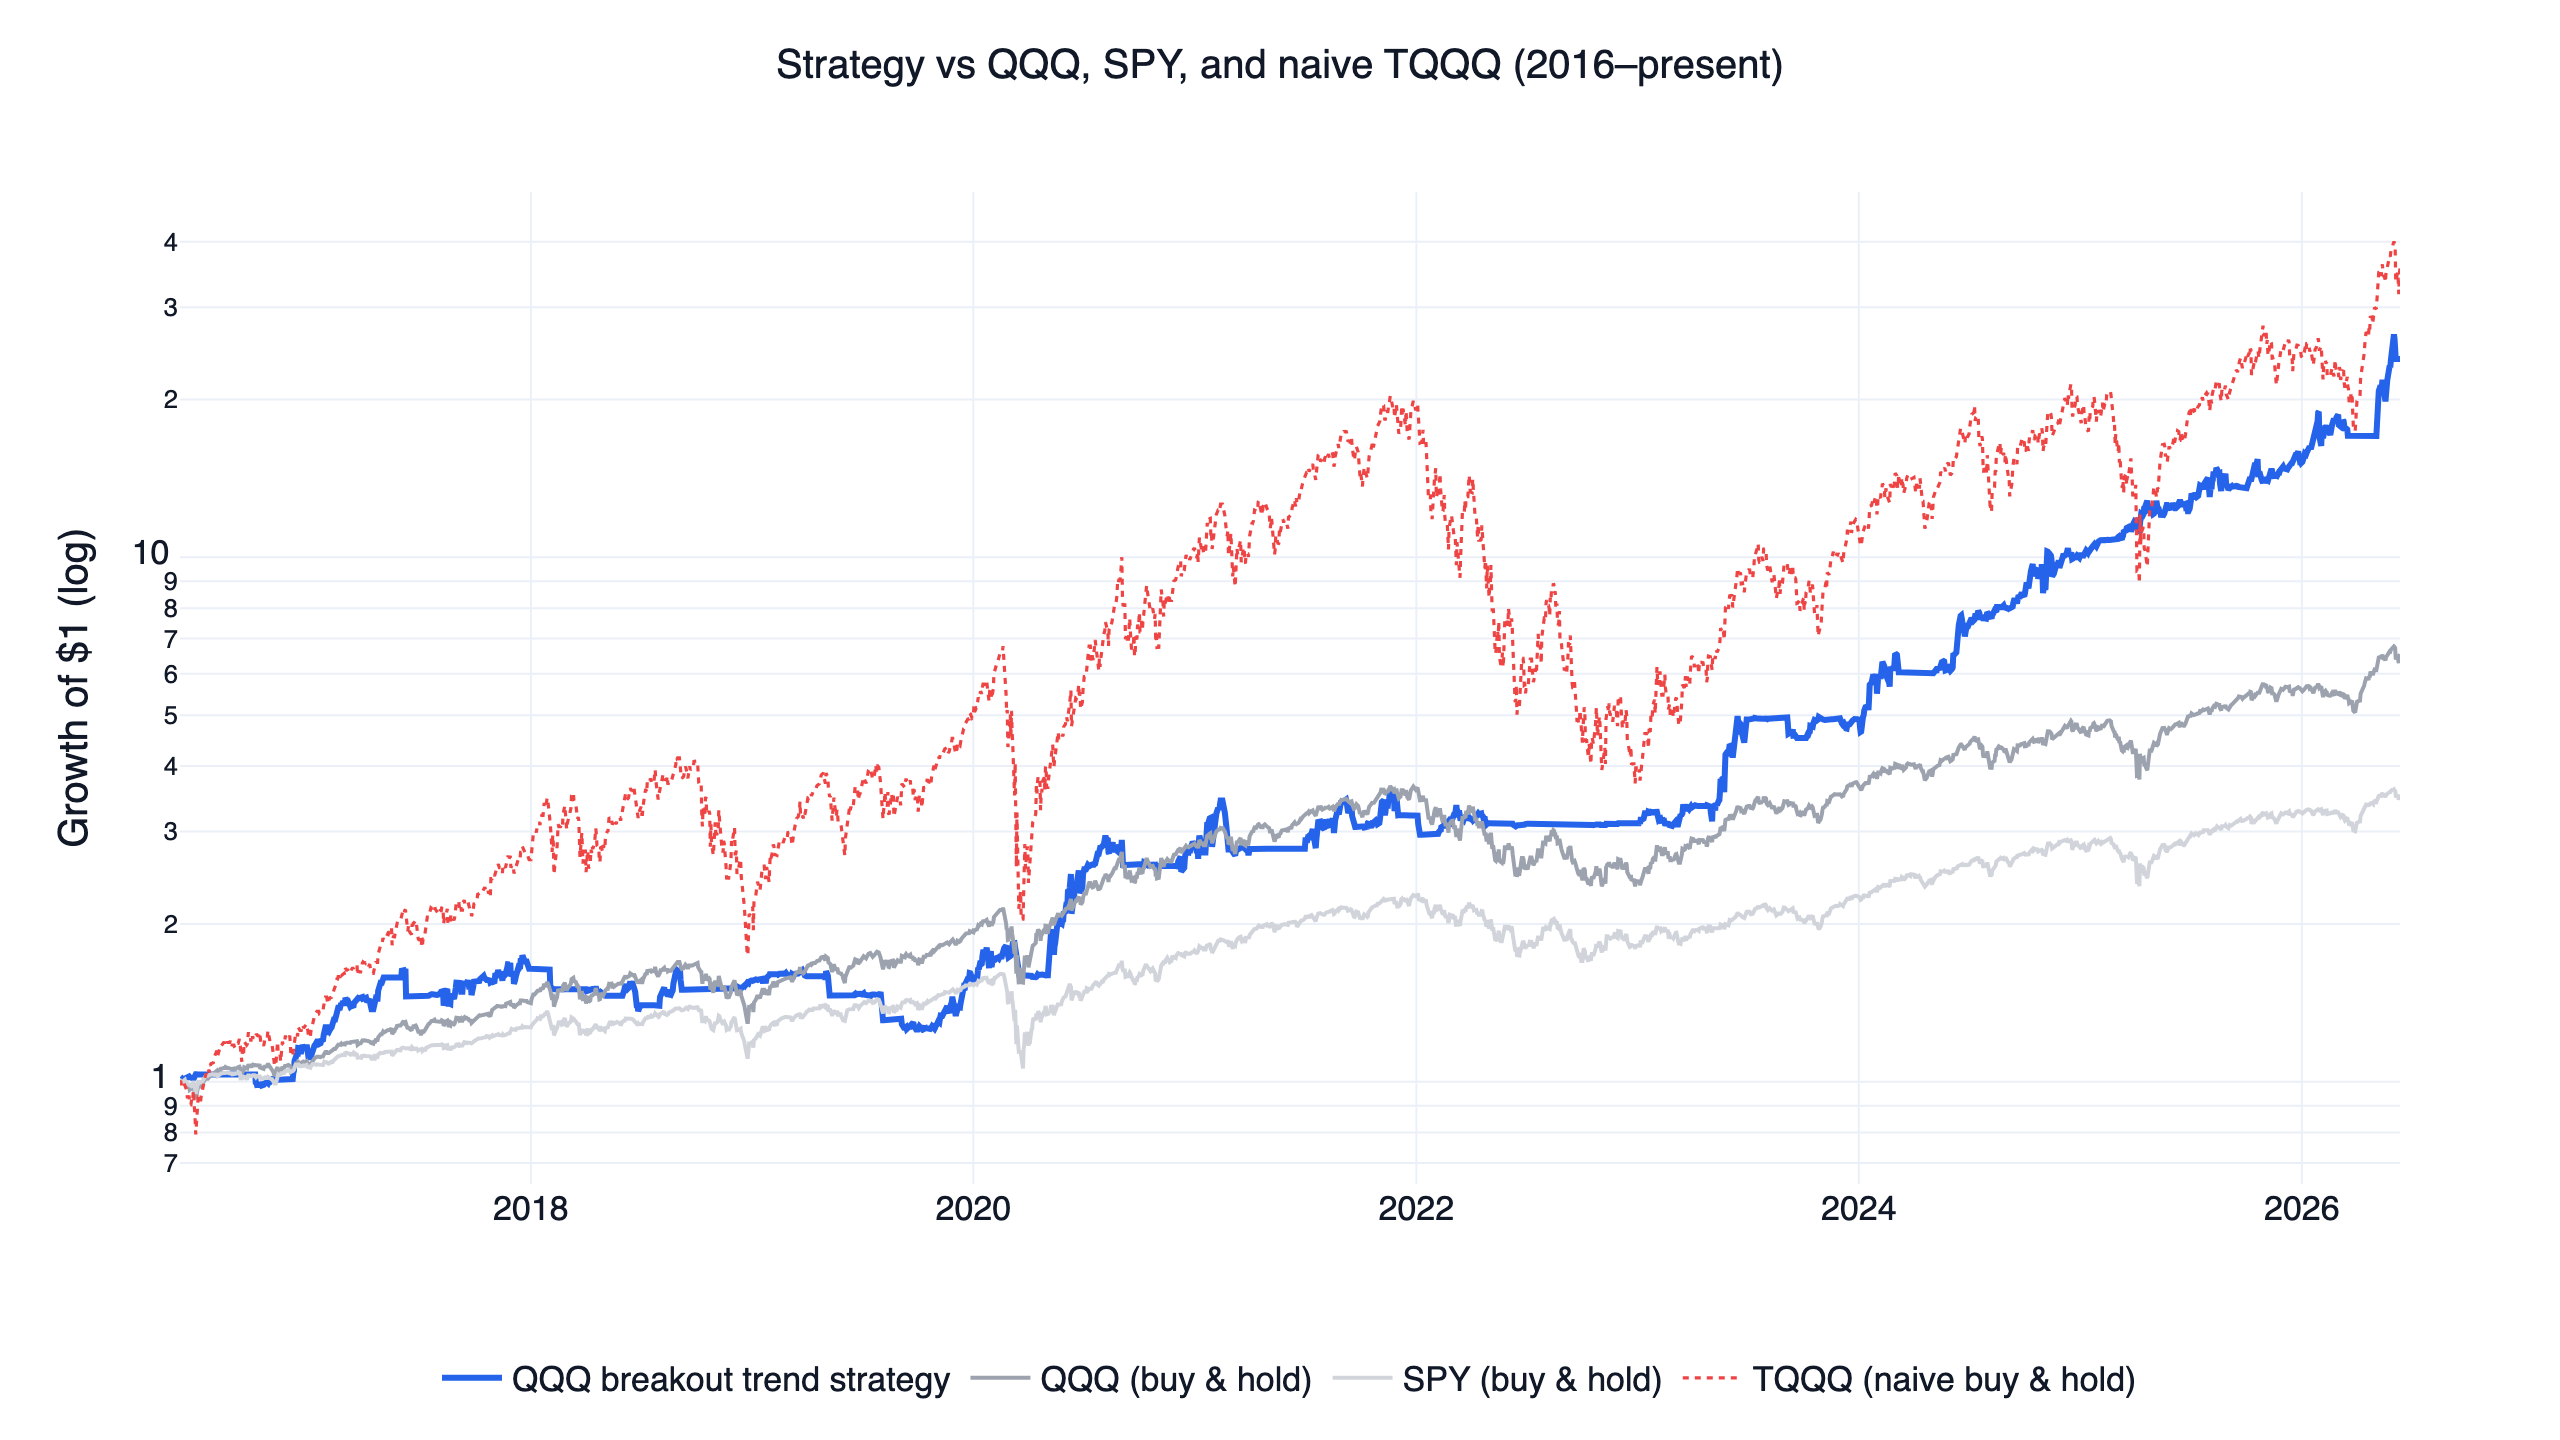
Growth of 23.9 for the strategy, 3.5 for SPY, and $35.6 for naive TQQQ — but the naive 3x path includes an -81.8% drawdown that almost no one holds through. On raw Sharpe the strategy only edges out QQQ (1.19 vs 1.11); the gap opens on downside-adjusted measures (Sortino 2.94 vs 1.75) and on the worst loss, because the signal spends bear markets out of leveraged exposure entirely. Benchmarks use total-return (dividend-adjusted) prices over the identical window.
What counts as a breakout here
The whole signal lives on one series: QQQ's dividend-adjusted daily close. Risk-on requires three conditions at once:
| Condition | Rule | Role |
|---|---|---|
| Breakout trigger | QQQ closes above its prior 21-day high; the trigger stays active for 5 sessions | Entry timing — fresh strength, recent enough for a monthly rebalance to catch |
| Trend | QQQ above its 200-day moving average | Regime filter — no leverage below the long-term trend |
| Momentum | QQQ's 126-day return is positive | Confirmation — the medium-term path points up |
Each leg has its own evidence base. Buying near highs sounds uncomfortable, but the anchoring effect behind it — investors are slow to re-price stocks trading near their recent peak — is documented for the 52-week high by George & Hwang (2004). Simple trend rules such as moving-average and trading-range breakouts showed predictive power across a century of Dow data in Brock, Lakonishok & LeBaron (1992). And the momentum confirmation is an application of time-series momentum, the finding that an asset's own past 12-month return predicts its next-month return across nearly every liquid futures market, from Moskowitz, Ooi & Pedersen (2012).
One framing note: this is a single-asset timing strategy. Its sibling systems screen hundreds of stocks and can be validated with decile sorts and rank ICs; the momentum study shows that workflow in full. A QQQ breakout rule has no stock universe to sort, so the validation here is an event study of the breakouts themselves — which turns out to be the more interesting test anyway.
Copy this prompt to your AI agent
FinLab's setup path is now one prompt. Paste it into Codex app or Claude cowork, and the AI will read https://finlab.finance/en/setup, install the FinLab skill when needed, then run or modify the strategy in this article.
Show Code
Help me set up FinLab and build a breakout trend strategy: https://finlab.finance/en/setupThe setup page is https://finlab.finance/en/setup.
Does a fresh QQQ breakout carry information?
Since 2016 there were 617 days on which QQQ closed above its prior 21-day high. Most of those are continuation days inside an ongoing run, so the event study focuses on fresh breakouts — a breakout day with no breakout in the prior five sessions. That gives 112 events, of which 85 occurred while the trend filter (above the 200-day average, positive 126-day return) was satisfied and 27 occurred against it.
| Forward horizon | Breakouts inside the trend filter | Breakouts against the filter |
|---|---|---|
| 5 days | 68.9% positive (avg +0.9%) | 48.1% positive (avg +0.0%) |
| 10 days | 65.4% positive (avg +1.0%) | 72.7% positive (avg +0.4%) |
| 21 days | 73.8% positive (avg +1.8%) | 72.7% positive (avg +1.6%) |
| 63 days | 81.8% positive (avg +5.5%) | 60.9% positive (avg +2.7%) |
The filter is what makes breakouts tradable. Against the trend, a fresh breakout is a coin flip over the next week (48.1%) and decays over a quarter; inside the trend, the hit rate rises with the horizon, reaching 81.8% at 63 days with a +5.5% average forward return — the green line in the chart traces that average climbing across horizons. The 10-day row is the one place the comparison inverts, and it is a small-sample artifact: only 22 against-trend events have a full 10-day window, so a couple of lucky bounces flip the ranking. The 5-day and 63-day horizons, with more data behind them, show the filter's advantage cleanly. For reference, all 617 breakout days (fresh or not) were positive 69.2% of the time 21 days later, averaging +1.3%.
What a failed breakout costs
Failed QQQ breakouts that reverse quickly after a leveraged entry are this strategy's main risk, so they deserve their own chart: every trend-filtered fresh breakout since 2016, colored by whether QQQ was higher or lower 21 days later.
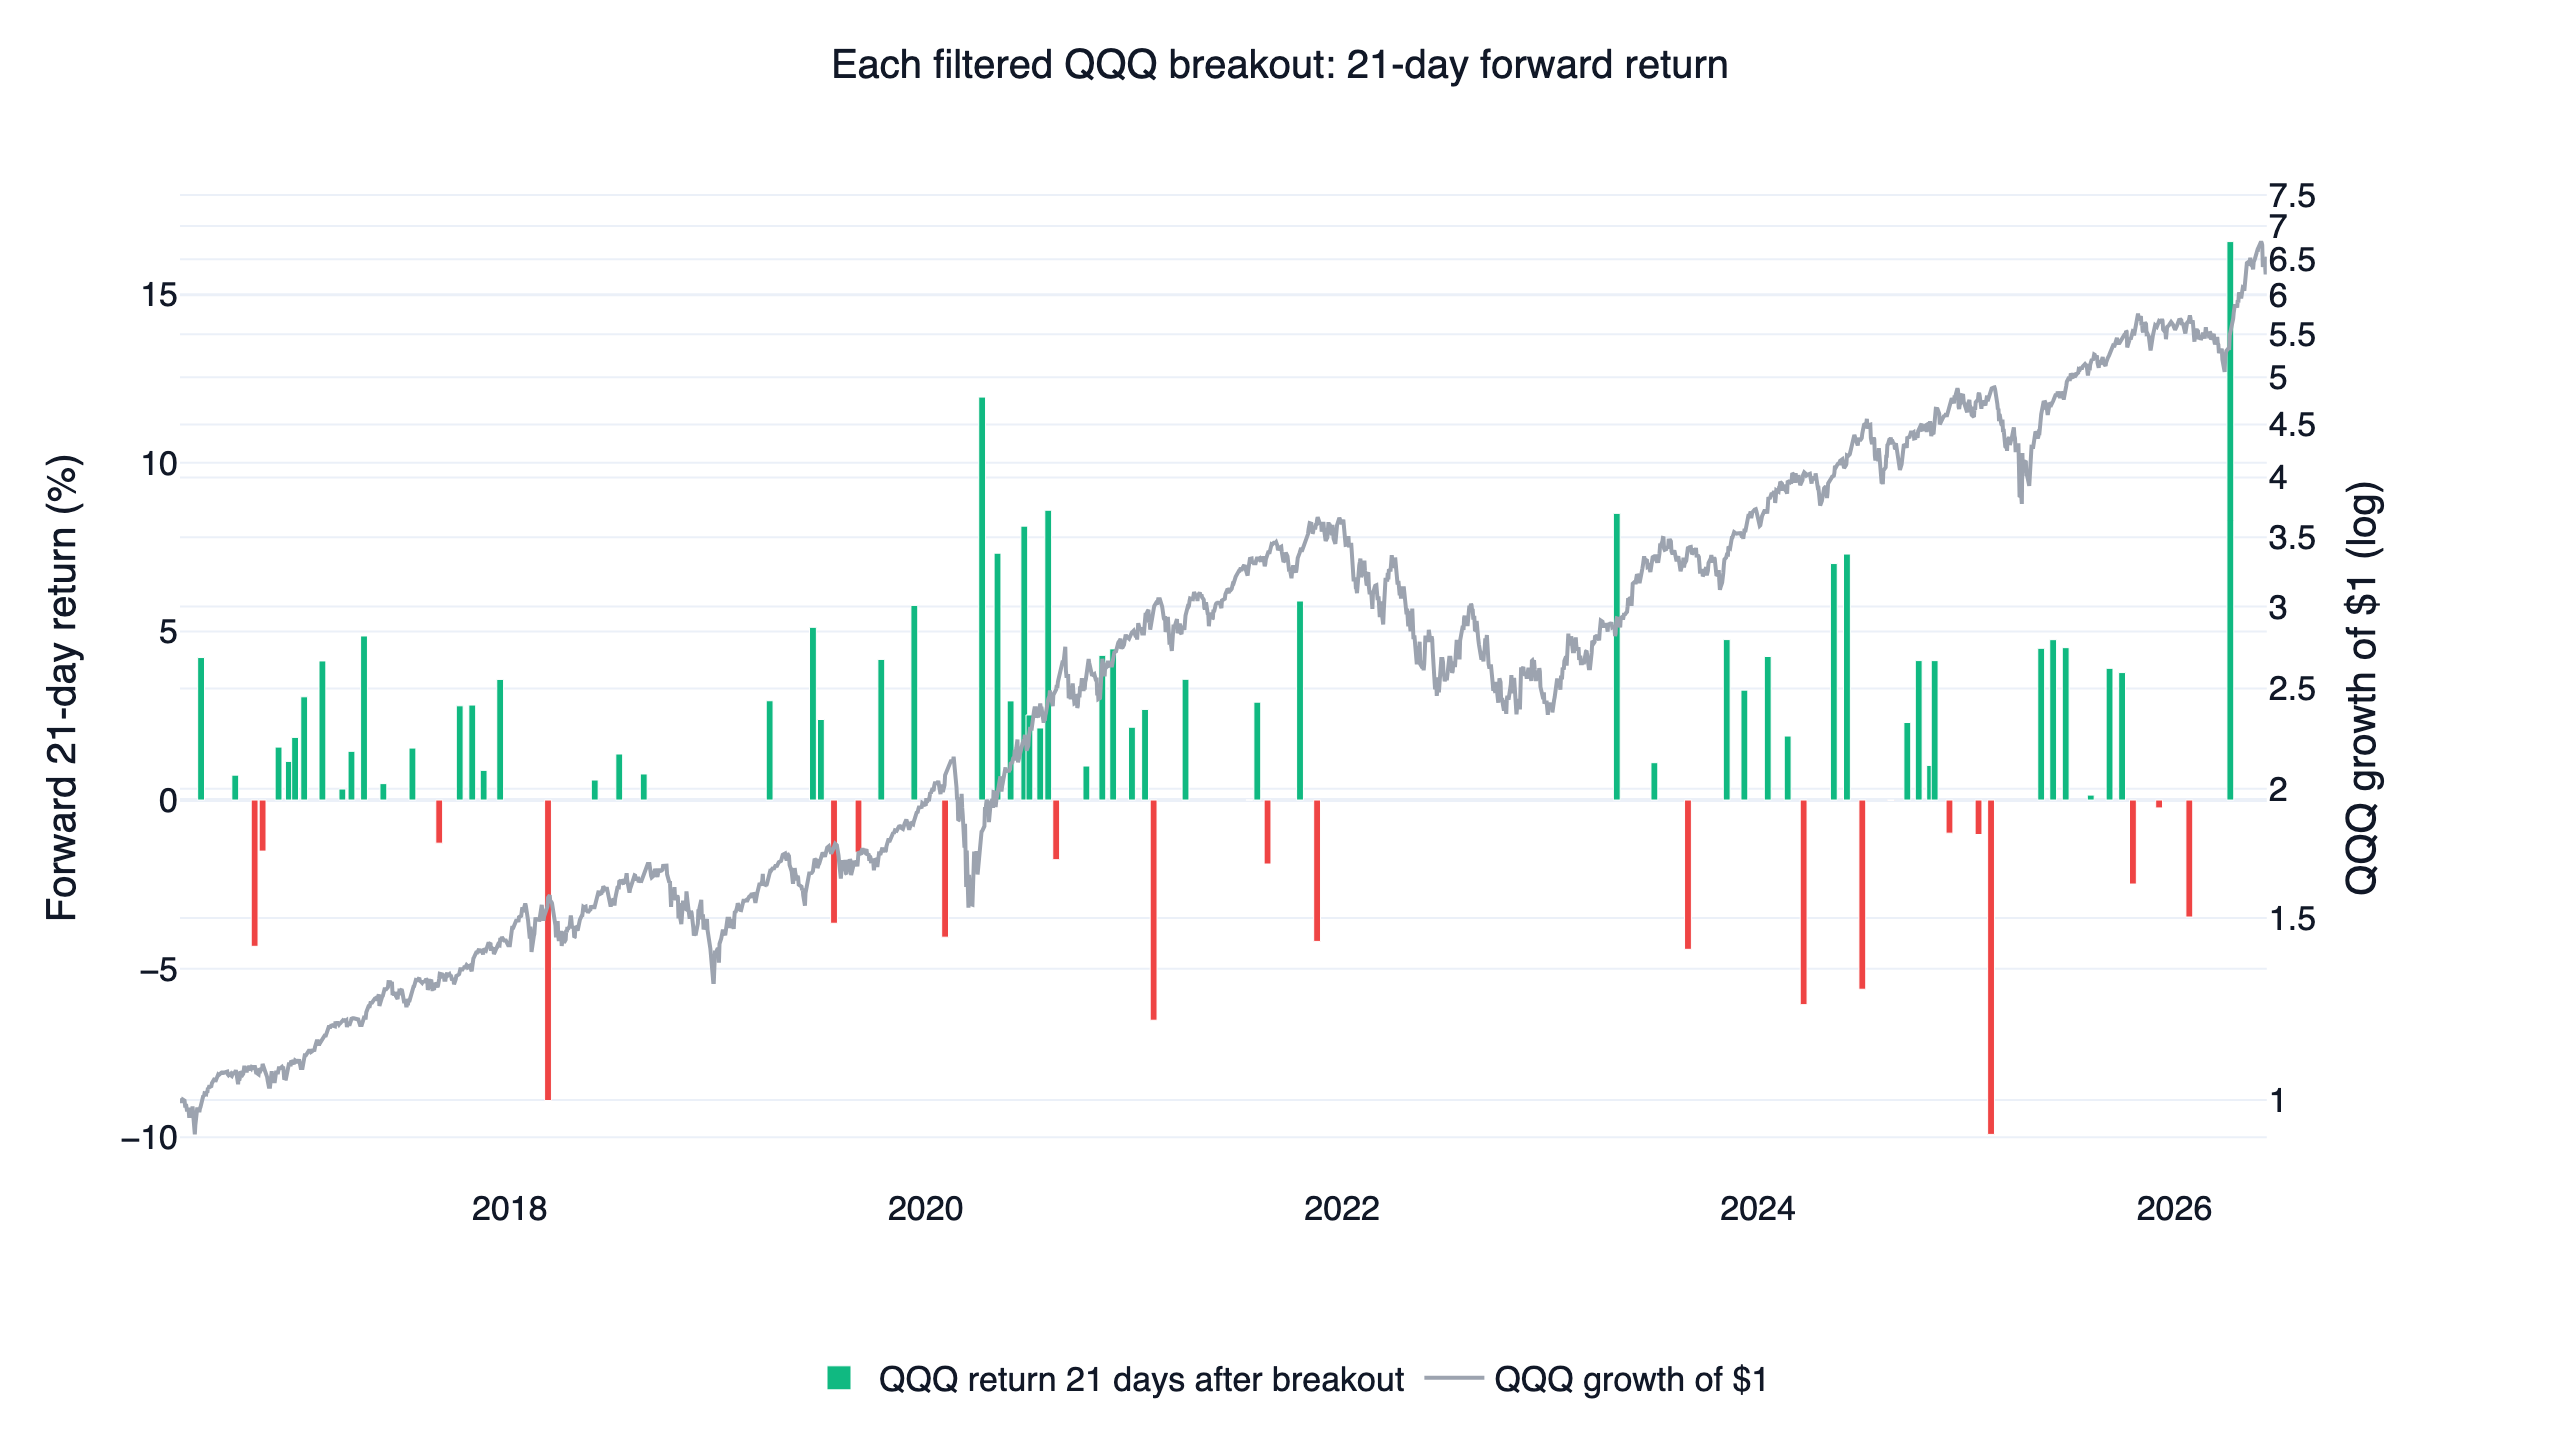
About 26% of filtered breakouts were underwater 21 days later, losing -3.5% on average in QQQ terms, with the worst single event at -9.9%. In a 3x product that average failure is roughly a -10% move before risk management reacts, which is why the strategy carries an 8% touched stop on every leg: across the full backtest, the worst completed trade lost exactly -8.0%. The red bars cluster just before drawdowns in the QQQ curve overlaid on the chart — failed breakouts are concentrated at tops, which is precisely when a trend follower is fully invested.
The trade-level ledger over the decade: 122 completed trades, a 67.2% win rate, +9.9% average winner against a -4.4% average loser, and a best trade of +72.7% (a leveraged-ETF hold through a sustained run). Splitting by instrument, the 72 leveraged-ETF trades averaged +7.4% each (66.7% winners, -6.3% average loss), while the 50 defensive trades averaged a quiet +2.0%. The pattern is classic trend following: modest hit rate, losers cut early, occasional very large winners doing most of the compounding.
A signal that is out of the market most of the time
The regime is choppy by construction. The breakout trigger expires after five sessions, so risk-on comes in short bursts: 245 separate risk-on spells over the decade, averaging just 4.1 trading days (median 3, longest 28), with risk-off gaps averaging 7.5 days between them. In total the signal was risk-on only 35.1% of all days.
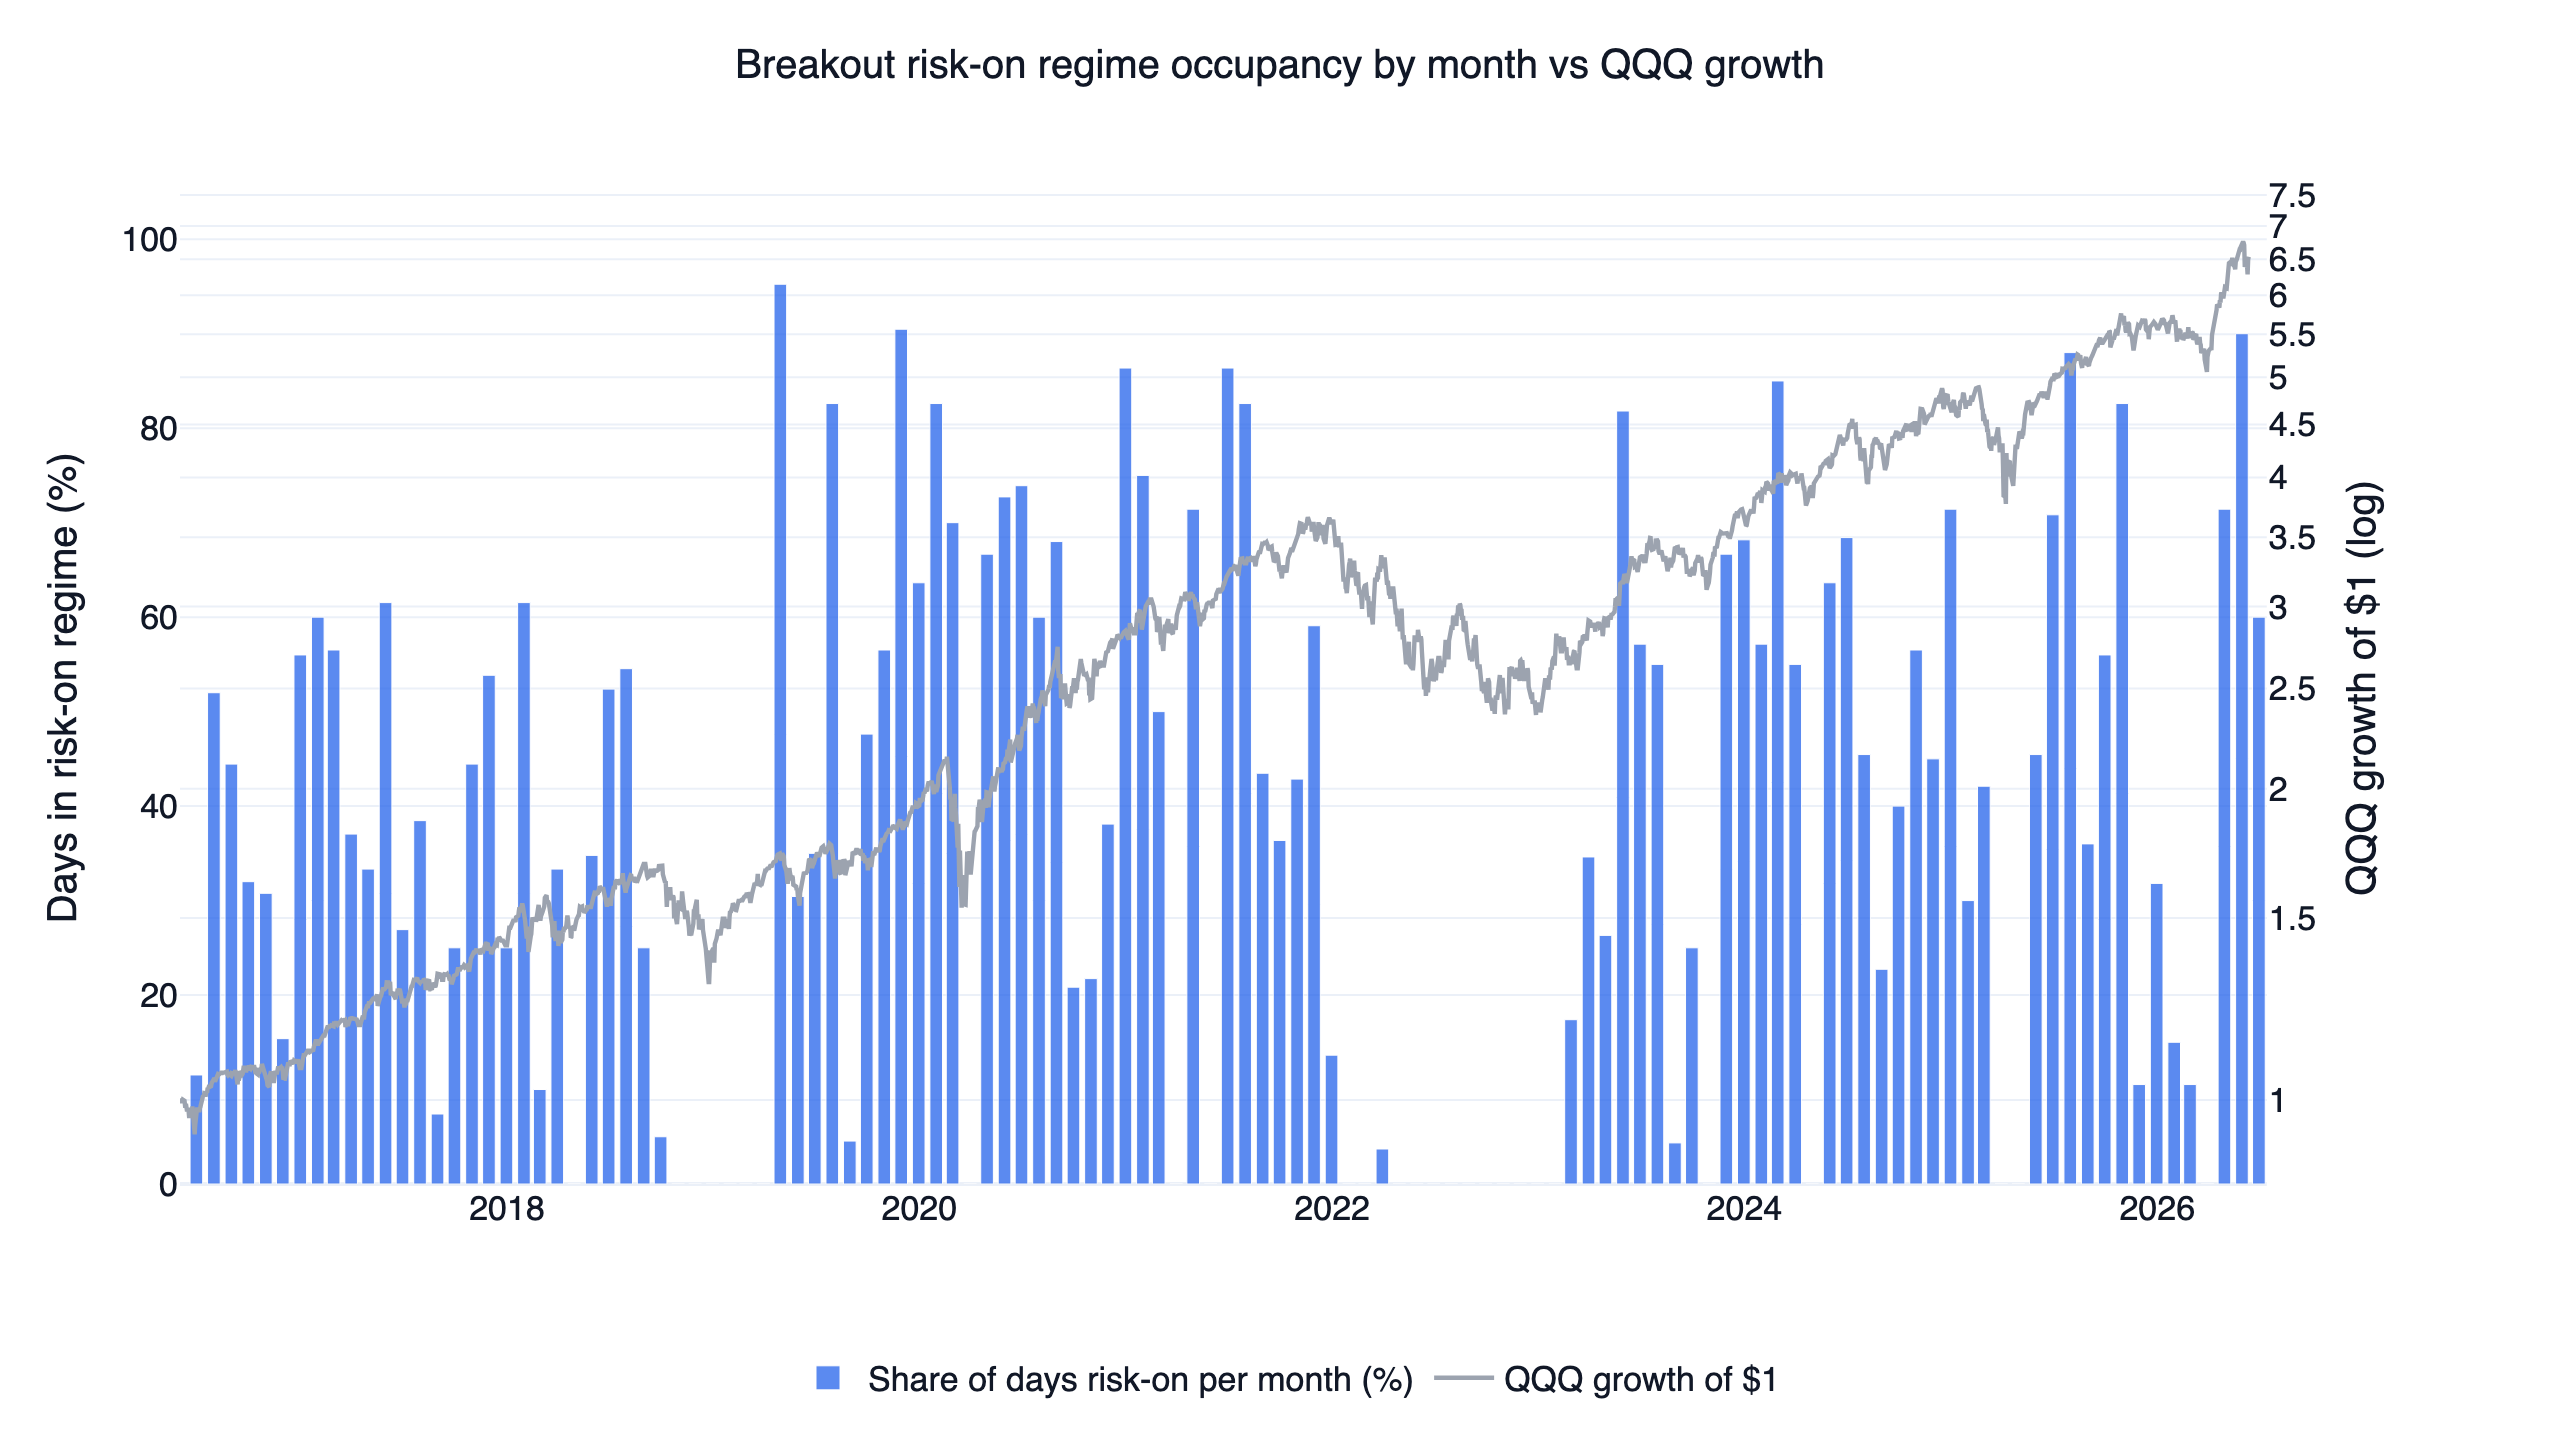
The chart plots the monthly share of risk-on days with QQQ's growth of $1 overlaid on a log axis, and the standout feature is the near-empty band across 2022: the signal was active on 0.3% of trading days that year, sitting out essentially the entire bear market. Compare 2020 (55.0% occupancy, riding the post-crash recovery) and 2024 (50.4%). Because the executed position rebalances monthly around that signal, the portfolio held leveraged ETFs on 36.4% of days and defensive ETFs on 52.1% — and within the defensive sleeve, gold (GLD) was the workhorse at 33.9% of all days, ahead of short treasuries (SHY, 13.2%) and intermediate treasuries (IEF, 5.0%). The remaining days sit in cash around transitions. Holding a defensive asset rather than nothing matters: the 50 defensive trades in the ledger above averaged +2.0% each, a quiet tailwind across half the calendar.
The signal in readable finlab code
The core logic fits on one screen. This is the on-page version; the full position construction and sim() call are in the downloadable script at the end.
Show Code
import finlab
from finlab import data
from finlab.backtest import sim

finlab.login()  # finlab walks you through login automatically

# The entire signal lives on the ETF market
data.set_market("us_fund")
close = data.get("us_fund_price:adj_close")[["QQQ", "TQQQ", "TECL", "IEF", "GLD", "SHY"]]
qqq = close["QQQ"]

# 1. Trend context: above the 200-day average, positive 126-day momentum
trend = qqq > qqq.rolling(200, min_periods=100).mean()
momentum = qqq / qqq.shift(126) - 1

# 2. Breakout trigger: a close above the prior 21-day high,
#    kept active for 5 sessions so the monthly rebalance can catch it
breakout = qqq > qqq.shift(1).rolling(21, min_periods=10).max()
breakout_active = breakout.rolling(5, min_periods=1).max().astype(bool)

# 3. Risk-on only when all three agree
risk_on = trend & (momentum > 0) & breakout_active

# 4. Risk-on: hold the 2 strongest of TQQQ/TECL by 126-day return, 50% each.
#    Risk-off: hold 1 of IEF/GLD/SHY by 63-day-minus-21-day momentum.
#    (selection, weighting, and the sim() call are in strategy.py below)
The execution layer — leveraged ETFs in risk-on, one defensive ETF in risk-off, monthly rebalance, 8% touched stop — is shared with nine related systems and is explained once, in detail, in the overview of the full strategy family. The short version: the signal decides when leveraged growth exposure is acceptable; the engine decides what to hold and how to cut losers. Everything distinctive about this strategy is in the three conditions above.
Results, out of sample: where a trend strategy earns its keep
Here is the interactive finlab report — equity curve, drawdowns, monthly returns, and the full trade list — so you can inspect the result directly rather than trust a summary:
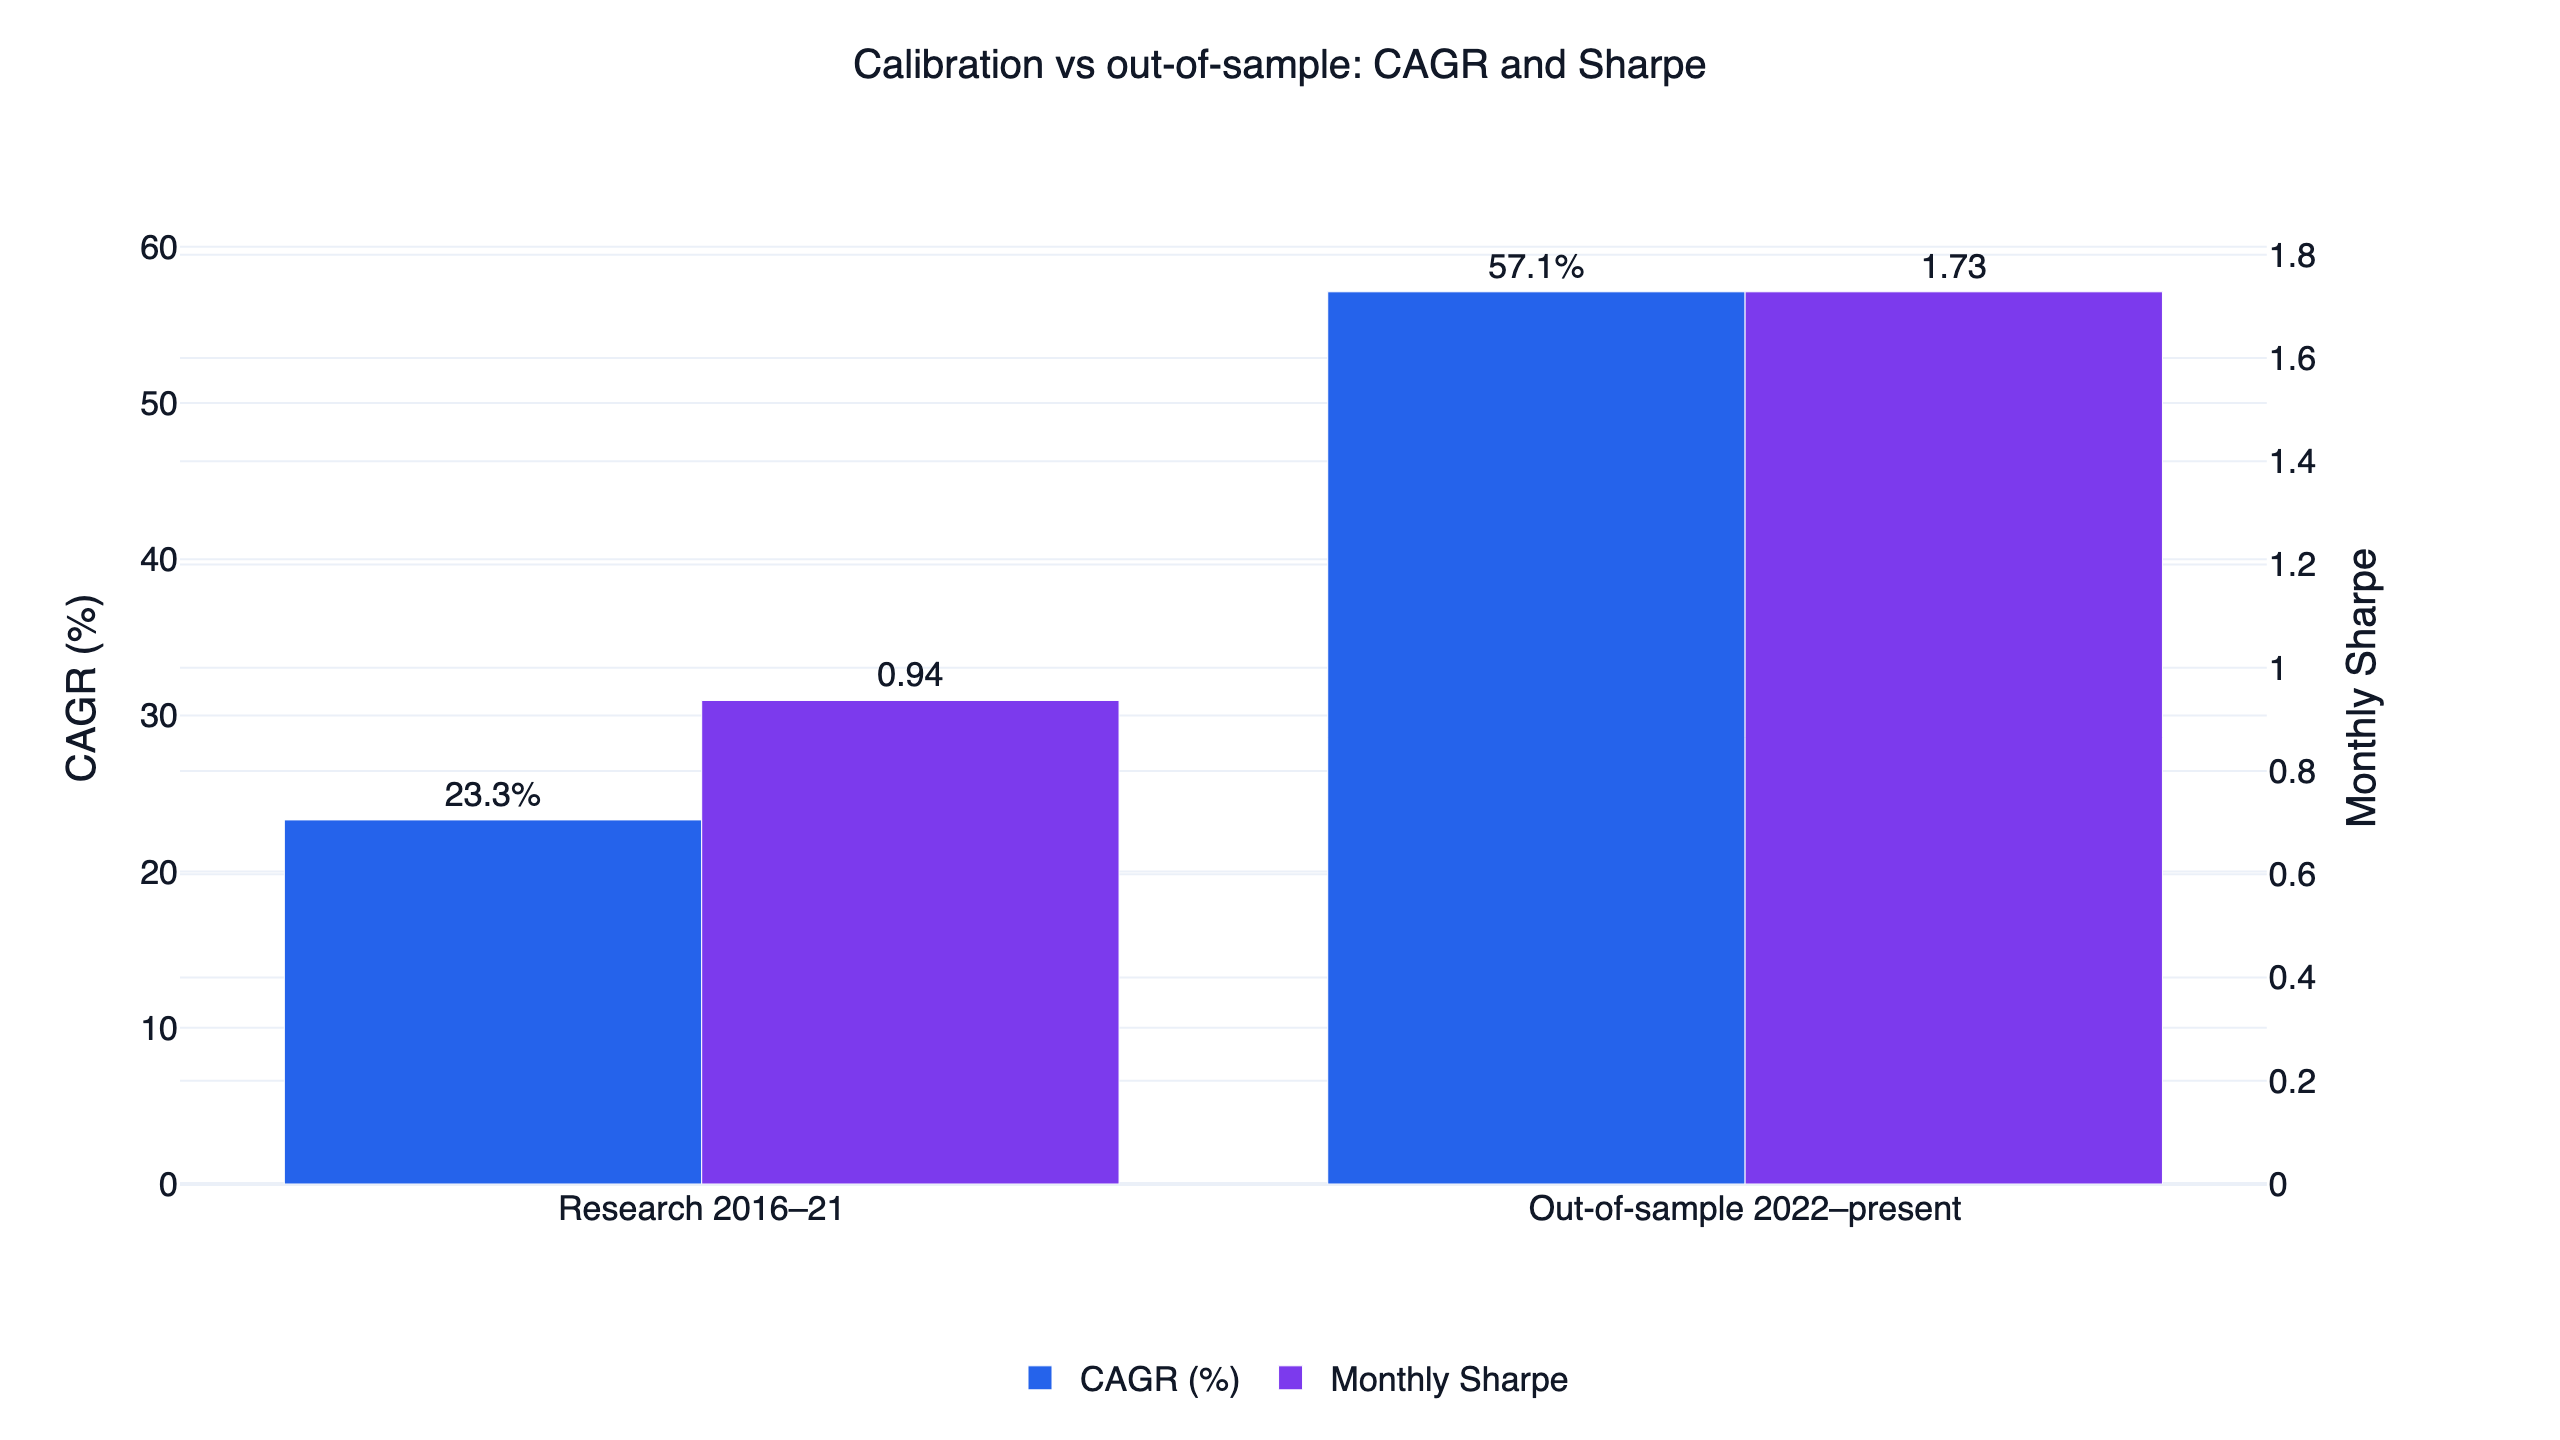
The parameters were chosen on 2016-2021 data and left untouched on 2022-present. For most strategies that split is a robustness checkbox. For this one it is the headline result, because the two periods disagree so sharply:
| Period | CAGR | Monthly Sharpe | Monthly Sortino | Max drawdown |
|---|---|---|---|---|
| Research (2016-2021) | 23.3% | 0.94 | 1.88 | -28.3% |
| Out-of-sample (2022-present) | 57.1% | 1.73 | 5.14 | -13.9% |
The unseen period was better on every measure — higher CAGR, nearly double the Sharpe, half the drawdown. That is unusual, and the mechanism is worth being precise about rather than celebrating. The 2016-2021 stretch was full of sharp, short shocks (late 2018, March 2020) and choppy ranges that whipsawed the 5-day breakout trigger: trend rules trade in and out, pay the failed-breakout cost repeatedly, and look mediocre — a 0.94 monthly Sharpe for those six years. The 2022-present stretch is the opposite regime: one long bear market the signal sat out almost entirely, then a sustained 2023-2024 uptrend it stayed engaged with. Time-series momentum behaves exactly this way in the Moskowitz, Ooi & Pedersen (2012) evidence: payoffs concentrate in extended trends and in avoided crashes, while range-bound markets bleed. A fair reading of this backtest is that the out-of-sample decade-half happened to serve trend following its ideal menu. The next choppy multi-year range would push results back toward the 2016-2021 experience.
On the risk-adjusted bar this strategy family is measured against — at least 1.5 on one Sharpe or Sortino ratio — the full-period monthly Sharpe of 1.19 does not clear it. The strategy passes on its full-period monthly Sortino of 2.94, its out-of-sample monthly Sharpe of 1.73, and its out-of-sample monthly Sortino of 5.14. Those are the numbers to size positions by, with the understanding that the Sortino gap (2.94 vs a 1.19 Sharpe) reflects volatility that is mostly upside: the strategy's 25.3% annualized volatility is concentrated in the leveraged risk-on bursts, while the stop and the regime filter truncate the left tail.
The drawdown profile shows the same asymmetry:
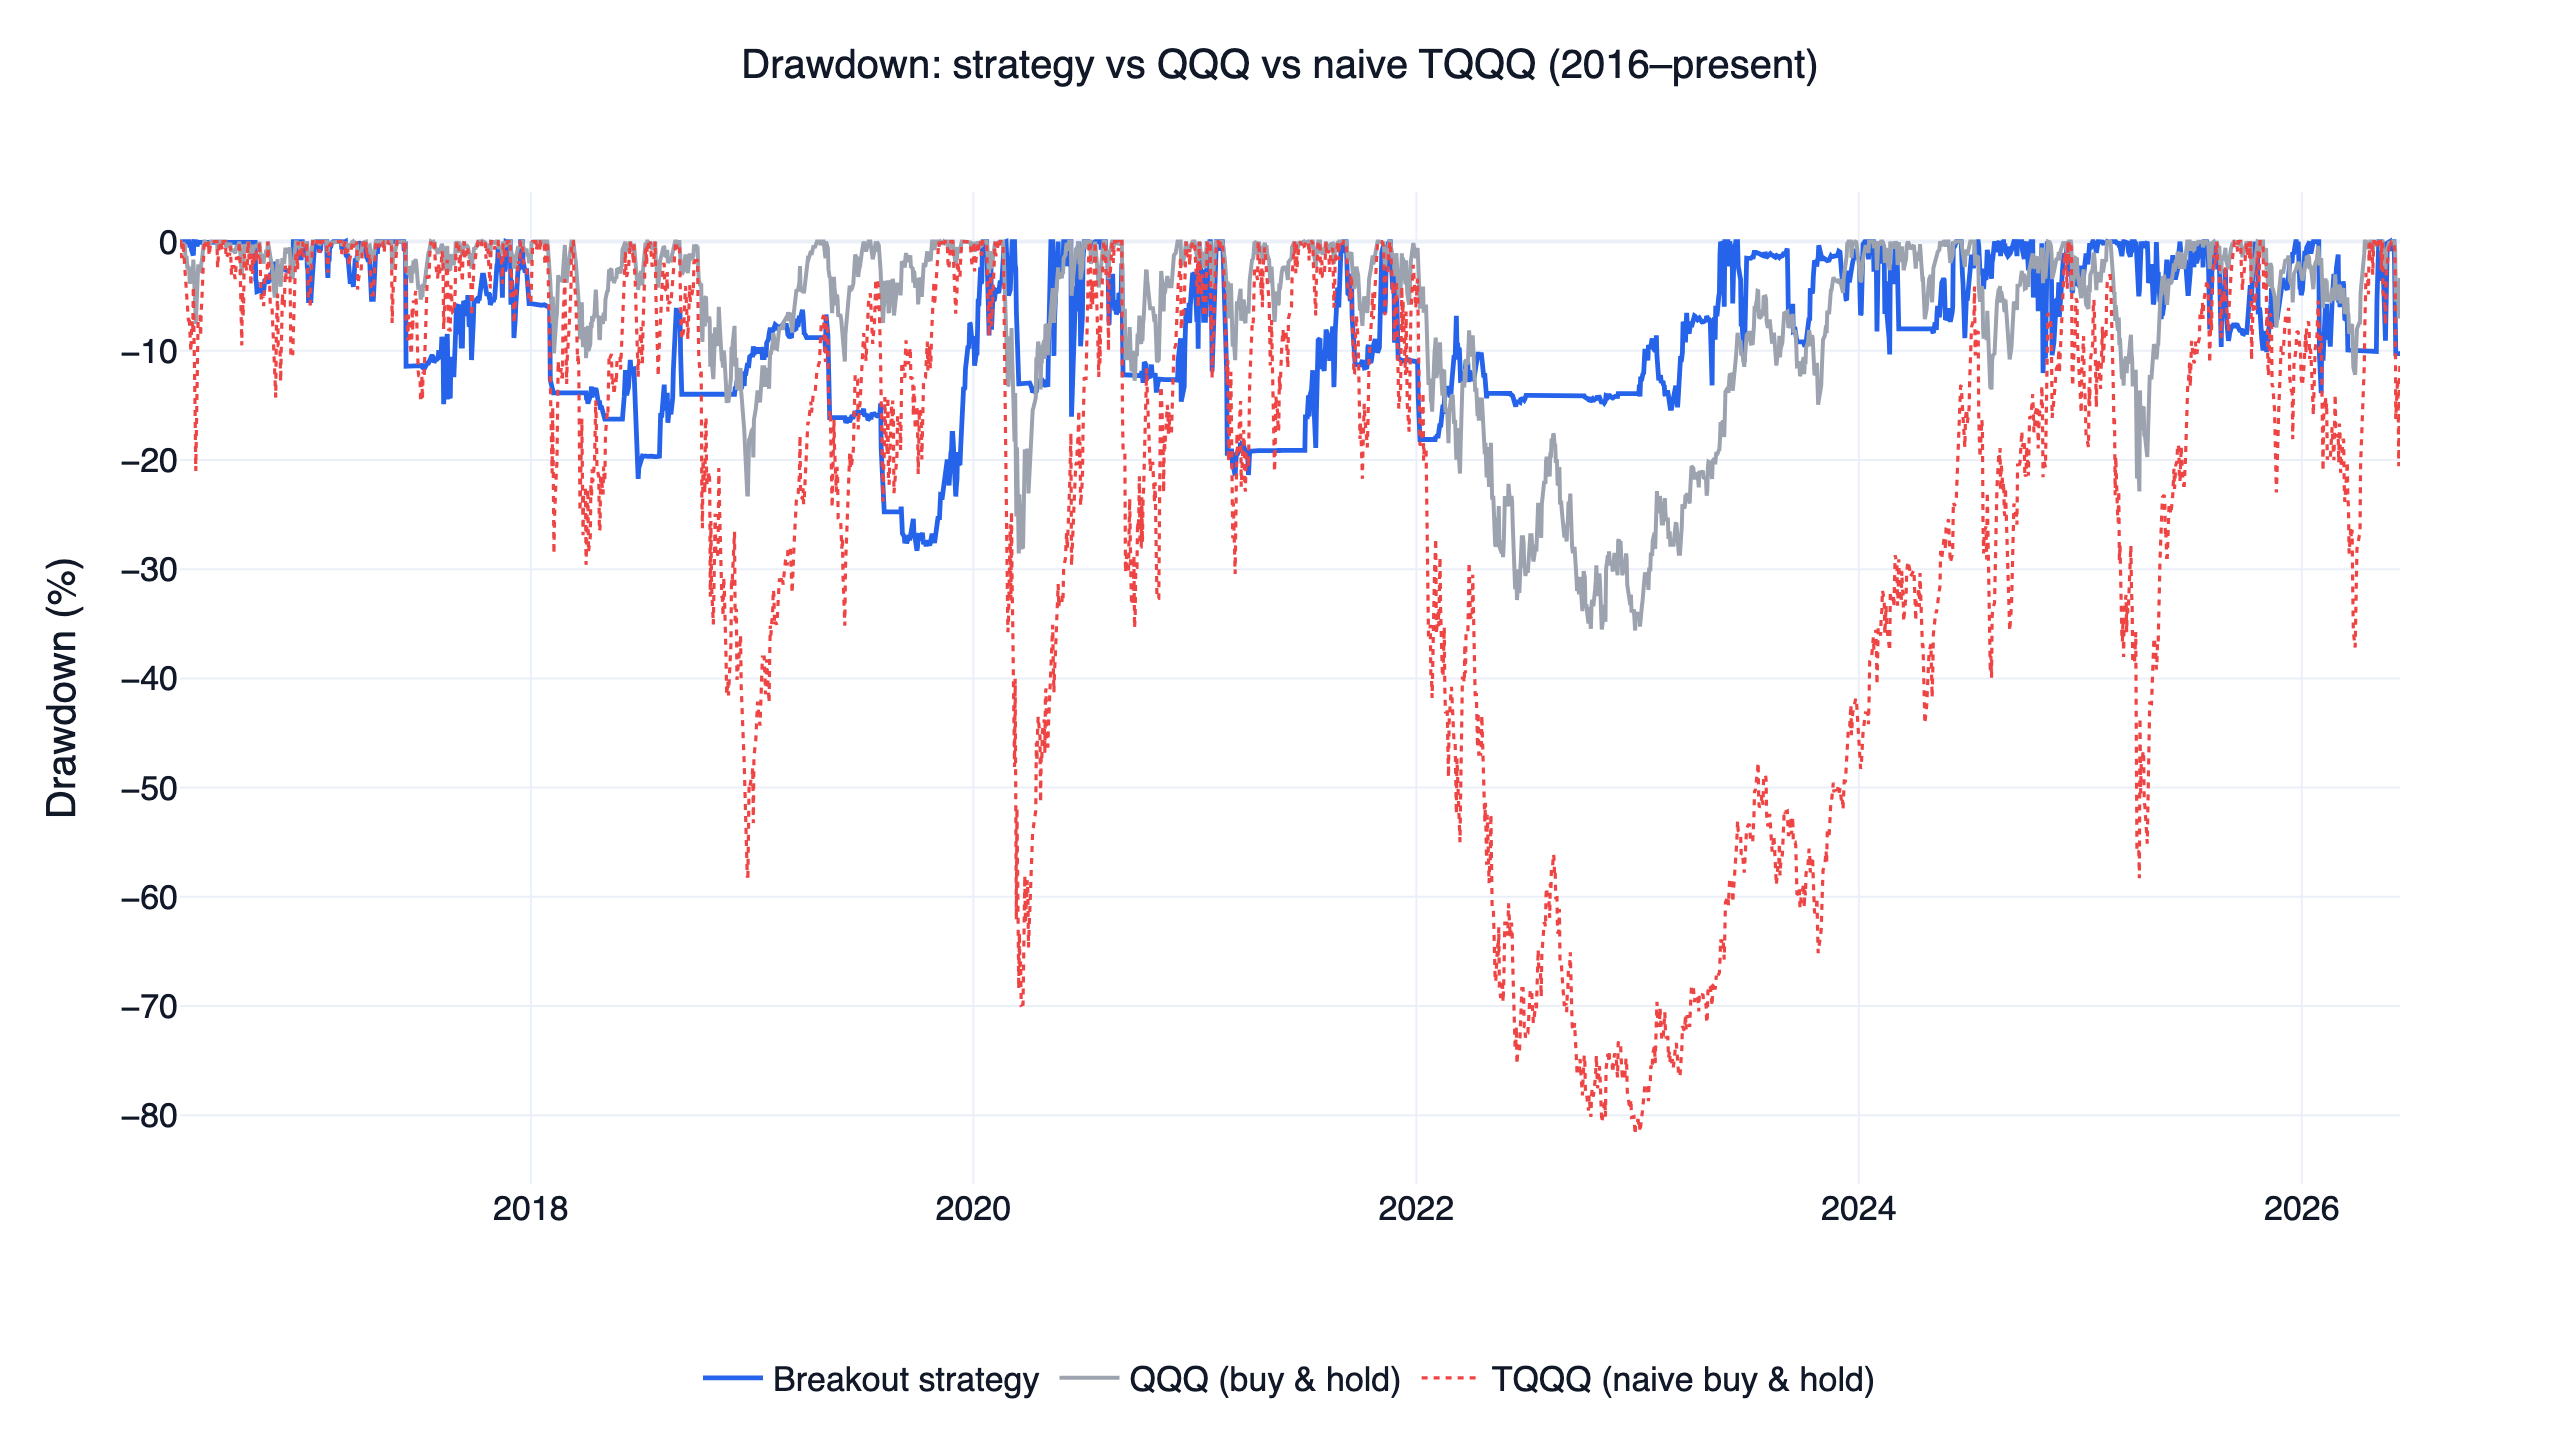
The strategy's worst loss, -28.3%, came in the choppy research years; out of sample it never lost more than -13.9% while QQQ fell -35.6% peak to trough and naive TQQQ fell -81.8%. Drawdown control in hostile regimes, rather than headline Sharpe, is what this signal is for.
Backtest method and limits
| Item | This backtest |
|---|---|
| Window | 2016-06-01 to 2026-06-12. The curve starts in June 2016 because the 126-day momentum lookback needs warm-up after the data start; all benchmarks are rebased to the same date. |
| Transaction costs | Not modeled (zero commission and slippage, consistent with the rest of the family). At roughly 5.7x annual turnover this matters more than for slower siblings: ETF spreads and commissions would shave live returns below these figures. |
| Leverage decay | Already reflected — the TQQQ/TECL price series include daily-reset drag and expense ratios. |
| Instruments | A fixed ETF set (QQQ signal; TQQQ/TECL risk; IEF/GLD/SHY defense). No stock universe, so no cross-sectional validation is possible; the event study above is the signal evidence. |
| Position rule | 2 leveraged ETFs at 50% each in risk-on; 1 defensive ETF in risk-off; monthly rebalance; 8% touched stop per leg. |
| Turnover / trades | About 5.7x per year; 147 trade events in the simulator, 122 of them completed round trips. |
| Sample | 2016-2021 calibration; 2022-present out-of-sample. One cycle of each regime type — not many independent observations. |
| Capacity | Not estimated. The ETFs are liquid, but real impact depends on your size. |
The leveraged-ETF risk you must understand
- Daily reset and path dependency. A 3x daily ETF compounds daily, so a choppy, sideways market erodes value even when the index ends flat. The naive TQQQ column (-81.8% drawdown) is what unmanaged 3x exposure looks like, and this strategy's frequent in-and-out regime means it repeatedly re-enters 3x products near local highs.
- Failed breakouts reverse fast. The named main risk of this system: about 26% of filtered breakouts are down 21 days later, averaging -3.5% in QQQ terms — roughly a triple of that in TQQQ before the 8% stop intervenes. Several failures in a row compound into the -28.3% worst case.
- Gaps can beat stops. The 8% stop is a touched level in the backtest; a large overnight gap can fill worse in live trading.
- Monthly switching is not crash protection. A fast crash inside a month is taken at full leverage until the stop or the next rebalance reacts.
- Concentration. One or two ETFs means single-theme (large-cap US growth) risk in risk-on, and a single defensive asset — often gold — in risk-off.
Who this is for
This fits an investor who wants a rules-based way to hold leveraged growth exposure only when trend, momentum, and fresh strength all agree, and who accepts that the strategy will look unremarkable, possibly worse than buy-and-hold, through choppy years in exchange for stepping aside in extended bear markets. It does not fit anyone who needs steady risk-adjusted returns every year, judges strategies on full-period Sharpe alone, or is uncomfortable holding 3x products at any time.
FAQ
Does a QQQ breakout strategy beat buy and hold? Over 2016-2026 this version compounded at 37.2% versus 20.6% for QQQ with a shallower worst drawdown (-28.3% vs -35.6%). On full-period monthly Sharpe the edge is thin (1.19 vs 1.11); the advantage is concentrated in downside measures (Sortino 2.94 vs 1.75) and in the out-of-sample years.
Why a 21-day high instead of the 52-week high from the academic literature? George & Hwang (2004) documented the anchoring effect at the 52-week high for individual stocks. A single-index timing rule needs to re-engage quickly after corrections, so it uses a shorter window and delegates the long-horizon judgment to the 200-day trend and 126-day momentum filters.
What happens when a breakout fails? On average, a failed filtered breakout costs -3.5% in QQQ terms over 21 days, about three times that in a 3x ETF. The 8% touched stop caps each leg; the worst completed trade in the backtest lost -8.0%.
How much of the time is it actually in the market? The signal is risk-on 35.1% of days, in 245 short spells averaging 4.1 days. The portfolio held leveraged ETFs on 36.4% of days and defensive ETFs (mostly gold) on 52.1%.
Can I run it without leverage? The same three-condition signal can be expressed in plain QQQ instead of TQQQ/TECL. This article only reports the leveraged version; ask your AI agent to re-run the downloadable script with unlevered tickers to see the difference.
What data do I need?
Only us_fund_price:adj_close — no single-stock data. It comes with a standard FinLab account.
Reproduce it yourself
Two files reproduce everything above:
- strategy.py — the full strategy, ready to run after the AI-assisted setup flow.
- data.csv — daily equity curves for the strategy, QQQ, and SPY.
The fastest path is to use the AI-assisted setup flow and ask it to vary the breakout window, the trigger persistence, or the trend filter and re-run the backtest. To see how this system compares with nine related ones — including why the stock-factor versions carry stronger validation — read the US quant trading strategies comparison, and for the cross-sectional counterpart to this time-series signal, the US momentum strategy study. Related research on the FinLab blog: the new-high momentum study (the Taiwan-market ancestor of this breakout idea), the AI quant research workflow, the PEG value strategy, the institutional-flow strategy, and the cash-flow quality strategy. Metric definitions are in the glossary; to see what teams build with finlab, browse the use cases and the team behind FinLab.
Last updated: 2026-06 | Backtest window: 2016-06 to 2026-06 | Benchmark: QQQ total return | Author: FinLab Quant Research (reviewed by a quantitative researcher)
Investing involves risk, and past performance does not represent future results. Leveraged ETFs carry additional risks including volatility decay and amplified losses. This content is for educational purposes only and is not investment advice and does not constitute investment advice; evaluate any strategy against your own risk tolerance.
FinLab AI
Want to build your own strategy?
Describe your stock-picking ideas in natural language. AI automatically validates, backtests, and gives you answers
Start Free