Low volatility investing has an awkward reputation: it sounds like a strategy for people who want to earn less in exchange for sleeping better. This backtest makes the opposite case with a specific mechanism. Over June 2016 to June 2026, a simple volatility-avoiding regime filter on QQQ, expressed through a single 2x leveraged index ETF, compounded at a 32.1% CAGR with a -22.2% maximum drawdown, versus 20.6% and -35.6% for buying and holding the Nasdaq-100 (QQQ) itself.
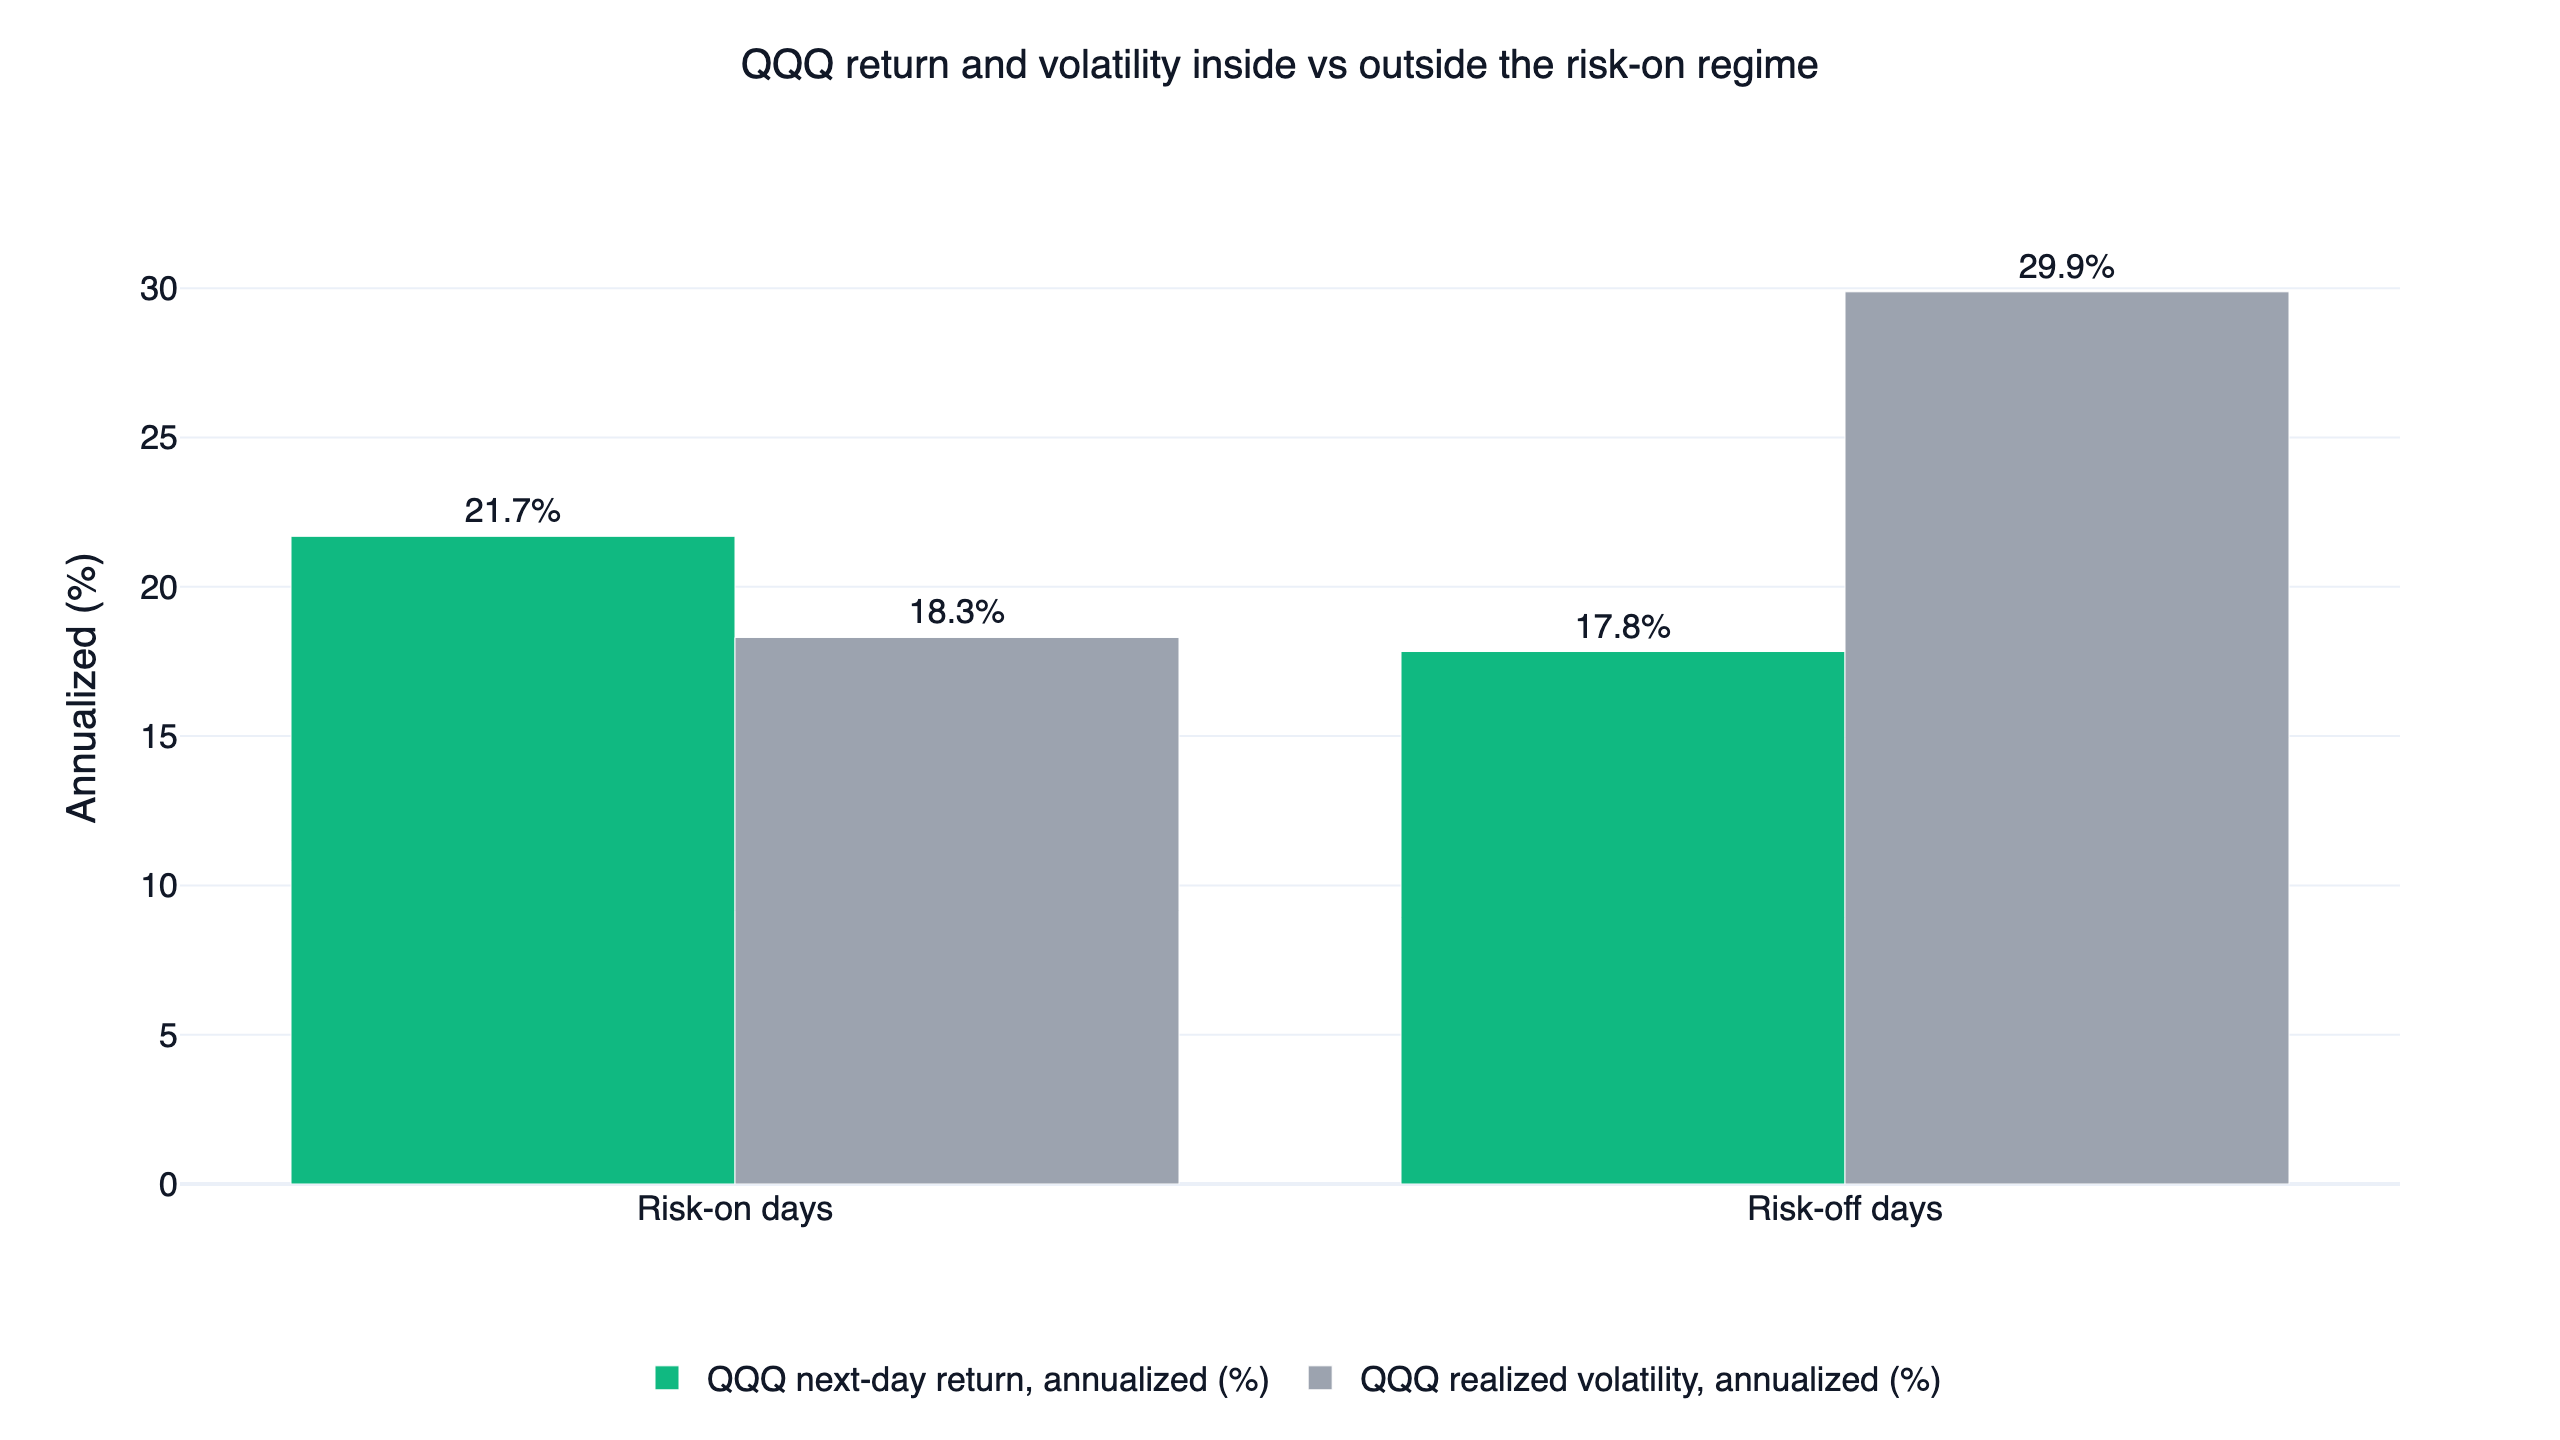
The interesting part is why it works, because the regime filter fails at the job most people assume it does. It does not predict market declines: QQQ's average forward return on risk-off days was still positive, and nearly as high as on risk-on days. What the filter actually predicts is volatility: 29.9% annualized on risk-off days versus 18.3% on risk-on days. Since the drag on a daily-reset leveraged ETF scales with variance, avoiding high-volatility stretches is precisely what lets 2x leverage compound instead of bleeding out. That mechanism is the subject of this article.
This strategy is one of ten US systems built on a shared leveraged-ETF execution model; the US quant trading strategies overview compares all ten and explains the shared engine in detail. Among the family it has the weakest headline statistics.
The numbers at a glance
| Metric | This strategy | QQQ (buy & hold) | SPY (buy & hold) | QLD 2x (naive) | TQQQ 3x (naive) |
|---|---|---|---|---|---|
| CAGR | 32.1% | 20.6% | 13.4% | 34.8% | 42.8% |
| Monthly Sharpe | 1.30 | 1.11 | 0.90 | 0.99 | 0.92 |
| Monthly Sortino | 3.54 | 1.75 | 1.27 | 1.61 | 1.53 |
| Max drawdown | -22.2% | -35.6% | -34.1% | -63.8% | -81.8% |
| Annualized volatility | 20.9% | 22.4% | 18.0% | 44.7% | 66.2% |
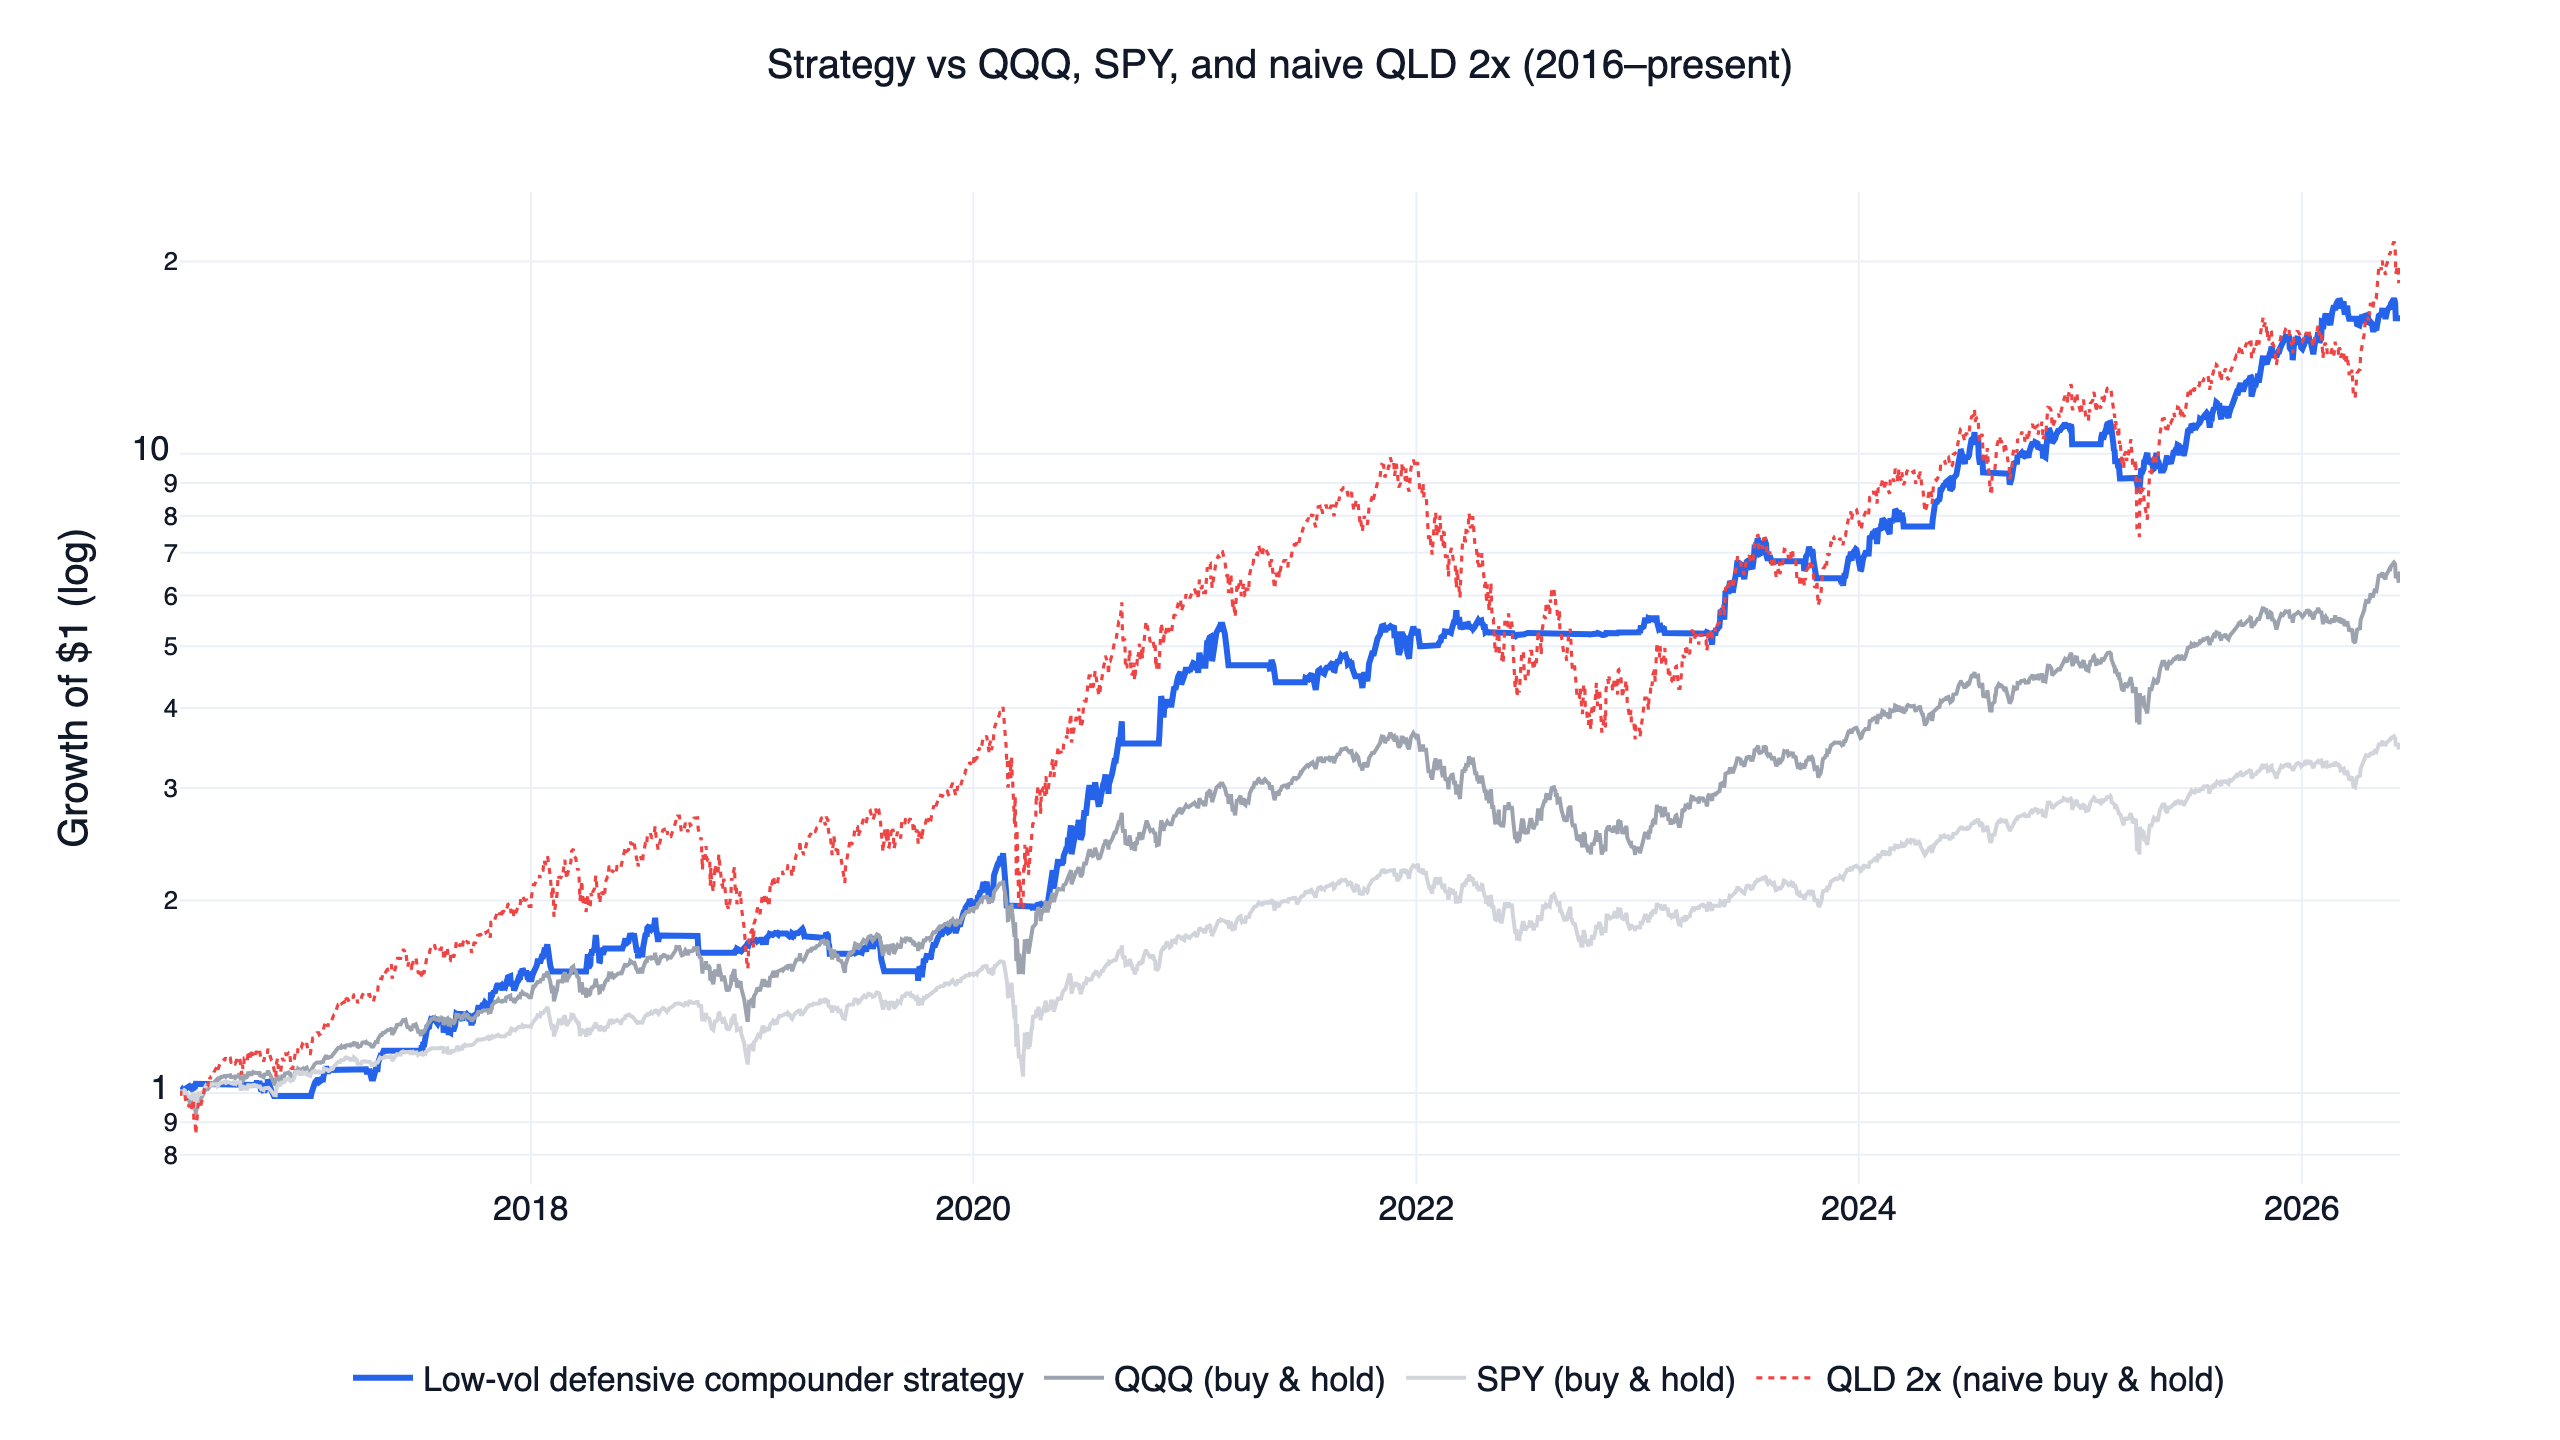
Read the QLD column first, because it is the fair fight. Holding the same 2x ETF the strategy uses, with no timing at all, earned a higher CAGR than the strategy: 34.8% versus 32.1%. On raw return, doing nothing won. What the regime filter bought was the risk column: a -22.2% worst loss instead of -63.8%, half the volatility, and a monthly Sharpe of 1.30 versus 0.99. A $1 investment grew to about 16x in the strategy against roughly 20x for naive QLD, and the chart above shows how the naive line gets there: through crashes that cut the account by more than half.
All benchmarks use total-return (dividend-adjusted) prices over the identical window, and the leveraged ETF series already embed daily-reset drag and expense ratios.
What the low-volatility anomaly says
The strategy leans on one of the most persistent findings in asset pricing: risk and return are not proportional the way textbooks suggest. Ang, Hodrick, Xing & Zhang (2006) documented that stocks with the highest volatility earn abnormally low future returns, and Baker, Bradley & Wurgler (2011) showed the low-volatility anomaly persisting for decades, attributing it partly to benchmark-constrained institutions that cannot exploit it. Frazzini & Pedersen (2014) formalized the same idea as "betting against beta": leverage-constrained investors overpay for volatile assets, so a portfolio that holds calmer exposures with leverage earns a premium over one that reaches for volatile assets directly.
That last formulation is the design of this strategy in one sentence: apply moderate (2x) leverage to broad index exposure, and only during the calm regimes where leverage is cheap to hold. The defensive-compounder label fits because the goal is the arithmetic of avoiding deep losses: a -22% drawdown needs +28% to recover, while QLD's -64% needs +177%.
Copy this prompt to your AI agent
FinLab's setup path is now one prompt. Paste it into Codex app or Claude cowork, and the AI will read https://finlab.finance/en/setup, install the FinLab skill when needed, then run or modify the strategy in this article.
Show Code
Help me set up FinLab and build a low-volatility strategy: https://finlab.finance/en/setupThe setup page is https://finlab.finance/en/setup.
Signal analysis: what the regime filter actually predicts
This is an ETF-timing strategy with no stock-selection universe underneath it, so there are no stock deciles or rank ICs to show; for a strategy in the family that does carry stock-level validation, see the US momentum strategy study. One disclosure belongs up front: the original version of this idea was a stock screen — a portfolio of low-volatility defensive compounders selected from the US universe — and it failed the family's quality gate decisively, at an 8.81% CAGR and a 0.57 Sharpe over the same period. Stock-level low-volatility screening alone did not produce the numbers in this article; the production strategy expresses the defensive idea through regime-gated index leverage instead. The equivalent test here is to take the signal apart and measure what it forecasts.
The signal is deliberately plain: risk-on = QQQ above its 200-day moving average AND a positive 126-day (roughly six-month) return, evaluated daily and traded monthly. Over the ten-year window the market was risk-on 71.3% of trading days (1,872 of 2,626). The decisive evidence is what QQQ did after each regime state:
| Conditional on the signal | Risk-on days | Risk-off days |
|---|---|---|
| Share of trading days | 71.3% | 28.7% |
| QQQ next-day return (annualized) | 21.7% | 17.8% |
| QQQ next-day volatility (annualized) | 18.3% | 29.9% |
| QQQ next-day hit rate | 58.2% | 52.0% |
| QQQ forward 21-day mean return | 1.75% | 1.70% |
The return rows are close to a wash. Risk-off days still produced a positive 17.8% annualized forward return, and over a 21-day horizon the two regimes are nearly indistinguishable (1.75% versus 1.70%). Anyone selling this filter as a crash predictor would be misreading it. The volatility row is where the signal earns its keep: 29.9% annualized on risk-off days against 18.3% on risk-on days, an 11.6-point gap, with the 63-day realized-volatility averages telling the same story (25.7% versus 18.1%).
A signal that forecasts volatility while leaving expected return roughly unchanged is exactly the raw material described by Moreira & Muir (2017), whose volatility-managed portfolios scale exposure down when recent volatility is high and earn higher risk-adjusted returns from the same underlying assets. This strategy is a blunt, two-state version of that idea with leverage attached.
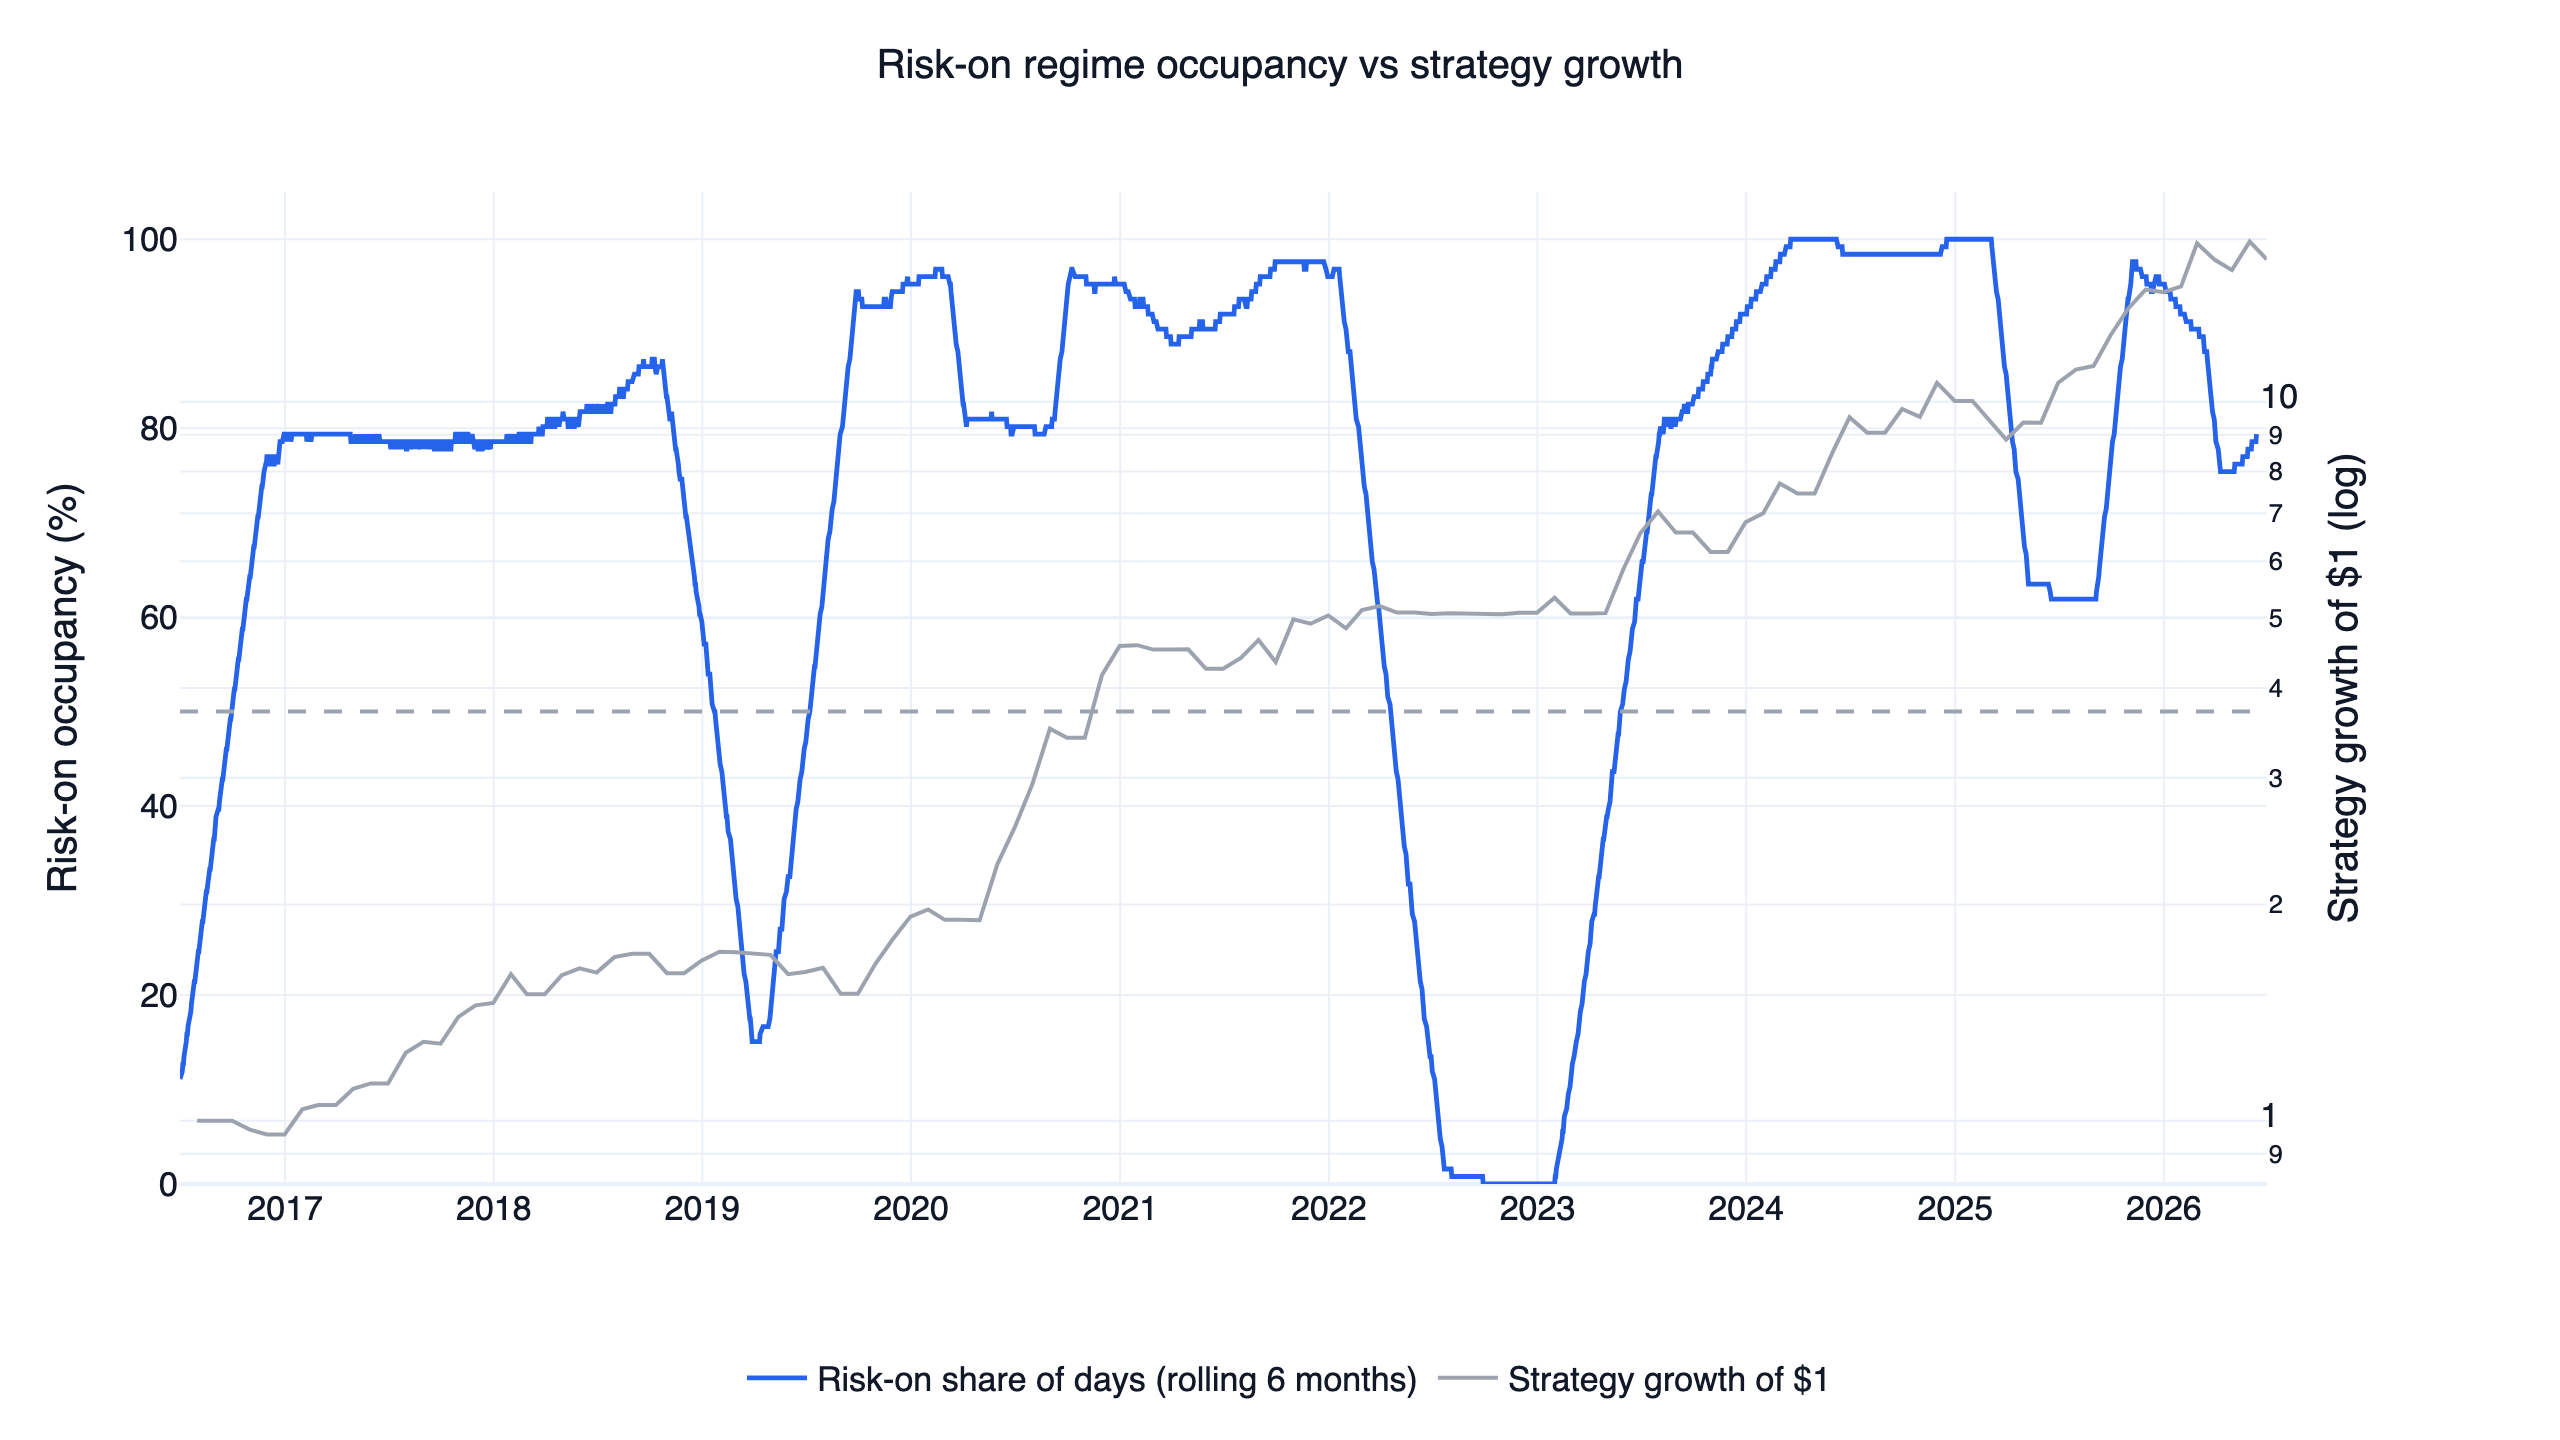
The regime's history makes the behavior concrete. Risk-on occupancy collapsed toward zero in 2019, in early 2020, and through essentially all of 2022, and during those stretches the strategy's equity curve went flat instead of falling:
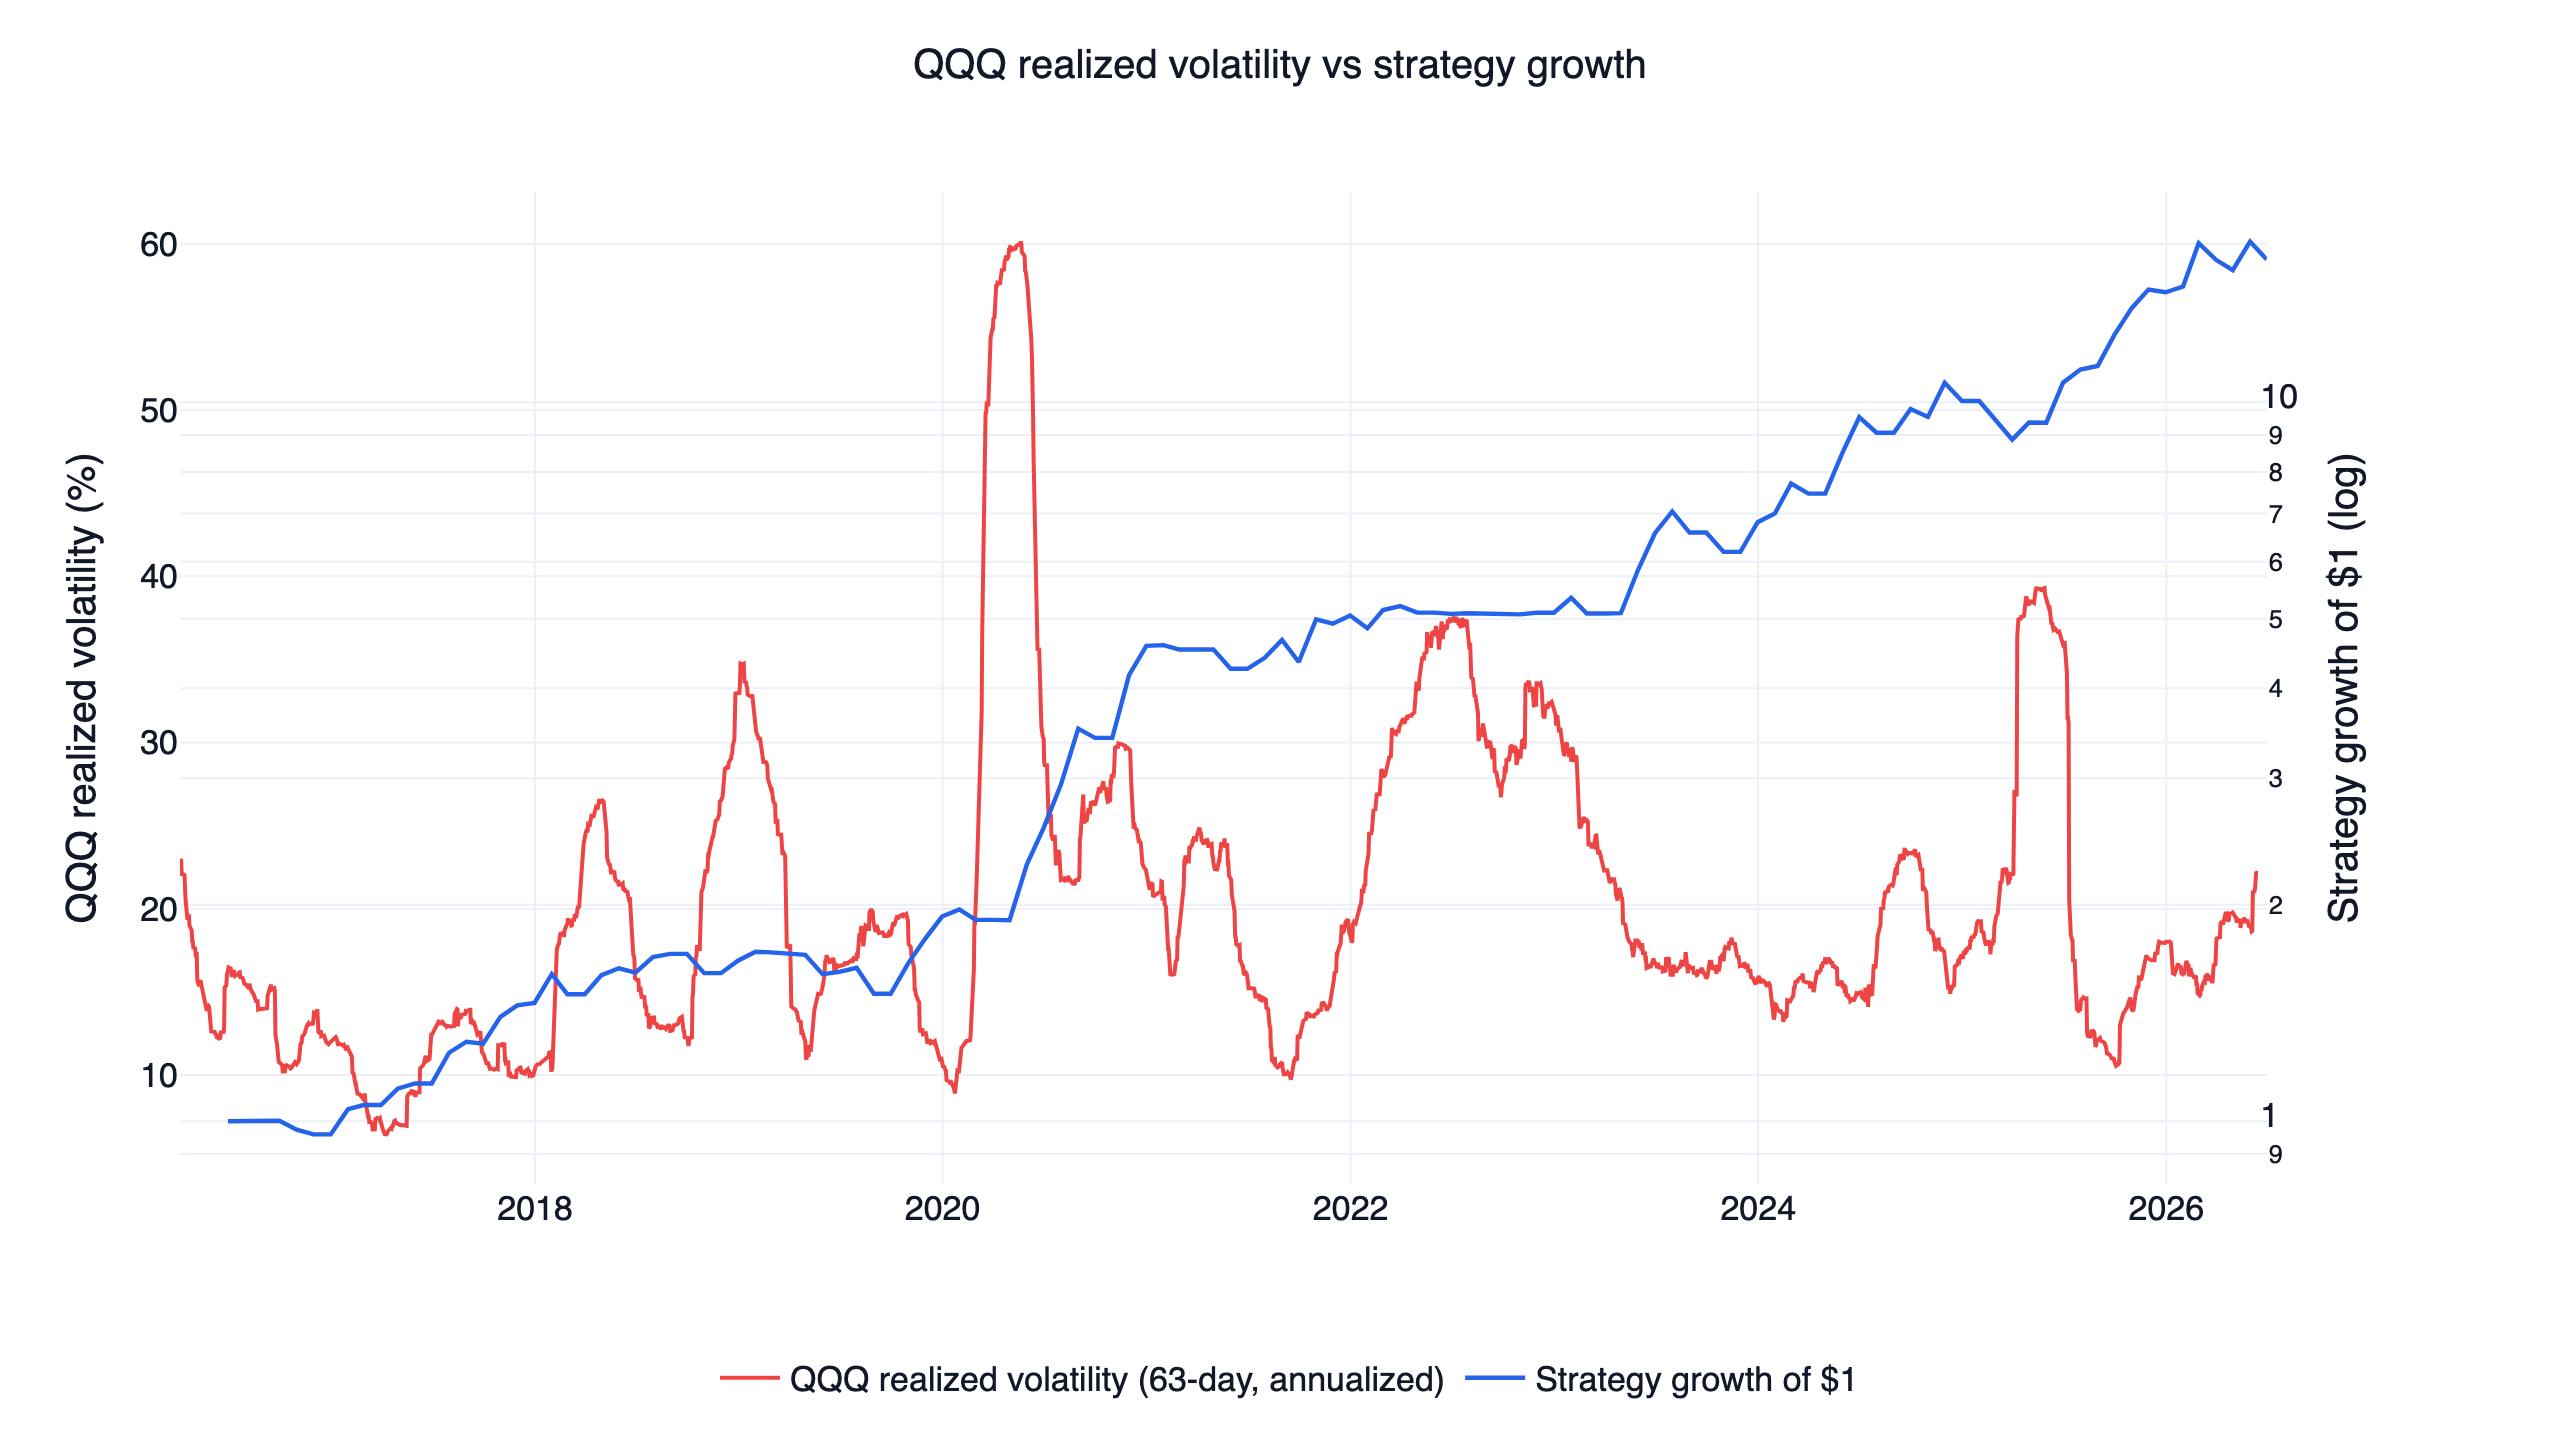
Overlaying realized volatility directly shows the same alignment from the other side. The flat stretches in the strategy's curve coincide with the 2020 and 2022 volatility spikes, which is the regime filter stepping aside exactly when variance drag on a leveraged position would be at its worst:
Why volatility is the thing that kills leverage
A daily-reset leveraged ETF multiplies each day's return, so its long-run result depends on the path, and the path cost grows with variance: in a volatile sideways market the daily arithmetic grinds value away even if the index ends flat. The cost scales roughly with leverage squared times variance, which is why the difference between an 18% and a 30% volatility regime matters far more to a 2x fund than to an unlevered one.
The ten-year buy-and-hold record of the three leverage tiers shows the trade-off:
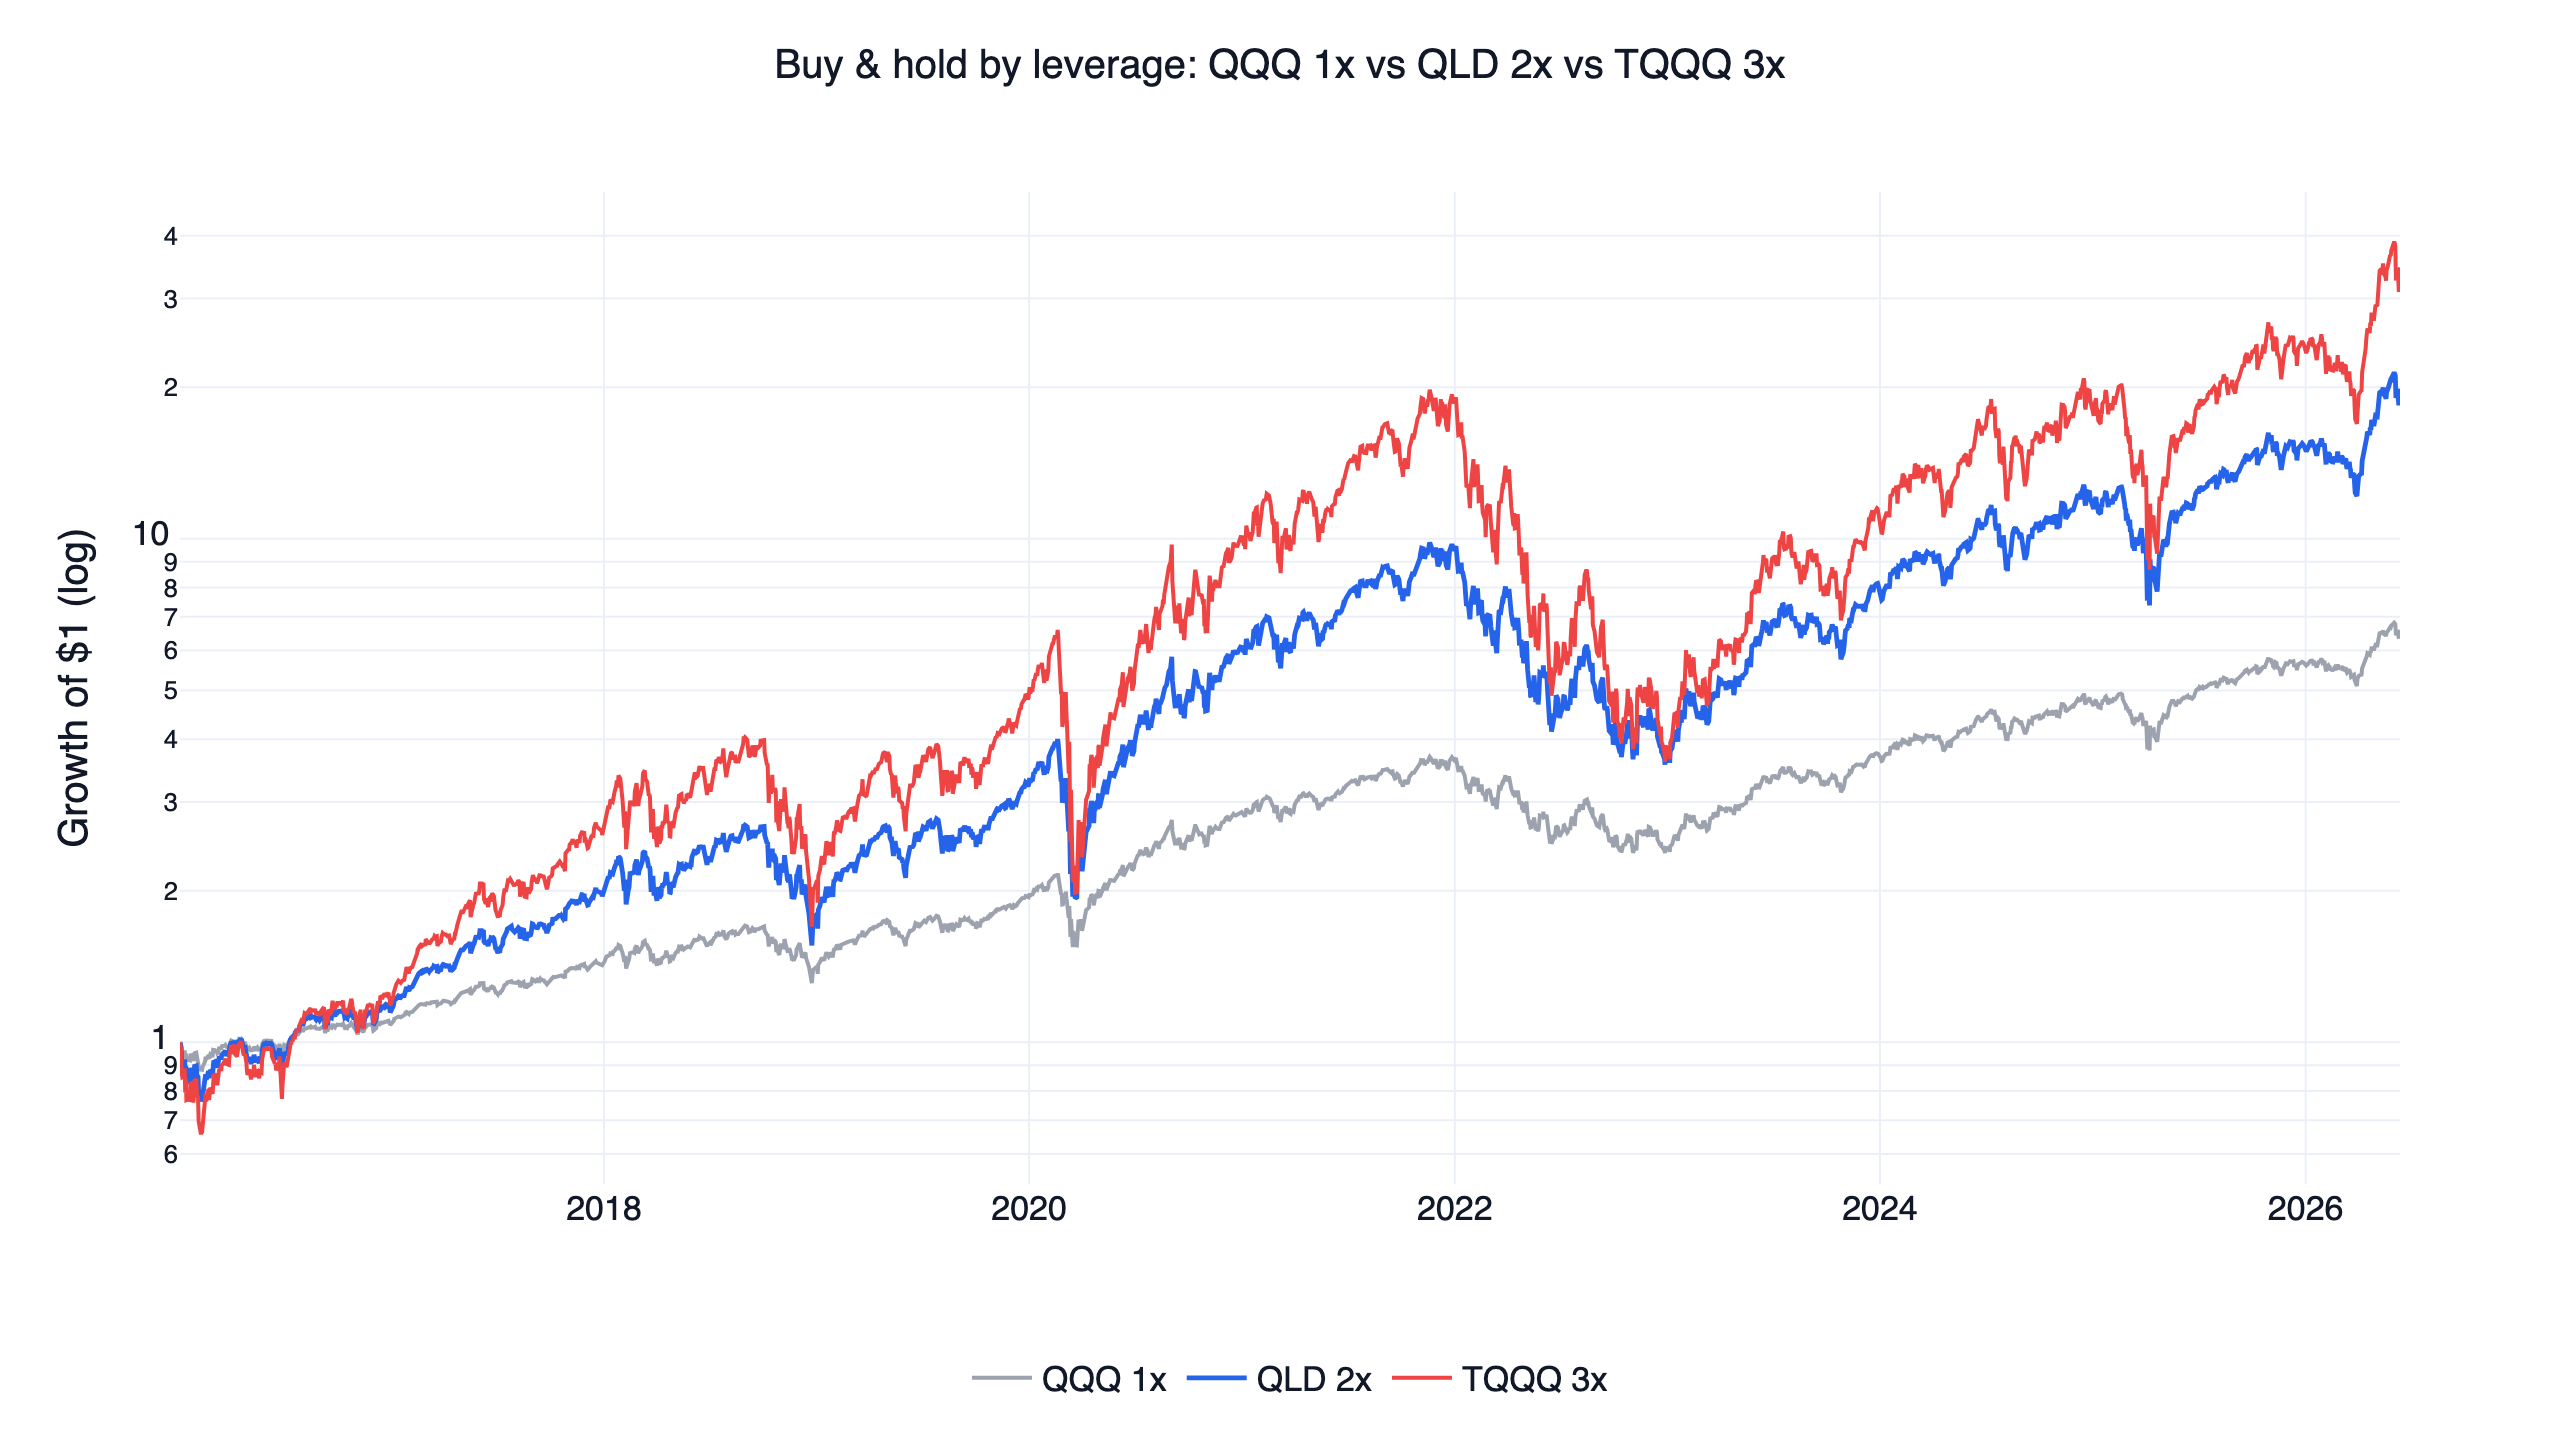
TQQQ's 3x compounding produced the highest CAGR of the three (42.8%) and also a -81.8% drawdown that took years to recover; QLD at 2x landed at 34.8% with -63.8%. Choosing 2x rather than 3x is a deliberate point on that curve: enough leverage to outrun the index meaningfully, little enough that the regime filter's residual mistakes stay survivable. The shared execution engine behind this and the other nine strategies — which ETFs, the monthly rebalance, the stop rule — is covered once in the ten-strategy overview; the short version is hold leveraged index exposure only when the regime supports it, rotate to one defensive ETF otherwise, rebalance monthly with a touched stop.
The strategy, in readable steps
In risk-on, the strategy holds exactly one 2x index ETF, whichever of QLD (2x Nasdaq-100) or SSO (2x S&P 500) has the stronger 189-day-minus-21-day momentum. In risk-off, it holds exactly one defensive ETF, the strongest of IEF (7-10 year Treasuries), GLD (gold), or SHY (1-3 year Treasuries) by 63-day-minus-21-day momentum. Rebalancing is monthly at the close, with a 6% touched stop on whatever is held.
Show Code
import finlab
from finlab import data
from finlab.backtest import sim
from finlab.dataframe import FinlabDataFrame

finlab.login()  # finlab guides you through login automatically

data.set_market("us_fund")
close = data.get("us_fund_price:adj_close")[["QQQ", "QLD", "SSO", "IEF", "GLD", "SHY"]]

# 1. Risk-on regime: QQQ above its 200-day average AND a positive 126-day return
qqq_trend = close["QQQ"] > close["QQQ"].rolling(200, min_periods=100).mean()
qqq_momentum = close["QQQ"] / close["QQQ"].shift(126) - 1
risk_on = qqq_trend & (qqq_momentum > 0)

# 2. Risk-on book: the stronger 2x ETF by 189-day minus 21-day momentum
risk_score = FinlabDataFrame(
    close[["QLD", "SSO"]].pct_change(189) - close[["QLD", "SSO"]].pct_change(21)
)

# 3. Risk-off book: the strongest defensive ETF by 63-day minus 21-day momentum
defensive_score = FinlabDataFrame(
    close[["IEF", "GLD", "SHY"]].pct_change(63) - close[["IEF", "GLD", "SHY"]].pct_change(21)
)

# 4. Hold exactly one ETF at a time: leveraged when risk-on, defensive otherwise
position = combine_books(risk_score, defensive_score, risk_on)

report = sim(position, resample="M", position_limit=1,
             stop_loss=0.06, touched_exit=True)
combine_books stands in for a few join-and-rank lines that hold the top ETF from whichever book is active; the exact position-assembly code, and this same sim() call, are in the downloadable strategy.py. Everything runs on us_fund_price:adj_close, FinLab's total-return adjusted ETF prices, for both the strategy and the QQQ/SPY benchmarks, so dividends are handled consistently on both sides of every comparison.
Across the monthly rebalances, the strategy spent 52.9% of them in QLD, 11.6% in SSO, 10.7% in GLD, 4.1% in SHY, and 2.5% in IEF, with the remainder in cash after stop-outs. It is a leveraged Nasdaq fund a slight majority of the time and something defensive or nothing the rest.
Crash behavior: where the design earns its name
The defensive-compounder claim stands or falls on the bad periods. Three episodes cover the spectrum of crash speeds in this window:
| Episode | Strategy | QQQ | QLD 2x | TQQQ 3x |
|---|---|---|---|---|
| 2018 Q4 selloff | -6.0% | -22.9% | -42.0% | -57.5% |
| 2020 COVID crash | -17.9% | -28.6% | -51.7% | -69.9% |
| 2022 bear market | -8.9% | -35.2% | -63.2% | -81.1% |
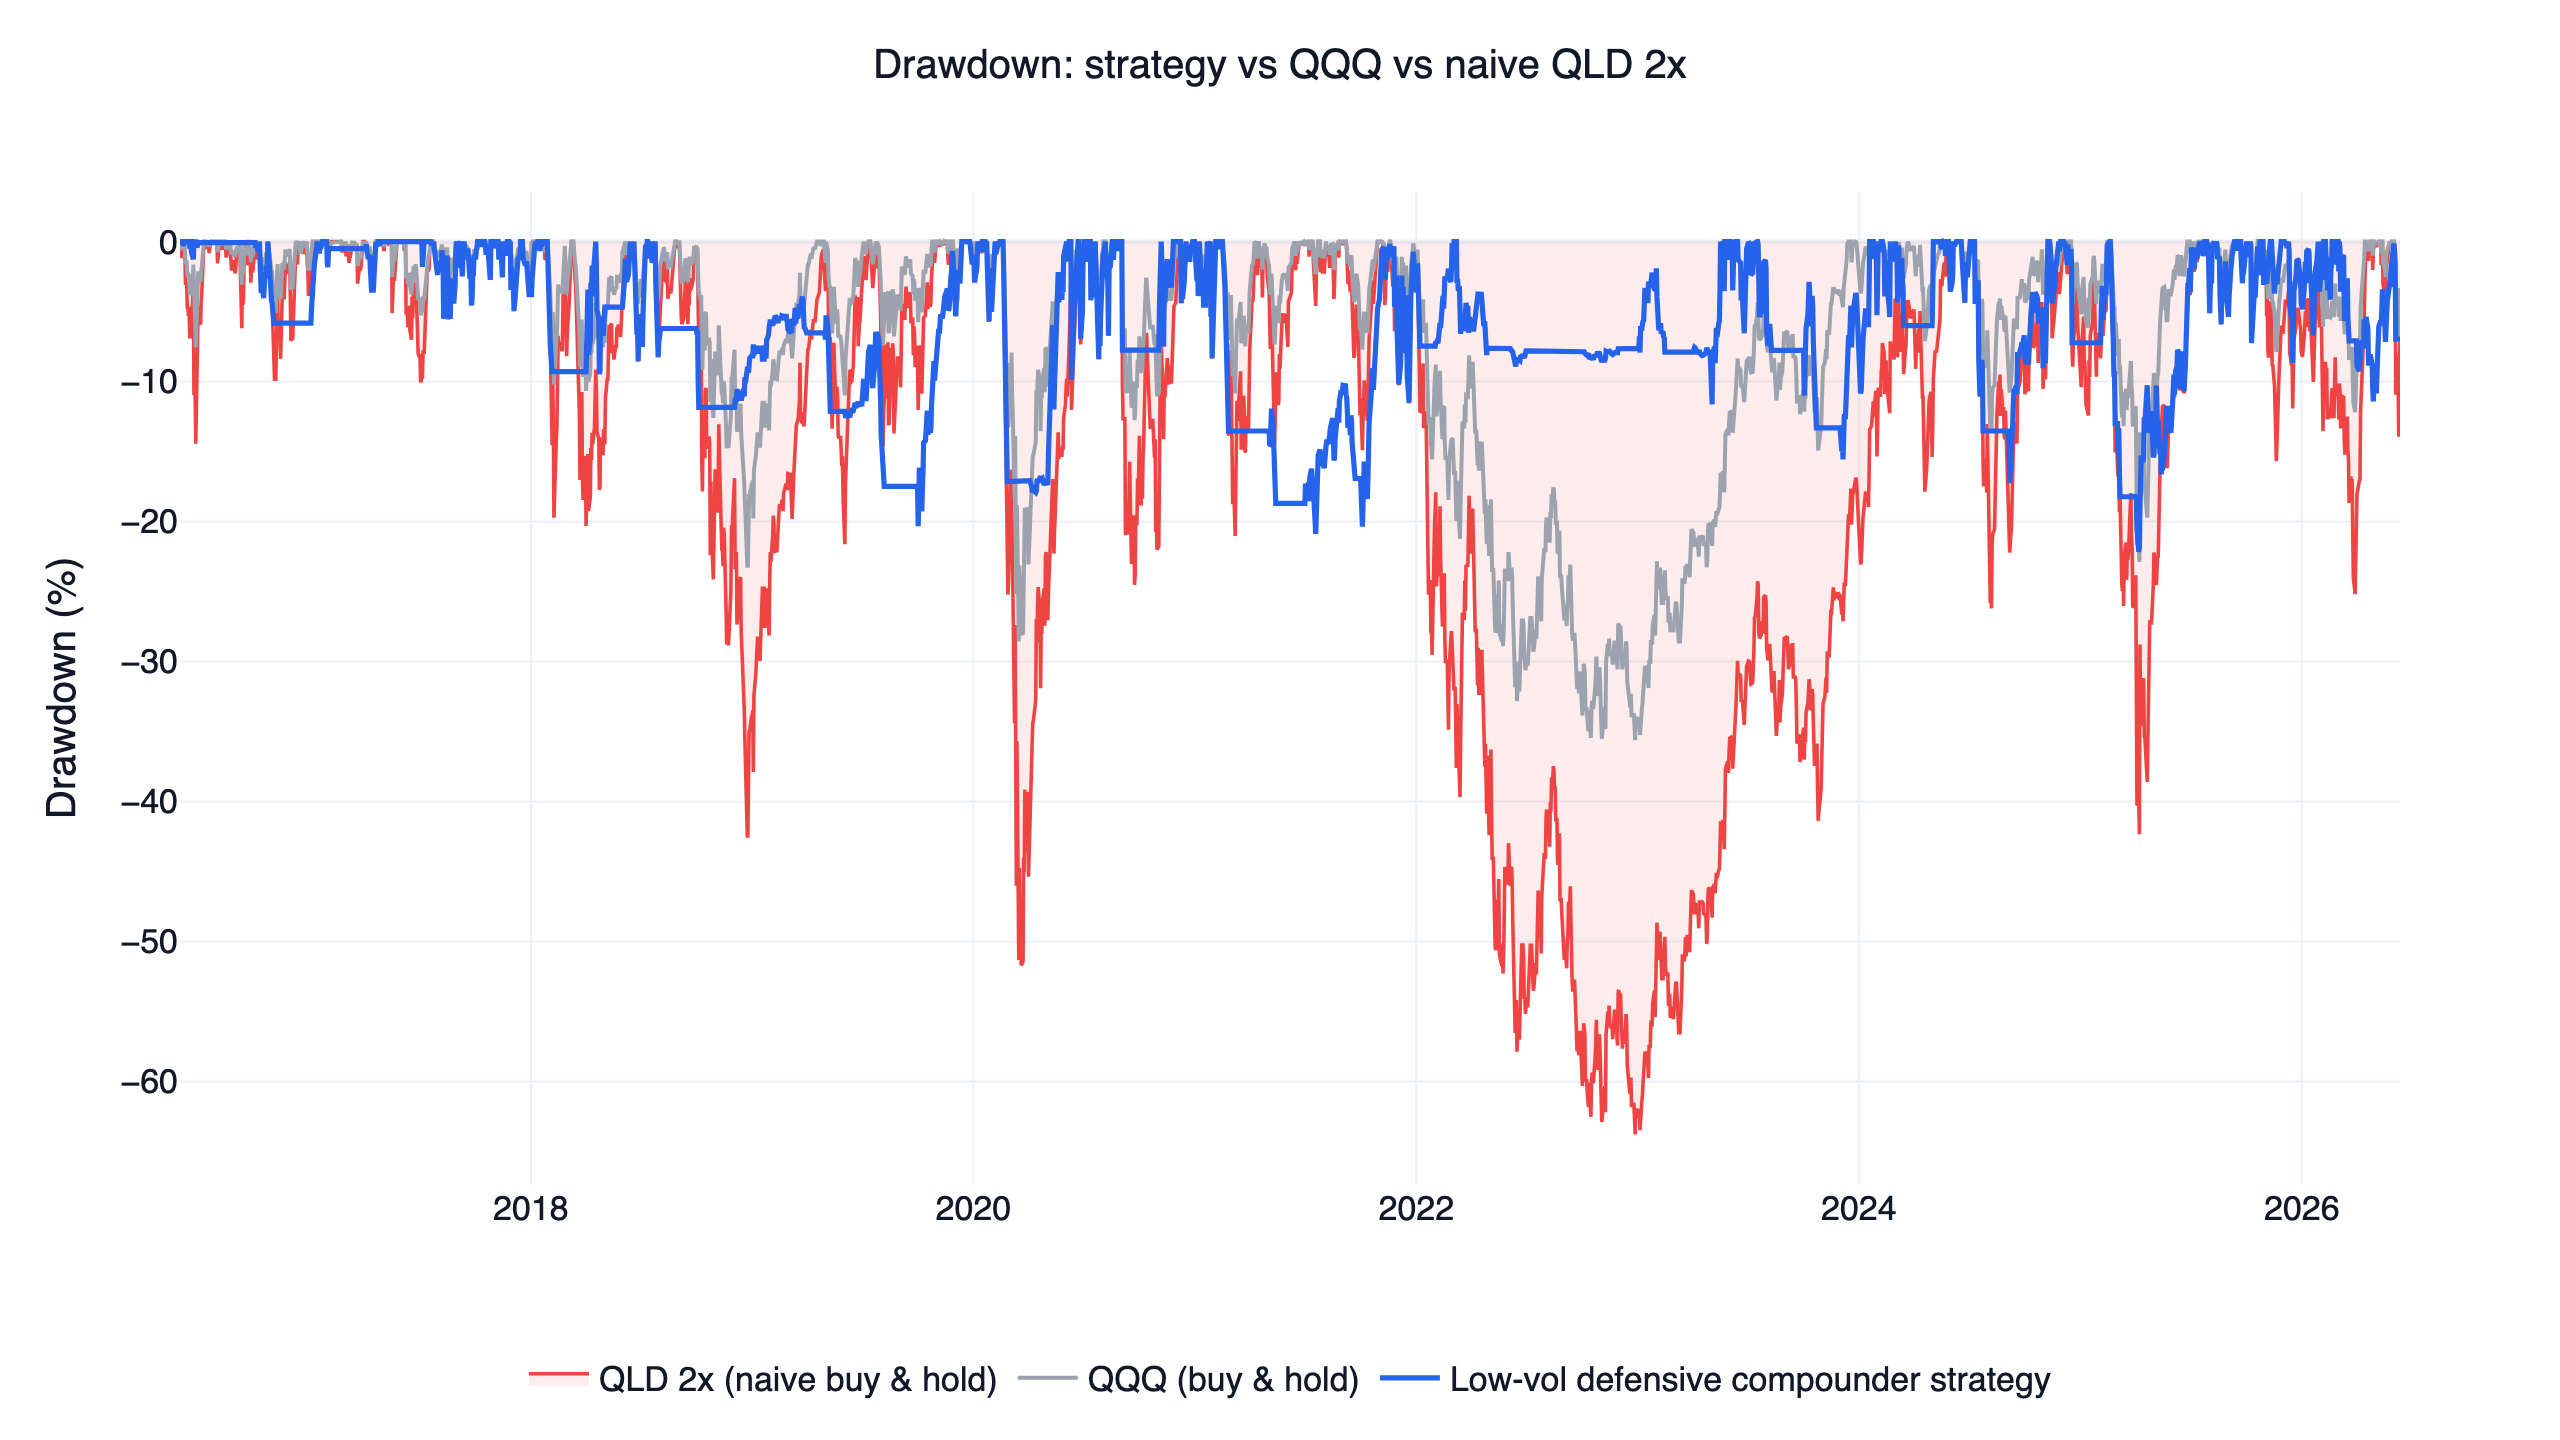
The pattern matches the mechanism. In the slow, grinding 2022 bear market the 200-day filter had months of warning, moved to defensive ETFs early, and held the loss to -8.9% in a year when unmanaged 2x exposure lost 63%. The 2018 Q4 selloff was caught almost as cleanly. COVID is the exception worth dwelling on: QQQ fell 28.6% in a matter of weeks, faster than a 200-day average can react, and the strategy took -17.9% before the filter and stop got it out. Trend-based volatility avoidance handles regime changes well and sudden shocks poorly; a faster crash than COVID would hurt more.
Results, interactive report, and the out-of-sample test
Here is the interactive finlab report — drawdowns, monthly returns, and the trade list — so you can inspect the record directly rather than take a summary's word for it:
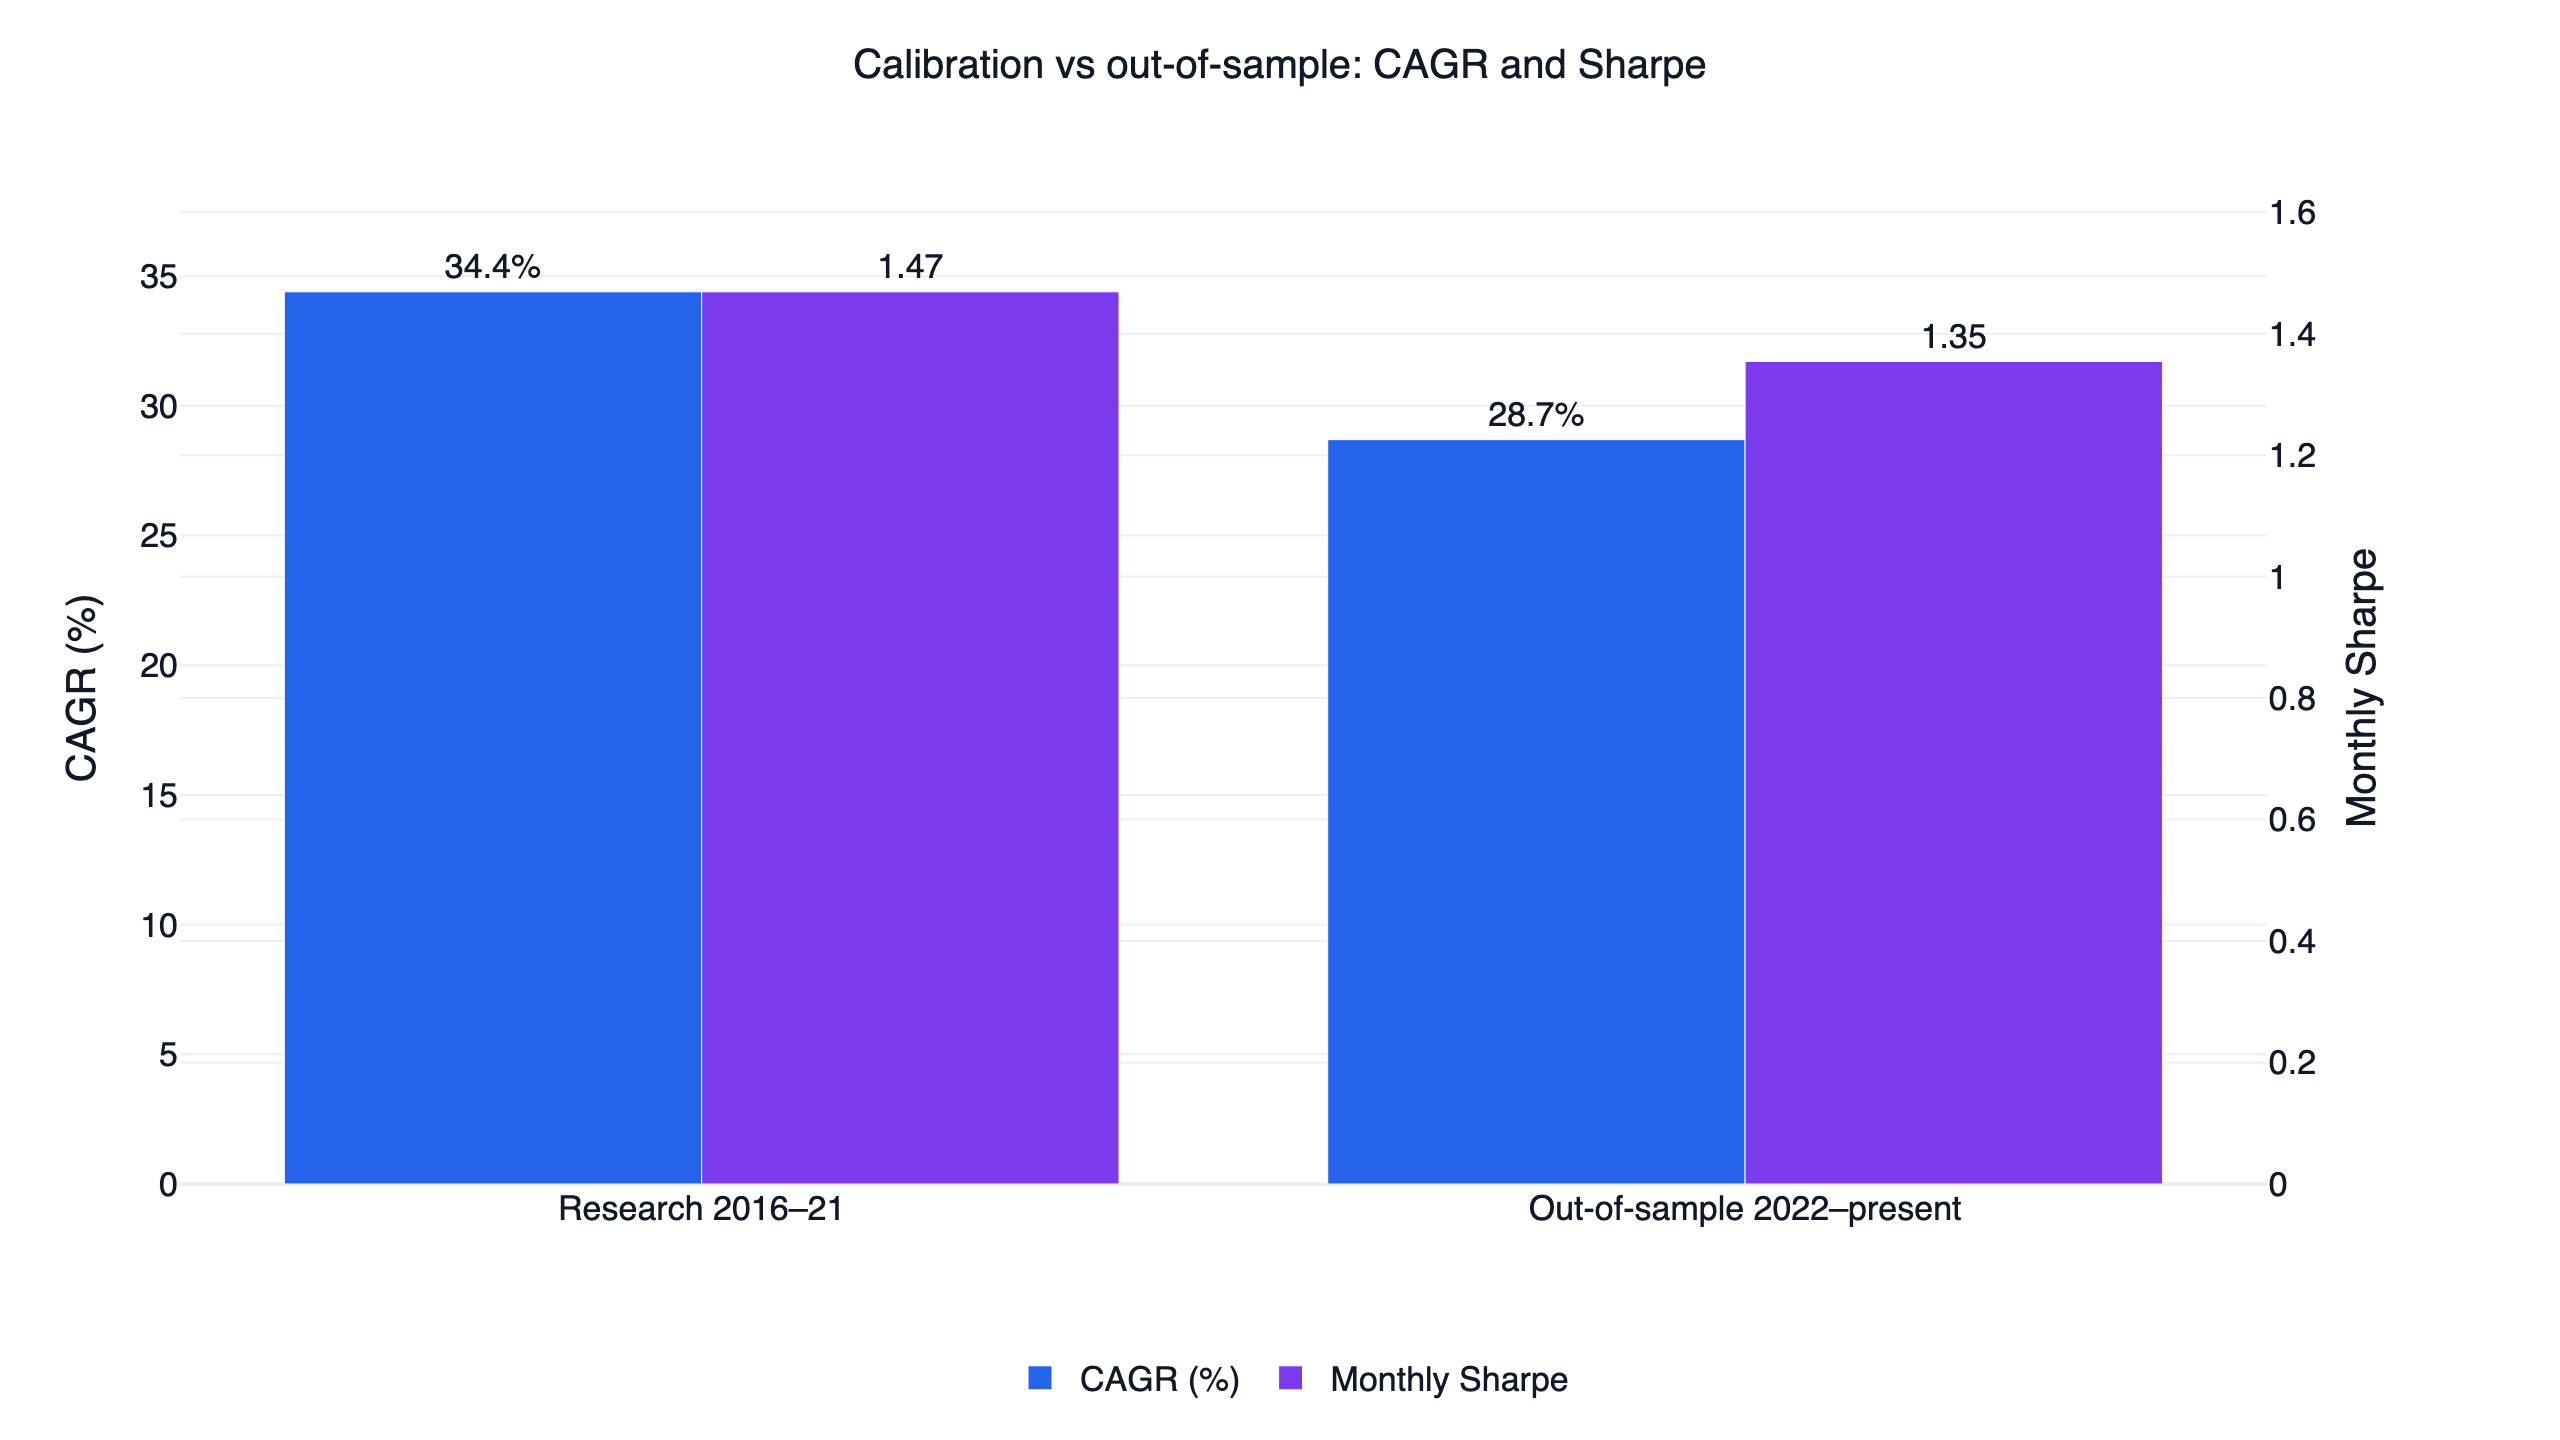
The parameters were chosen on 2016-2021 data and then left untouched on 2022-present, an unseen period that includes the 2022 bear market:
| Period | CAGR | Monthly Sharpe | Monthly Sortino | Max drawdown |
|---|---|---|---|---|
| Research (2016-2021) | 34.4% | 1.47 | 3.44 | -20.9% |
| Out-of-sample (2022-present) | 28.7% | 1.35 | 3.68 | -22.2% |
The out-of-sample period degraded moderately on CAGR and Sharpe and held its drawdown profile, with the 2022 bear market handled as designed. A 5.7-point CAGR drop out of sample is real degradation, but far from the collapse that a curve-fitted strategy typically shows on unseen data.
One bookkeeping note so the figures reconcile: the sub-period Sharpes in this table are computed on month-end resampled curves, a convention under which the full-period figure works out to 1.39; the headline 1.30 used elsewhere in this article is finlab's report statistic for the same curve. Neither convention reaches 1.5, and the two should not be mixed within one comparison.
Backtest method and limits
| Item | This backtest |
|---|---|
| Transaction costs | Not modeled (zero commission, slippage, and taxes), consistent with the rest of the ten-strategy family. At about 3.7x annual turnover across liquid ETFs the effect is modest, but live returns would be lower than these figures. |
| Leverage decay | Already reflected — the QLD/SSO/TQQQ price series include daily-reset drag and expense ratios. |
| Instruments | A fixed six-ETF set (QQQ signal; QLD/SSO risk; IEF/GLD/SHY defensive). No stock universe, so no survivorship or point-in-time fundamentals issues apply. |
| Turnover | About 3.7x per year over 90 trades — monthly regime switches, not daily churn. |
| Position rule | Exactly one ETF at a time; 6% touched stop. |
| Sample | 2016-2021 calibration; 2022-present out-of-sample. |
| Capacity | Not estimated. The ETFs involved are large and liquid, but real impact depends on your size. |
The publication gate this strategy is judged against is a risk-adjusted ratio of at least 1.5, and on Sharpe it does not clear it: the full-period monthly Sharpe is 1.30 and the out-of-sample monthly Sharpe is 1.35, both below the bar and the weakest in the ten-strategy family. The gate passes through Sortino instead: 3.54 full-period and 3.68 out of sample, computed as the mean monthly return divided by the standard deviation of negative monthly returns, annualized — the more conservative of two common conventions; finlab's downside-deviation calculation gives 3.87 on the same curve. The gap between the two ratios is informative in itself: a regime strategy that truncates its losing periods has few and shallow negative months, so Sortino is structurally flattered by exactly the right-skew the strategy is designed to produce. Read the pair together: ordinary bumpiness in line with a 1.30 Sharpe, downside outcomes much better than that number alone suggests.
The leveraged-ETF risk you must understand
This strategy holds a 2x daily-reset ETF most of the time, and the leverage is the main thing that can hurt you:
- Daily reset and path dependency. A leveraged ETF compounds each day's return, so volatile sideways markets erode value even when the index ends flat, and the cost scales with leverage squared. The naive columns above (-63.8% for 2x, -81.8% for 3x) show what unmanaged exposure to that arithmetic looks like over a decade.
- The filter is slow by construction. A 200-day average needs weeks of evidence before it flips. COVID cost the strategy -17.9% in under three months because the crash outran the signal; a faster shock would be taken at full 2x exposure until the stop or the monthly rebalance reacts.
- Stops can whipsaw. The 6% touched stop cuts losing positions quickly, and it also kicks the strategy to cash on sharp dips that immediately recover; the cash residue in the occupancy figures is the cost of that protection. In live trading a gap through the stop can also fill worse than 6%.
- Concentration. One ETF at a time means single-position, single-theme (large-cap US index) risk. There is no diversification inside this strategy; whatever it holds, it holds entirely.
- The headline numbers are cost-free. Zero commissions, spreads, and taxes were charged in the simulation. With roughly 3.7x annual turnover the gap to live results should be modest for liquid ETFs, and it is a gap in only one direction.
Who this is for
This fits an investor who wants index-level simplicity with a rules-based risk overlay, accepts leveraged ETFs as an instrument, and values drawdown control over maximum compounding (recall that naive QLD out-earned the strategy on raw CAGR). It does not fit anyone who needs the highest possible return, cannot tolerate a -22% drawdown, or is uncomfortable holding 2x products through ordinary market noise.
FAQ
What is a low volatility investing strategy? Any strategy built on the finding that lower-volatility exposures deliver better risk-adjusted returns than volatility-chasing, documented by Ang, Hodrick, Xing & Zhang (2006). This article's version applies the idea in time rather than across stocks: hold leveraged index exposure in low-volatility regimes, step aside in high-volatility ones.
Does the regime filter predict crashes? No. QQQ's forward returns on risk-off days were still positive (17.8% annualized) and close to risk-on days (21.7%). The filter predicts volatility — 29.9% versus 18.3% annualized — and avoiding volatility is what protects a leveraged position.
Why 2x leverage instead of 3x? Path dependency. TQQQ's 3x buy-and-hold earned a higher CAGR (42.8%) with a -81.8% drawdown; QLD at 2x cut that to -63.8% unmanaged, and with the regime filter to -22.2%. The 2x tier keeps the residual damage from filter mistakes (like COVID's -17.9%) survivable.
Why is the Sortino (3.54) so much higher than the Sharpe (1.30)? Sortino penalizes only downside deviation. Because the regime filter truncates losing periods, the strategy's negative months are few and shallow, which inflates Sortino relative to Sharpe. The 1.30 Sharpe is the conservative number; both are reported above.
How often does it trade? Monthly rebalances, about 3.7x turnover per year, 90 trades over the decade.
Can I run this myself? Yes — use the AI-assisted setup flow, or download the script below and run it after setup.
Reproduce it yourself
Two files reproduce everything above:
- strategy.py — the full strategy, ready to run after the AI-assisted setup flow.
- data.csv — daily equity curves for the strategy, QQQ, and SPY.
The fastest path is to use the AI-assisted setup flow and ask your AI agent to run and modify it — try a 100-day or 150-day average, swap QLD for unlevered QQQ, or change the stop, and let the agent re-run the backtest and show you what each choice costs. To see how this strategy compares with nine related US systems, read the complete US strategy comparison; the US momentum strategy is the stock-factor counterpart with full cross-sectional validation. For more strategy research, see the FinLab research blog, the AI-built PEG value strategy, the new-high momentum study, the AI quant research workflow, the institutional-flow strategy, and the cash-flow quality strategy. Definitions of the metrics used here are in the glossary. To see what teams build with finlab, browse the use cases and the team behind FinLab.
Last updated: 2026-06 | Backtest window: 2016-06 to 2026-06 | Benchmark: QQQ total return | Author: FinLab Quant Research (reviewed by a quantitative researcher)
Investing involves risk, and past performance does not represent future results. Leveraged ETFs carry additional risks including volatility decay and amplified losses. This content is for educational purposes only and is not investment advice; evaluate any strategy against your own risk tolerance.
FinLab AI
Want to build your own strategy?
Describe your stock-picking ideas in natural language. AI automatically validates, backtests, and gives you answers
Start Free