Run this strategy
Copy the prompt to reproduce the evidence above with the article’s data, assumptions, and risk checks.
Tell your AI:
Set up FinLab and backtest QQQ volatility targeting at 15% (21-day realized volatility, rest in SHY) against QQQ. Please read: https://finlab.finance/en/setup?relatedUrl=/en/blog/qqq-volatility-targeting-strategy
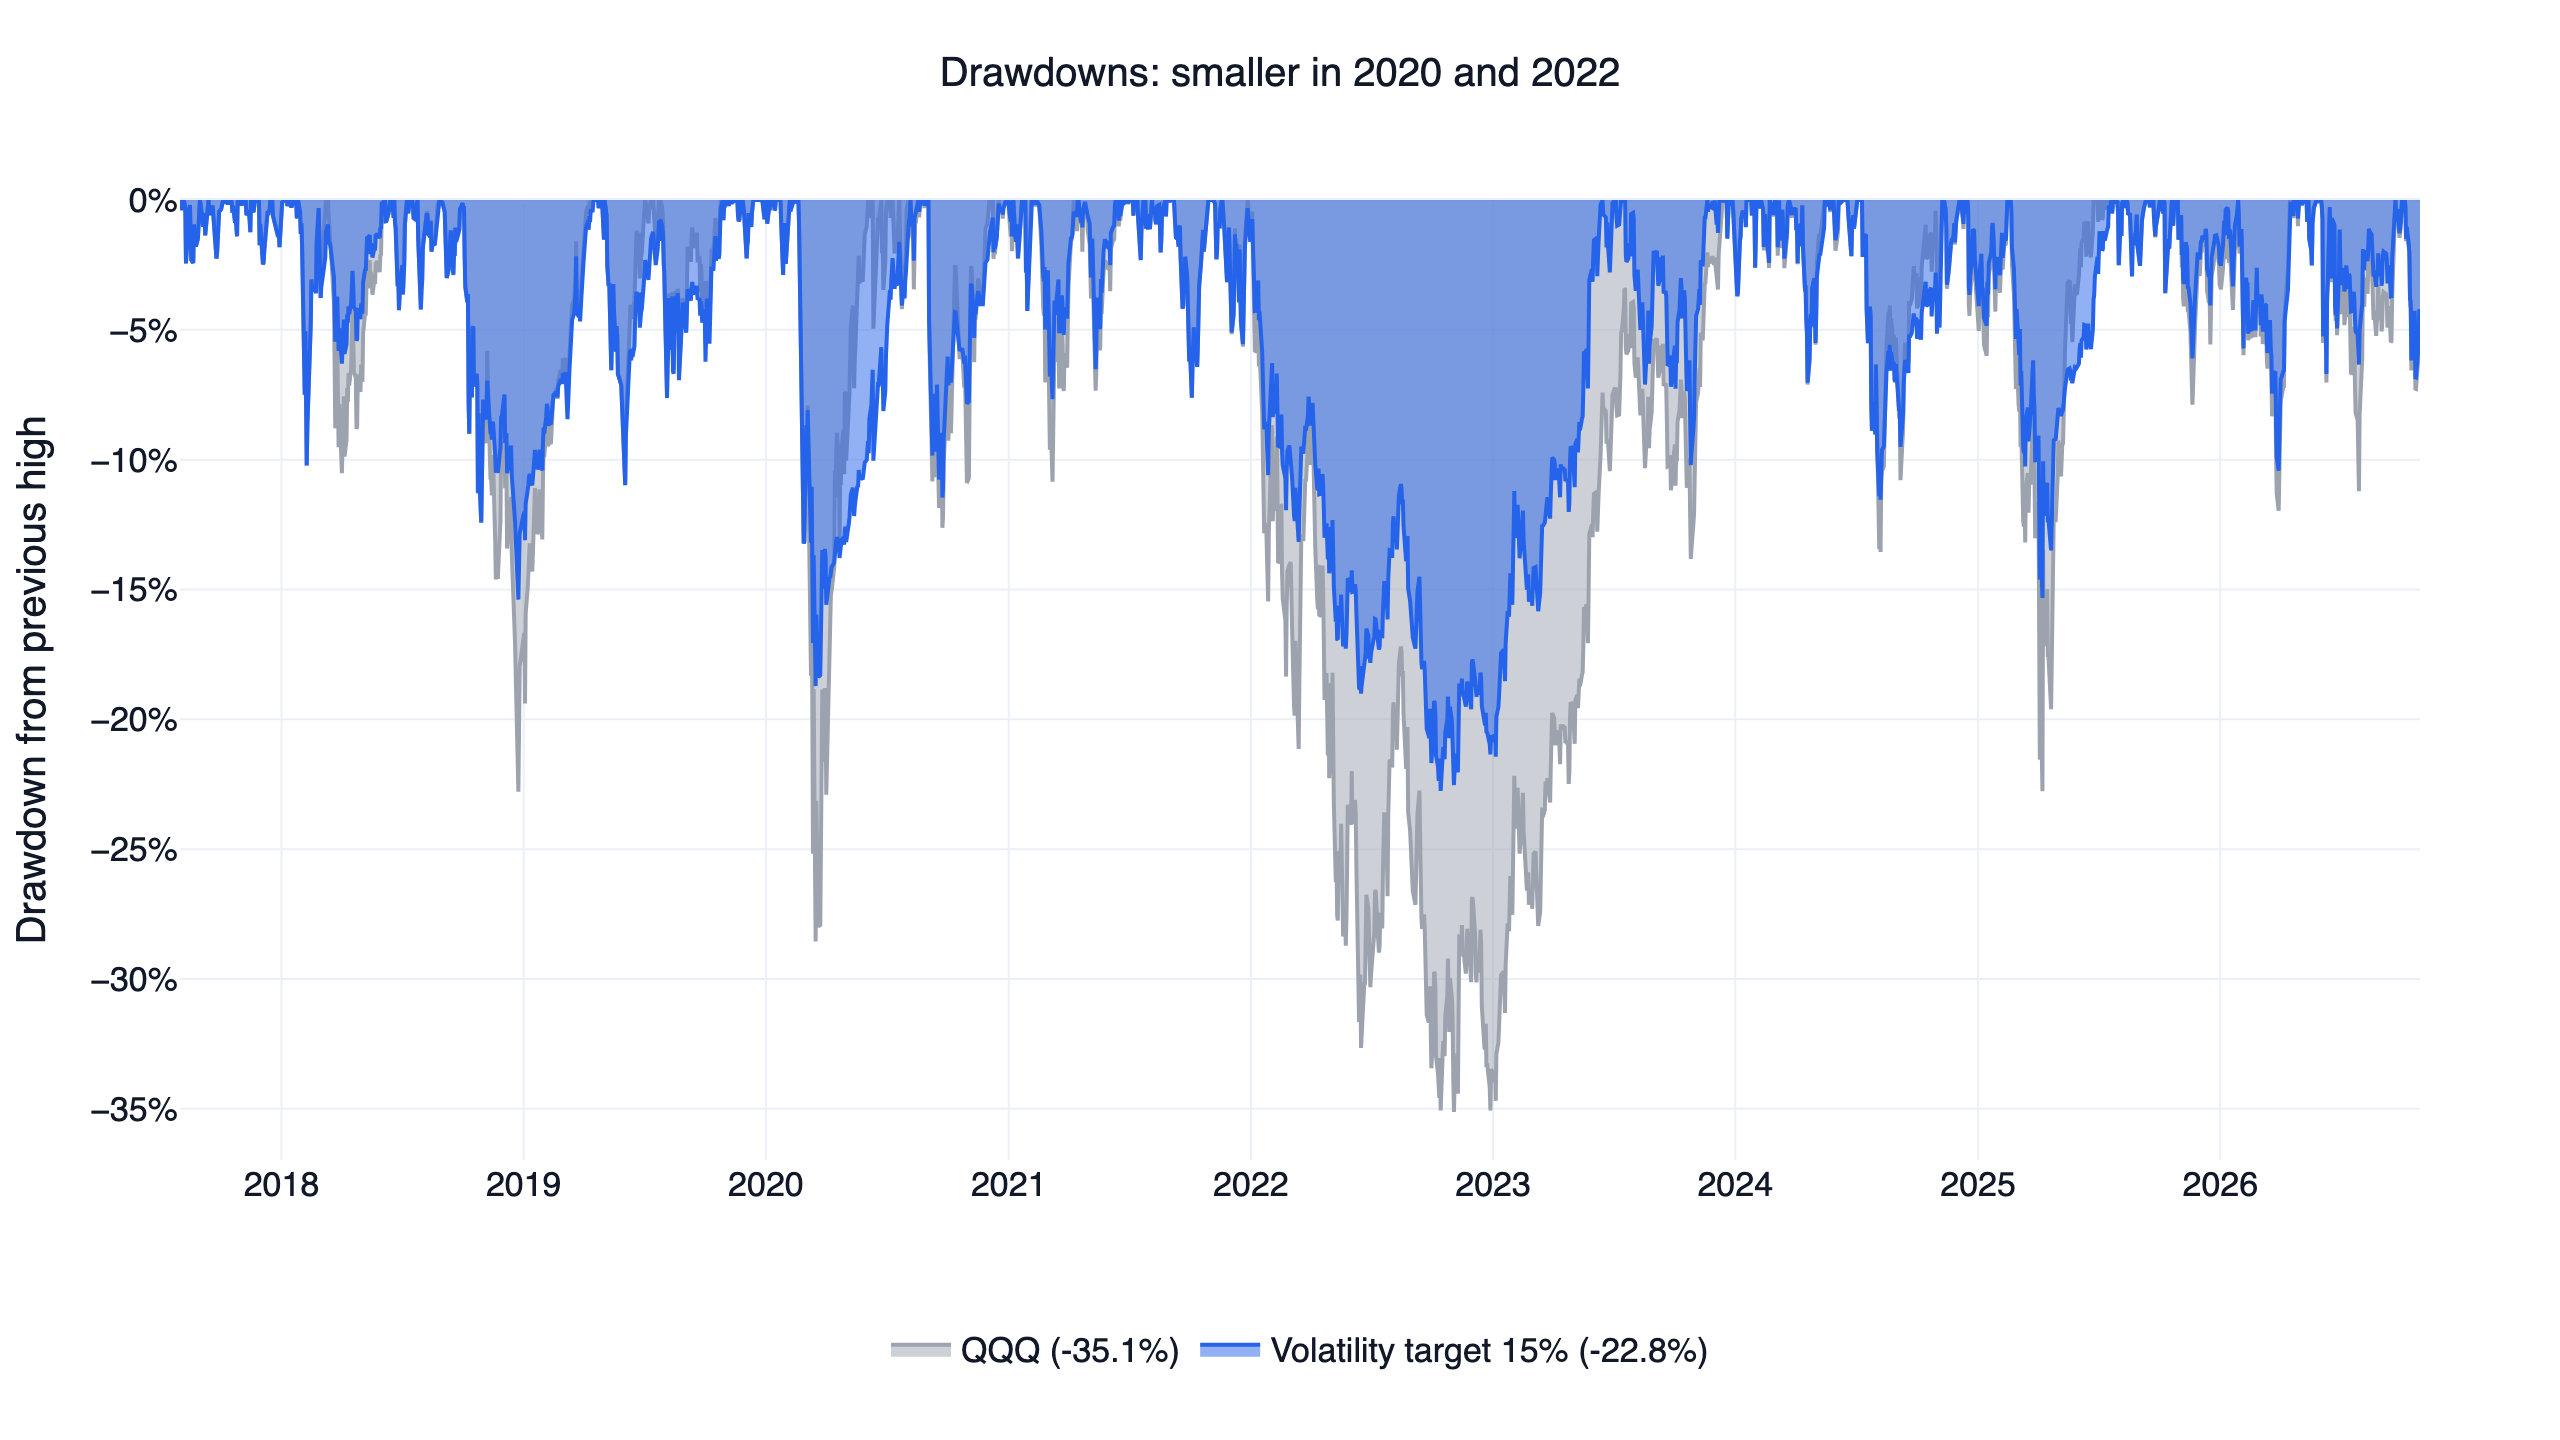
Volatility targeting sizes a position by its recent risk. At every month end we measure QQQ's realized volatility over the last 21 trading days, hold QQQ at a weight of 15% divided by that volatility (capped at 100%), and put the rest in short-term Treasuries (SHY). From August 2017 to October 2026 the rule returned 15.7% a year with a daily Sharpe ratio of 0.98 and a maximum drawdown of -22.8%. Holding QQQ with dividends reinvested over the same days returned 19.8% a year, with a Sharpe of 0.89 and a drawdown of -35.1%. It earned less than QQQ, but took about two thirds of the drawdown for a better risk-adjusted return, and it passed all three of our robustness checks: neighbouring parameters, both halves of the backtest, and trading costs. Almost all of the edge comes from the 2022 bear market: without 2022, its Sharpe of 1.25 ties QQQ's 1.25.
The timing is what matters. Holding QQQ at a fixed 78%, the strategy's average weight, with the rest in SHY returned 16.0% a year, about the same, but with a -29.0% drawdown and a Sharpe of 0.92. With the same average exposure, volatility targeting cut its position in March 2020 and through 2022, and its worst drawdown was about 6 percentage points smaller than the fixed mix.
The live equity curve and code are on the QQQ volatility targeting strategy page.
Key numbers
| Portfolio | CAGR | Daily Sharpe | Max drawdown | Volatility |
|---|---|---|---|---|
| Volatility target 15% (QQQ/SHY) | 15.7% | 0.98 | -22.8% | 16.2% |
| Fixed 78% QQQ + 22% SHY | 16.0% | 0.92 | -29.0% | 18.0% |
| QQQ buy and hold (dividends reinvested) | 19.8% | 0.89 | -35.1% | 23.3% |
| Volatility target, 0.1% cost per trade side | 15.3% | 0.96 | -22.9% | 16.2% |
Window: 2017-08-01 to 2026-10-29, the same days for every line. The daily Sharpe ratio is the mean daily return divided by its standard deviation, times the square root of 252, with no risk-free rate deducted. That is the convention behind every validated strategy on this site; a version net of T-bill returns follows below.
How the rule works
- On the last trading day of each month, take QQQ's daily returns over the last 21 trading days and annualize their standard deviation (times the square root of 252).
- QQQ weight = 15% / realized volatility, capped at 100%. Below 15% volatility the account is fully in QQQ; at 30% volatility it holds half.
- The rest goes into SHY, the iShares 1-3 year Treasury ETF.
- Trade at the next day's close and hold until the next month end. No leverage, no shorting.
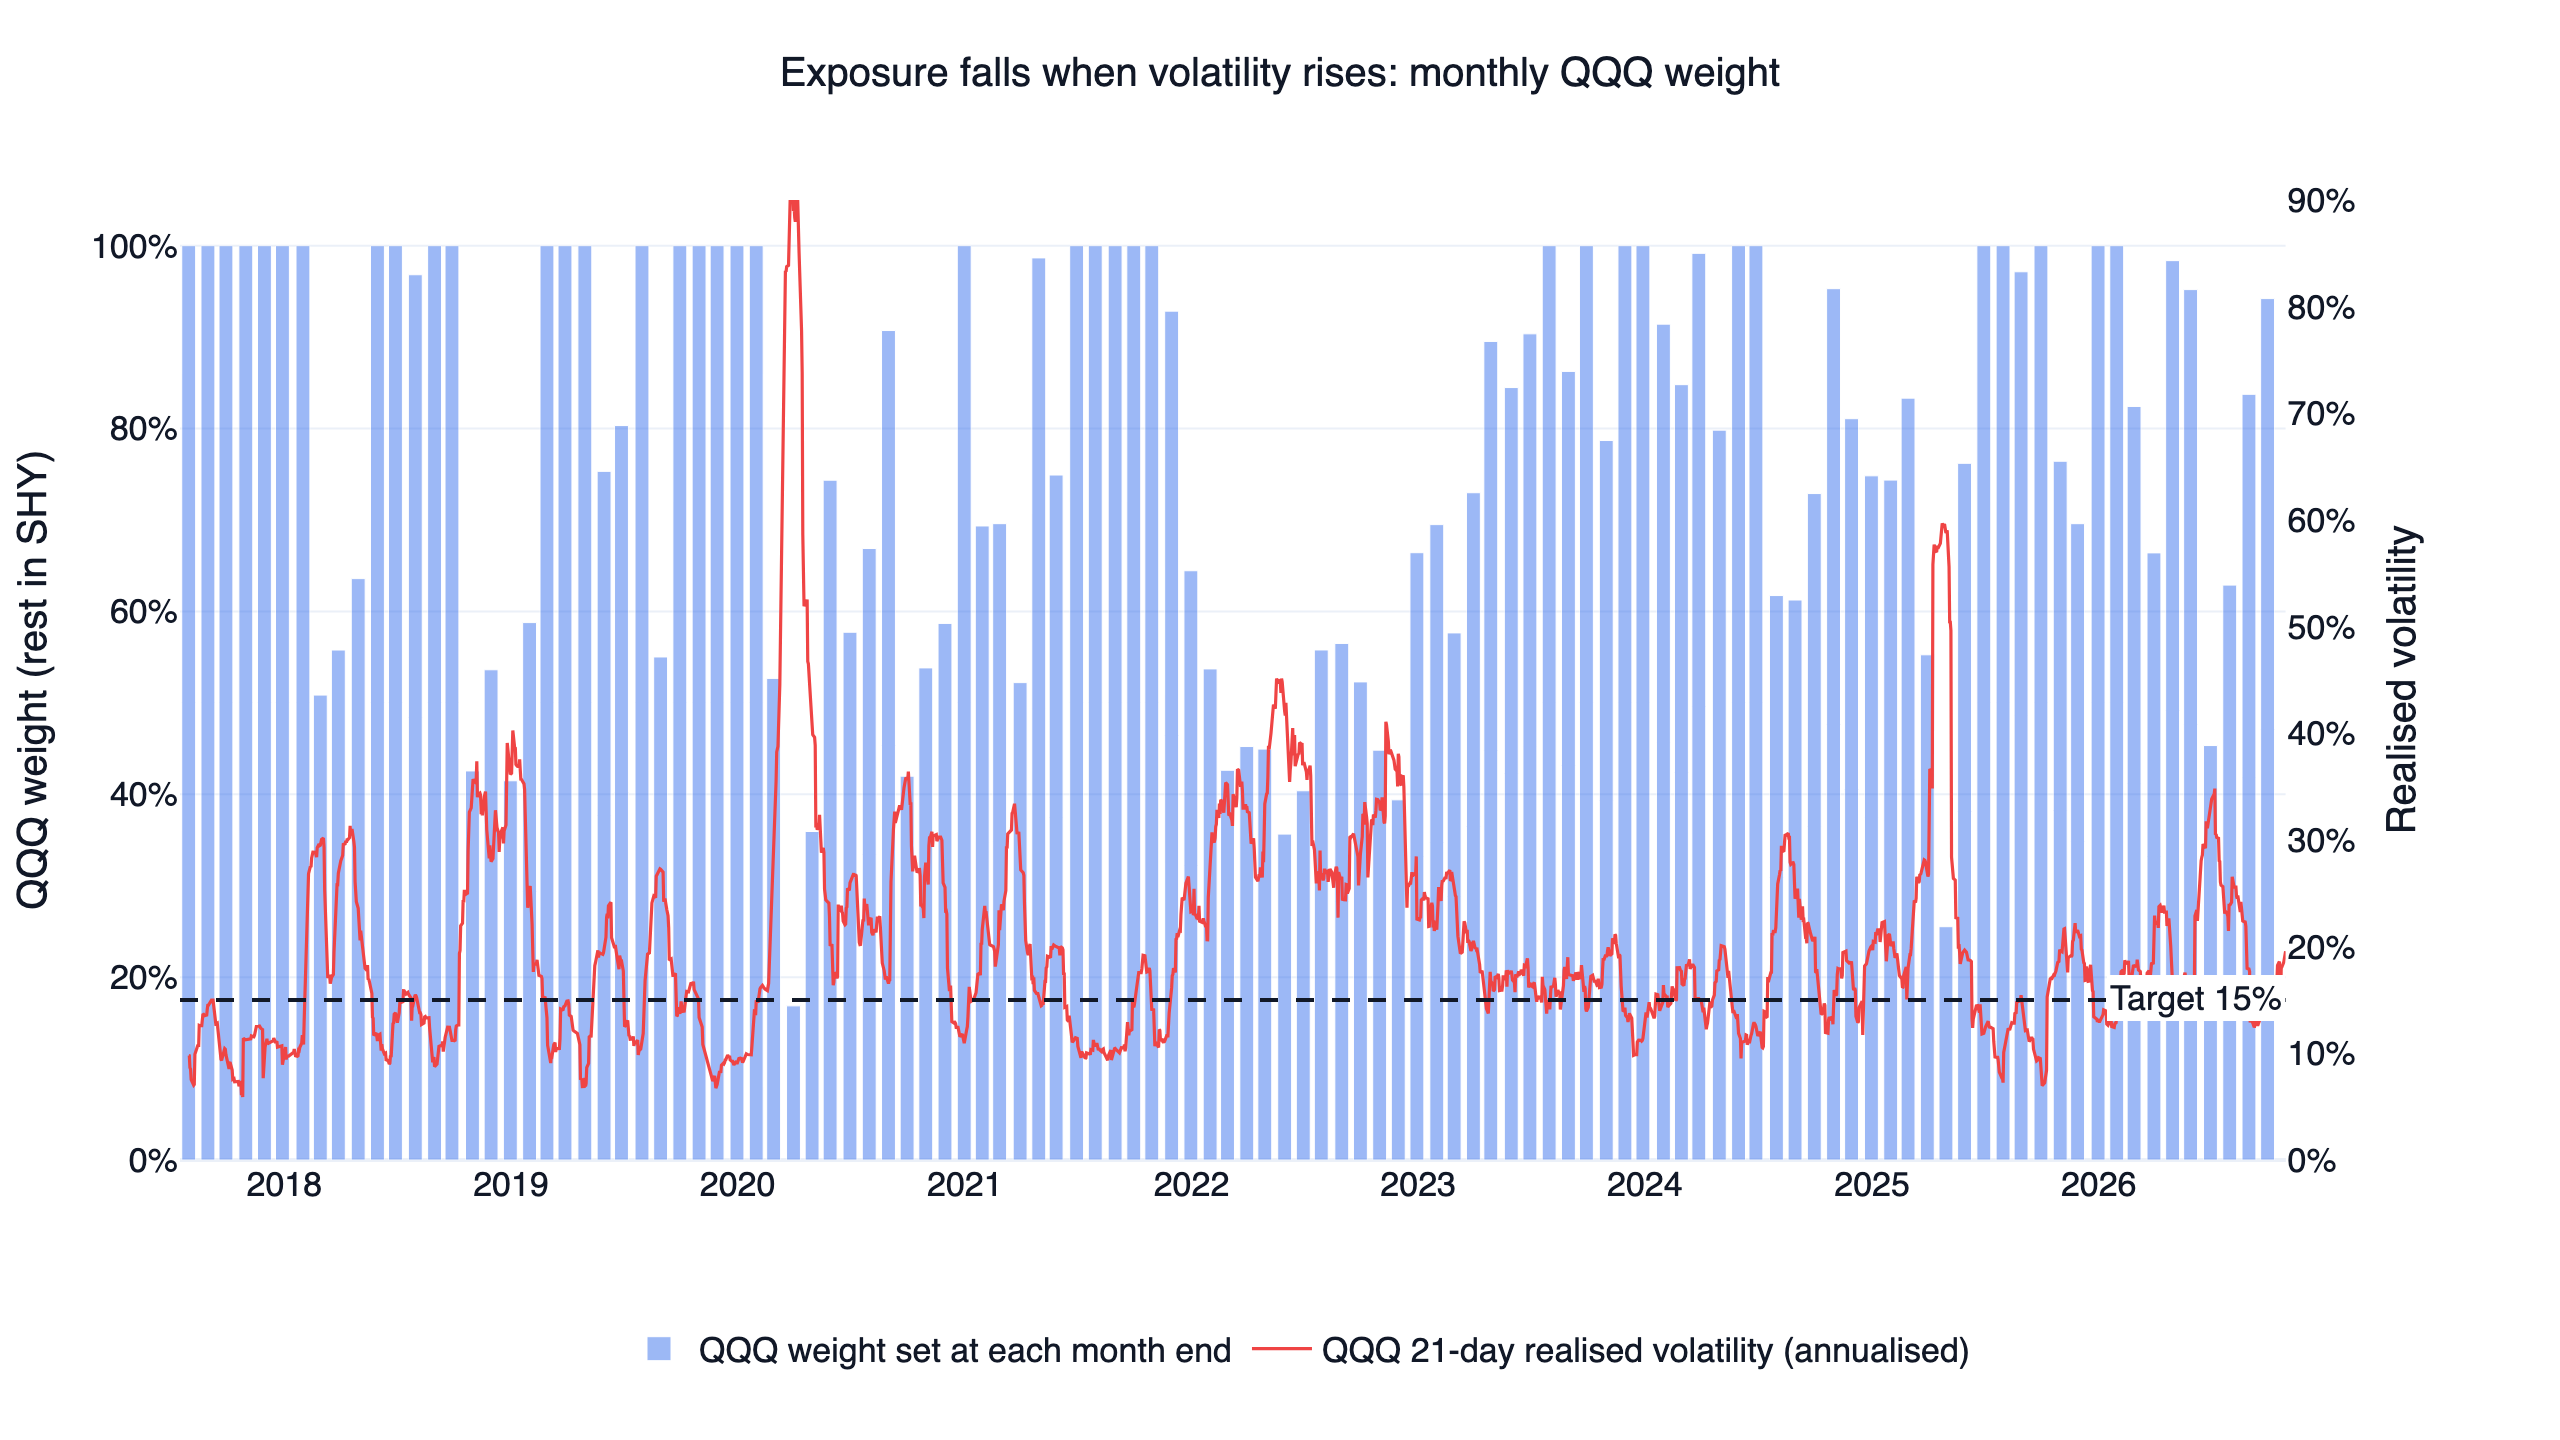
Of 111 month-end rebalances, 37 put the whole account in QQQ and 14 held less than half. The lowest weight was 16.9% at the end of March 2020, when QQQ's 21-day volatility was above 80%. In 2022, when QQQ fell 32.6%, the monthly QQQ weight ranged from 36% to 64% and the strategy lost 19.4%.
The idea comes from Moreira and Muir (2017), "Volatility-Managed Portfolios". Volatility clusters: a market that is volatile today usually stays volatile next month, but expected returns do not rise to match. Cutting exposure when volatility is high sheds risk that is not paid for, which raises the Sharpe ratio. Earlier, Fleming, Kirby and Ostdiek (2001) found economic value in timing a stock-bond-gold allocation with volatility forecasts.
Year by year: smaller losses in bear years, smaller gains in rallies
| Year | Volatility target | Fixed 78% QQQ | QQQ |
|---|---|---|---|
| 2017 (from August) | 9.0% | 6.9% | 9.0% |
| 2018 | 4.1% | 0.5% | -0.1% |
| 2019 | 26.6% | 30.6% | 39.0% |
| 2020 | 20.3% | 38.4% | 48.6% |
| 2021 | 23.5% | 20.8% | 27.4% |
| 2022 | -19.4% | -26.6% | -32.6% |
| 2023 | 41.2% | 42.4% | 54.9% |
| 2024 | 21.2% | 20.7% | 25.6% |
| 2025 | 14.8% | 17.3% | 20.8% |
| 2026 (to Oct 29) | 13.7% | 13.5% | 16.8% |
2020 shows the weak spot. At the end of March, with volatility at its peak, the QQQ weight was 17%, and at the end of April it was still 36%, so the strategy missed much of the rebound from the low: +20.3% for the year against +38.4% for the fixed mix. Rebounds after a crash often happen while volatility is still high, and volatility targeting will always give up part of them.
The interactive finlab report below shows the monthly returns, the QQQ/SHY split at each rebalance and every drawdown period.
The three robustness checks
A strategy counts as working on this site only if it beats QQQ (dividends reinvested) on daily Sharpe over the same days in all three tests.
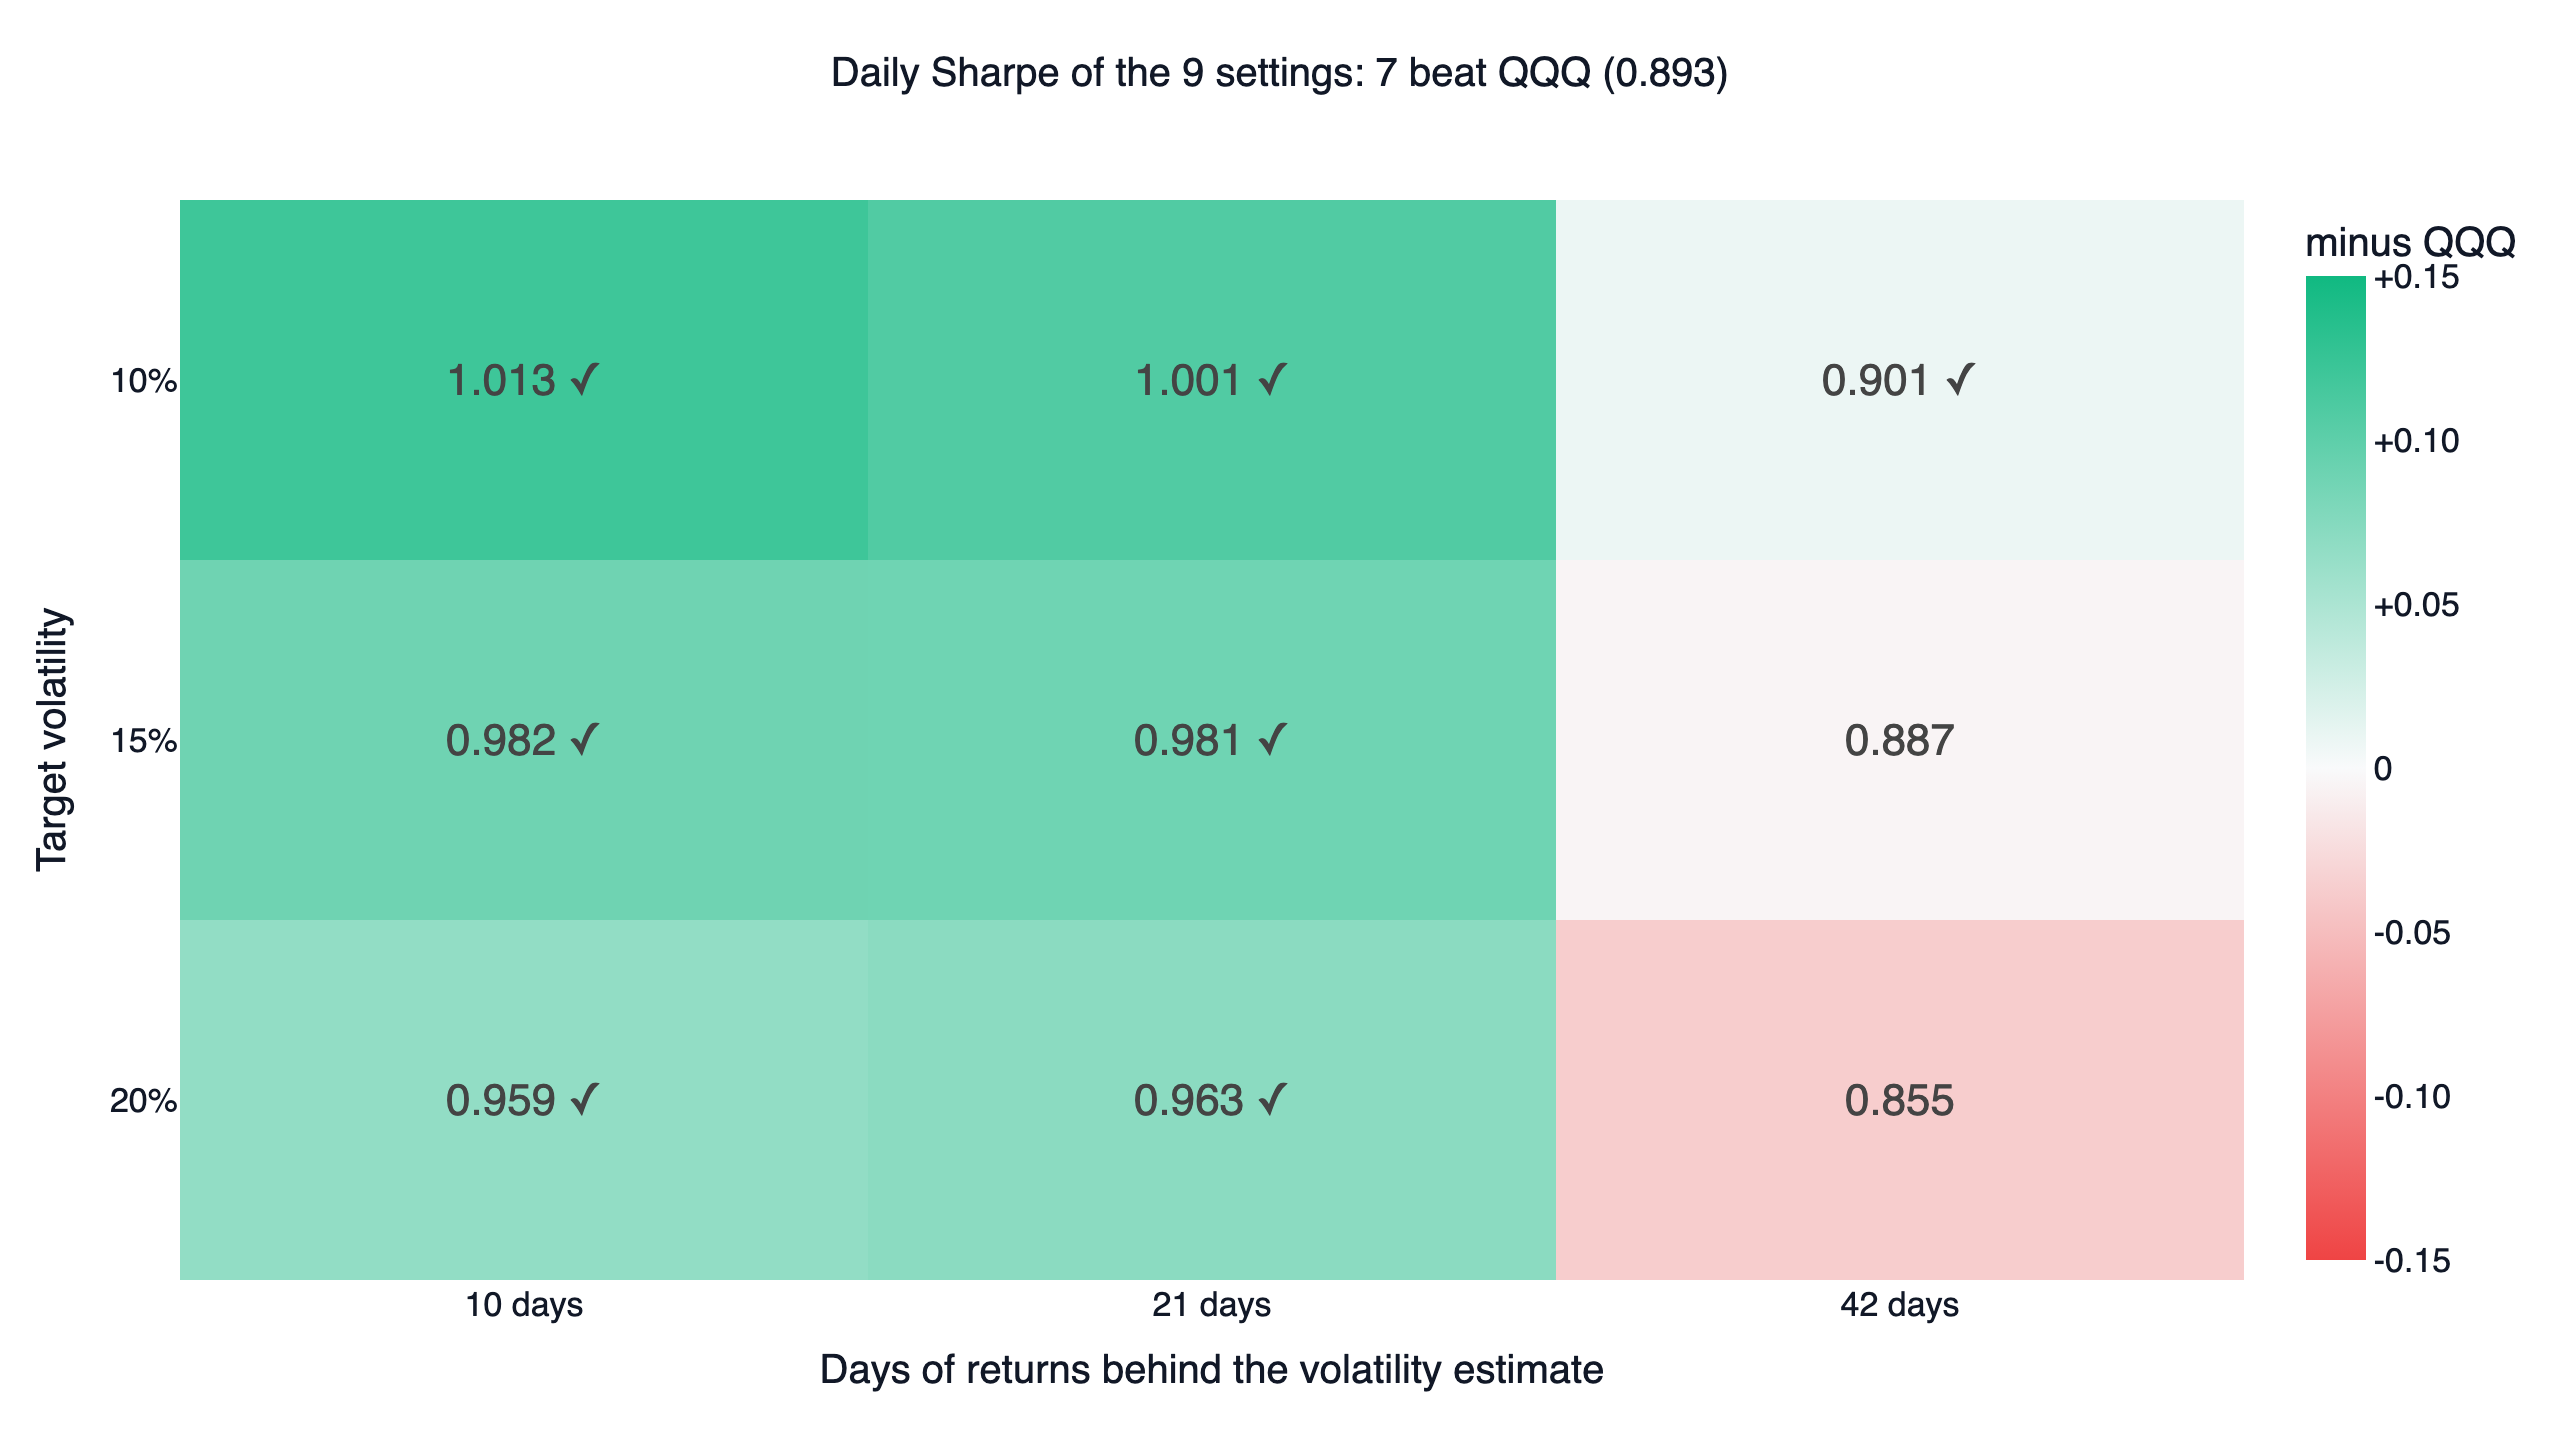
1. Neighbouring parameters: 7 of 9 win, exactly the minimum. We tried target volatilities of 10%, 15% and 20%, and volatility windows of 10, 21 and 42 trading days. All six settings with a 10- or 21-day window beat QQQ. Of the three 42-day settings only one did (10% target, 0.901); the other two scored 0.887 and 0.855 against QQQ's 0.893. A longer window cuts exposure later.
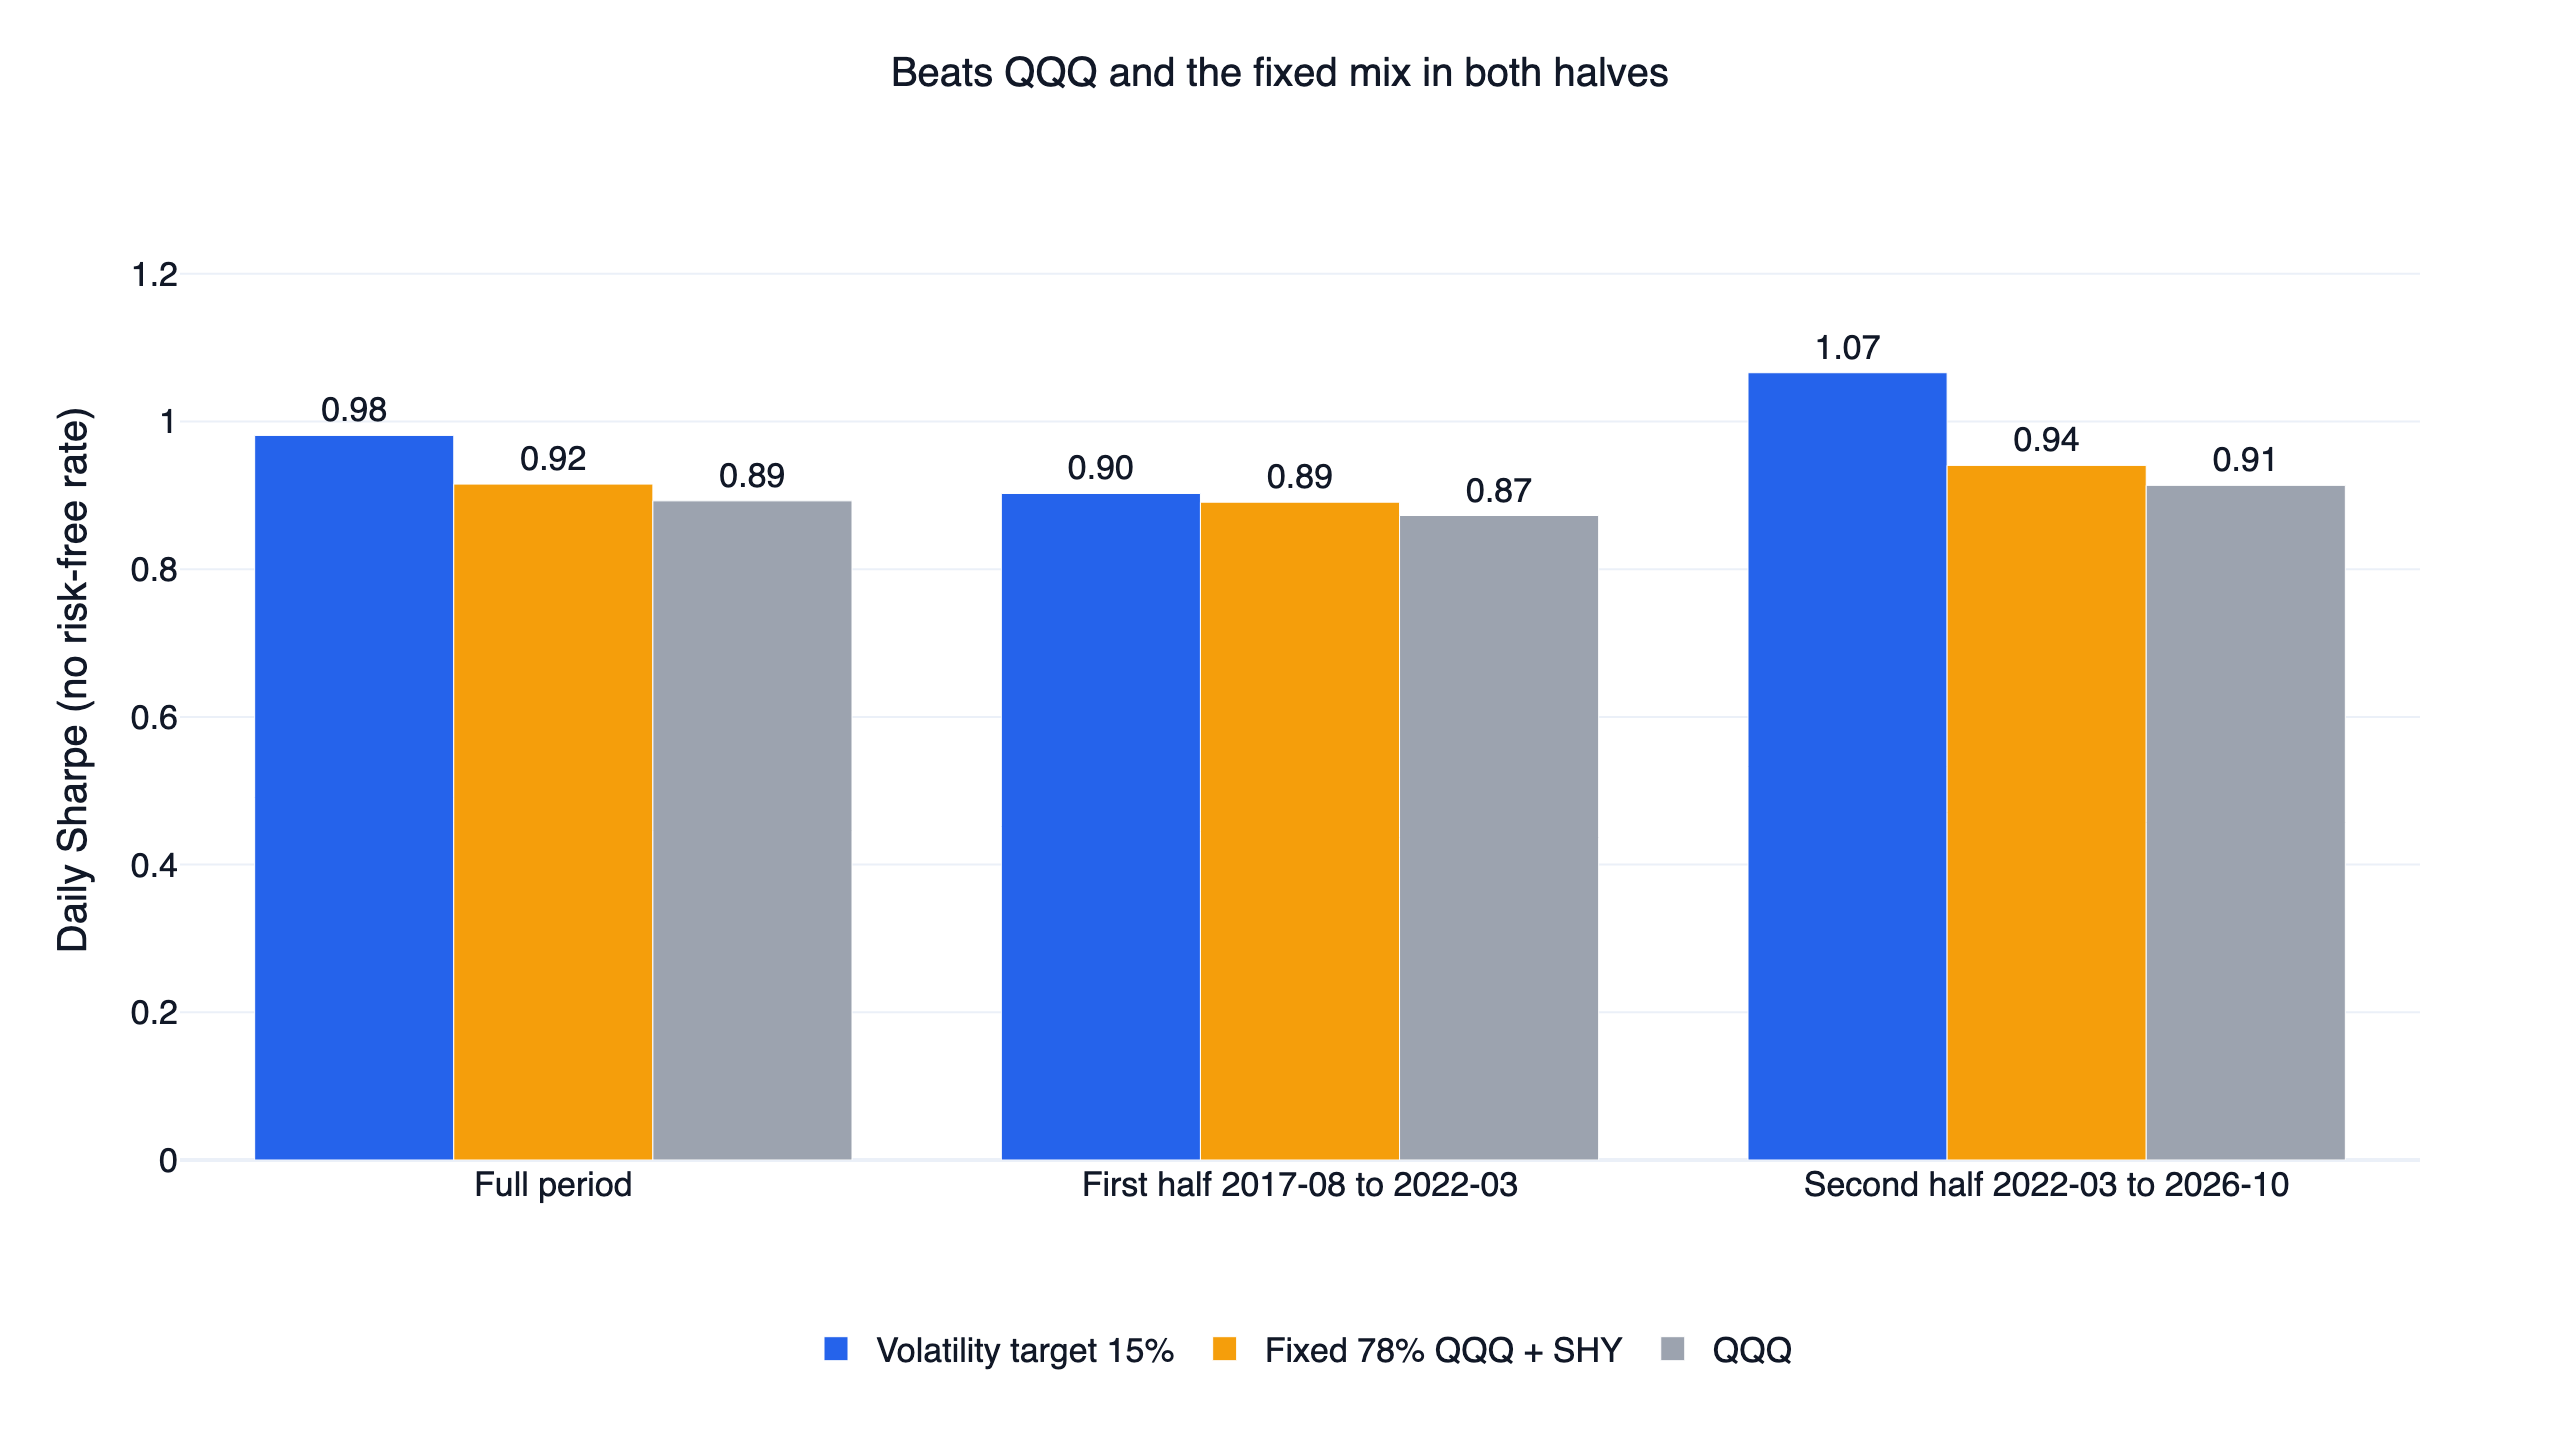
2. Both halves: wins both. The backtest splits on 2022-03-14. First half (2017-08 to 2022-03): Sharpe 0.90 against 0.87 for QQQ. Second half (2022-03 to 2026-10): 1.07 against 0.91. The first-half lead is small, and the fixed mix scored 0.89 there, only 0.01 behind.
3. Trading costs: passes. finlab charges no commission or tax on US trades by default, so we reran it with 0.1% on every buy and sell: 15.3% a year and a Sharpe of 0.96, still above QQQ. One-way turnover between QQQ and SHY is about 178% of the account a year, which costs about 0.4 percentage points a year at that rate.
Does it still win net of T-bills?
Our Sharpe deducts no risk-free rate. That barely matters for a strategy that is mostly in stocks, but it flatters anything holding short Treasuries: SHY on its own scores 1.11, above QQQ. So we also computed the Sharpe on returns above the T-bill ETF BIL:
| Period | Volatility target | Fixed 78% QQQ | QQQ |
|---|---|---|---|
| Full | 0.83 | 0.78 | 0.79 |
| First half | 0.85 | 0.84 | 0.83 |
| Second half | 0.81 | 0.72 | 0.74 |
Net of T-bills, the base setting still beats QQQ over the full period and in both halves, while the fixed mix loses over the full period and the second half. On this measure, though, only 6 of the 9 neighbouring settings win, below the bar of 7, and the first-half lead is 0.01.
We also recomputed everything with 2022 removed: volatility targeting scores 1.25, QQQ 1.25 and the fixed 78% mix 1.29. Outside 2022, volatility targeting tied QQQ and trailed the fixed mix with the same average exposure. So the conclusion stays modest: over this period volatility targeting improved QQQ's risk-adjusted return by a small margin, and almost all of the gain came from a long high-volatility bear market, 2022.
Why it worked, and when it fails
The return source is that QQQ did not earn more in the month after a volatile stretch. While that holds, cutting exposure trades a little return for a lot of risk. In the falls of December 2018, March 2020, 2022 and April 2025, an earlier leg down had already lifted volatility before the steepest month, and the strategy entered those months with QQQ weights of 54%, 53%, 64% and 55%.
Where it loses is just as clear:
- V-shaped rebounds. From May to August 2020, volatility was still high while prices recovered, and the QQQ weight sat between 36% and 74%.
- Strong bull years. In 2019 and 2023, when QQQ returned 39% and 55%, the strategy trailed by 12 to 14 percentage points.
- It does not work everywhere. Cederburg et al. (2020) applied the same scaling to 103 equity strategies and found that most volatility-managed versions did not beat the originals out of sample. Harvey et al. (2018) found volatility targeting helps most for equities and credit, which tend to fall when volatility rises, and little for bonds and commodities. We tested one asset, QQQ.
Among the validated US strategies on this site, this is the only one with no leveraged ETF. The US low-volatility strategy switches on QQQ's 200-day average and six-month return and holds a 2x leveraged ETF on offence, which magnifies both returns and drawdowns, and the leveraged ETF timing backtest covers what financing costs and volatility decay do to those funds. For a lower drawdown without leverage, volatility targeting is the simpler choice.
The same study tested three other holding styles, market-neutral long-short, large caps each held above their 200-day average, and cross-asset time-series momentum. None passed; details are in the long-short equity and trend following backtest.
The code
The core is three steps: compute the 21-day realized volatility, turn it into a QQQ weight, rebalance at month end.
Show Code
import finlab
import pandas as pd
from finlab import data
from finlab.backtest import sim

finlab.login()  # finlab guides you through login automatically
data.set_market("us_fund")

# 1. QQQ and SHY adjusted prices; drop the blank market-holiday rows
close = data.get("us_fund_price:adj_close")[["QQQ", "SHY"]].dropna()

# 2. Annualized realized volatility over the last 21 trading days
daily_return = close["QQQ"].pct_change(fill_method=None)
volatility = daily_return.rolling(21).std() * 252 ** 0.5

# 3. QQQ weight = 15% / volatility, at most 100%, the rest in SHY
qqq_weight = (0.15 / volatility).clip(upper=1)
position = pd.DataFrame({"QQQ": qqq_weight, "SHY": 1 - qqq_weight}).loc["2017-07-31":]

# 4. Rebalance on the last trading day of each month, fill at the next close
report = sim(position, resample="M", trade_at_price="close", upload=False)
print(report.get_stats()["cagr"])
With data through 2026-10-29 this prints 0.1566. The full strategy.py adds --validate, which runs the 9 neighbouring settings, both halves, the 0.1% cost run and the fixed-mix control, and prints the numbers quoted above.
Install the FinLab skill for your AI agent
You do not need to write the code yourself. Install the FinLab skill in Claude Code, Codex or Gemini CLI with one command:
Show Code
npx skills add https://github.com/koreal6803/finlab-ai --skill finlabThen ask your agent in plain language, for example "rerun the QQQ volatility target at 12% with a 15-day window" or "swap SHY for BIL and compare". The AI agent setup page walks through each tool, the AI-assisted setup connects your FinLab account, and the same research runs in the browser at studio.finlab.finance.
Backtest method and limits
| Item | What we did |
|---|---|
| Window | 2017-08-01 to 2026-10-29. FinLab's US ETF prices start in 2016; the start matches the other designs in this study, so the long-short strategies that need a year of filings are comparable. |
| Assets | QQQ (Nasdaq-100) and SHY (1-3 year US Treasuries), adjusted prices from us_fund_price, dividends reinvested. |
| Look-ahead | Volatility uses daily returns up to the month end only; trades fill at the next day's close. |
| Weights | QQQ = min(1, 15% / 21-day realized volatility), the rest in SHY. No leverage, no shorting. |
| Costs | finlab sim() US default: no commission, no tax. Rerun with 0.1% per side (see the checks). No slippage model; both ETFs are highly liquid. |
| Turnover | About 178% one-way a year (sum of QQQ weight changes). |
| Benchmark | QQQ buy and hold with dividends, same days, no costs. Daily Sharpe without a risk-free rate, plus a version net of BIL returns. |
| Sample | About nine years, all in sample. The 15% target and 21-day window are common defaults, not values picked on this data; the two halves are a stability check, not an out-of-sample test. |
| Software | finlab 2.2.24. pandas 2.2 and 3.1 give identical results. |
FAQ
What is a volatility targeting strategy? A rule that scales a position by its recent volatility so the portfolio's risk stays near a fixed level. Here the QQQ weight is 15% divided by 21-day realized volatility, capped at 100%, with the rest in short-term Treasuries.
Does volatility targeting beat buying and holding QQQ? Not on return from 2017 to 2026: 15.7% a year against 19.8%. It wins on risk-adjusted return (Sharpe 0.98 against 0.89) and drawdown (-22.8% against -35.1%), and that edge comes mainly from 2022.
What target volatility should I use? We tested 10%, 15% and 20%; with a 10- or 21-day window all three beat QQQ. A lower target holds less QQQ on average and earns less; at 20% the Sharpe was 0.96.
How many days of returns should the volatility estimate use? 10 and 21 days were similar; 42 days was clearly worse, and both losing settings used it. A longer window cuts exposure later.
Why SHY instead of cash?
SHY holds 1-3 year Treasuries, so it is low-risk and pays interest. We did not test cash or BIL; set SAFE = "BIL" in strategy.py to compare.
Can I add leverage to bring the average exposure back to 100%? We did not test it. The original paper scales the portfolio to the asset's long-run volatility, using leverage when needed; we did not compute that version, and borrowing costs or leveraged-ETF decay would have to be subtracted.
Do I need to watch the market every day? No. Compute the weight once after the month-end close and adjust the QQQ/SHY split the next day.
Reproduce it yourself
- strategy.py: the strategy,
--validatefor the three checks and the fixed-mix control, and--exportfor the two files below. - data.csv: daily equity of the strategy and QQQ with dividends.
- metrics.json: the headline statistics.
The research program covering all five holding styles, including this one, the fixed-mix control and the T-bill version, is in the downloads of the long-short equity and trend following backtest. More US research is in the US quant trading strategies overview and the lazy portfolio backtest. The team behind it is on the about page, examples of what users build are on use cases, and metric definitions are in the glossary.
Last updated: 2026-10 | Backtest window: 2017-08 to 2026-10 | Benchmark: QQQ total return | Author: FinLab Quant Research (reviewed by a quantitative researcher)
Past performance does not represent future results, and every result here is an in-sample backtest. This content is for education only, is not investment advice, and does not constitute investment advice.
FinLab AI
Want to build your own strategy?
Describe your stock-picking ideas in natural language. AI automatically validates, backtests, and gives you answers
Start Free