Run this strategy
Copy the prompt to reproduce the evidence above with the article’s data, assumptions, and risk checks.
Tell your AI:
Set up FinLab and compare TQQQ buy and hold with a 200-day moving average rule. Please read: https://finlab.finance/en/setup?relatedUrl=/en/blog/leveraged-etf-timing-backtest
We backtested seven common leveraged ETF timing rules from January 2017 to October 2026. The best known is "hold TQQQ while QQQ is above its 200-day moving average, switch to Treasury bills when it is below." It compounded at 45.1% a year and cut the maximum drawdown from -81.7% (TQQQ held outright) to -60.9%, with a daily Sharpe ratio of 0.99 against 0.95 for QQQ with dividends reinvested. It still failed our three robustness checks: only 4 of 9 neighbouring settings of the moving average length and buffer beat QQQ, and in the first half of the test (2017 to 2021) its Sharpe of 1.16 trailed QQQ's 1.23. The other six rules (QLD, UPRO and SOXL each with a 200-day filter, golden crosses on QQQ and on SPY, and the 55/45 UPRO/TMF mix known as HEDGEFUNDIE's excellent adventure) did not clear all three checks either. The closest was QLD with the 200-day filter: 7 of 9 settings beat QQQ and it survived trading costs, failing only in the first half.
All seven rules are simple: one leveraged ETF plus one moving average, or one fixed mix. The question is narrow: over the last decade, would any of them have beaten simply owning QQQ on a risk-adjusted basis? The 200-day rules on TQQQ, QLD and SOXL earned far more than QQQ; on risk-adjusted terms the best were only slightly ahead, and that lead did not survive a change of parameters or of period.
The seven rules at a glance
| Rule | CAGR | Daily Sharpe | Max drawdown | Settings beating QQQ | First / second half Sharpe | Sharpe with 0.1% per side | Verdict |
|---|---|---|---|---|---|---|---|
| TQQQ + QQQ 200-day MA | 45.1% | 0.99 | -60.9% | 4 / 9 | 1.16 / 0.83 | 0.98 | Fail |
| QLD + QQQ 200-day MA | 33.4% | 1.01 | -44.8% | 7 / 9 | 1.15 / 0.88 | 1.00 | Fail (first half only) |
| UPRO + SPY 200-day MA | 22.7% | 0.74 | -52.9% | 1 / 9 | 0.93 / 0.55 | 0.73 | Fail |
| SOXL + SOXX 200-day MA | 40.9% | 0.84 | -83.9% | 0 / 9 | 1.18 / 0.56 | 0.83 | Fail |
| QQQ golden cross (50/200) | 19.1% | 0.99 | -28.6% | 4 / 9 | 1.12 / 0.86 | 0.98 | Fail |
| SPY golden cross (50/200) | 10.6% | 0.73 | -33.7% | 0 / 9 | 0.65 / 0.87 | 0.72 | Fail |
| UPRO/TMF 55/45, quarterly | 14.5% | 0.58 | -70.7% | 0 / 9 | 1.32 / -0.01 | 0.57 | Fail |
| QQQ total return | 20.9% | 0.95 | -35.1% | benchmark | 1.23 / 0.69 | — | benchmark |
| SPY total return | 15.1% | 0.87 | -33.7% | reference | 0.94 / 0.80 | — | reference |
| TQQQ buy and hold | 39.6% | 0.84 | -81.7% | reference | 1.17 / 0.53 | — | reference |
| QLD buy and hold | 33.1% | 0.86 | -63.7% | reference | 1.17 / 0.57 | — | reference |
| UPRO buy and hold | 27.9% | 0.73 | -76.8% | reference | 0.86 / 0.61 | — | reference |
| SOXL buy and hold | 40.2% | 0.85 | -90.5% | reference | 1.10 / 0.67 | — | reference |
Every rule runs from 2017-01-04 to 2026-10-27, and the benchmark and reference rows cover the same days with dividends reinvested. The halves split on 2021-11-30; QQQ's daily Sharpe was 1.23 in the first half and 0.69 in the second.
How a rule had to pass
"Beats QQQ" has one meaning here: a higher daily Sharpe ratio than buying and holding QQQ with dividends reinvested, over exactly the same trading days. Daily Sharpe is the mean daily return divided by its standard deviation, times √252, with no risk-free rate. A rule counts as working only if it clears all three checks:
- Neighbouring parameters. Each of the two main parameters takes its original value and one step either side, nine settings in all, and at least seven must beat QQQ. The four 200-day rules vary the moving average length (150, 200, 250 days) and the buffer (0%, 1%, 2%). The two golden crosses vary the short average (40, 50, 60 days) and the long one (150, 200, 250 days). UPRO/TMF varies the UPRO weight (45%, 55%, 65%) and how often it rebalances (monthly, quarterly, half-yearly).
- Both halves. The window is split at its midpoint, 2021-11-30, and the original settings must beat QQQ in each half on its own. The first half holds two fast sell-offs, late 2018 and March 2020; the second holds the long 2022 bear market.
- Trading costs. finlab's US market defaults to zero commission and zero transfer tax, matching US zero-commission brokers, so the main backtests pay no costs. This check charges 0.1% on every buy and every sell (
fee_ratio=0.001) to stand in for spreads and slippage.
The rules and parameter grids were fixed before the first backtest ran, and nothing was changed after the results came in.
The seven rules
Both the 200-day average and the golden cross are old ideas. Brock, Lakonishok & LeBaron (1992) tested moving average rules on the Dow from 1897 to 1986, including price against its 200-day average and crossovers such as 5-day against 150-day, each with and without a 1% band. Returns after buy signals were higher than after sell signals, and returns after sell signals were more volatile. Faber (2007) applied a 10-month average, roughly 200 trading days, to stocks, bonds, real estate and commodities, and kept most of the equity return with much smaller drawdowns. The four 200-day rules here use the same 1% band:
- TQQQ + QQQ 200-day MA. Hold TQQQ (3x Nasdaq-100) once QQQ's dividend-adjusted close is more than 1% above its 200-day average; move everything to BIL (1-3 month Treasury bills, effectively cash) once it closes more than 1% below. Inside the band, keep the current holding.
- QLD + QQQ 200-day MA. The same signal, holding QLD (2x Nasdaq-100).
- UPRO + SPY 200-day MA. SPY's 200-day average drives UPRO (3x S&P 500).
- SOXL + SOXX 200-day MA. The semiconductor ETF SOXX drives SOXL (3x semiconductors).
- QQQ golden cross. Hold QQQ while its 50-day average is above its 200-day average; after the death cross, hold BIL.
- SPY golden cross. The same rule on SPY.
- UPRO/TMF 55/45. 55% UPRO and 45% TMF (3x 20+ year Treasuries), reset to those weights on the last trading day of every quarter. The mix spread on the Bogleheads forum in 2019 as "HEDGEFUNDIE's excellent adventure"; the idea is that long bonds rally when stocks crash and offset the 3x equity drawdown.
The first six rules check their signal at every close and trade at the next day's close whenever it flips. All prices are FinLab's dividend-adjusted US fund prices, us_fund_price:adj_close.
Checking the leveraged ETF prices first
One bad day of prices in a leveraged ETF is enough to break a backtest, so each fund's daily return was compared with its leverage multiple times the daily return of the ETF it tracks, over 2016-01 to 2026-10:
| Leveraged ETF | Compared with | Daily correlation | Fitted multiple | Average yearly lag | Days off by more than 2% |
|---|---|---|---|---|---|
| TQQQ | 3 x QQQ | 0.9989 | 2.96 | 7.8% | 1 |
| QLD | 2 x QQQ | 0.9993 | 2.00 | 3.8% | 1 |
| UPRO | 3 x SPY | 0.9990 | 2.99 | 7.0% | 5 |
| SOXL | 3 x SOXX | 0.9975 | 2.95 | 9.2% | 9 |
| TMF | 3 x TLT | 0.9975 | 2.94 | 6.8% | 4 |
All five correlate above 0.997 with fitted multiples close to 2 or 3, so all five were used. The yearly lag of about 4% to 9% is the expense ratio plus the cost of borrowing to build the leverage. A 3x fund borrows twice its assets, so it lags about twice as much as a 2x fund, and the lag grows with interest rates: TQQQ lagged 2% to 8% a year in 2016-2022 and 11% to 14% a year from 2023. The few days off by more than 2% mostly fall in March 2020 and April 2025, days when the underlying index itself moved violently. These costs are already inside the ETF prices, so the backtests do not deduct them again.
Result 1: the 200-day rule cut TQQQ's losses but only tied QQQ on risk
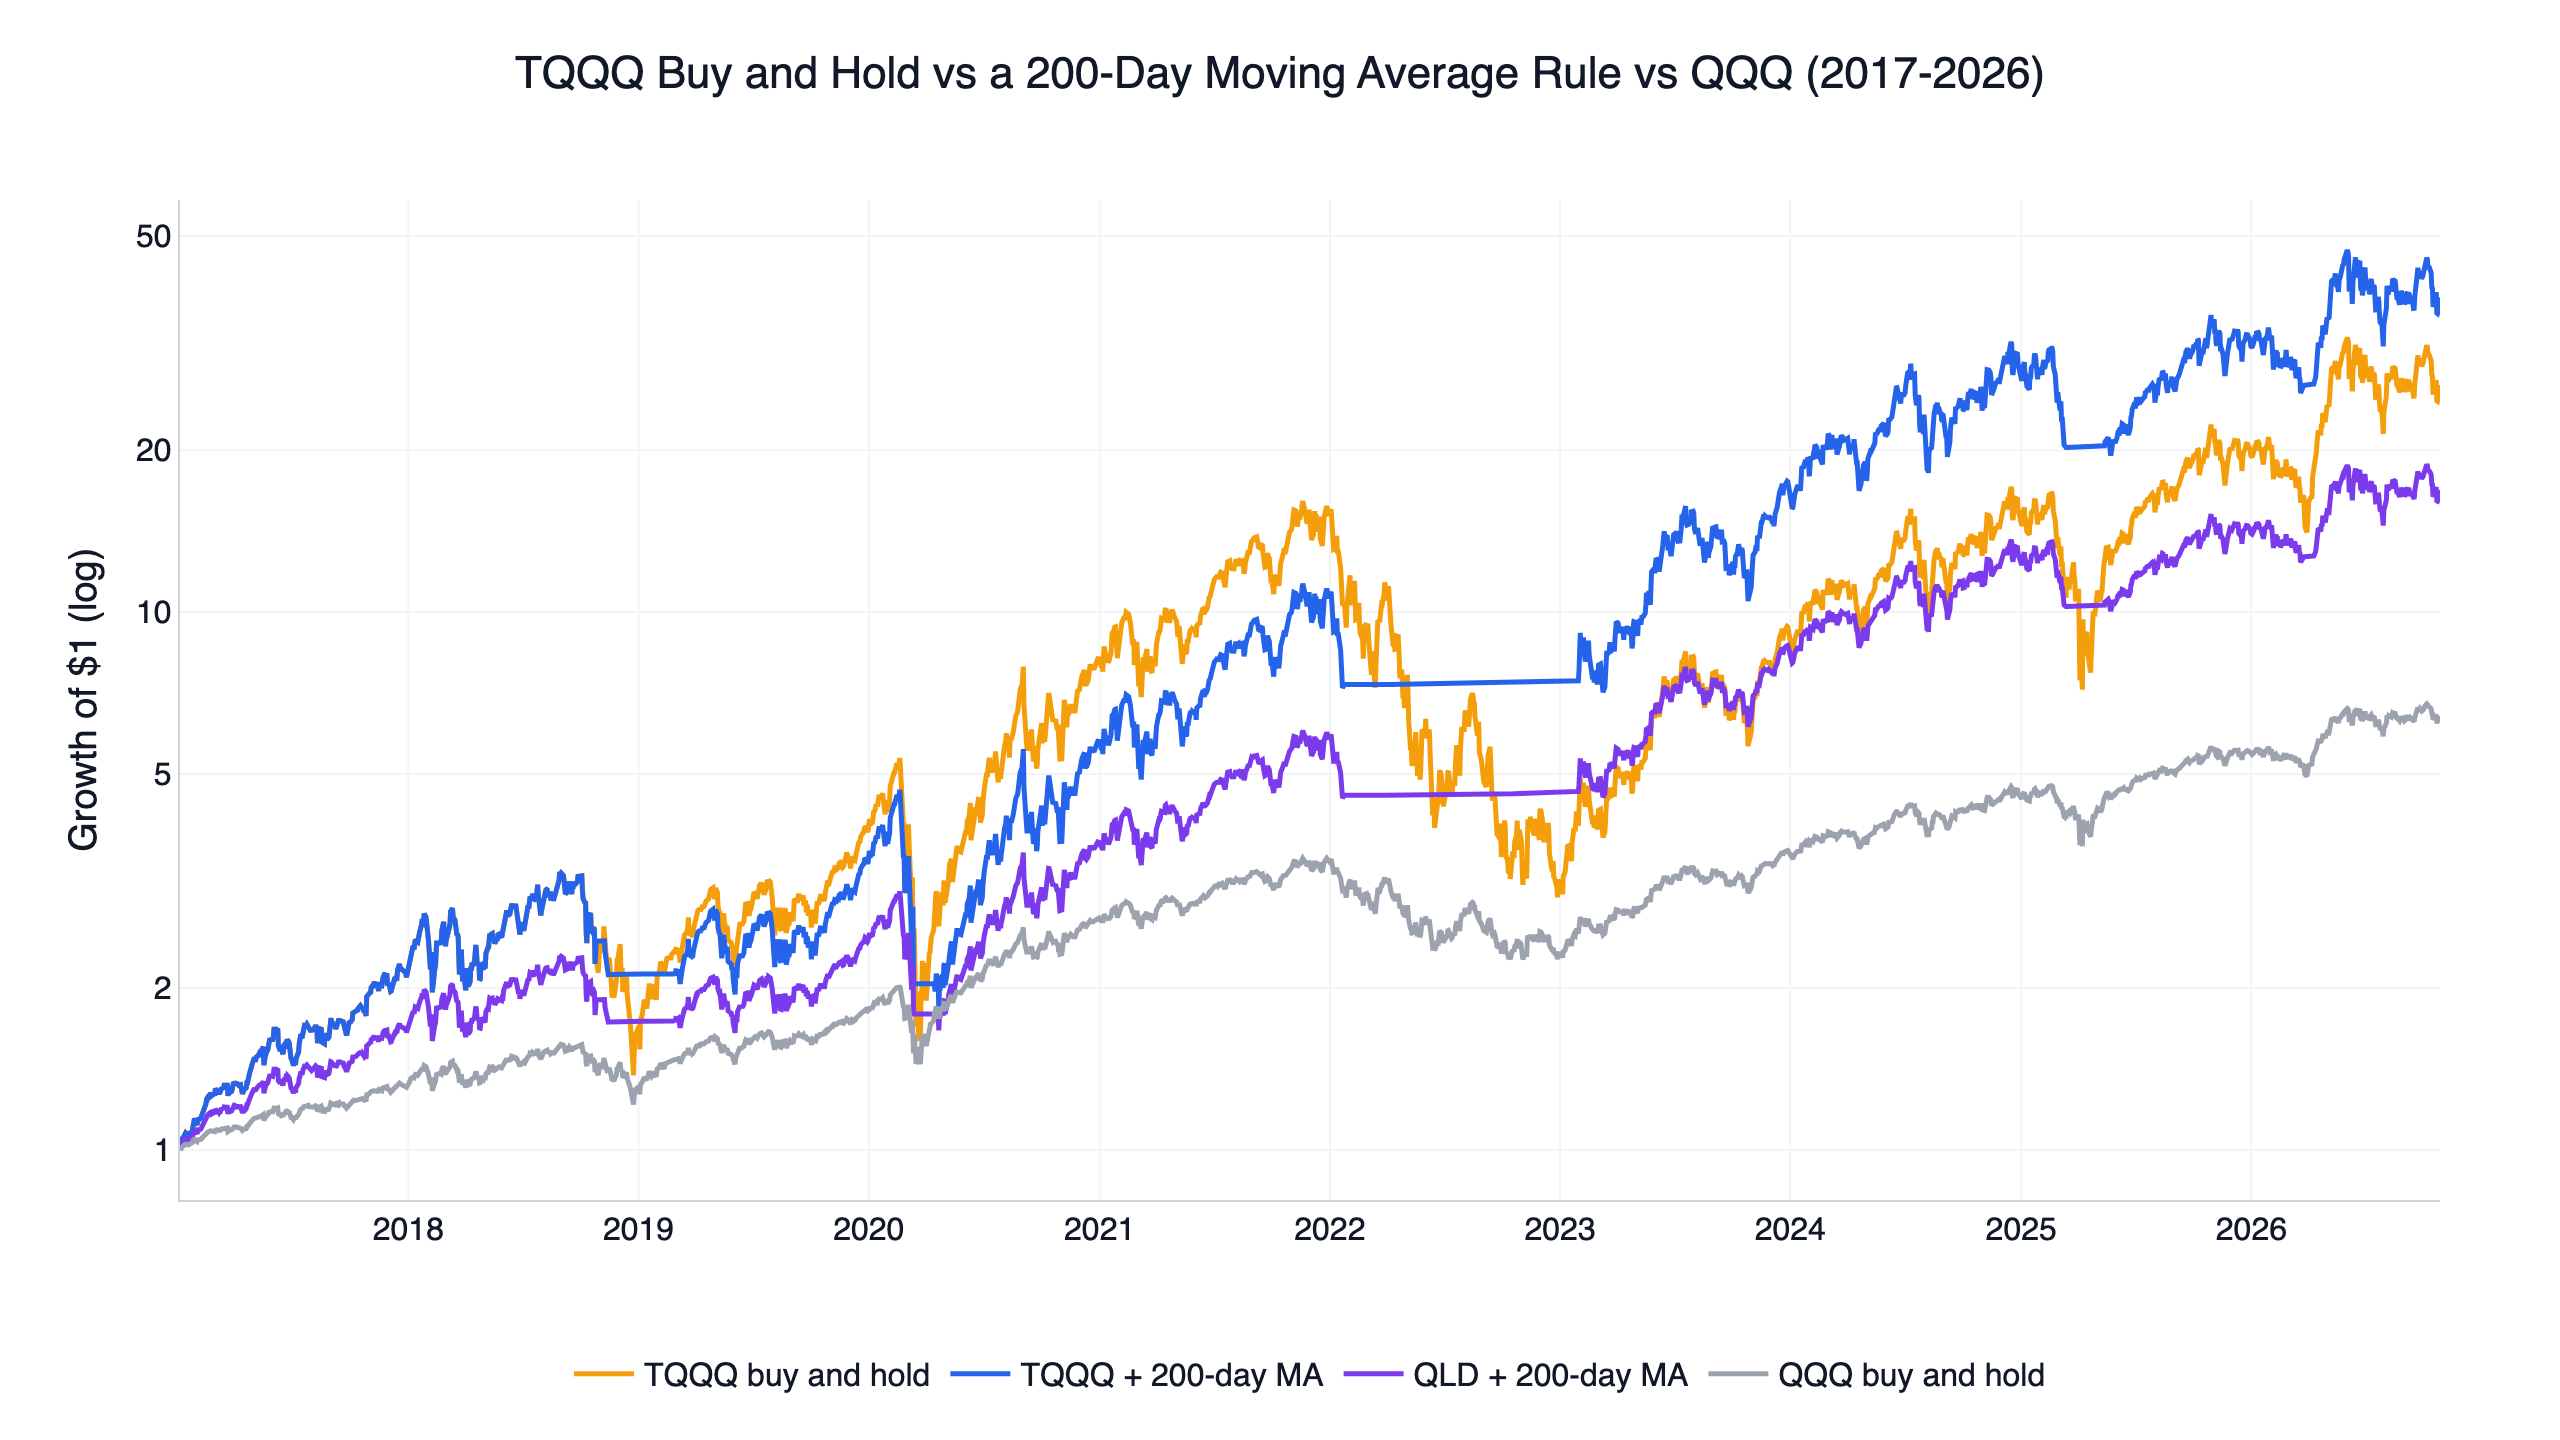
The chart at the top rebases all four lines to 26.4, TQQQ with the 200-day rule near 16.9, and QQQ at $6.4. On return alone, leverage plus timing is far ahead.
That return came with far more volatility. TQQQ with the 200-day rule ran at 51.1% annualised volatility, more than twice QQQ's 22.8%, and its daily Sharpe of 0.99 against QQQ's 0.95 means each unit of risk bought only slightly more return. Where the moving average helped most was drawdown:
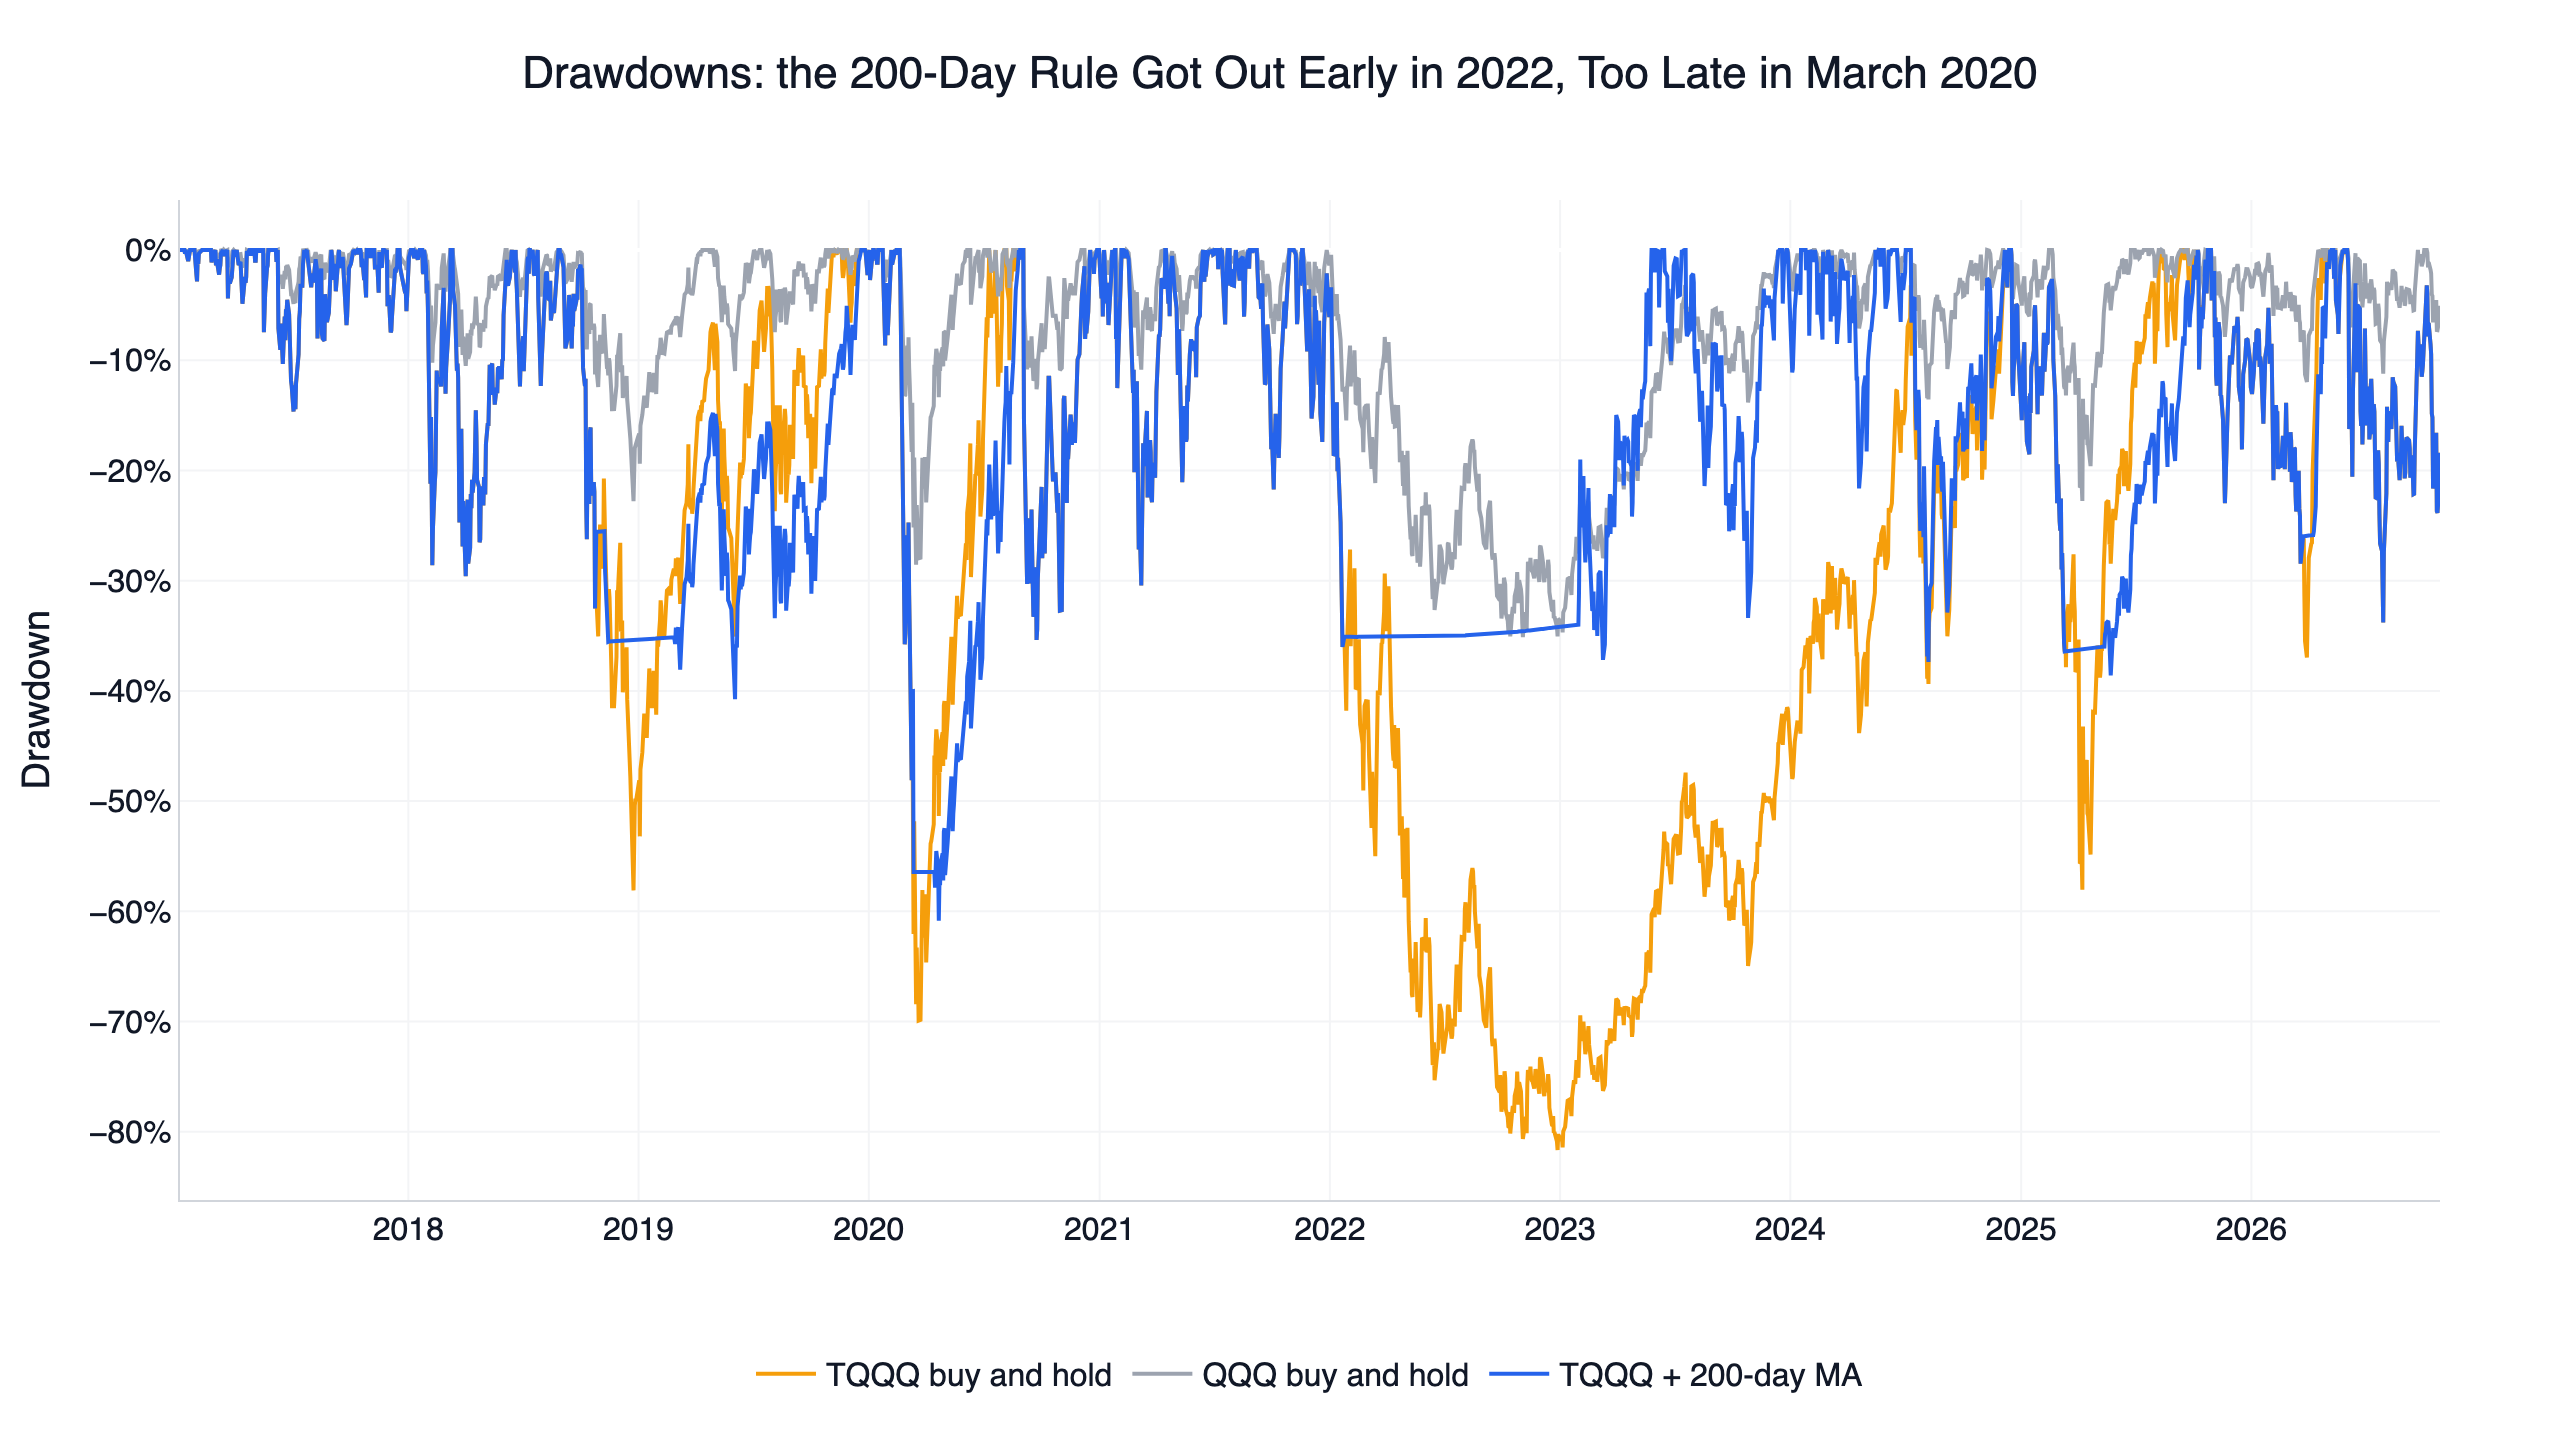
TQQQ held outright fell from its 2021-11-19 high to 2022-12-28, a -81.7% drawdown that took until December 2024 to recover. The 200-day rule flashed a sell at the close of 2022-01-21, moved to Treasury bills on the next trading day, and TQQQ fell another 61.6% while it sat out. The rule lost 29.9% in 2022; TQQQ lost 79.1%.
The rule's own maximum drawdown, -60.9%, came in February to April 2020, when the 200-day average could not keep up. Here is every exit it made in the decade:
| Exit to T-bills | Back into TQQQ | Trading days out | TQQQ move while out |
|---|---|---|---|
| 2018-10-25 | 2018-11-08 | 10 | +4.6% |
| 2018-11-13 | 2019-02-26 | 69 | +5.5% |
| 2019-06-04 | 2019-06-06 | 2 | +4.6% |
| 2020-03-10 | 2020-03-11 | 1 | -12.9% |
| 2020-03-12 | 2020-04-14 | 22 | +42.7% |
| 2022-01-24 | 2023-01-30 | 255 | -61.6% |
| 2025-03-11 | 2025-05-13 | 44 | +17.3% |
| 2026-03-23 | 2026-04-09 | 12 | +10.0% |
In 6 of the 8 exits, TQQQ rose while the rule was out, and the rule bought back higher. Only two exits avoided a fall, and one of them lasted a single day. March 2020 shows the limit of the method. QQQ closed more than 1% below its average on March 9 and the rule sold the next day. On March 10 QQQ bounced back more than 1% above the average, so the rule bought TQQQ again at the close on March 11. That same day QQQ fell back below the band, but a switch only happens at the next day's close, so the rule took TQQQ's 27.4% fall on March 12 before getting out, and then missed a 42.7% rebound before mid-April. Across the whole window the rule held TQQQ on 83.2% of trading days and switched 1.6 times a year on average.
The full interactive backtest of TQQQ with the 200-day rule is below; drawdowns, monthly returns and every trade can be inspected:
Result 2: across 9 neighbouring settings, only QLD reached 7 of 9
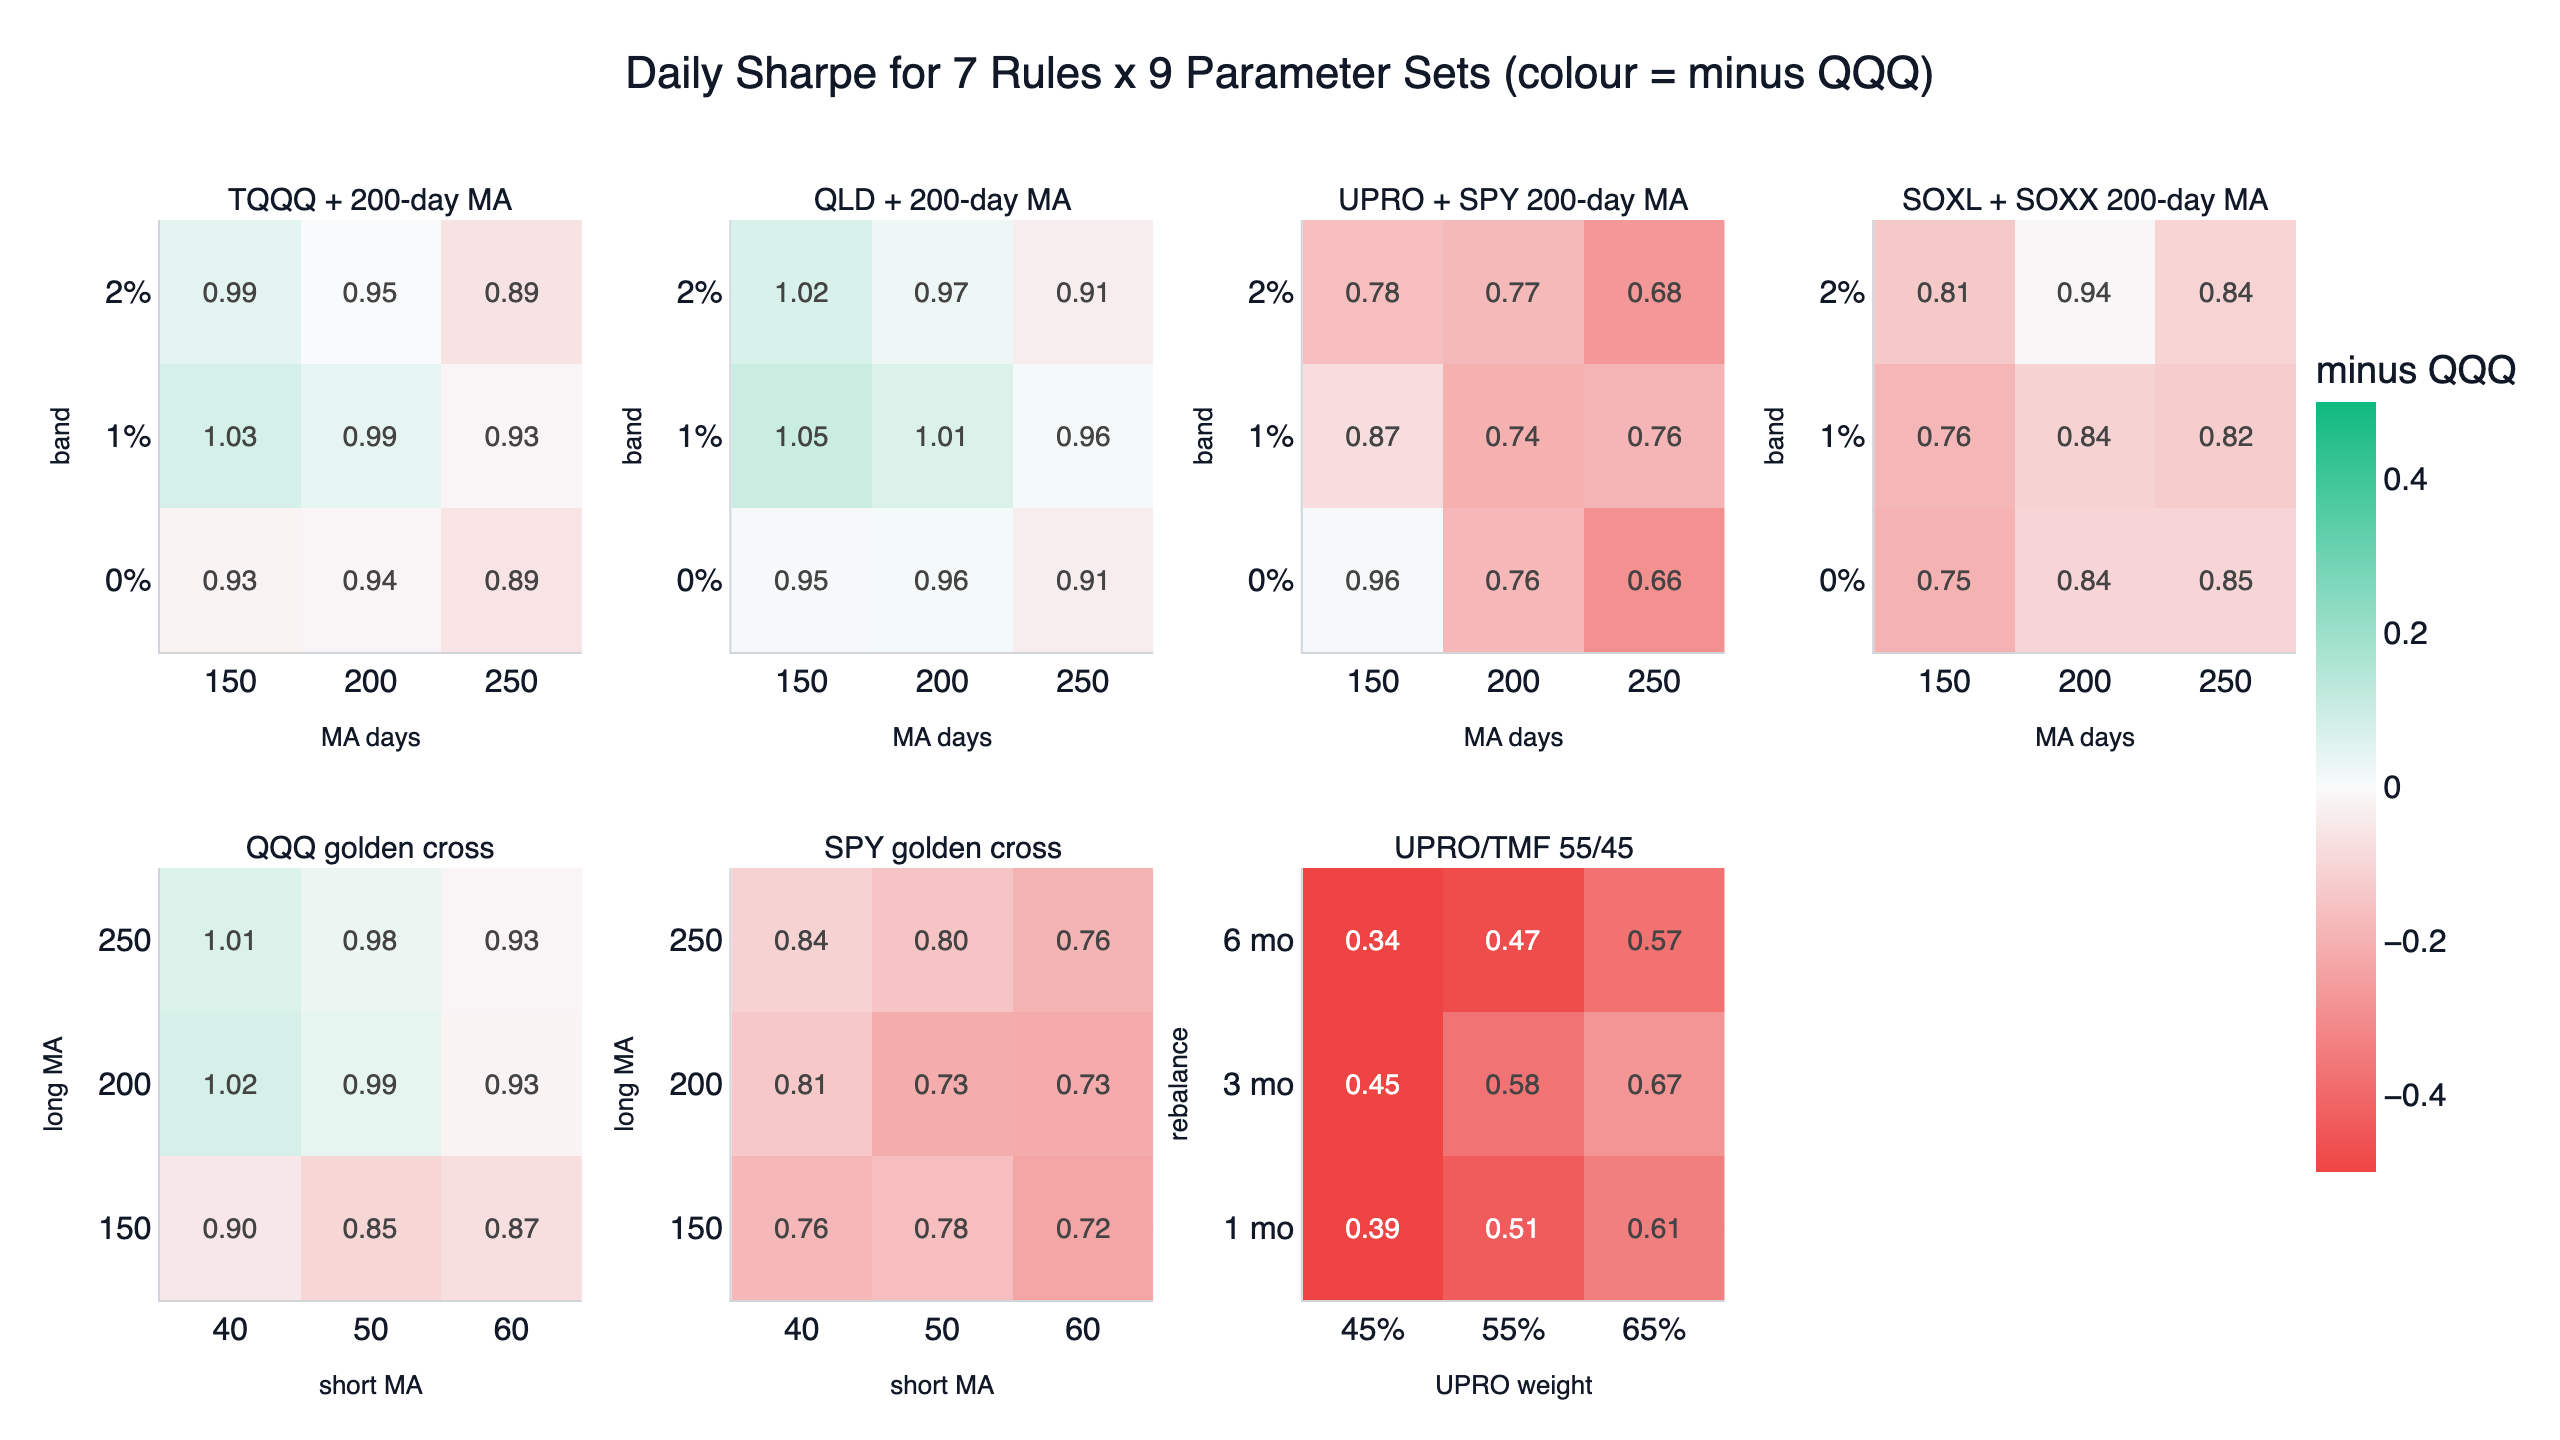
Each small cell is one setting of one rule, with its daily Sharpe printed inside; green beats QQQ's 0.95 and red loses.
- TQQQ + 200-day MA: 0.89 to 1.03, 4 of 9 beat QQQ. The plain 200-day average with no buffer scores 0.94 and loses. The four winners all use a 150- or 200-day average with a 1% or 2% buffer, and the 200-day, 2% setting wins by 0.0002, effectively a tie. With a 250-day average all three settings lose.
- QLD + 200-day MA: 0.91 to 1.05, 7 of 9 beat QQQ, exactly the pass mark. The 250-day row is again the weakest.
- UPRO + SPY 200-day MA: 0.66 to 0.96. Only the 150-day, no-buffer setting wins, at 0.96.
- SOXL + SOXX 200-day MA: 0.75 to 0.94, all nine lose.
- QQQ golden cross: 0.85 to 1.02, 4 wins, all with a 200- or 250-day long average and a 40- or 50-day short one. With a 150-day long average every setting loses.
- SPY golden cross: 0.72 to 0.84, all nine lose.
- UPRO/TMF: 0.34 to 0.67, all nine lose by the widest margin.
TQQQ and QLD follow the identical signal and differ only in leverage, yet QLD's grid sits a step higher everywhere. The price-check table above explains it: the 3x fund lags about 4 percentage points a year more, enough to turn a passing signal into a failing one.
Result 3: no moving average rule beat QQQ in the first half
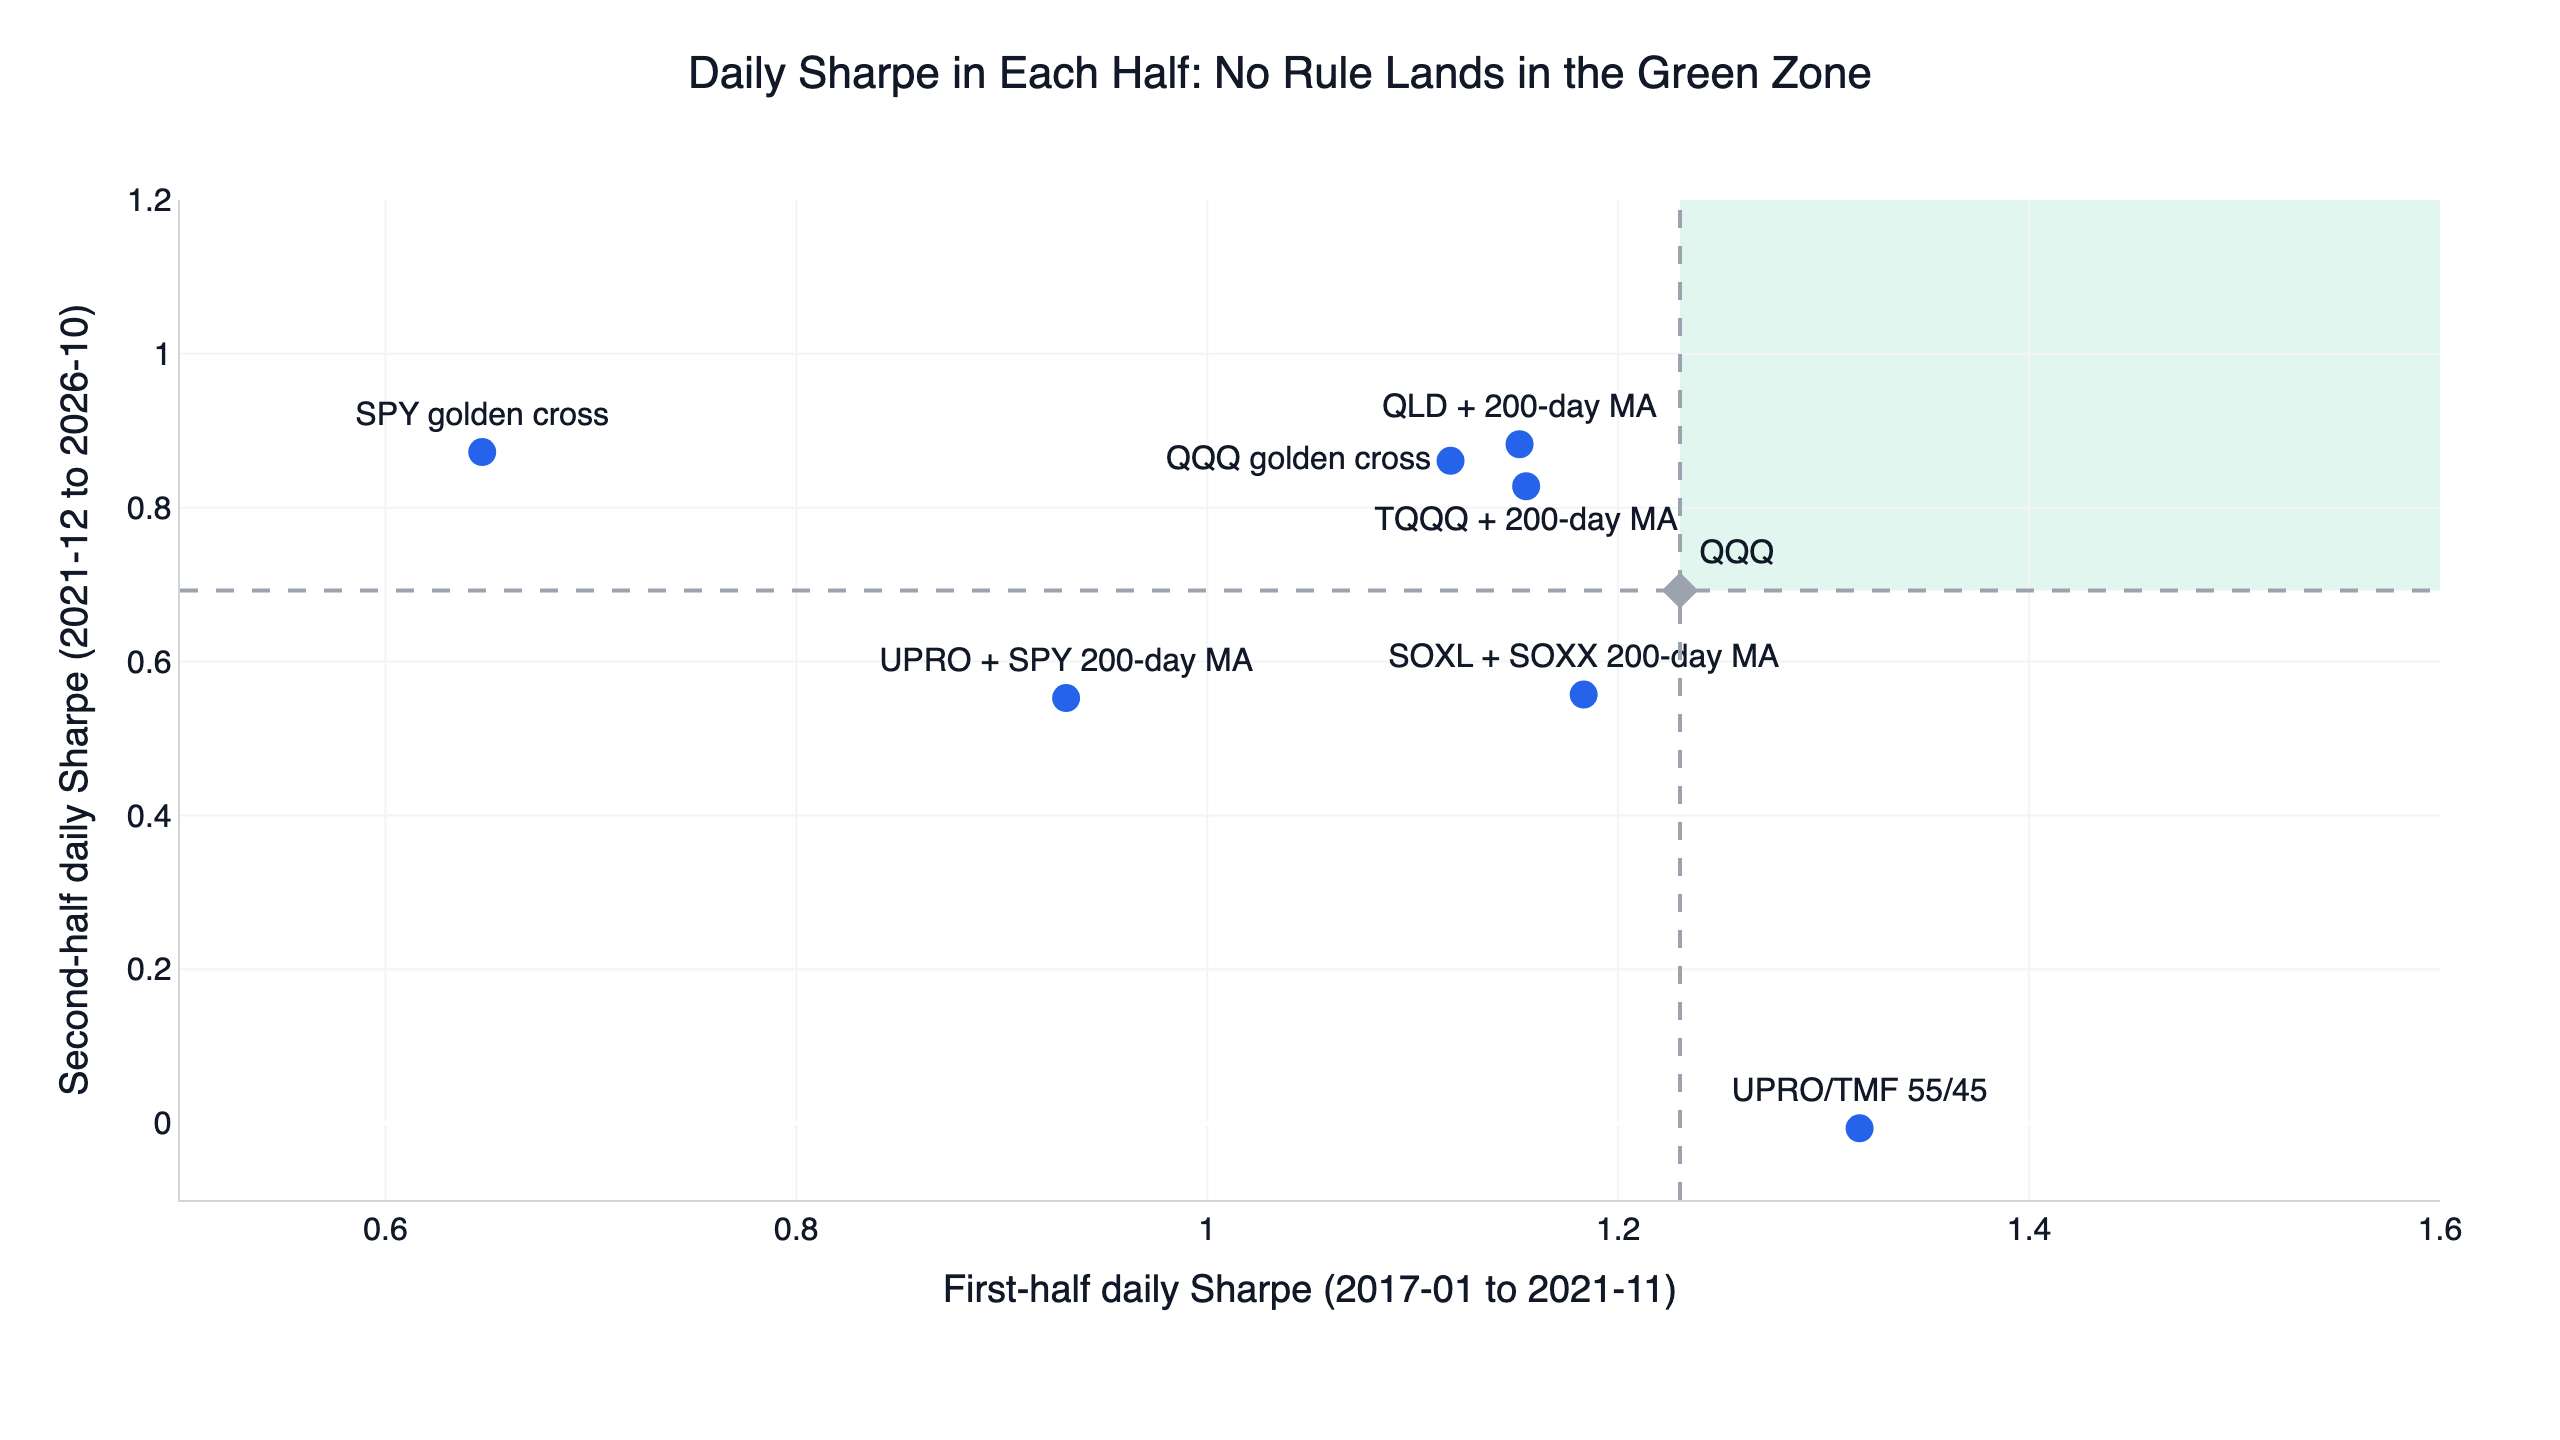
To pass, a point must sit in the green zone: above QQQ's 1.23 in the first half and above its 0.69 in the second.
The first half (2017-01 to 2021-11) was a strong bull market for QQQ, with a daily Sharpe of 1.23, and all six timing rules lost; the closest was SOXL with its filter at 1.18. The two sell-offs in that half were short. The late-2018 decline bottomed at the end of December and rebounded quickly, and in 2020 QQQ went from peak to trough in about a month. Both times the moving average rules sold well after the fall had started and bought back well after the rebound had begun.
The second half (2021-12 to 2026-10) contains the long 2022 bear market. QQQ's Sharpe dropped to 0.69, and TQQQ, QLD and both golden crosses beat it because they got out early in 2022 and missed most of the decline. A moving average rule earns back the cost of all its whipsaws in one long, deep bear market, and the decade contained only one.
UPRO/TMF was the only rule to win the first half (1.32), but its second-half Sharpe was -0.01, and its value fell 29% from December 2021 to October 2026.
Why they fail: leverage costs, fast sell-offs, and 2022
First, leveraged ETFs have a lower Sharpe ratio than what they track. Before costs, a leveraged ETF's daily return is exactly two or three times the index's, so return and volatility scale together and daily Sharpe stays the same. In practice TQQQ held outright had a daily Sharpe of 0.84 against QQQ's 0.95; UPRO 0.73 against SPY's 0.87; SOXL 0.85 against SOXX's 0.94. The gap is almost exactly the yearly cost in the price-check table divided by the fund's volatility: for TQQQ, 7.8% / 67.3% is about 0.12, and 0.95 minus 0.12 is 0.83 against an actual 0.84; UPRO and SOXL also land within about 0.01. The 200-day rule lifted TQQQ's Sharpe from 0.84 to 0.99, a little more than that cost gap, and the results above show the lift came mostly from sitting out 2022.
The daily reset matters for compounded returns rather than for daily Sharpe. Cheng & Madhavan (2009) work out why these funds must rebalance in the direction of the market every day near the close, and Avellaneda & Zhang (2010) show that their long-run return depends on the path of the index: for the same net move, more volatility means a larger shortfall against the leverage multiple times the index return. This shortfall is usually called leveraged ETF decay. Setting TQQQ's actual yearly return beside three times QQQ's calendar-year return shows that it is not a loss every year:
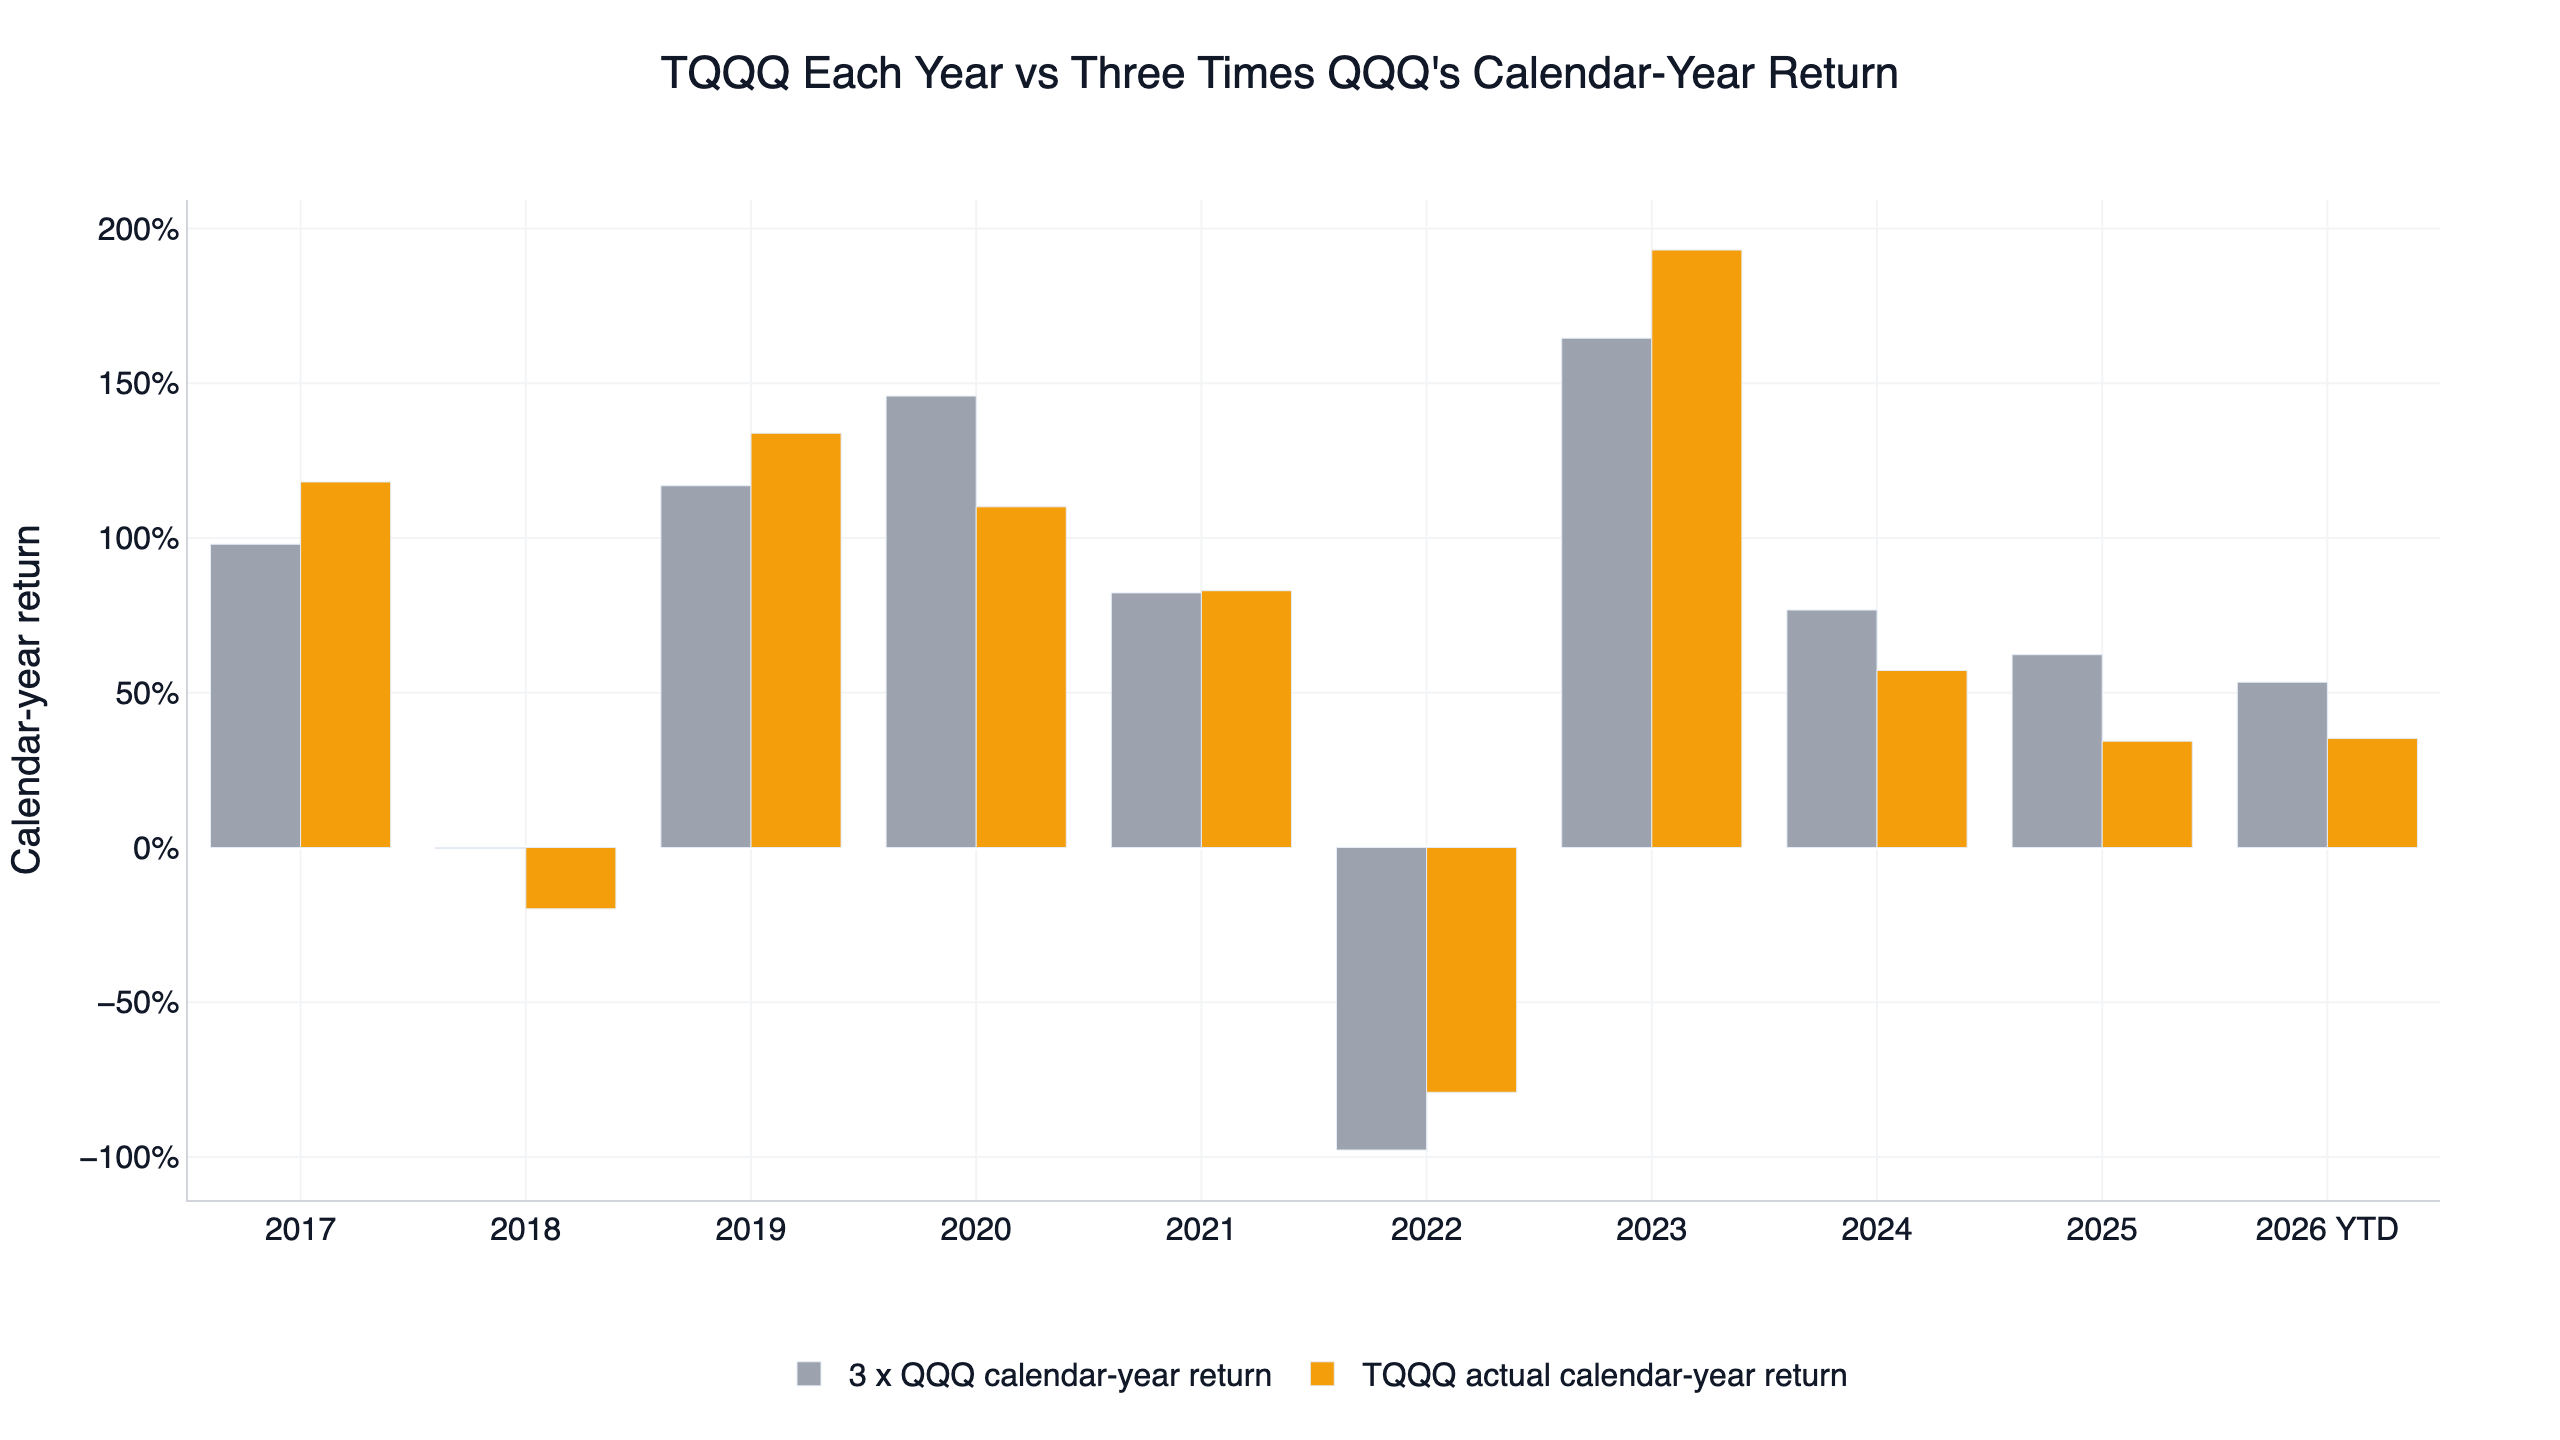
- In steady up years TQQQ beat three times QQQ: 118.1% against 98.0% in 2017, 133.9% against 116.9% in 2019, 193.1% against 164.6% in 2023. The daily reset reinvests the gains, and compounding pushes the result past 3x.
- In choppy years the decay is plain to see: in 2018 QQQ lost 0.1% for the year, three times that is -0.3%, and TQQQ lost 19.8%.
- In steady down years TQQQ fell less than three times QQQ: in 2022 QQQ lost 32.6%, three times that is -97.7%, and TQQQ lost 79.1%.
- In volatile years TQQQ fell well short: 110.1% against 145.9% in 2020.
- High-rate years fell short too: 57.2% against 76.7% in 2024 and 34.4% against 62.3% in 2025, mainly because of a yearly lag of 12% to 13% (expense ratio plus financing) in those two years.
Second, a moving average gets hit both ways in fast sell-offs. A 200-day average reflects roughly ten months of prices, so a decline has to run a while before price crosses it. The late-2018 and March-2020 sell-offs fell fast and rebounded fast, so the rules exited after much of the fall and re-entered after much of the rebound. Sullivan, Timmermann & White (1999) placed the Brock et al. rules among roughly 8,000 technical rules and corrected for data snooping with a bootstrap; the best-performing rule no longer showed significant outperformance in the decade after the original sample, 1987 to 1996. The first-half results here fit that finding: in years without a long bear market, moving average timing mostly paid for whipsaws.
Third, UPRO/TMF bet on stocks and bonds moving in opposite directions, and in 2022 they stopped doing that. From 2017 to 2021 long Treasuries usually rose when stocks fell, TMF spiked in March 2020, and the mix posted a first-half Sharpe of 1.32, ahead of QQQ. Then the Federal Reserve raised rates quickly in 2022, and stocks and long bonds crashed together: UPRO lost 56.8% for the year, TMF 72.6%, and the mix 64.1%.
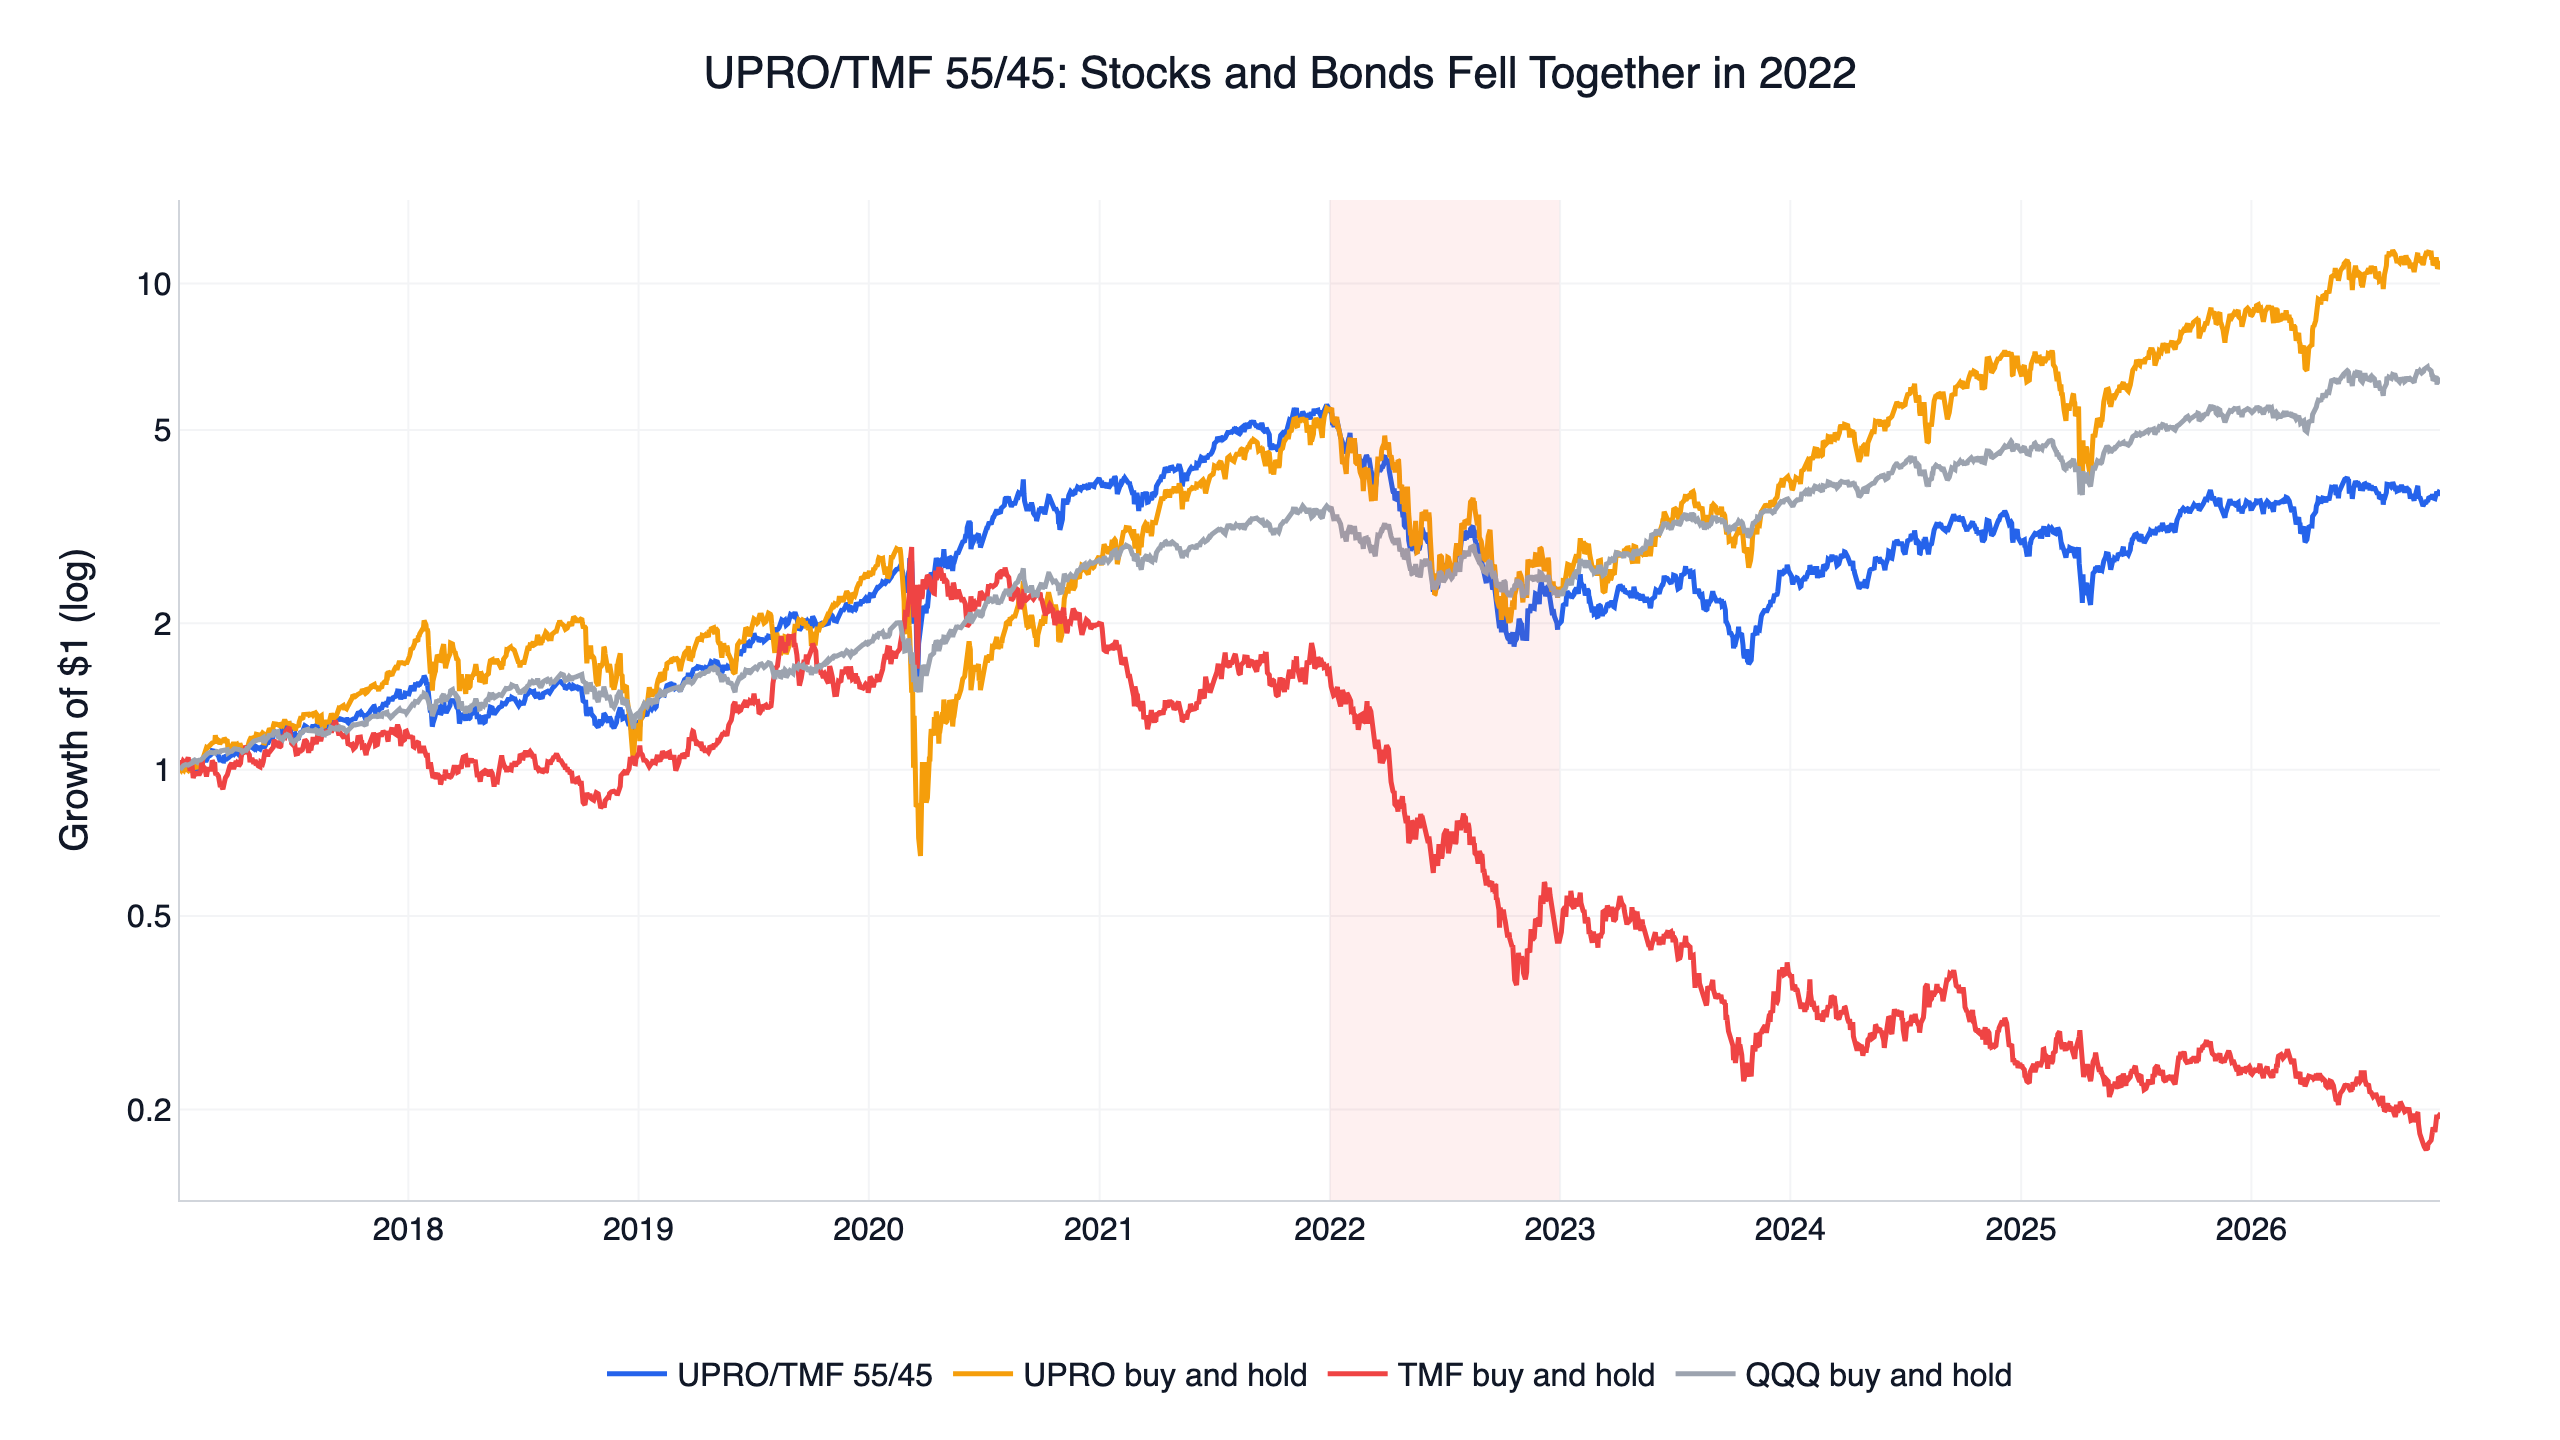
Long bonds never came back. Since 2017 TLT returned -1.1% a year and TMF -15.4% a year, leaving $0.19 of every dollar after a -94.3% drawdown. The mix has not regained its 2021-12-27 high as of October 2026, and its maximum drawdown is -70.7%.
SOXL with a moving average filter still fell 83.9%
SOXL is the most volatile product here: held outright it ran at 104.1% annualised volatility with a -90.5% maximum drawdown. Adding SOXX's 200-day average only shrank the worst drawdown to -83.9%, from 2024-07-10 to 2025-02-24. Over those seven months SOXX kept crossing back and forth around its average, the rule traded 13 times, and all 6 of its entries lost money, while SOXL often jumped after the rule sold. Most entries came near the end of a bounce and most exits near the end of a drop. Over the whole window the rule switched 3.7 times a year, and in 13 of its 18 exits SOXL rose while it was out. The semiconductor index moves about 1.5 times as much as QQQ each day, so a 1% band is narrow relative to its noise; even so, the 2% band setting reached only 0.94 and still lost to QQQ.
The code
The core takes a few lines. This builds QQQ's 200-day signal, holds TQQQ or Treasury bills, and compares the daily Sharpe with QQQ over the same days. The full research.py runs all seven rules, all 63 settings and the three checks.
Show Code
import finlab
import pandas as pd
from finlab import data
from finlab.backtest import sim

finlab.login()  # finlab guides you through login when data is needed
data.set_market("us_fund")
close = data.get("us_fund_price:adj_close")

# 1. QQQ's 200-day moving average with a 1% band on each side
qqq = close["QQQ"].dropna()
average = qqq.rolling(200).mean()
state = pd.Series(float("nan"), index=qqq.index)
state[qqq > average * 1.01] = 1   # more than 1% above: hold TQQQ
state[qqq < average * 0.99] = 0   # more than 1% below: hold T-bills (BIL)
state = state.ffill().fillna(0).loc["2017-01-03":]

# 2. Trade at the next day's close whenever the signal flips
position = pd.DataFrame({"TQQQ": state, "BIL": 1 - state})
report = sim(position, trade_at_price="close", upload=False)

# 3. Compare daily Sharpe with QQQ (dividends reinvested) on the same days
benchmark = qqq.reindex(report.creturn.index).ffill()
for name, curve in [("TQQQ + 200MA", report.creturn), ("QQQ", benchmark)]:
    daily = curve.pct_change().dropna()
    print(name, round(daily.mean() / daily.std() * 252 ** 0.5, 2))
In our environment it prints 0.99 and 0.95, matching the table above. To go further, install the FinLab skill for your AI agent (Claude Code, Codex or Gemini CLI) with npx skills add https://github.com/koreal6803/finlab-ai --skill finlab, or follow the AI-assisted setup; the agent guide lists the supported tools. Ask the agent to change one thing at a time (the average length, the buffer, QLD instead of TQQQ) and rerun the three checks after each change before trusting any single equity curve.
Backtest method and limits
| Item | How it was handled |
|---|---|
| Window | 2017-01-04 to 2026-10-27. FinLab's US fund prices start in January 2016, and January 2017 is the first month in which a 250-day average exists, so all 63 settings share one window; nothing before 2017, including the 2008 crisis, is tested. |
| Instruments | A fixed set of nine ETFs: QQQ, SPY and SOXX supply the signals (the golden cross rules also hold QQQ and SPY directly), TQQQ, QLD, UPRO, SOXL and TMF are the leveraged holdings, and BIL is cash. No stock selection, so no survivorship bias from delisted stocks. |
| Leverage costs | Included: each leveraged ETF's price already carries its daily reset, expense ratio and financing cost; the price check above shows how they were verified. |
| Look-ahead | Signals use the day's close, and sim() trades at the next trading day's close, so no future price is used. |
| Trading costs | Main backtests use finlab's US defaults: zero commission, zero tax. The cost check charges 0.1% per buy and per sell. The timing rules switch 0.8 to 3.7 times a year, so costs lower daily Sharpe by about 0.01. |
| Cash | BIL while out of the market. It returned about 0% to 2% a year from 2017 to 2022 and about 4% to 5% a year from 2023 to 2025. |
| Turnover | TQQQ and QLD with the 200-day rule switch 1.6 times a year, UPRO 2.9, SOXL 3.7, the golden crosses 0.8; UPRO/TMF rebalances quarterly. |
| Benchmark | QQQ total return (us_fund_price:adj_close), buy and hold, no costs; SPY and each leveraged ETF held outright shown for reference. |
| Sample | Everything is in-sample. The two halves are a stability check, not out-of-sample validation. Capacity was not estimated. |
| Data version | Rerun in October 2026 with finlab 2.2.21, prices through 2026-10-27. |
What this result does and does not say
Under these settings, over 2017-2026, none of the seven simple rules beat holding QQQ on a risk-adjusted basis in a way that survived the checks. That does not make the 200-day average useless. For someone already set on holding TQQQ, it cut the maximum drawdown from -81.7% to -60.9%, cut the 2022 loss from 79.1% to 29.9%, and raised the annual return from 39.6% to 45.1%. What the checks show is that the improvement came mainly from the single 2022 bear market: change the setting, or look only at the first half with no long bear market, and the edge disappears. Ten years of data hold one long bear market, which is too small a sample to prove a timing rule reliable.
For leveraged approaches that did pass the same three checks, compare the ETF rotation strategy, which also requires QQQ above its 200-day average but adds a positive 126-day return, checks only once a month, and rotates into the strongest of gold and Treasuries when out of the market, with a conservative version on 2x funds (it also has a live strategy page). The low volatility strategy uses the same QQQ 200-day and six-month return test to switch between offence and defence, holding a single 2x fund on offence. Their windows start in May 2016, eight months earlier than this study, so their numbers are not directly comparable with the tables here.
FAQ
Can you hold TQQQ long term? From 2017-01 to 2026-10, TQQQ held outright compounded at 39.6% a year, nearly twice QQQ's 20.9%, but its maximum drawdown was -81.7%, it took from November 2021 to December 2024 to recover, and its daily Sharpe of 0.84 was below QQQ's 0.95. Whether you can hold it depends on whether you would sell with less than a fifth of the account left. TQQQ did not go to zero in this window, but a 3x fund would in theory be wiped out if its index fell more than 33% in one day; on 2020-03-16 QQQ fell 12.0% and TQQQ fell 34.5%.
QLD vs TQQQ: which is better? Under the same 200-day rule, TQQQ returned 45.1% a year with a 0.99 daily Sharpe and a -60.9% drawdown; QLD returned 33.4% with a 1.01 Sharpe and a -44.8% drawdown. QLD gave up 11.7 points of return for a drawdown 16 points shallower, came out slightly ahead on risk-adjusted terms, and won 7 of 9 settings against TQQQ's 4. Held outright, QLD's Sharpe was 0.86 and TQQQ's 0.84.
Does a 200-day moving average strategy work? It reduces drawdowns, but in these tests it did not reliably beat QQQ on risk-adjusted return. It helps most in a long, deep bear market like 2022 and gets hit both ways in fast sell-offs with fast rebounds like late 2018 and March 2020. In 6 of TQQQ's 8 exits under the rule, TQQQ rose while the rule was out.
Does the golden cross strategy work? The 50/200-day golden cross on QQQ returned 19.1% a year with a 0.99 daily Sharpe and a -28.6% drawdown: slightly less return than QQQ's 20.9% and a drawdown 6.6 points shallower. Only 4 of 9 settings beat QQQ, and it lost in the first half. On SPY the golden cross returned 10.6% a year and lost in all nine settings. In ten years the QQQ golden cross exited only 4 times, and in 3 of them QQQ was higher when the rule bought back.
Why do leveraged ETFs decay? Two sources. One is cost: the expense ratio plus financing meant TQQQ trailed three times QQQ's daily return by 7.8% a year on average over the decade, and QLD trailed two times by 3.8%. The other is the daily reset: a leveraged ETF returns to its 2x or 3x multiple every day, so in a choppy market it keeps buying high and selling low. In 2018 QQQ ended the year flat and TQQQ lost 19.8%. In steady up years, though, the daily reset made TQQQ earn more than three times QQQ.
Does UPRO/TMF (HEDGEFUNDIE's portfolio) still work? In these tests it was the weakest of the seven: a 0.58 daily Sharpe, all nine settings losing to QQQ, a -70.7% drawdown, and no recovery of its late-2021 high by October 2026. It did well from 2017 to 2021 because stocks and bonds moved in opposite directions; in 2022 they fell together, and TMF has lost 81% since 2017.
Can a moving average filter make SOXL safe to hold? With SOXX's 200-day average as a filter, SOXL's maximum drawdown was still -83.9% and all nine settings lost to QQQ. The semiconductor index is so volatile that it keeps crossing its average: from July 2024 to February 2025 the rule traded 13 times and all 6 entries lost money.
Can I rerun this with my own settings?
Yes. Complete the AI-assisted setup and download research.py below. Running it as is prints the three checks for all seven rules; python research.py tqqq_200ma opens one rule's interactive report. The average lengths, buffers and holdings sit in the RULES table at the top of the file, so an AI agent can change them for you.
Reproduce it yourself
- research.py: seven rules, 63 settings and the three checks; pass a rule name to open its backtest report.
- data.csv: daily equity curves of the seven rules and ten ETFs held outright, all starting at 1 on 2017-01-04.
- metrics.json: every statistic quoted here, including all 63 settings, every exit, and the leveraged ETF price check.
More US research: the 10 backtested US strategies compared, the breakout trend strategy that also pairs a 200-day filter with leveraged ETFs, and the academic factor study, another set of rules that did not beat QQQ. The rest is on the FinLab blog; the team is on the about page, and examples of what users build are on use cases.
Last updated: 2026-10 | Backtest window: 2017-01 to 2026-10 | Benchmark: QQQ total return | Author: FinLab Quant Research (reviewed by a quantitative researcher)
Past performance does not represent future results, and every result here is an in-sample backtest. Leveraged ETFs carry volatility decay and magnified losses, and a 3x fund can lose more than 80% within months. This content is for education only, is not investment advice, and does not constitute investment advice.
FinLab AI
Want to build your own strategy?
Describe your stock-picking ideas in natural language. AI automatically validates, backtests, and gives you answers
Start Free