Run this strategy
Copy the prompt to reproduce the evidence above with the article’s data, assumptions, and risk checks.
Tell your AI:
Set up FinLab and backtest a market-neutral 12-1 month momentum long-short on US stocks (long the top 30, short the bottom 30) against QQQ. Please read: https://finlab.finance/en/setup?relatedUrl=/en/blog/long-short-equity-trend-following-backtest
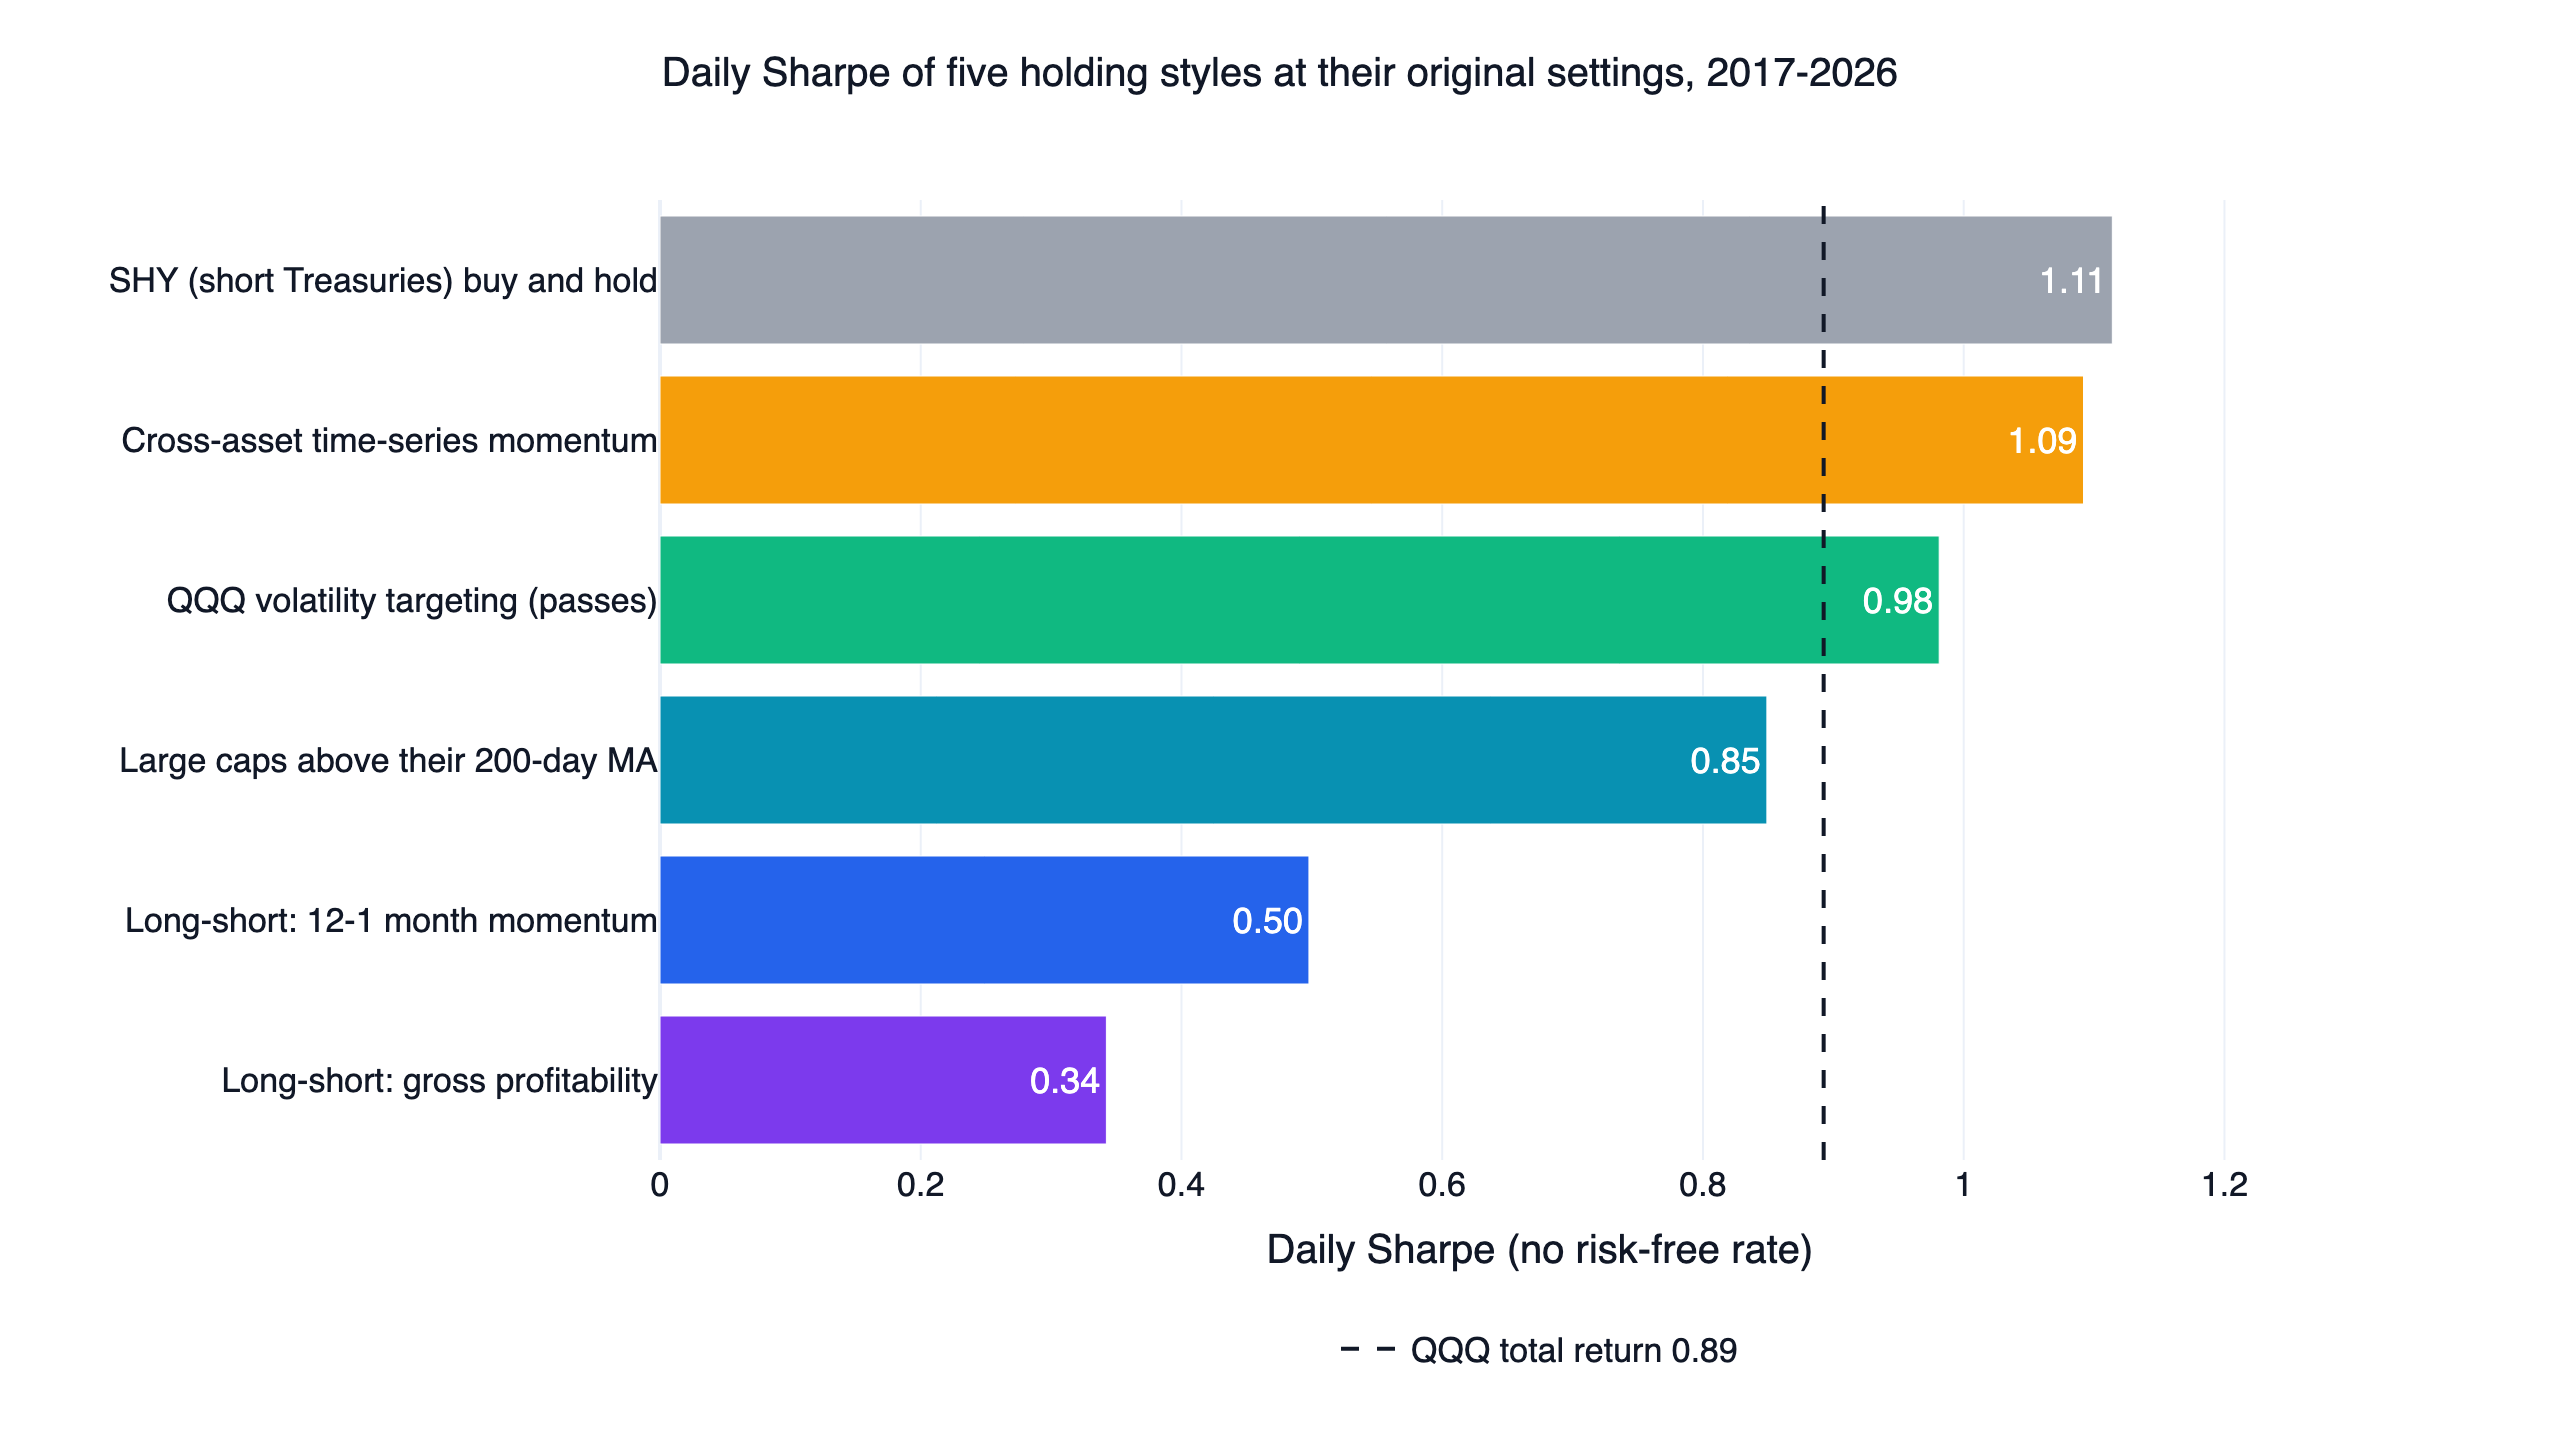
We backtested four ways of holding US assets that differ from timing QQQ: market-neutral long-short books on momentum and on gross profitability, the largest stocks each held only above their own 200-day average, and cross-asset time-series momentum across stocks, Treasuries, gold and commodities. From August 2017 to October 2026, across 36 parameter settings, no design held up: three failed our robustness checks, and cross-asset time-series momentum passed them but lost to its own fixed mix and, net of T-bills, to QQQ. The two long-short books scored a daily Sharpe of 0.34 and 0.50, and all 9 settings of each lost to QQQ with dividends reinvested (0.89). Large-cap trend following cut the drawdown to -14.9% but scored 0.85, with 2 of 9 settings winning. Cross-asset time-series momentum won all 9 settings (Sharpe 1.09), but the same assets held at fixed average weights, ignoring the trend, scored 1.19, and net of T-bill returns it lost to QQQ, so we count it as failed.
A fifth design in the same study, volatility targeting on QQQ, passed and has its own article: the volatility targeting strategy backtest.
Key numbers
| Design (original settings) | Daily Sharpe | CAGR | Max drawdown | Settings beating QQQ | First / second half Sharpe | Verdict |
|---|---|---|---|---|---|---|
| Long-short: 12-1 month momentum, 30 per side | 0.50 | 9.5% | -34.6% | 0 / 9 | 0.42 / 0.57 | Fails |
| Long-short: gross profit / assets, 30 per side | 0.34 | 3.7% | -30.8% | 0 / 9 | 0.42 / 0.29 | Fails |
| Top 100 stocks, each above its 200-day MA | 0.85 | 8.9% | -14.9% | 2 / 9 | 0.77 / 0.95 | Fails |
| Cross-asset time-series momentum (QQQ, IEF, GLD, DBC) | 1.09 | 6.4% | -9.9% | 9 / 9 | 1.10 / 1.09 | Fails (see below) |
| QQQ volatility target 15% (for reference) | 0.98 | 15.7% | -22.8% | 7 / 9 | 0.90 / 1.07 | Passes |
| QQQ buy and hold (dividends reinvested) | 0.89 | 19.8% | -35.1% | benchmark | 0.87 / 0.91 | |
| SHY (short Treasuries) buy and hold | 1.11 | 1.8% | -5.7% |
The backtest starts with the first rebalance at the end of July 2017 and runs to 2026-10-29. Every design rebalances on the last trading day of each month and trades at the next close. QQQ and SHY are bought and held over the same days with dividends reinvested. The halves split on 2022-03-14.
How a design had to pass
"Beats QQQ" means a higher daily Sharpe ratio than QQQ with dividends over the same days. The daily Sharpe is the mean daily return over its standard deviation, times the square root of 252, with no risk-free rate deducted. All three tests must pass:
- Neighbouring parameters: the original value and one step either side of each of two parameters; at least 7 of the 9 settings must win.
- Both halves: the original setting must win in the first and the second half.
- Trading costs: finlab charges no commission or tax on US trades by default, so we also charge 0.1% on every buy and sell; the original setting must still win.
This time we added two controls to tell whether a win comes from the holding style itself:
- Sharpe net of T-bills. Without a risk-free rate, anything holding short Treasuries looks better than it is. SHY on its own scores 1.11, above QQQ.
- The same average weights, held fixed. If a timing rule cannot beat its own average allocation, the timing adds nothing.
Both controls are applied to the original setting of designs that pass the three checks.
1. Market-neutral long-short: momentum and profitability both lose
Every month end, from the 1,000 most traded US common stocks (including companies that later delisted), we buy the 30 highest scores and short the 30 lowest, half the account on each side, equal weight within each side. finlab's sim() accepts negative weights directly; a negative weight is a short.
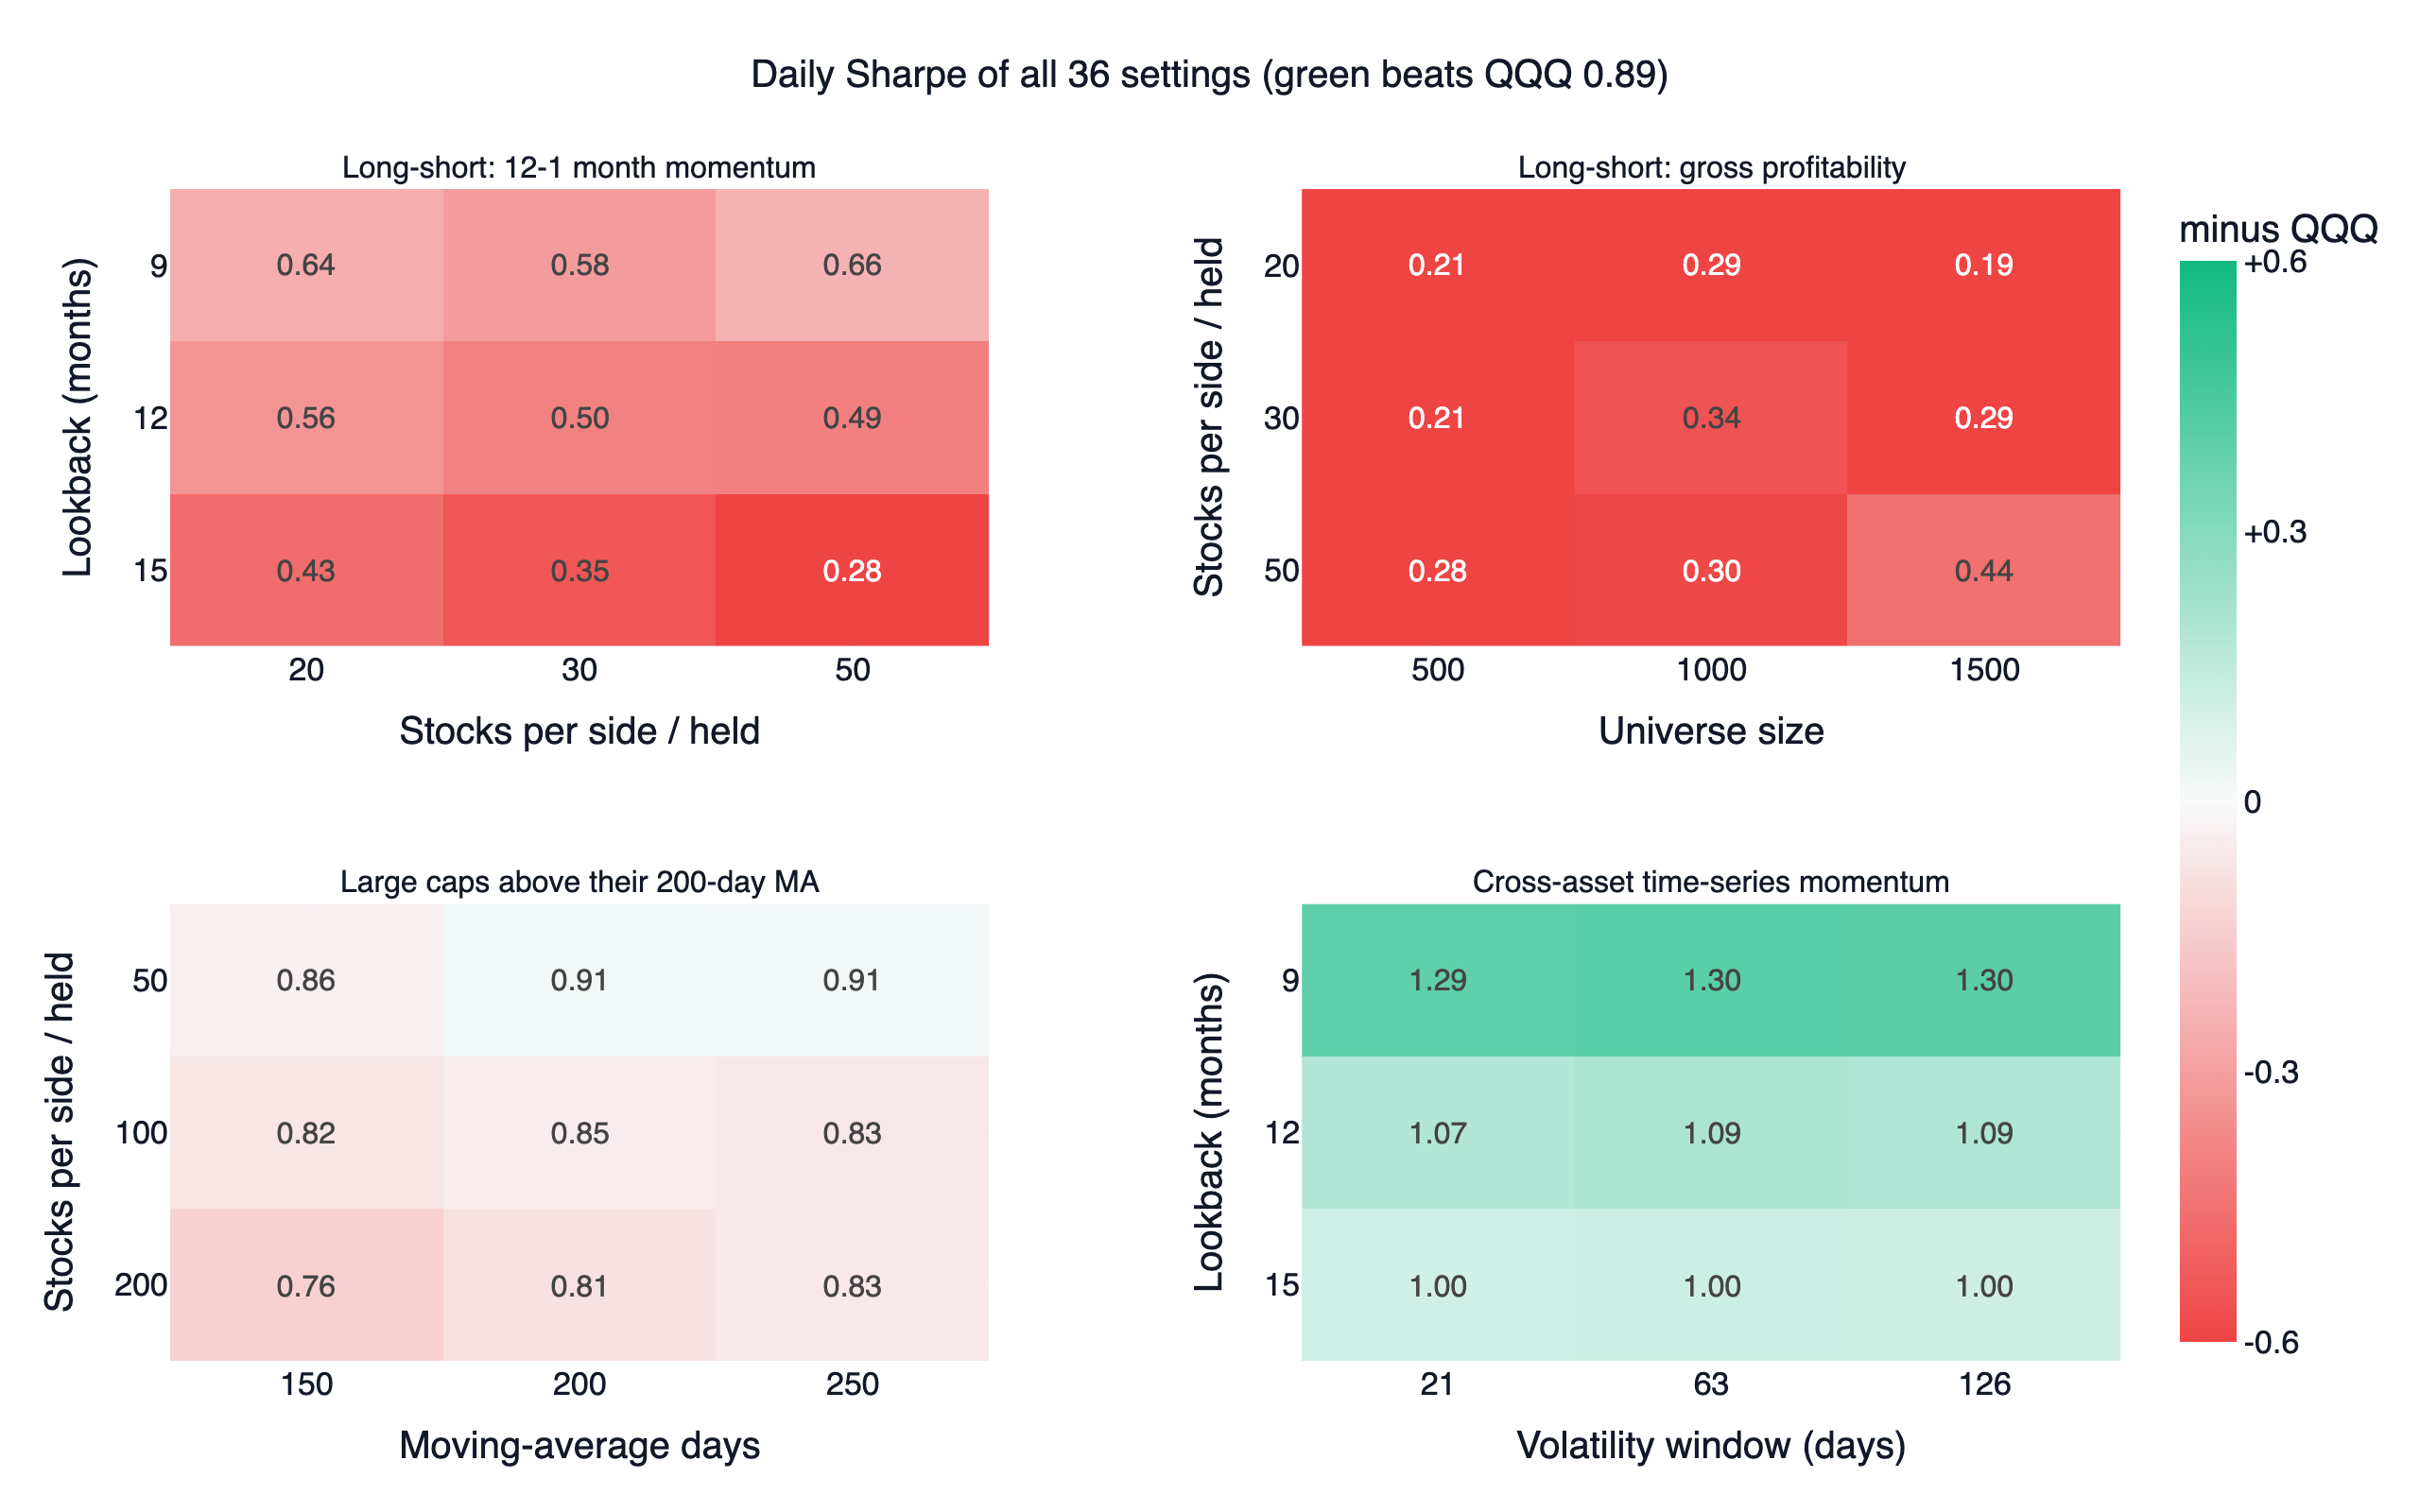
Momentum goes back to Jegadeesh and Titman (1993); we use the later standard 12-1 month return: the past 12 months, skipping the latest one. The original setting scored 0.50, with 9.5% a year, a -34.6% drawdown and 24.3% volatility, about as volatile as QQQ. Most of the return came in 2022 (+58.4%); the 2023 rebound took back 16.2%. Across lookbacks of 9, 12 and 15 months and 20, 30 or 50 stocks per side, the best was 0.66 (9 months, 50 per side), and all 9 lost. That pattern matches the momentum crashes described by Daniel and Moskowitz (2016): when a bear market rebounds, the shorted losers jump.
Gross profitability follows Novy-Marx (2013): trailing-twelve-month gross profit over total assets, financials excluded. The original setting scored 0.34 with 3.7% a year, and 0.42 and 0.29 in the two halves. Across 20, 30 or 50 stocks per side and universes of 500, 1,000 or 1,500 stocks, the best was 0.44. Our US academic factors backtest already found that long-only gross profitability lost to QQQ; the long-short version also removes the market's return and scores lower.
Neither long-short backtest charges a borrow fee on the shorts or credits interest on the short proceeds. Borrow fees would make the real result worse.
2. Large caps each held above their 200-day average: smaller drawdowns, still behind
Every month end we take the 100 largest stocks by market value and give each 1% of the account. A stock is held only while it closes above its own 200-day average; otherwise its 1% stays in cash. The filter reads each stock's own average. Han, Yang and Zhou (2013) found that moving-average timing works best on volatile portfolios and less well on calmer large caps.
The original setting returned 8.9% a year with a -14.9% drawdown and 10.7% volatility, with on average 70% of the account in stocks. Its Sharpe of 0.85 trailed QQQ's 0.89; it lost the first half (0.77) and won the second (0.95). Only the two settings with the top 50 stocks and a 200- or 250-day average won (0.913 and 0.912); holding more stocks was broadly worse, and the best top-200 setting reached 0.83.
Idle cash earns nothing in the backtest. Crediting it with SHY's return lifts the original setting to 0.890, still just below QQQ's 0.893; 3 of 9 settings then win and all 9 lose the first half. The verdict does not change.
3. Cross-asset time-series momentum: a formal pass that comes from bonds
Time-series momentum, after Moskowitz, Ooi and Pedersen (2012), looks at each asset's own past 12-month return: the paper goes long when it is positive and short when it is negative, sized by inverse volatility. We only go long and park a negative asset's share in SHY. We used four ETFs, QQQ (stocks), IEF (7-10 year Treasuries), GLD (gold) and DBC (commodities), weighted by the inverse of their 63-day volatility. The lazy portfolio backtest already tested Faber's equal-weight 10-month-average version; this one uses the paper's sign-of-return signal with inverse-volatility weights, long only.
It scored a Sharpe of 1.09 with 6.4% a year and a -9.9% drawdown. All 9 settings of 9, 12 or 15-month lookbacks and 21, 63 or 126-day volatility windows won, the halves scored 1.10 and 1.09, and the 0.1% cost run scored 1.04. By our rules, all three checks pass.
Both controls say the same thing:
| Portfolio | Daily Sharpe (no risk-free rate) | Net of T-bills | CAGR |
|---|---|---|---|
| Cross-asset time-series momentum | 1.09 | 0.67 | 6.4% |
| Same average weights held fixed (13% QQQ, 27% IEF, 14% GLD, 10% DBC, 36% SHY) | 1.19 | 0.75 | 6.7% |
| SHY buy and hold | 1.11 | -0.40 | 1.8% |
| QQQ (dividends reinvested) | 0.89 | 0.79 | 19.8% |
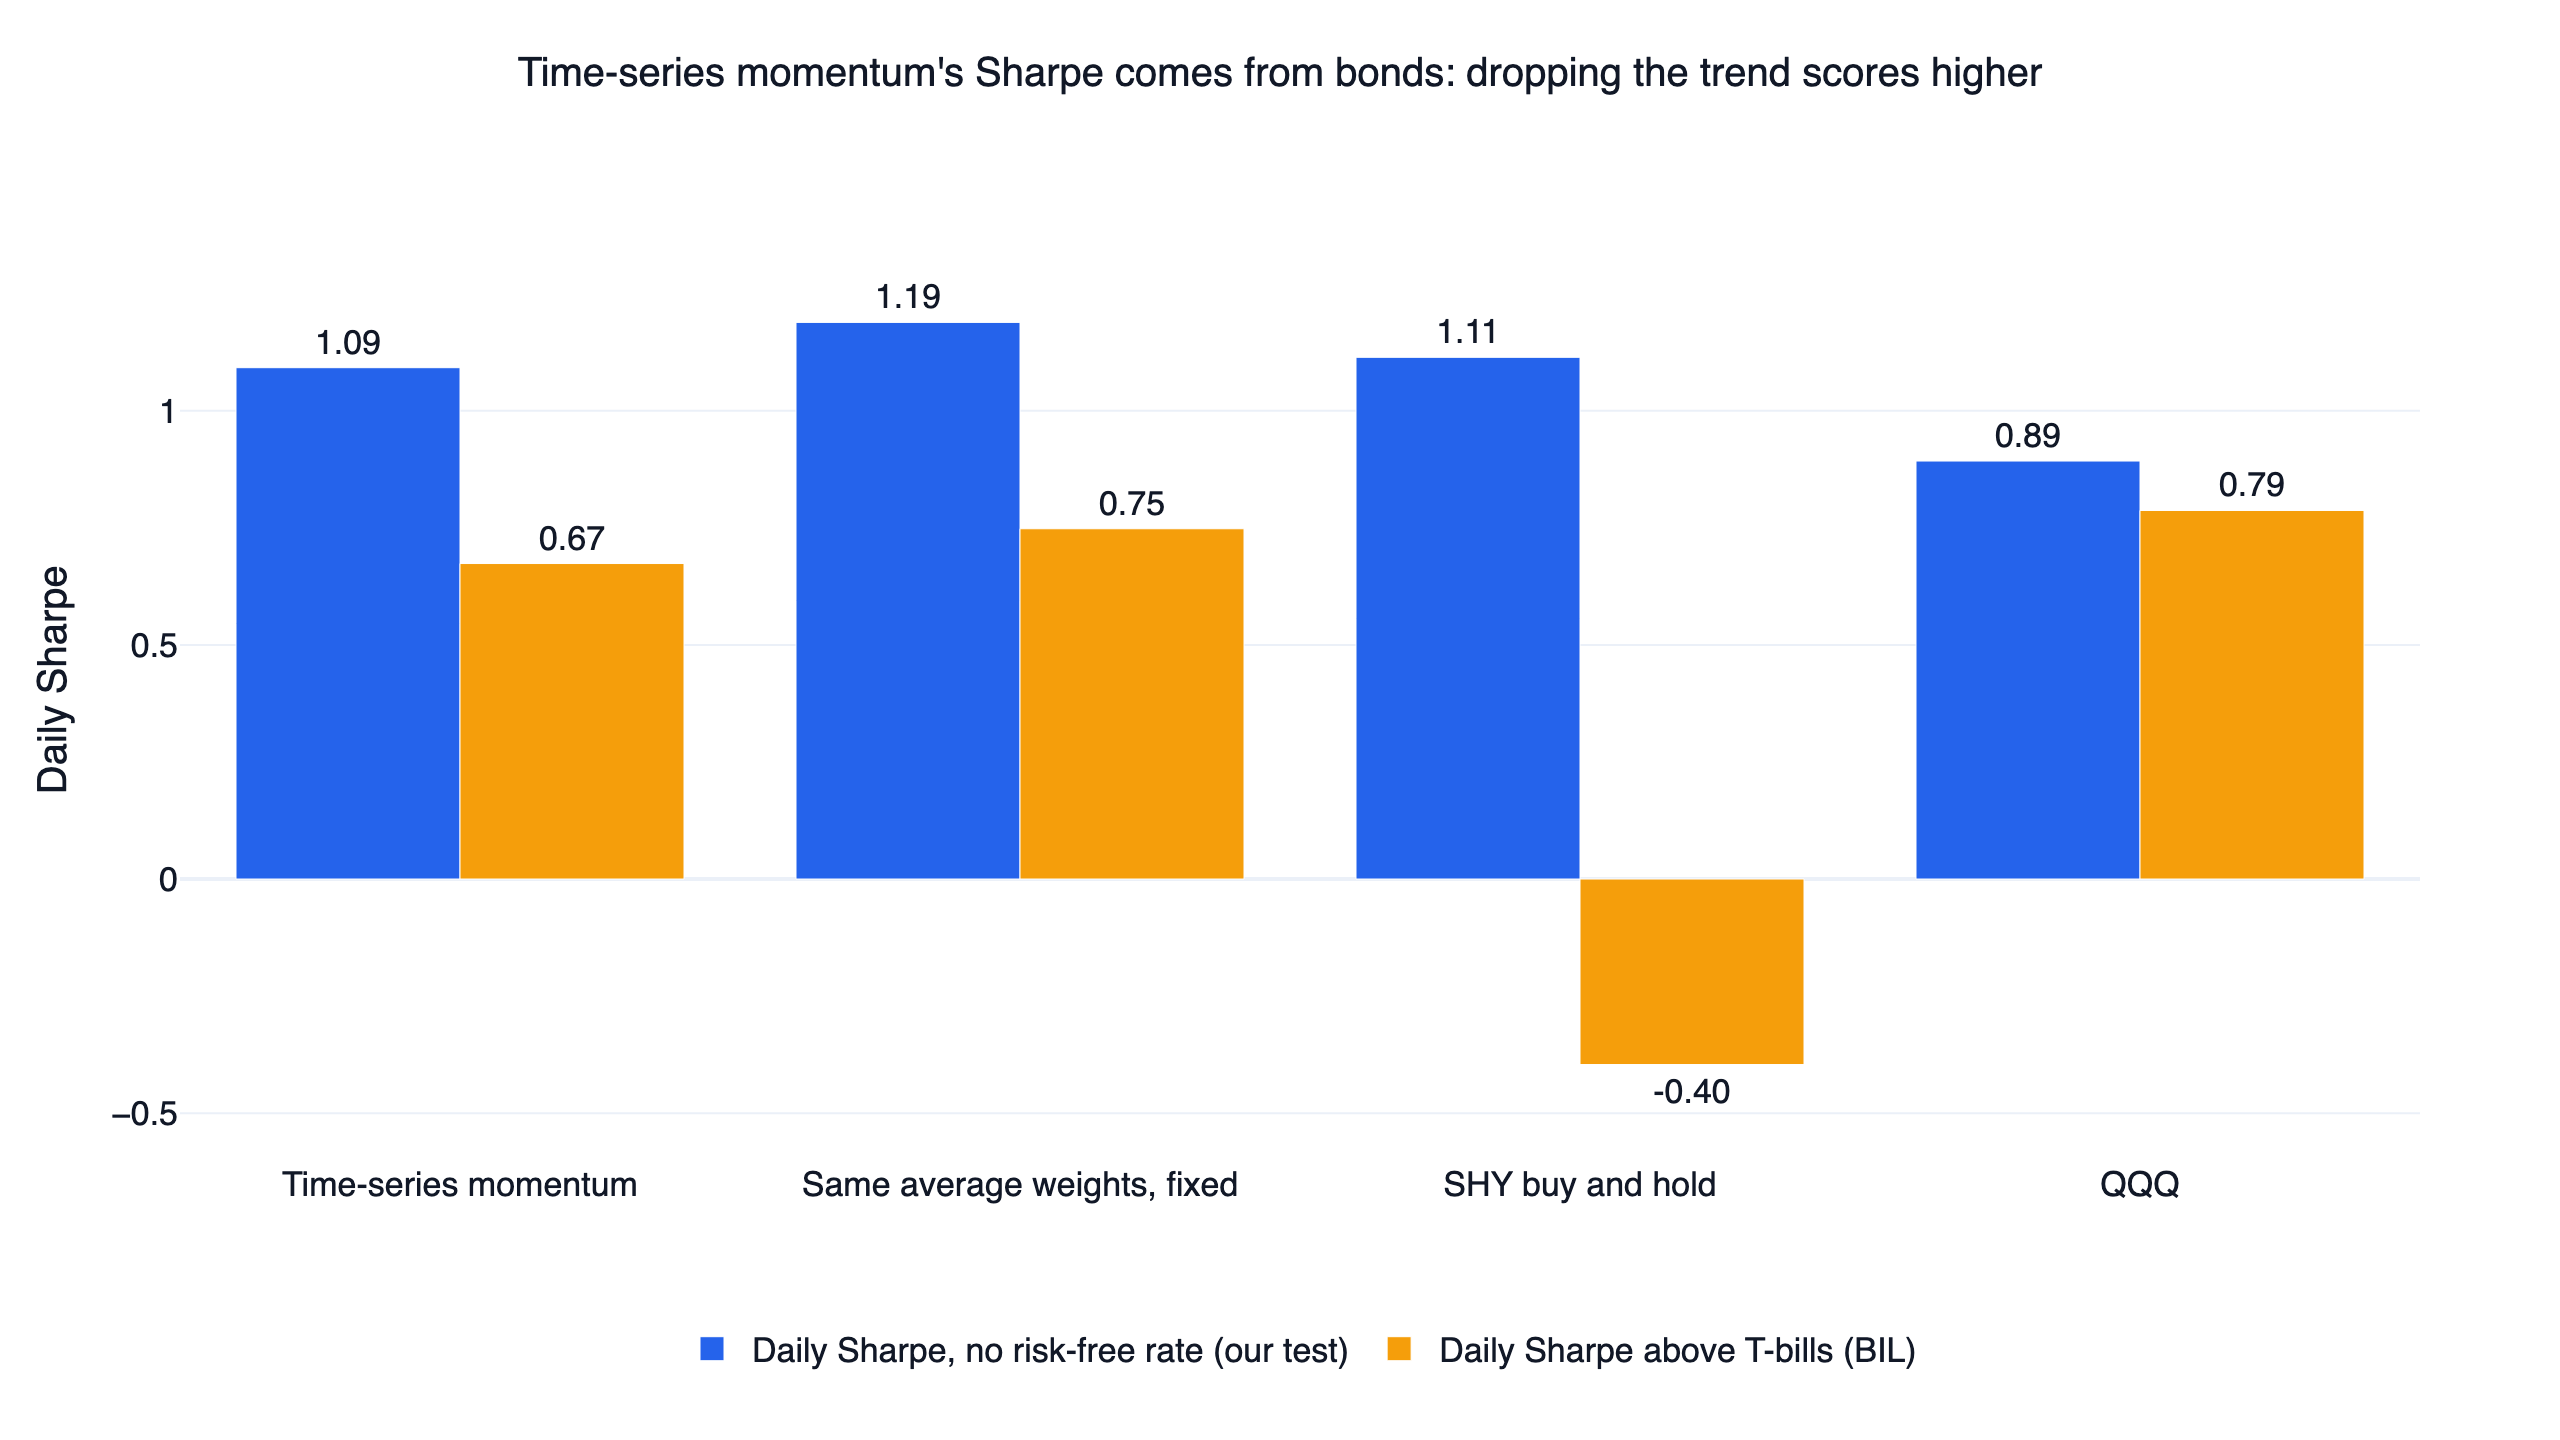
Inverse-volatility weights hand most of the account to low-volatility Treasuries: IEF and SHY together average over 60%, QQQ only 13%. The whole portfolio runs at 5.9% volatility, which is why its Sharpe without a risk-free rate looks high, for the same reason SHY alone "beats" QQQ. Dropping the trend signal and holding the average weights scores higher (1.19). Net of T-bills, time-series momentum scored 0.67 over the full period and 0.48 in the second half, below QQQ's 0.79 and 0.74, and only 3 of 9 settings won.
So this design's pass comes from a low-volatility allocation, and the trend signal adds nothing. We do not count it as a working strategy, and it is not in the FinLab strategy library. The same controls point the other way for volatility targeting: it beats its own fixed mix (0.98 against 0.92) and still wins net of T-bills over the full period and both halves, so it passes. Its margin is small, though: net of T-bills only 6 of 9 settings win, below the bar, and almost all of its edge comes from 2022.
Both halves
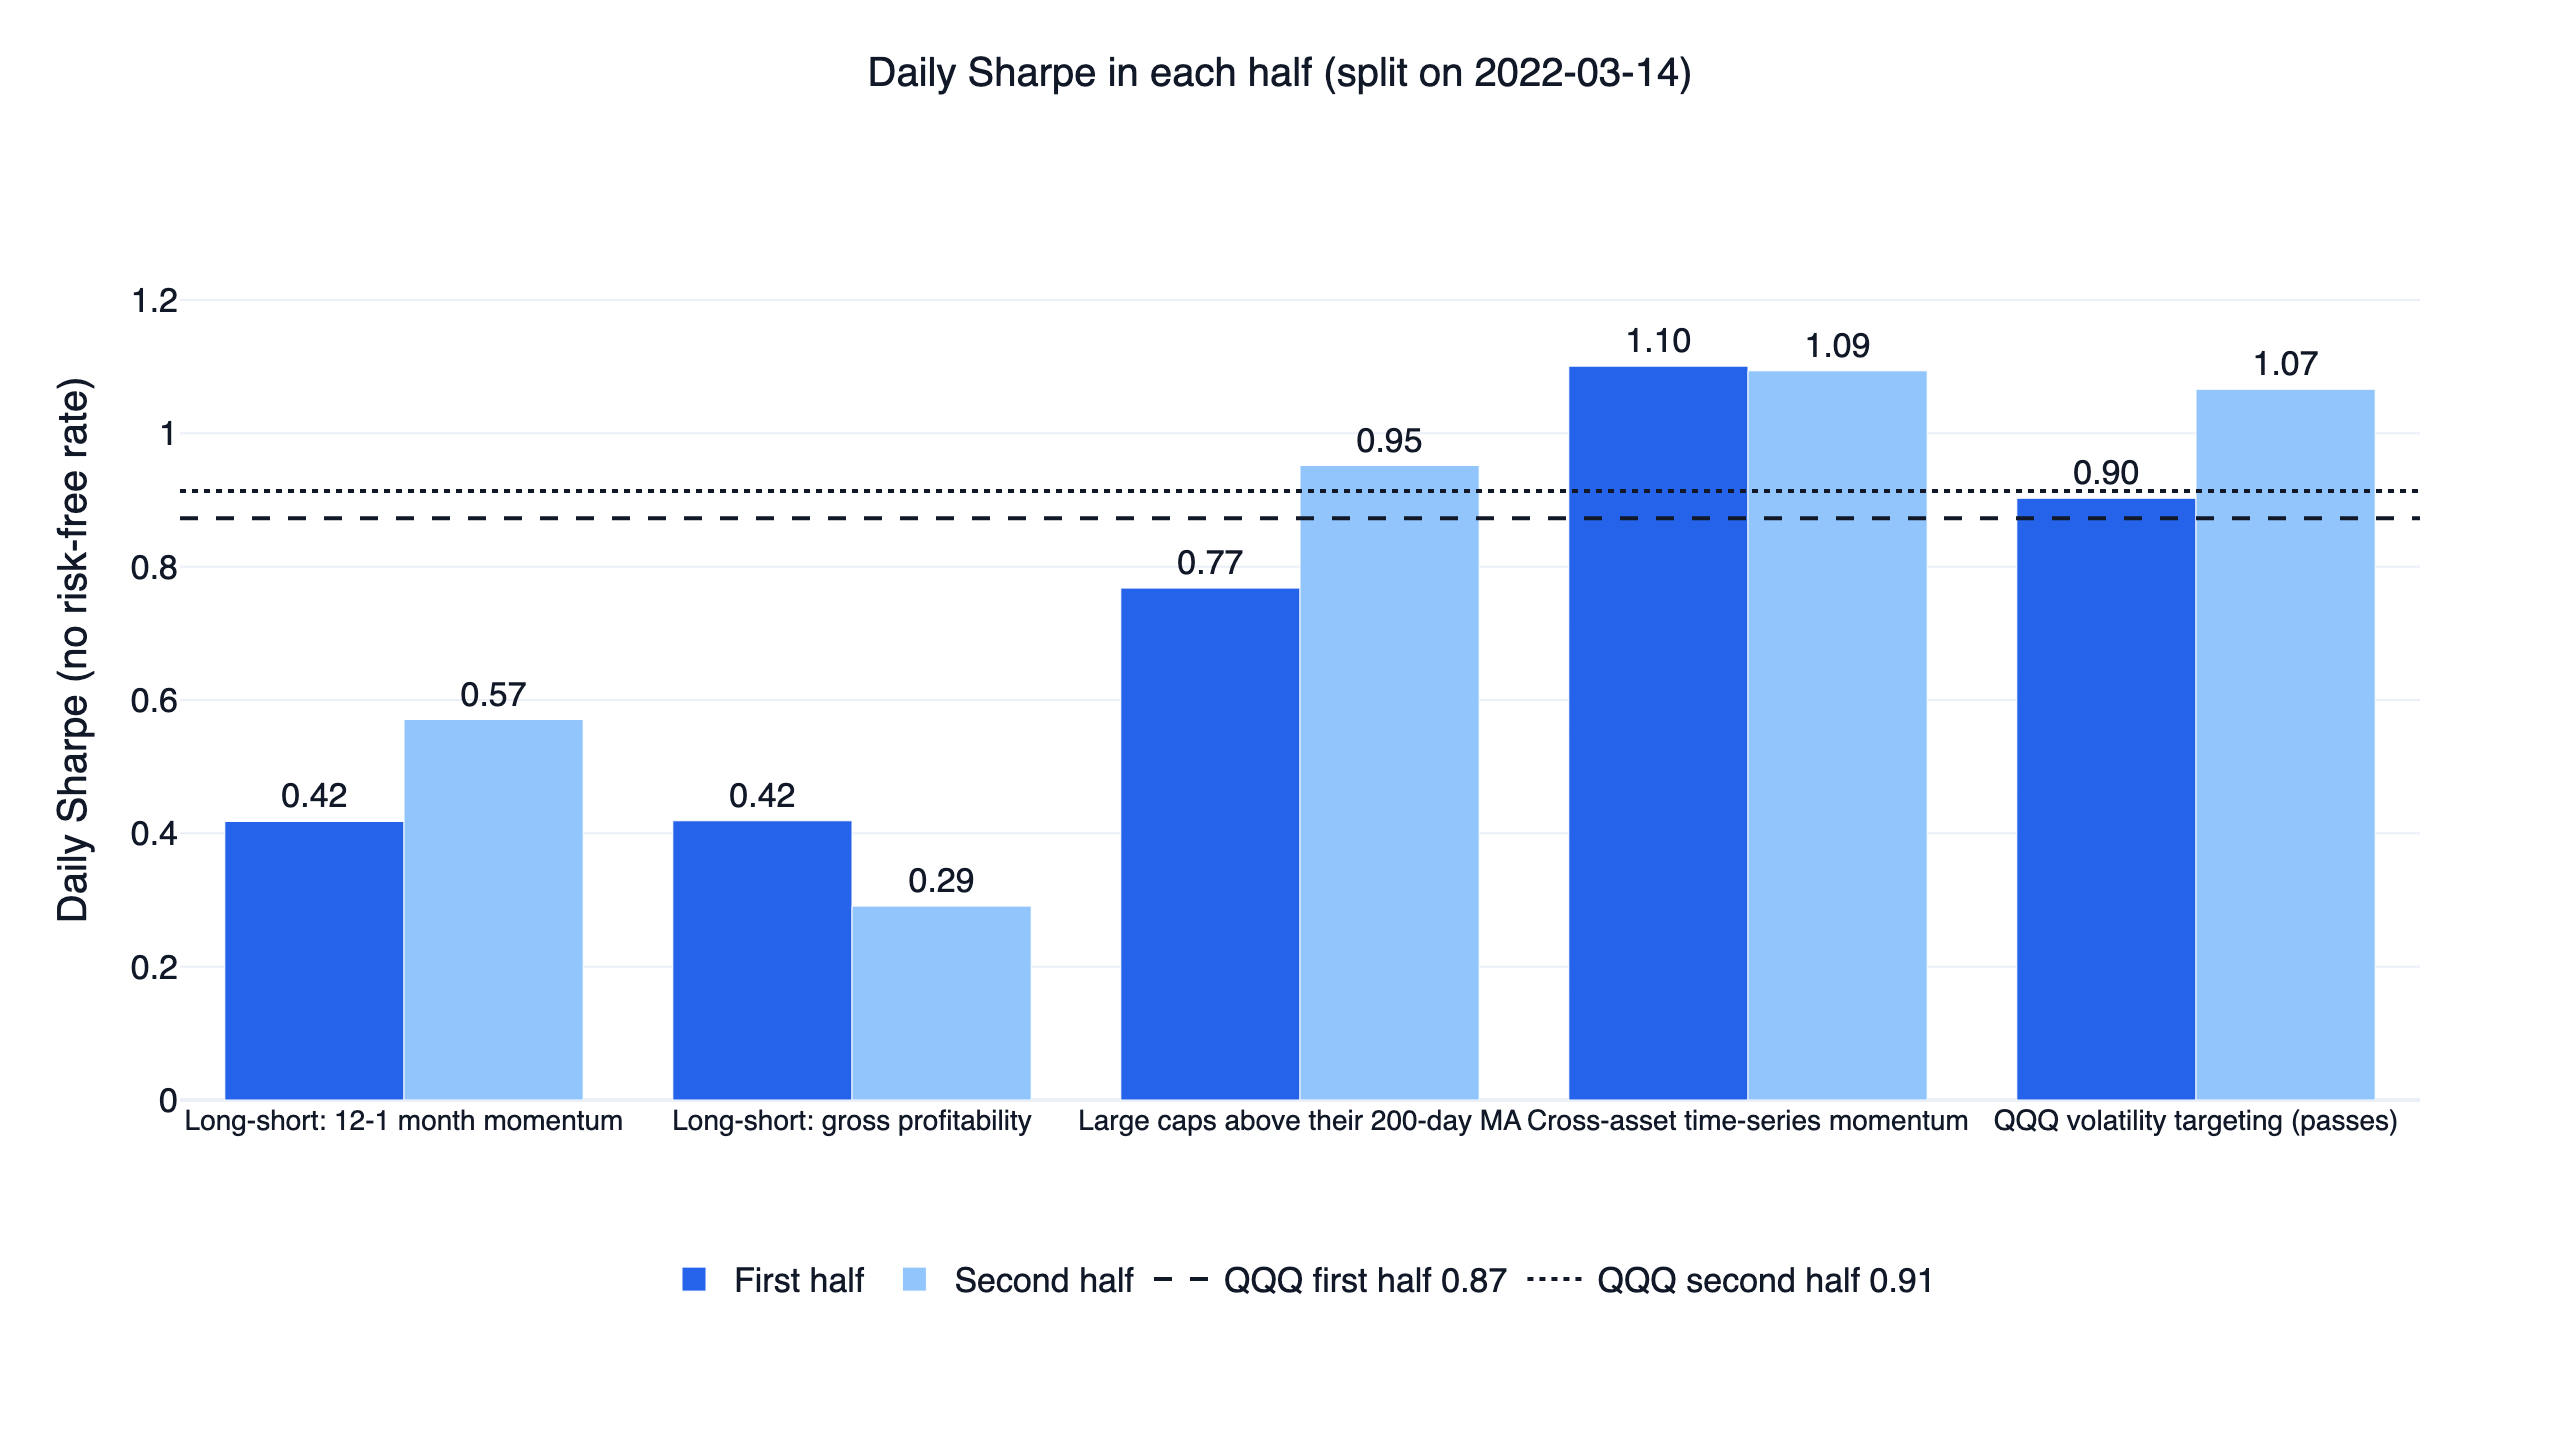
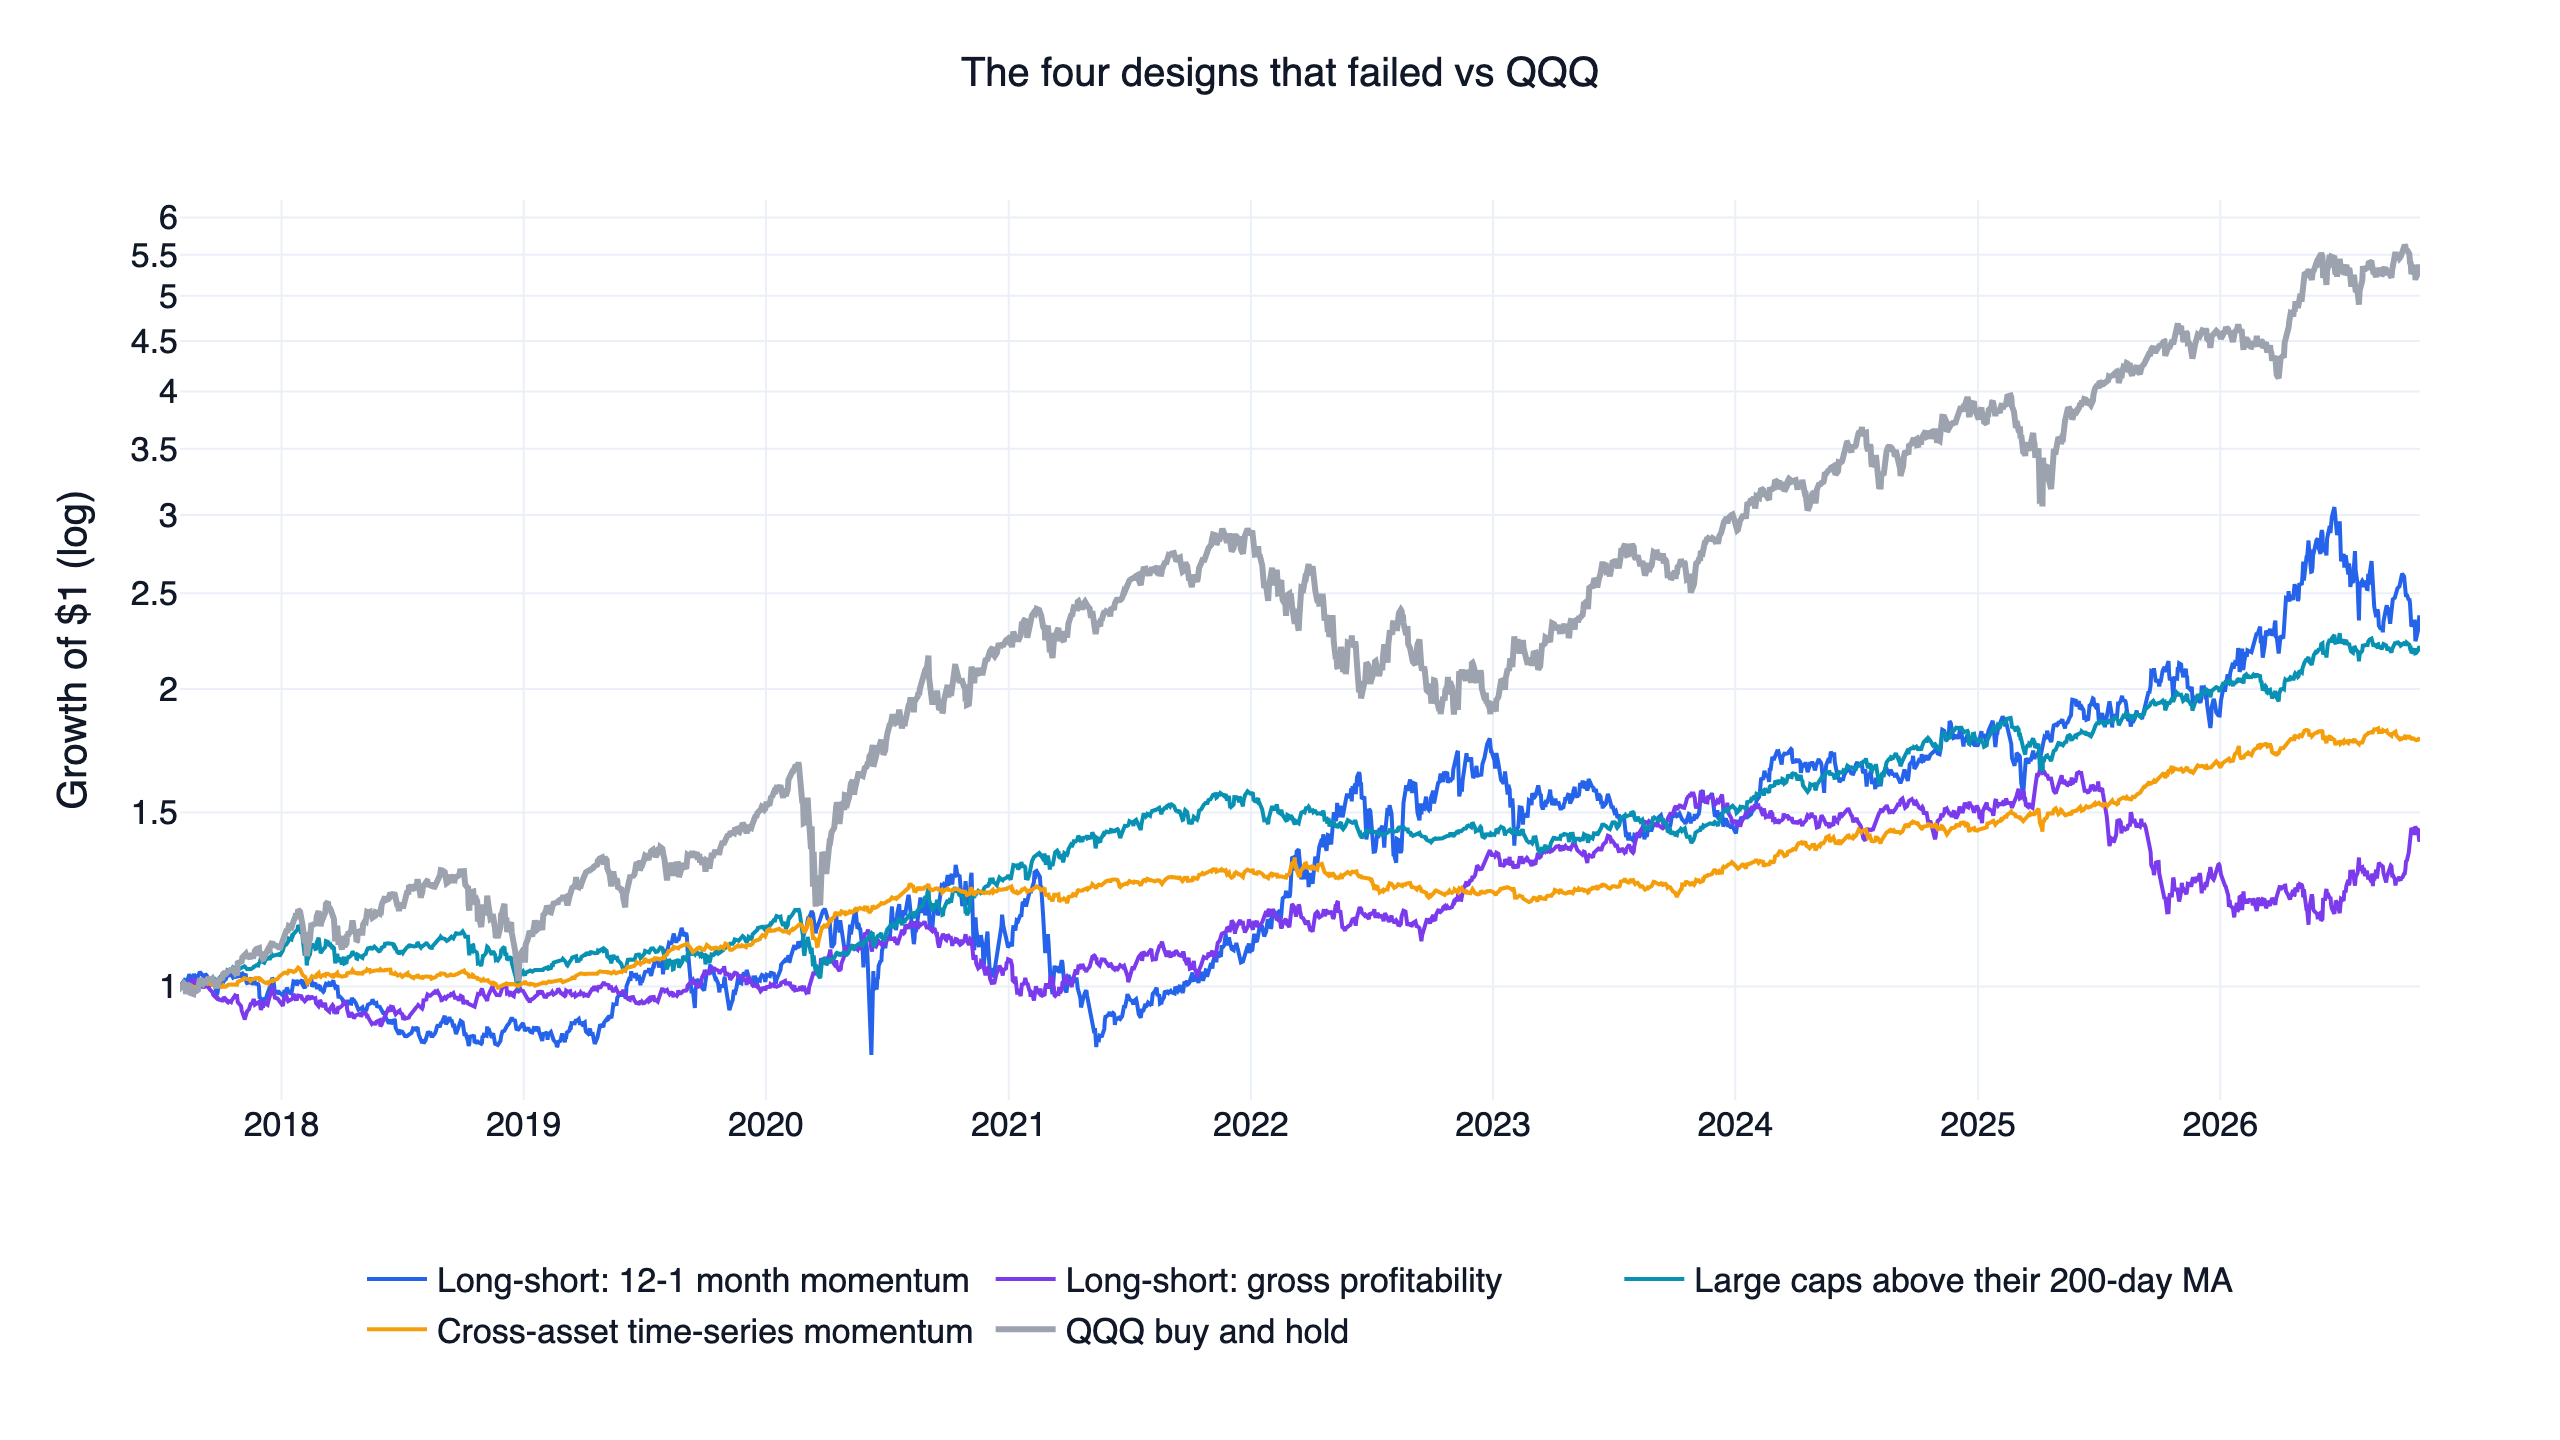
Both long-short books lost both halves. Large-cap trend following won only the second half: in the 2022 bear market more and more stocks fell below their 200-day averages, and the monthly stock exposure ranged from 12% to 74%, averaging 44% (74% in 2019-2021), so it lost 9.0% against QQQ's 32.6%. In 2019 and 2020, though, it made 10.7% and 13.1%, less than a third of QQQ's 39.0% and 48.6%.
What this result does and does not say
- Over 2017-2026, a strong period for QQQ, market-neutral long-short books on US stocks struggled to match QQQ's risk-adjusted return. Removing the market's return left factor premia that were too small.
- A trend filter on each stock cut the drawdown sharply (-14.9% against -35.1%), at the cost of too little exposure in bull markets; risk-adjusted, it still trailed slightly.
- A Sharpe ratio without a risk-free rate overrates portfolios that hold many short Treasuries. Cross-asset allocation rules need the T-bill and fixed-weight controls.
- We did not test borrow fees, leveraged long-short books, other factors, or data before 2017. The conclusion covers these four designs over this period only.
The code
The core of the momentum long-short: compute 12-1 month momentum, rank inside the liquid universe, buy the top 30, short the bottom 30. sim() scales the sum of absolute weights to 100%, so each side gets half the account.
Show Code
import finlab
from finlab import data
from finlab.backtest import sim

finlab.login()  # finlab guides you through login automatically
data.set_market("us")

# 1. Universe: common stocks above $5, top 1,000 by 60-day average dollar volume
close = data.get("us_price:close")
dollar_volume = (close * data.get("us_price:volume")).rolling(60).mean()
profile = data.get("us_company_profile")
common = profile.loc[profile["security_type"] == "common_stock", "stock_id"]
liquid = dollar_volume[close > 5].reindex(columns=common).is_largest(1000)

# 2. 12-1 month momentum: the past 12 months, skipping the latest one
adj_close = data.get("us_price:adj_close")
momentum = adj_close.shift(21) / adj_close.shift(252) - 1
score = momentum.reindex(columns=liquid.columns)[liquid]

# 3. Long the top 30, short the bottom 30
longs = score.rank(axis=1, ascending=False) <= 30
shorts = score.rank(axis=1, ascending=True) <= 30
position = (longs.astype(float) - shorts.astype(float)) / 30

# 4. Rebalance on the last trading day of each month, fill at the next close
report = sim(position.loc["2017-07-31":], resample="M", trade_at_price="close", upload=False)

# 5. Daily Sharpe with no risk-free rate
returns = report.creturn.pct_change().dropna()
print(round(returns.mean() / returns.std() * 252 ** 0.5, 2))
With data through 2026-10-29 this prints 0.49. The original setting in research.py scores 0.50; the gap comes from the filters this snippet leaves out (the +/-50% daily move screen, one share class per company, no ADRs or funds). The full research.py covers all five designs, 45 neighbouring settings, both halves, the cost runs, the T-bill and fixed-weight controls, and large-cap trend with idle cash in SHY.
Install the FinLab skill for your AI agent
You do not need to write the code yourself. Install the FinLab skill in Claude Code, Codex or Gemini CLI with one command:
Show Code
npx skills add https://github.com/koreal6803/finlab-ai --skill finlabThen ask your agent in plain language, for example "make the momentum long-short 50 stocks per side" or "add TLT to the cross-asset time-series momentum and compare it with fixed weights". The AI agent setup page walks through each tool, the AI-assisted setup connects your FinLab account, and the same research runs in the browser at studio.finlab.finance.
Backtest method and limits
| Item | What we did |
|---|---|
| Window | 2017-07-31 (first rebalance) to 2026-10-29. FinLab's US prices start in 2016; this is the first month end with a year of prices and a year of quarterly filings behind it. |
| Universe | Common stocks in FinLab's US company profiles, including later delistings; one share class per company; no ADRs, ETFs or funds. Price above 5M, no +/-50% day in the past year; the 1,000 most traded each month (the profitability book also drops financials and tests 500 and 1,500). Large-cap trend takes the top 50/100/200 by market value from this universe. |
| Look-ahead | Filings enter on their SEC filing date; prices and market values are as of the day. Signals use data up to the month end and fill at the next close. |
| Weights | Long-short: 50% long, 50% short, equal weight per side. Large-cap trend: 1/N per stock, cash when below the average (no interest; a version with SHY is reported). Time-series momentum: inverse-volatility weights, downtrend shares in SHY. No leverage. |
| Costs | finlab sim() US default: no commission, no tax. Original settings rerun with 0.1% per side. No borrow fees and no slippage model. |
| Benchmark | QQQ buy and hold with dividends, same days, no costs. Daily Sharpe without a risk-free rate, plus a version net of BIL returns. |
| Sample | About nine years, all in sample; the halves are a stability check, not an out-of-sample test. |
| Software | finlab 2.2.24, pandas 3.1. FinLab's US company data (security type, market value) updates daily, so rerunning the stock designs on another day can move their Sharpe by about 0.01; the ETF designs are unaffected. |
FAQ
What is a long-short equity strategy? A strategy that buys some stocks and shorts others. A market-neutral version puts equal dollars on each side, so its return comes mainly from the longs beating the shorts rather than from the market's direction. Here momentum and gross profitability pick the two sides.
Why didn't market-neutral long-short beat QQQ? The long-short book cancels the market's return and keeps only the factor premium. From 2017 to 2026 QQQ's risk-adjusted return was high, and the momentum and profitability spreads were too small; momentum also gave back a lot in the 2023 rebound.
Does trend following work on individual stocks? It cuts drawdowns: the large caps held above their 200-day averages fell at most 14.9%, against 35.1% for QQQ. But about 30% of the account sat in cash on average, and the Sharpe of 0.85 still trailed QQQ, with 2 of 9 settings winning.
What is the difference between time-series and cross-sectional momentum? Cross-sectional momentum compares assets with each other and buys the strongest. Time-series momentum compares each asset with its own past and holds it only after a rise. Our long-short book is cross-sectional; the cross-asset design is time-series.
Time-series momentum won all 9 settings. Why does it fail? Its high Sharpe comes from a large share of low-volatility Treasuries. The same assets at fixed average weights score higher, and net of T-bill returns it loses to QQQ. The trend signal adds nothing, so it does not pass.
Are shorting costs included? Trading costs were rerun at 0.1% per side; borrow fees were not charged. Hard-to-borrow stocks can cost several percent a year, so real results would be worse.
Can I rerun this? Yes. Install FinLab through the AI-assisted setup, download research.py below and run it; it takes about five minutes.
Reproduce it yourself
- research.py: all five designs, 45 neighbouring settings, both halves, cost runs, the T-bill and fixed-weight controls, and idle cash in SHY.
- data.csv: daily equity of the five designs at their original settings, the two fixed mixes, and QQQ, IEF, GLD, DBC and SHY.
- metrics.json: every statistic quoted here, including each setting, both halves and yearly returns.
More US research is in the US quant trading strategies overview, the US factor investing overview and the sector rotation backtest. The team behind it is on the about page, examples of what users build are on use cases, and metric definitions are in the glossary.
Last updated: 2026-10 | Backtest window: 2017-07 to 2026-10 | Benchmark: QQQ total return | Author: FinLab Quant Research (reviewed by a quantitative researcher)
Past performance does not represent future results, and every result here is an in-sample backtest. This content is for education only, is not investment advice, and does not constitute investment advice.
FinLab AI
Want to build your own strategy?
Describe your stock-picking ideas in natural language. AI automatically validates, backtests, and gives you answers
Start Free