Run this strategy
Copy the prompt to reproduce the evidence above with the article’s data, assumptions, and risk checks.
Tell your AI:
Help me set up FinLab and reproduce this article. Please read: https://finlab.finance/en/setup?relatedUrl=/en/blog/us-factor-investing
Factor investing is choosing stocks by a measurable characteristic, such as cheapness, profitability or low volatility, that research has linked to higher long-run returns or lower risk, and applying it to a whole market by rule instead of picking companies one at a time. A factor is the characteristic; a factor strategy ranks every stock on it and holds the best-ranked group. The idea comes from academic asset pricing, where Fama & French (1992) showed that size and book-to-market explain differences in average returns that market beta does not.
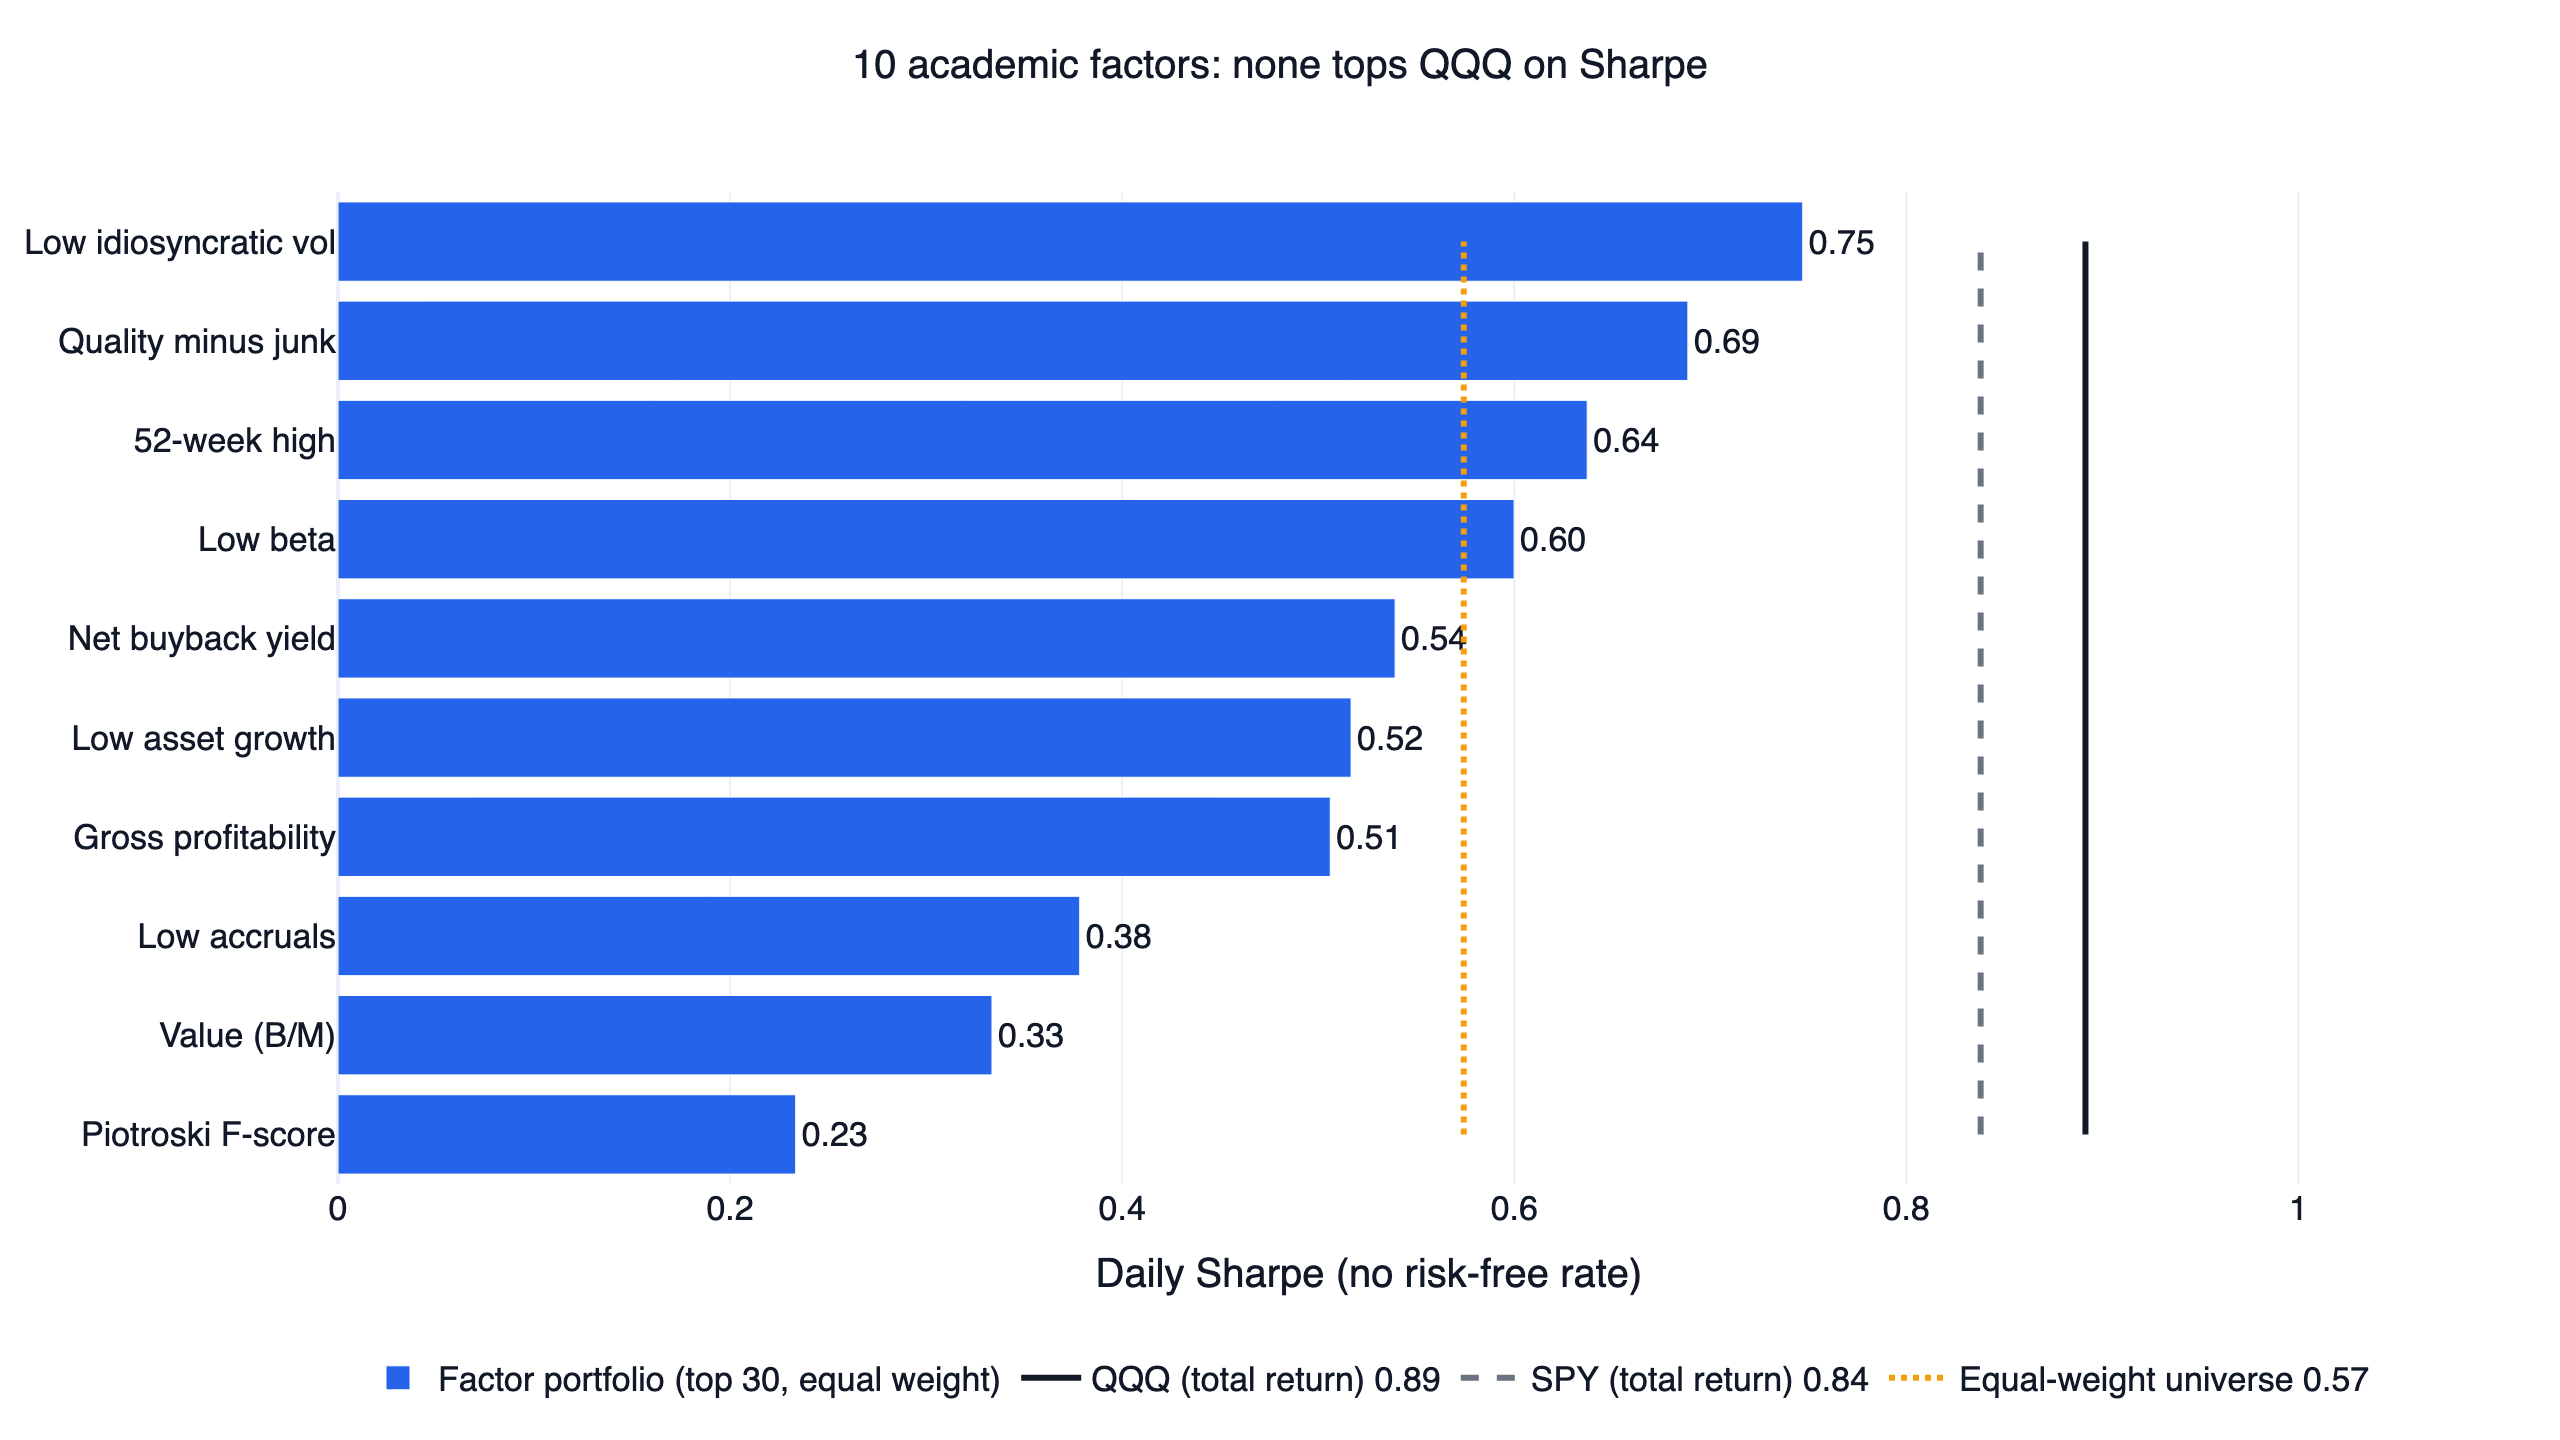
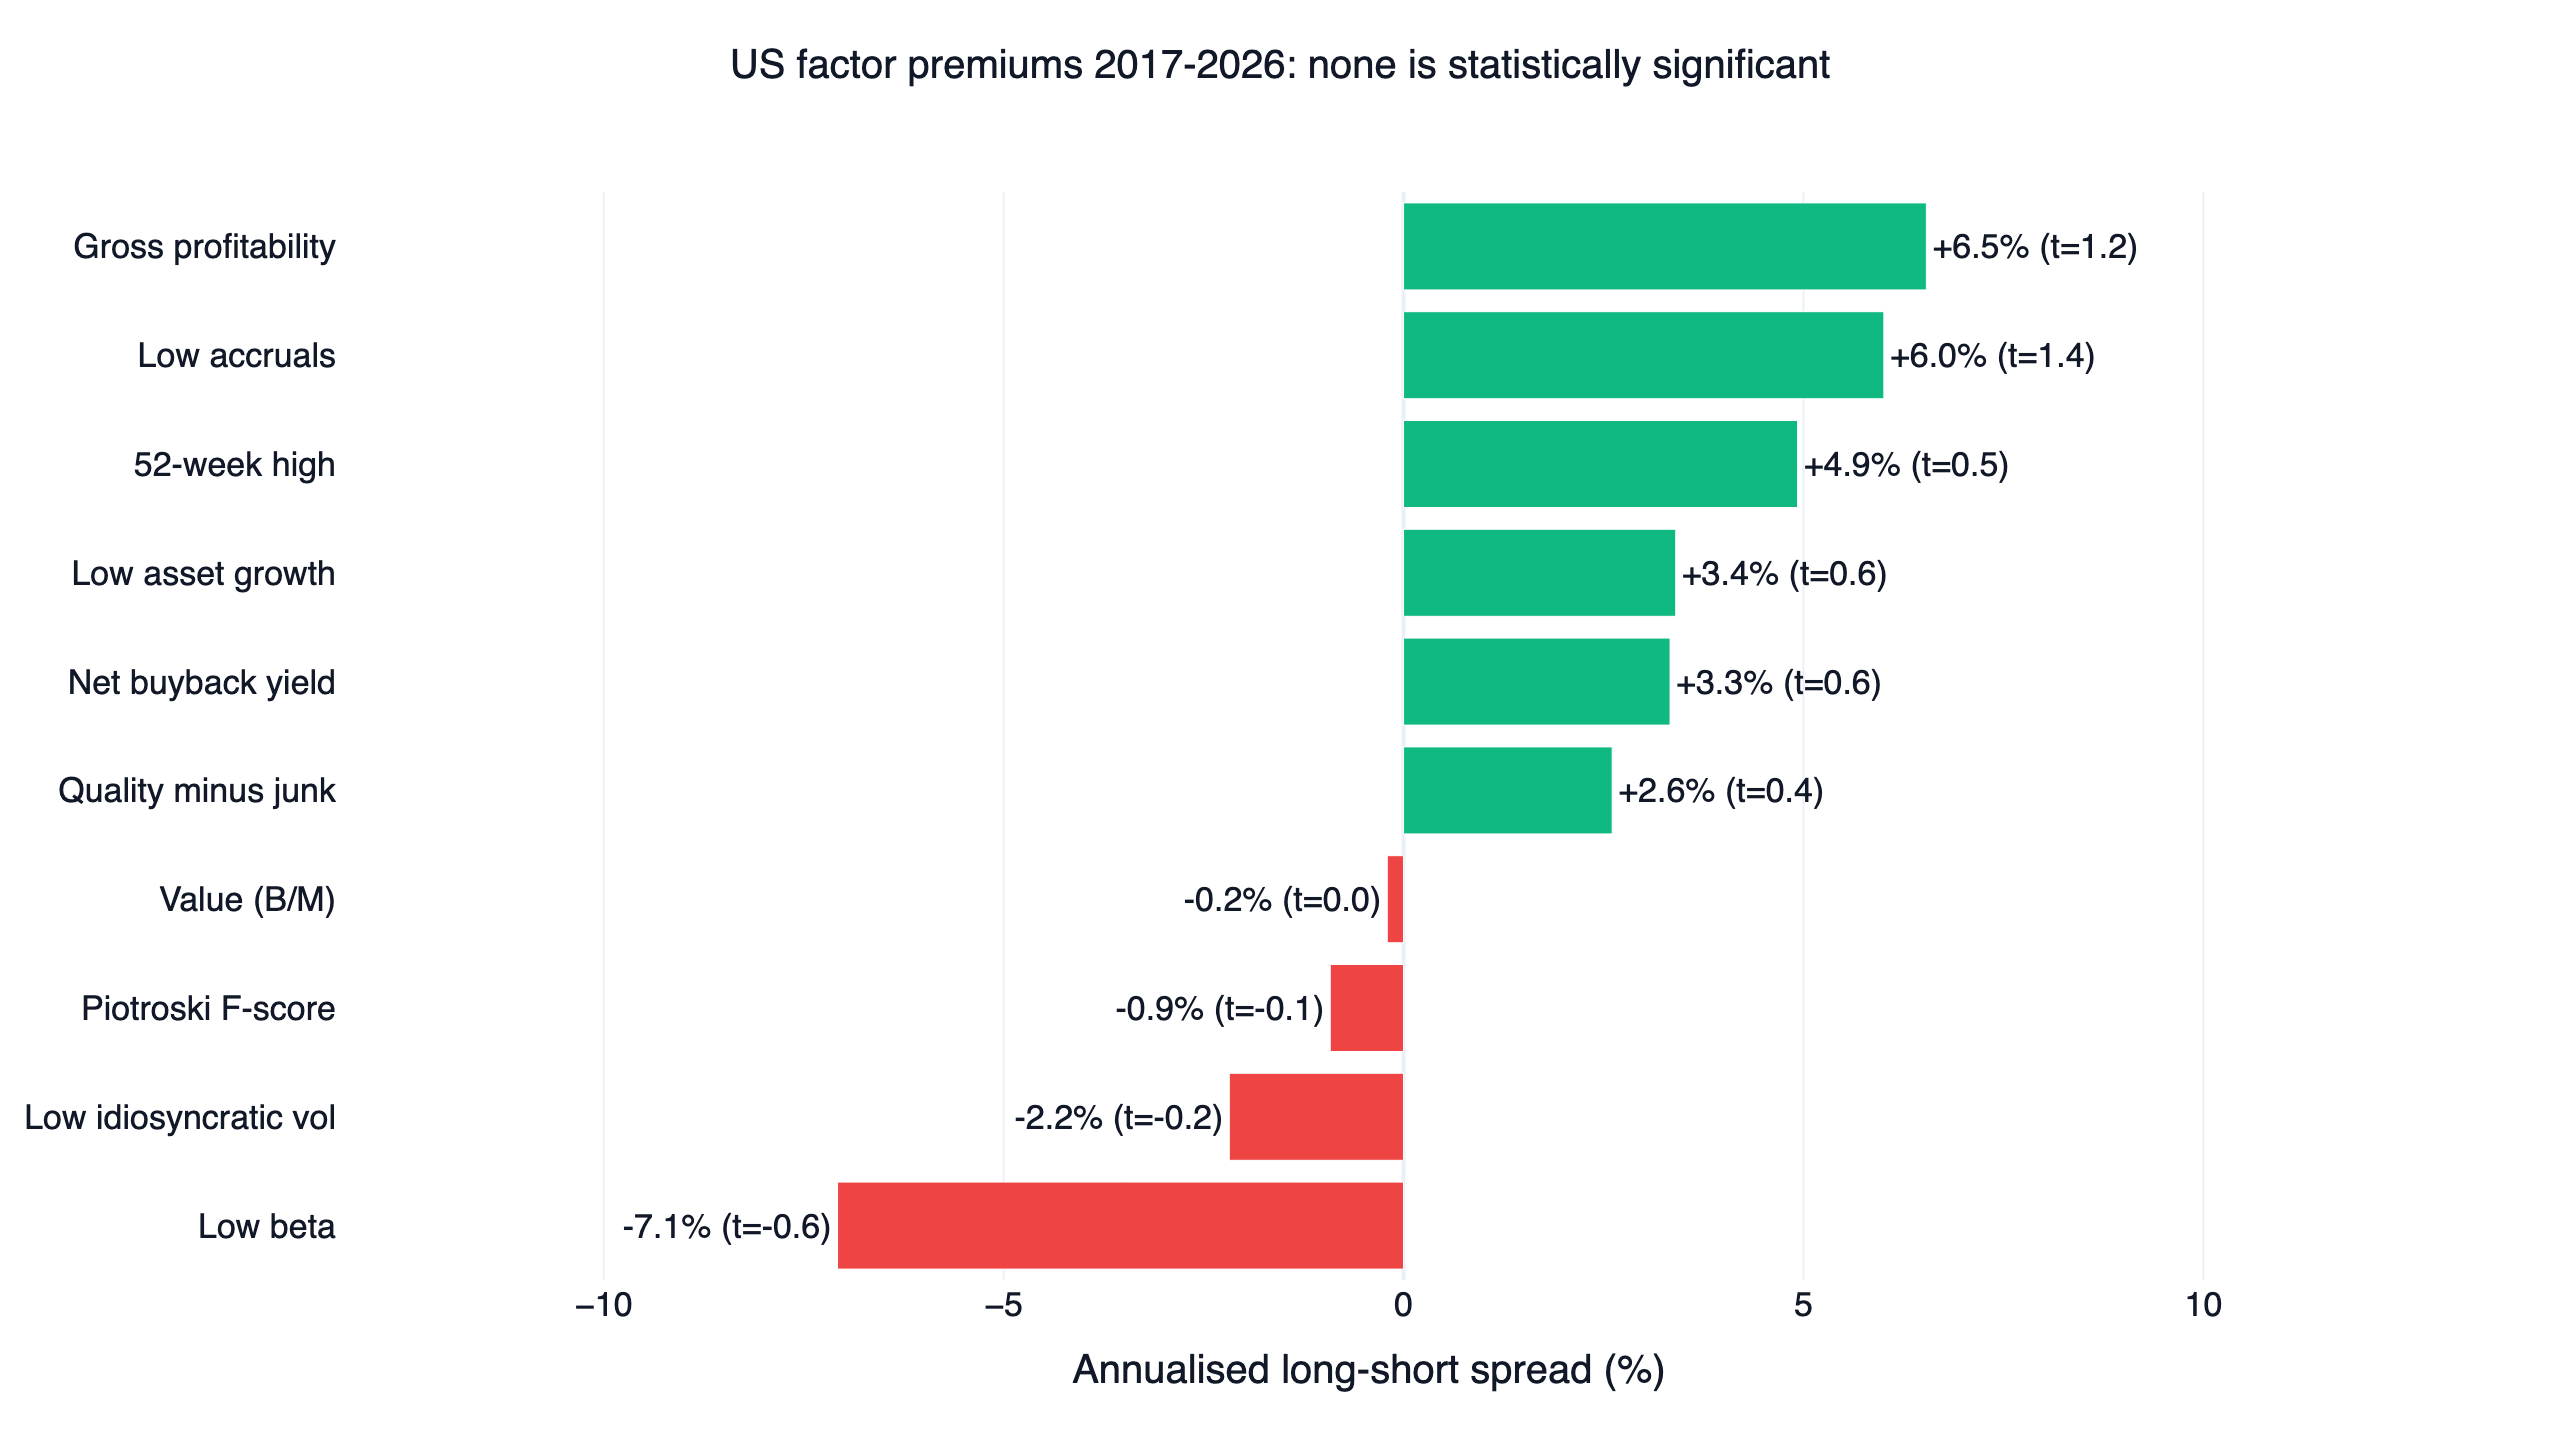
For the chart above we measured ten of the best-known factors on the 1,000 most liquid US stocks from August 2017 to October 2026. Six of the ten still sorted returns in the direction the papers predict, led by gross profitability and low accruals, but none of the spreads was statistically significant, value and low beta ran backwards, and no long-only version beat QQQ. The full portfolio test, with 90 parameter settings and every result against QQQ, is in Does Factor Investing Still Work?.
Key numbers: ten factors in US stocks, 2017-2026
| Factor | Family | Decile spread (annual) | t-stat | Rank IC | Long-only portfolio vs QQQ's 0.89 |
|---|---|---|---|---|---|
| Gross profitability | Profitability | +6.5% | 1.20 | 0.021 | 0.51, loses |
| Low accruals | Earnings quality | +6.0% | 1.39 | 0.002 | 0.38, loses |
| 52-week high | Momentum | +4.9% | 0.51 | 0.026 | 0.64, loses |
| Low asset growth | Investment | +3.4% | 0.56 | 0.006 | 0.52, loses |
| Net buyback yield | Issuance | +3.3% | 0.57 | 0.027 | 0.54, loses |
| Quality minus junk | Quality | +2.6% | 0.37 | 0.024 | 0.69, loses |
| Value (book-to-market) | Value | -0.2% | -0.03 | -0.003 | 0.33, loses |
| Piotroski F-score | Quality within value | -0.9% | -0.14 | 0.011 | 0.23, loses |
| Low idiosyncratic volatility | Low risk | -2.2% | -0.21 | 0.029 | 0.75, loses |
| Low beta | Low risk | -7.1% | -0.57 | 0.000 | 0.60, loses |
Decile spread is the average monthly return of the best-scoring tenth of the universe minus the worst tenth, times 12. Rank IC is the average monthly Spearman correlation between the score and the next month's return. A t-statistic below about 2 means the spread cannot be told apart from noise over this window; by rank IC, net buyback yield is the only factor above that line (t = 2.33), still short of the 3.0 hurdle proposed by Harvey, Liu and Zhu. Spreads are arithmetic averages, so a very volatile decile can post large average months and still compound slowly. That is why low idiosyncratic volatility shows a negative spread even though its calmest decile compounded at 10.3% a year and its most volatile at 6.5%. The last column comes from the portfolio test: Sharpe of a monthly 30-stock portfolio against QQQ's 0.89 (the F-score portfolio holds every qualifying stock, 34 on average). Every number in the table is produced by that study's strategy.py run with --deciles.
How factor investing works
There are three ways to put a factor to work, and they answer different questions.
- Long-short. Buy the top group, short the bottom group. This isolates the factor premium and is what most papers report. It needs a margin account, borrow, and tolerance for long stretches of losses.
- Long-only tilt. Hold only the top group, or overweight it. This is what most individual investors can do, and it keeps all of the market's ups and downs. A long-only portfolio wins only if the factor premium is larger than the gap between the stocks it can hold and the benchmark it is measured against.
- Factor ETFs ("smart beta"). Funds that track a rules-based factor index. They are cheap and diversified, but the rules are fixed by the index provider.
All three start from the same step: a score per stock per date, built only from information available on that date.
The classic factor families
Value buys stocks that are cheap relative to fundamentals, usually book-to-market or earnings yield. Profitability and quality buy firms with high gross profit relative to assets (Novy-Marx, 2013) or that score well on a basket of profitability, growth, safety and payout measures (Asness, Frazzini & Pedersen, 2019); the Piotroski F-score is a nine-signal version applied to cheap stocks. Investment and issuance favour firms that grow assets slowly and buy back shares; slow asset growth is how the Fama & French (2015) five-factor model defines its investment factor. Size, the small-cap premium, is the other classic family; it is not tested here because the universe keeps only the 1,000 most liquid names. Earnings quality prefers profits backed by cash over accruals. Momentum buys recent winners (Jegadeesh & Titman, 1993); the 52-week-high factor is a variant based on how close a price is to its yearly peak. Low risk holds low-beta or low-volatility stocks on the evidence that they earn about as much as risky ones.
The definitions, formulas and paper for each of the ten tested here are in the factor-by-factor section of the backtest.
How the premiums looked in US stocks, 2017-2026
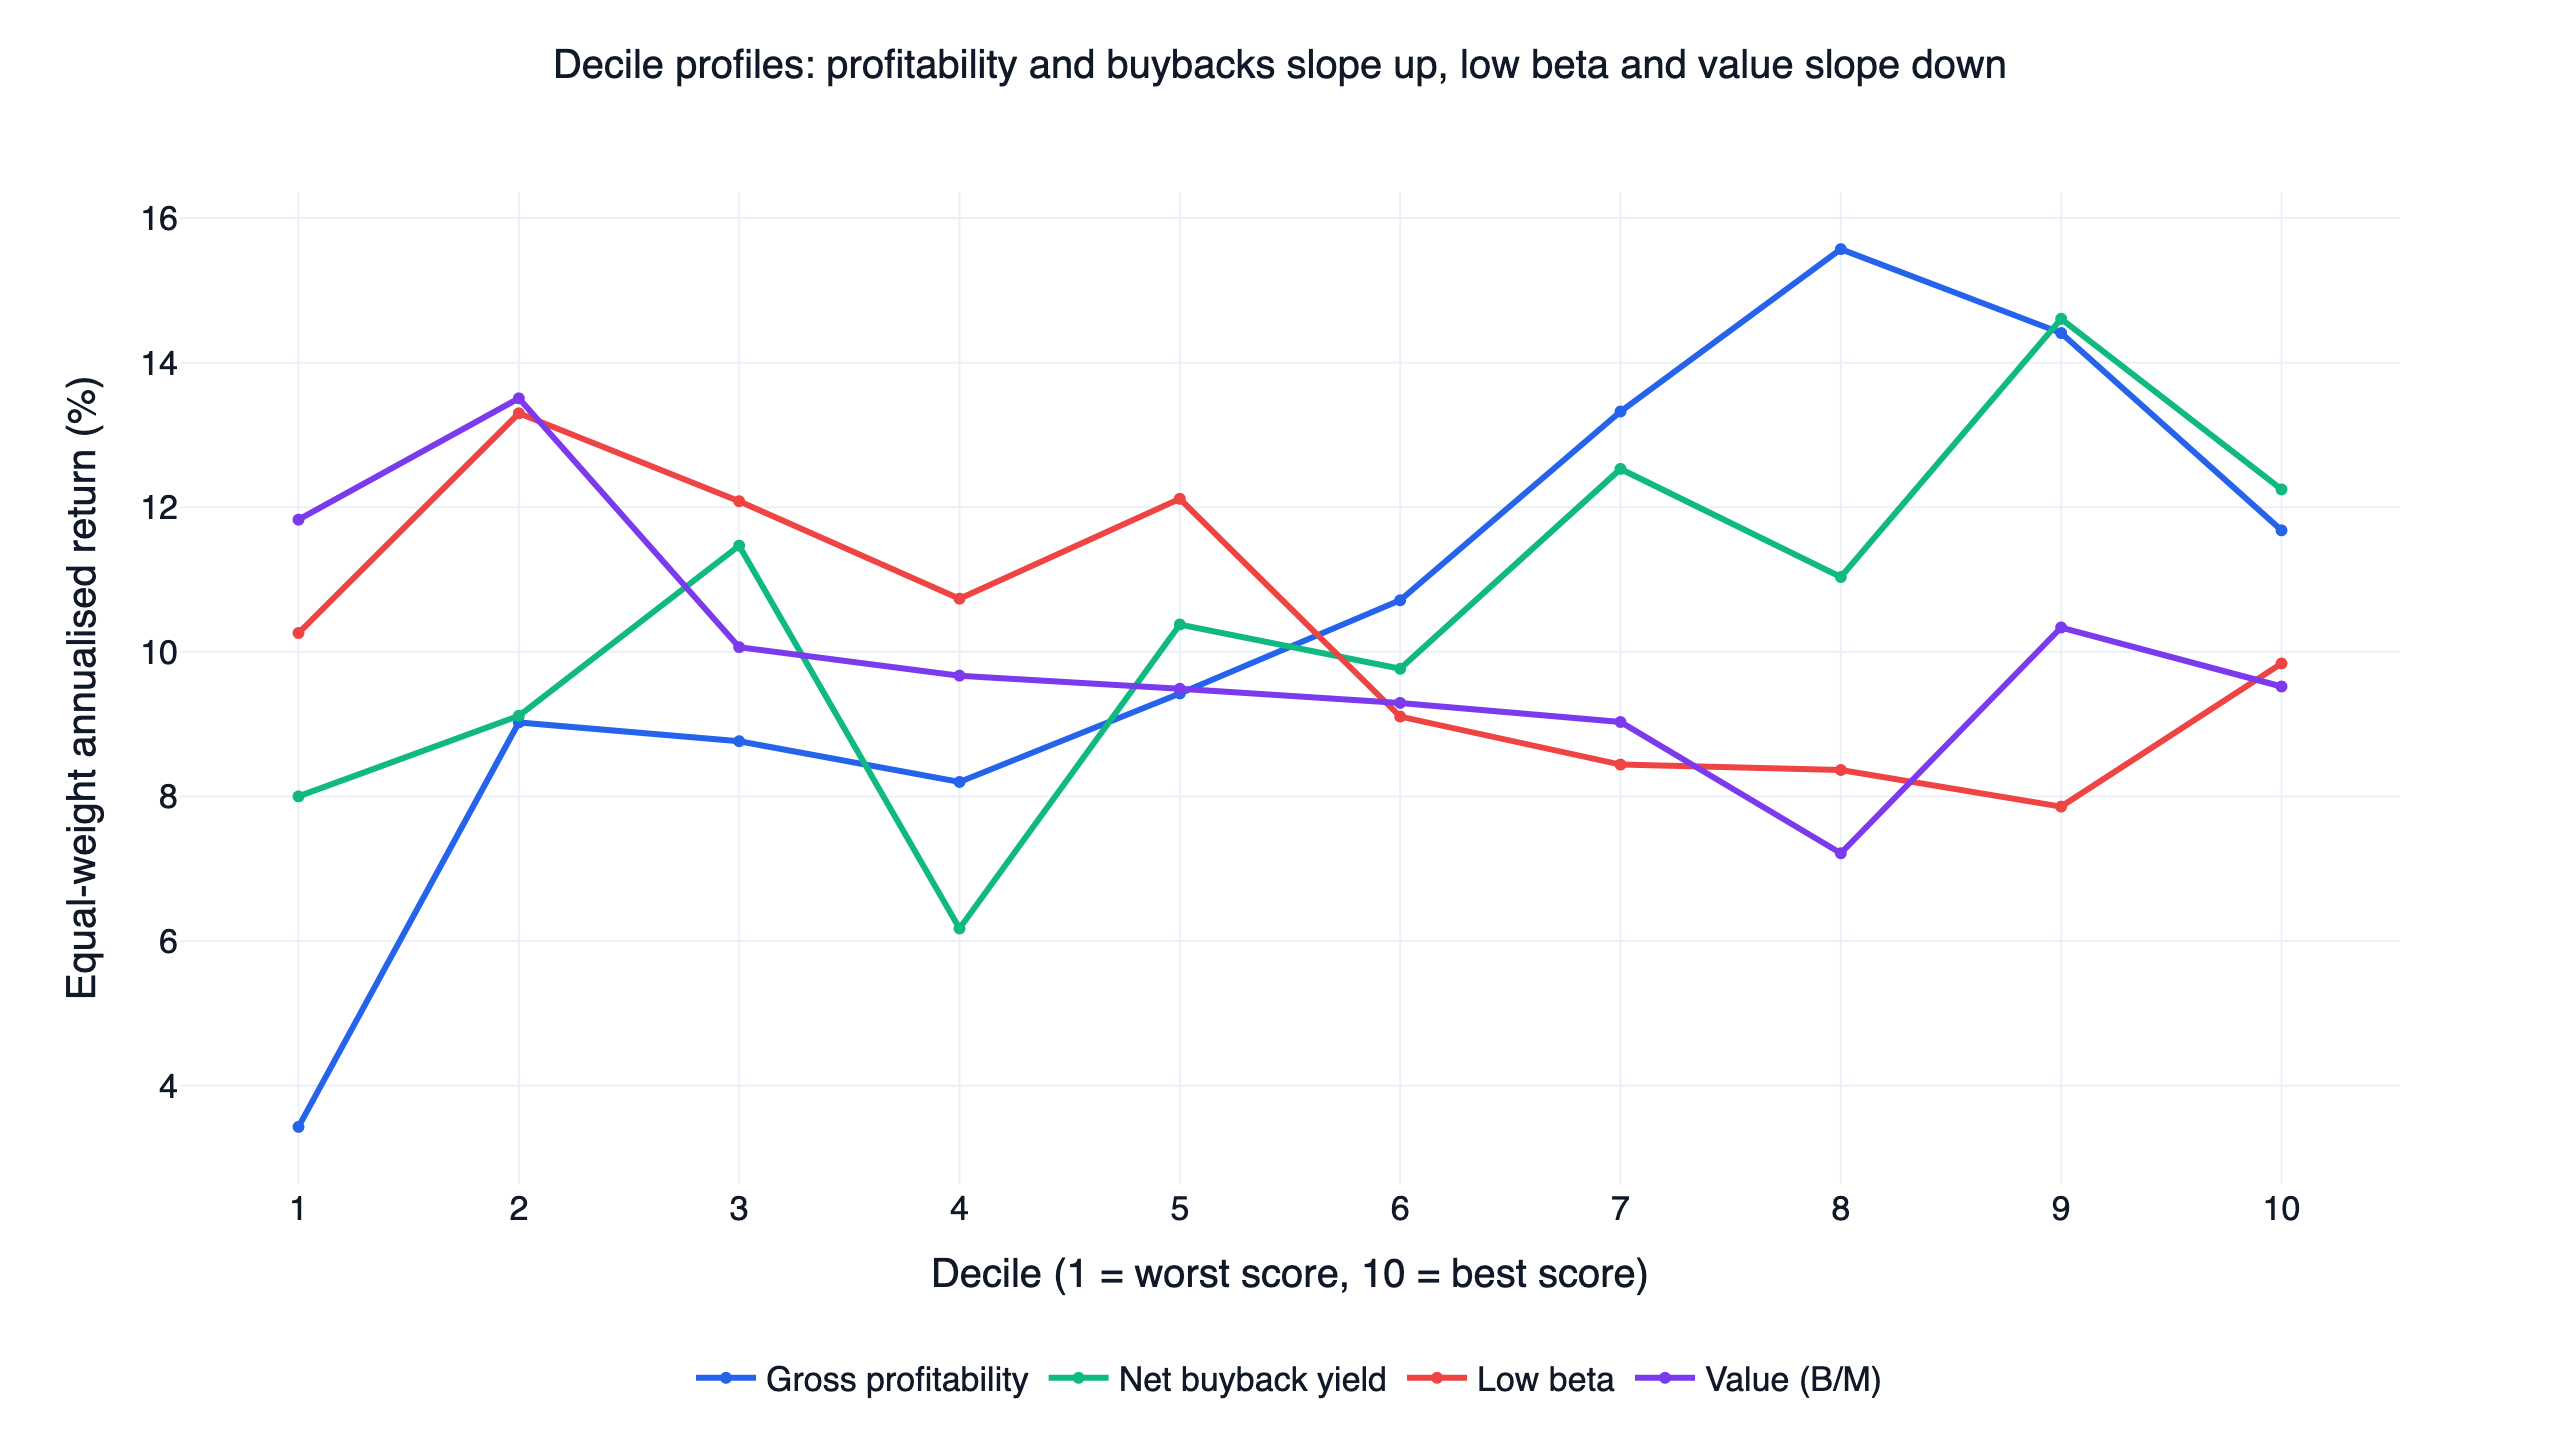
A working factor shows a staircase: each decile returns more than the one before it. Gross profitability comes closest: the worst decile compounded at 3.4% a year and the eighth at 15.6%, though the top two deciles gave some of that back (14.4% and 11.7%). Net buyback yield climbs unevenly from 8.0% to 12.2%. Value and low beta slope the other way: the cheapest decile by book-to-market earned 9.5% a year against 11.8% for the most expensive, and the lowest-beta decile 9.8% against 10.3% for the highest-beta one, while the second-highest-beta decile reached 13.3%.
Three readings matter for anyone building a factor strategy. First, a positive spread is not the same as a profitable portfolio: gross profitability had the largest spread in the table, yet its 30-stock portfolio scored a 0.51 Sharpe, below even the equal-weight universe (0.57). The spread compares two extreme deciles of about 100 stocks each, and a long-only portfolio captures only the top end. Second, both low-risk factors had negative spreads in this window: as high-beta growth stocks led the market, the riskiest deciles had the biggest average months. Third, none of the spreads is large enough relative to its noise to be confident about from nine years alone; that is the normal state of factor research, and why papers use 30 to 50 years of data.
Factors are not interchangeable
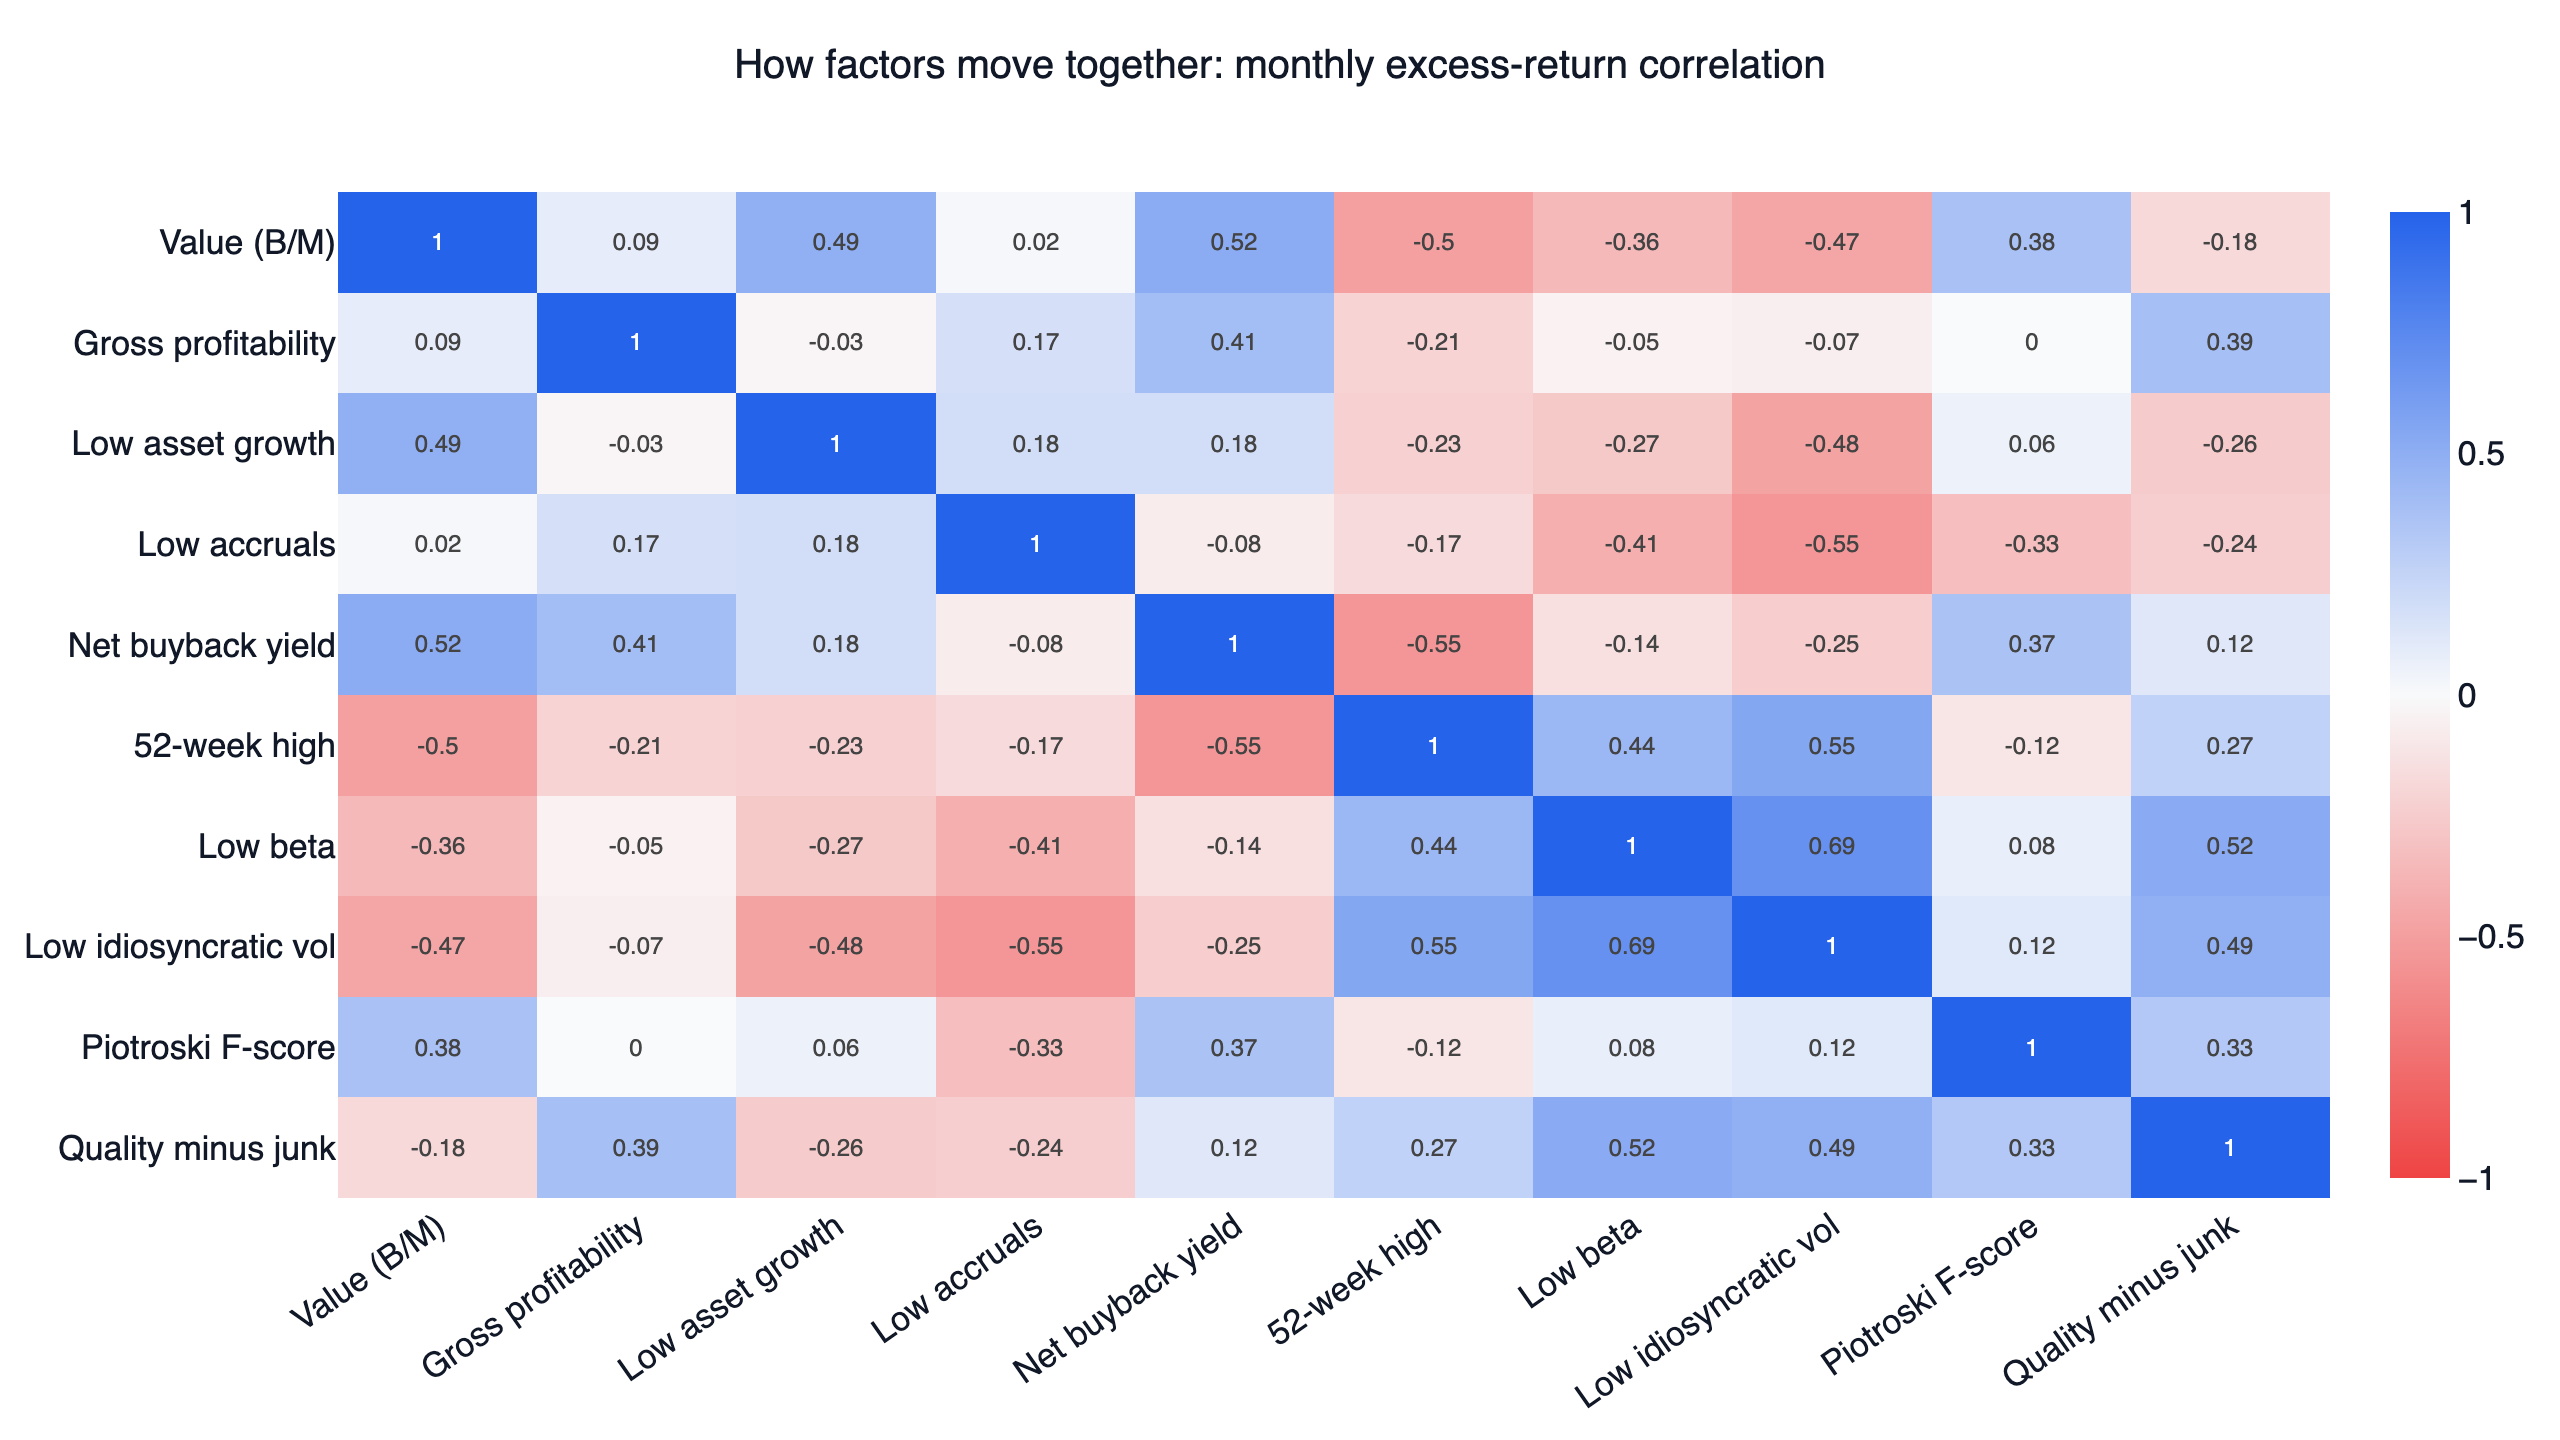
Each cell is the correlation between two factors' monthly returns in excess of the equal-weight universe, so it shows whether two factors bet on the same stocks. Two clusters stand out. Low beta, low idiosyncratic volatility and the 52-week high move together (0.44 to 0.69), and quality minus junk leans toward the two low-risk factors (0.52 and 0.49). Value pairs with net buyback yield (0.52) and low asset growth (0.49). Between the clusters the correlations turn negative: value against the 52-week high is -0.50, and net buyback yield against the 52-week high -0.55. Gross profitability sits near zero with most factors except buybacks (0.41) and quality minus junk (0.39). For a multi-factor portfolio, the useful combinations are the ones with low or negative correlation, because their bad years do not line up.
When factors win: year by year
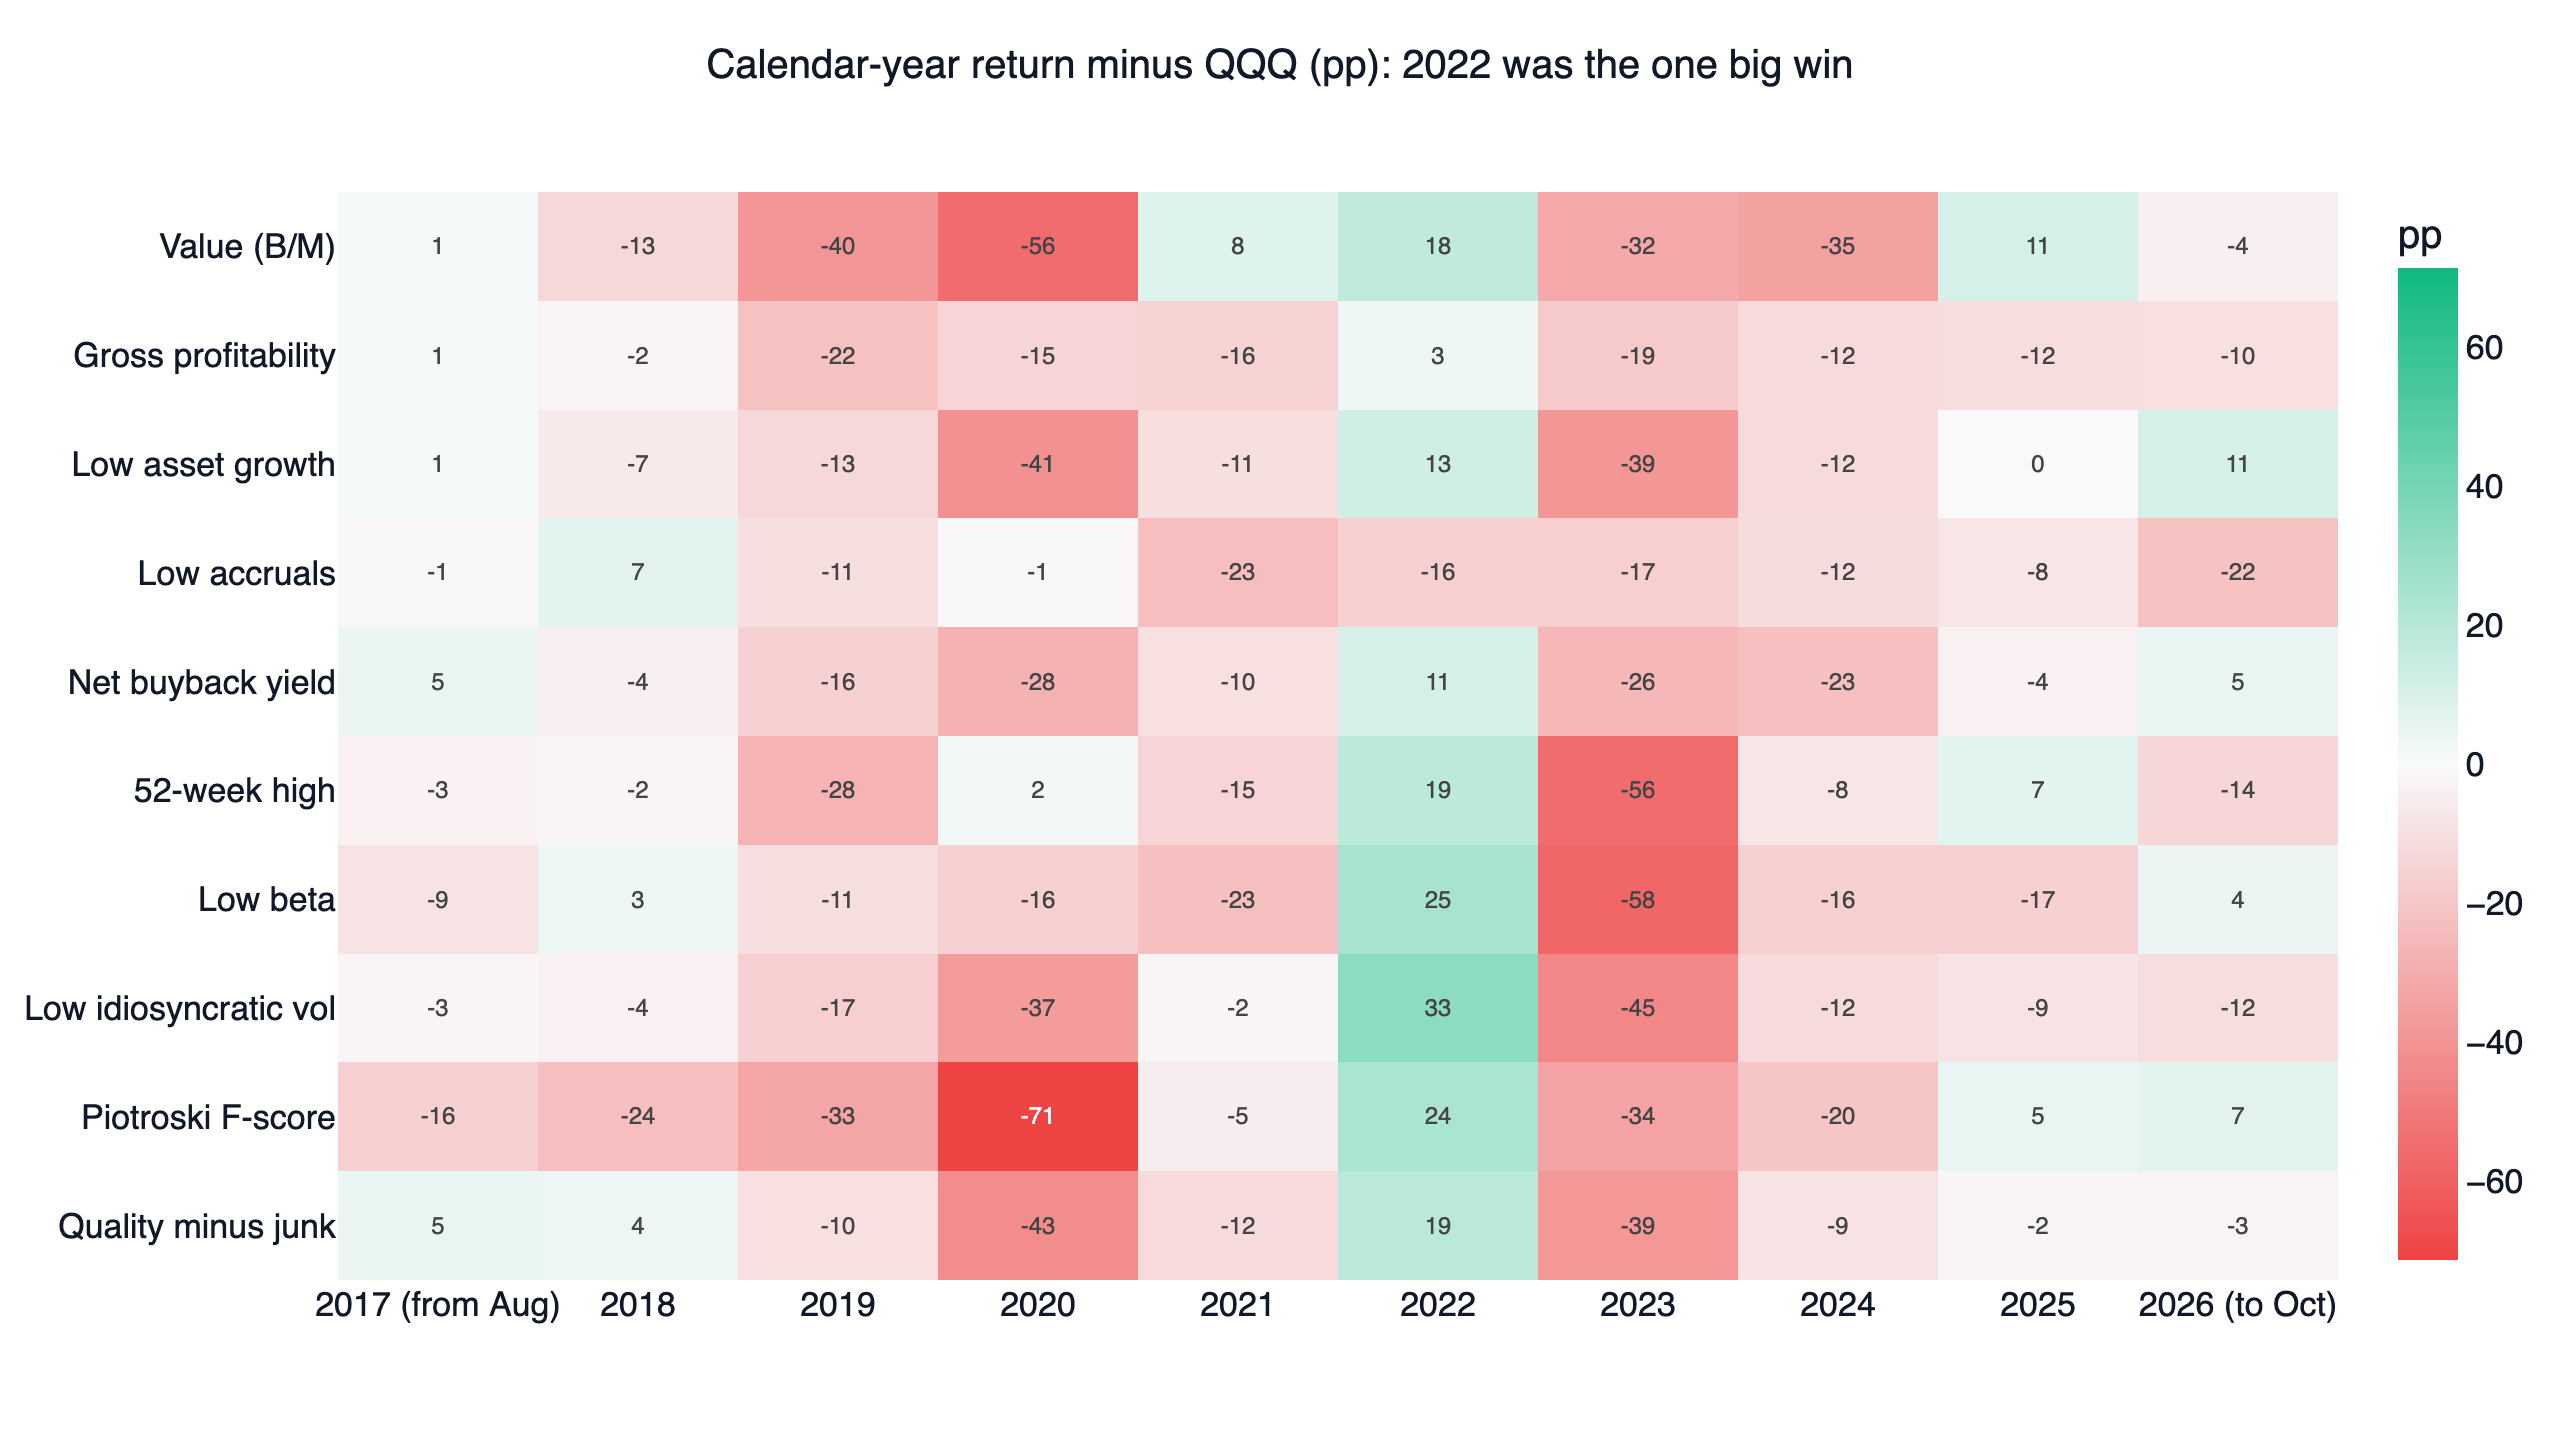
QQQ out-returned most factor portfolios in most years; in 2019, 2023 and 2024 not one factor beat it. 2022 was the exception. QQQ fell 32.6%, and nine of the ten factor portfolios lost less: low idiosyncratic volatility finished the year up 0.7%, 33 percentage points ahead, and low beta was 25 points ahead. The one factor that did worse, low accruals, fell 48.8%. This is the pattern that keeps factor investing alive despite long losing streaks: factor portfolios hold up when the stocks that dominate a cap-weighted index fall hardest. It is also why a nine-year average can mislead in either direction.
Why factor premiums shrink
Factor returns are not fixed constants. McLean & Pontiff (2016) studied 97 published predictors and found returns 58% lower after publication, about 32 points of which they attribute to investors trading on the published result. Harvey, Liu & Zhu (2016) counted more than 300 claimed factors and argued that a new one should clear a t-statistic of about 3, not 2, because so many have been tried. Hou, Xue & Zhang (2020) replicated 452 anomalies and found most lose significance once tiny stocks stop dominating the averages. A liquid-universe test like ours sits closer to the replication studies than to the original papers.
How to start factor investing, step by step
- Pick one factor and write its formula down: which statement items, which dates, which direction is good.
- Fix the universe before looking at results: liquidity floor, price floor, sectors excluded, and delisted stocks kept in.
- Align data by availability: use filing dates for fundamentals so the score never sees a number before it was public.
- Test the factor before the portfolio: decile spreads and rank IC show whether the score sorts returns at all.
- Then build the portfolio and test it against the benchmark you actually hold, across neighbouring parameters and in separate halves of the sample.
- Decide what you will do in the bad years before you start, because every factor has them.
With FinLab, steps 2 to 5 are a conversation: install the FinLab skill for your AI agent and ask it to score the US universe on the factor you chose. The AI-assisted setup walks through installation.
Advantages and risks
Advantages
- Rules replace stock-by-stock judgment, so results can be tested and repeated.
- A factor applies to thousands of stocks at once, which spreads company-specific risk.
- Decades of published evidence describe how each factor behaves, including how badly it can lose.
- Combining low-correlation factors can smooth returns.
Risks
- Premiums can shrink or disappear after they become well known.
- Long losing streaks against the index are normal; value trailed for most of the 2010s.
- Backtests flatter factors through data mining, look-ahead errors, and survivorship bias.
- Long-only portfolios carry the full market risk on top of the factor bet.
- Turnover and trading costs eat into small premiums.
Who factor investing suits
It suits investors who want a rule they can test, who can hold through several years of underperformance, and who measure results against the benchmark they would otherwise own. It suits less well anyone who needs to beat a concentrated index such as QQQ every year, or who would abandon the strategy after one bad year, since that is precisely when factor premiums have historically been earned.
FAQ
What is factor investing in simple terms? Buying stocks because they share a measurable trait linked to better long-run returns, chosen by a rule applied to the whole market.
What are the main investment factors? Value, size, momentum, profitability or quality, investment, and low volatility. The Fama-French five-factor model uses market, size, value, profitability and investment.
Which factors still earn a premium in US stocks? In the 1,000 most liquid US stocks over 2017-2026, six had a positive decile spread: gross profitability, low accruals, the 52-week high, low asset growth, net buyback yield and quality minus junk. Value, the F-score, low idiosyncratic volatility and low beta were negative. None of the six positive spreads was statistically strong, and no long-only version beat QQQ; see the full backtest.
Is factor investing the same as smart beta? Smart beta ETFs are one way to implement factor investing. Factor investing is the broader idea, including custom long-only and long-short portfolios.
What is a good factor? One with a clear economic reason, a spread that survives neighbouring parameters and different periods, low correlation with factors you already hold, and enough liquidity to trade.
How is factor investing different from momentum trading? Momentum is one factor. Factor investing covers any rule-based characteristic; see the US momentum study for a momentum example and the quality value backtest for fundamentals.
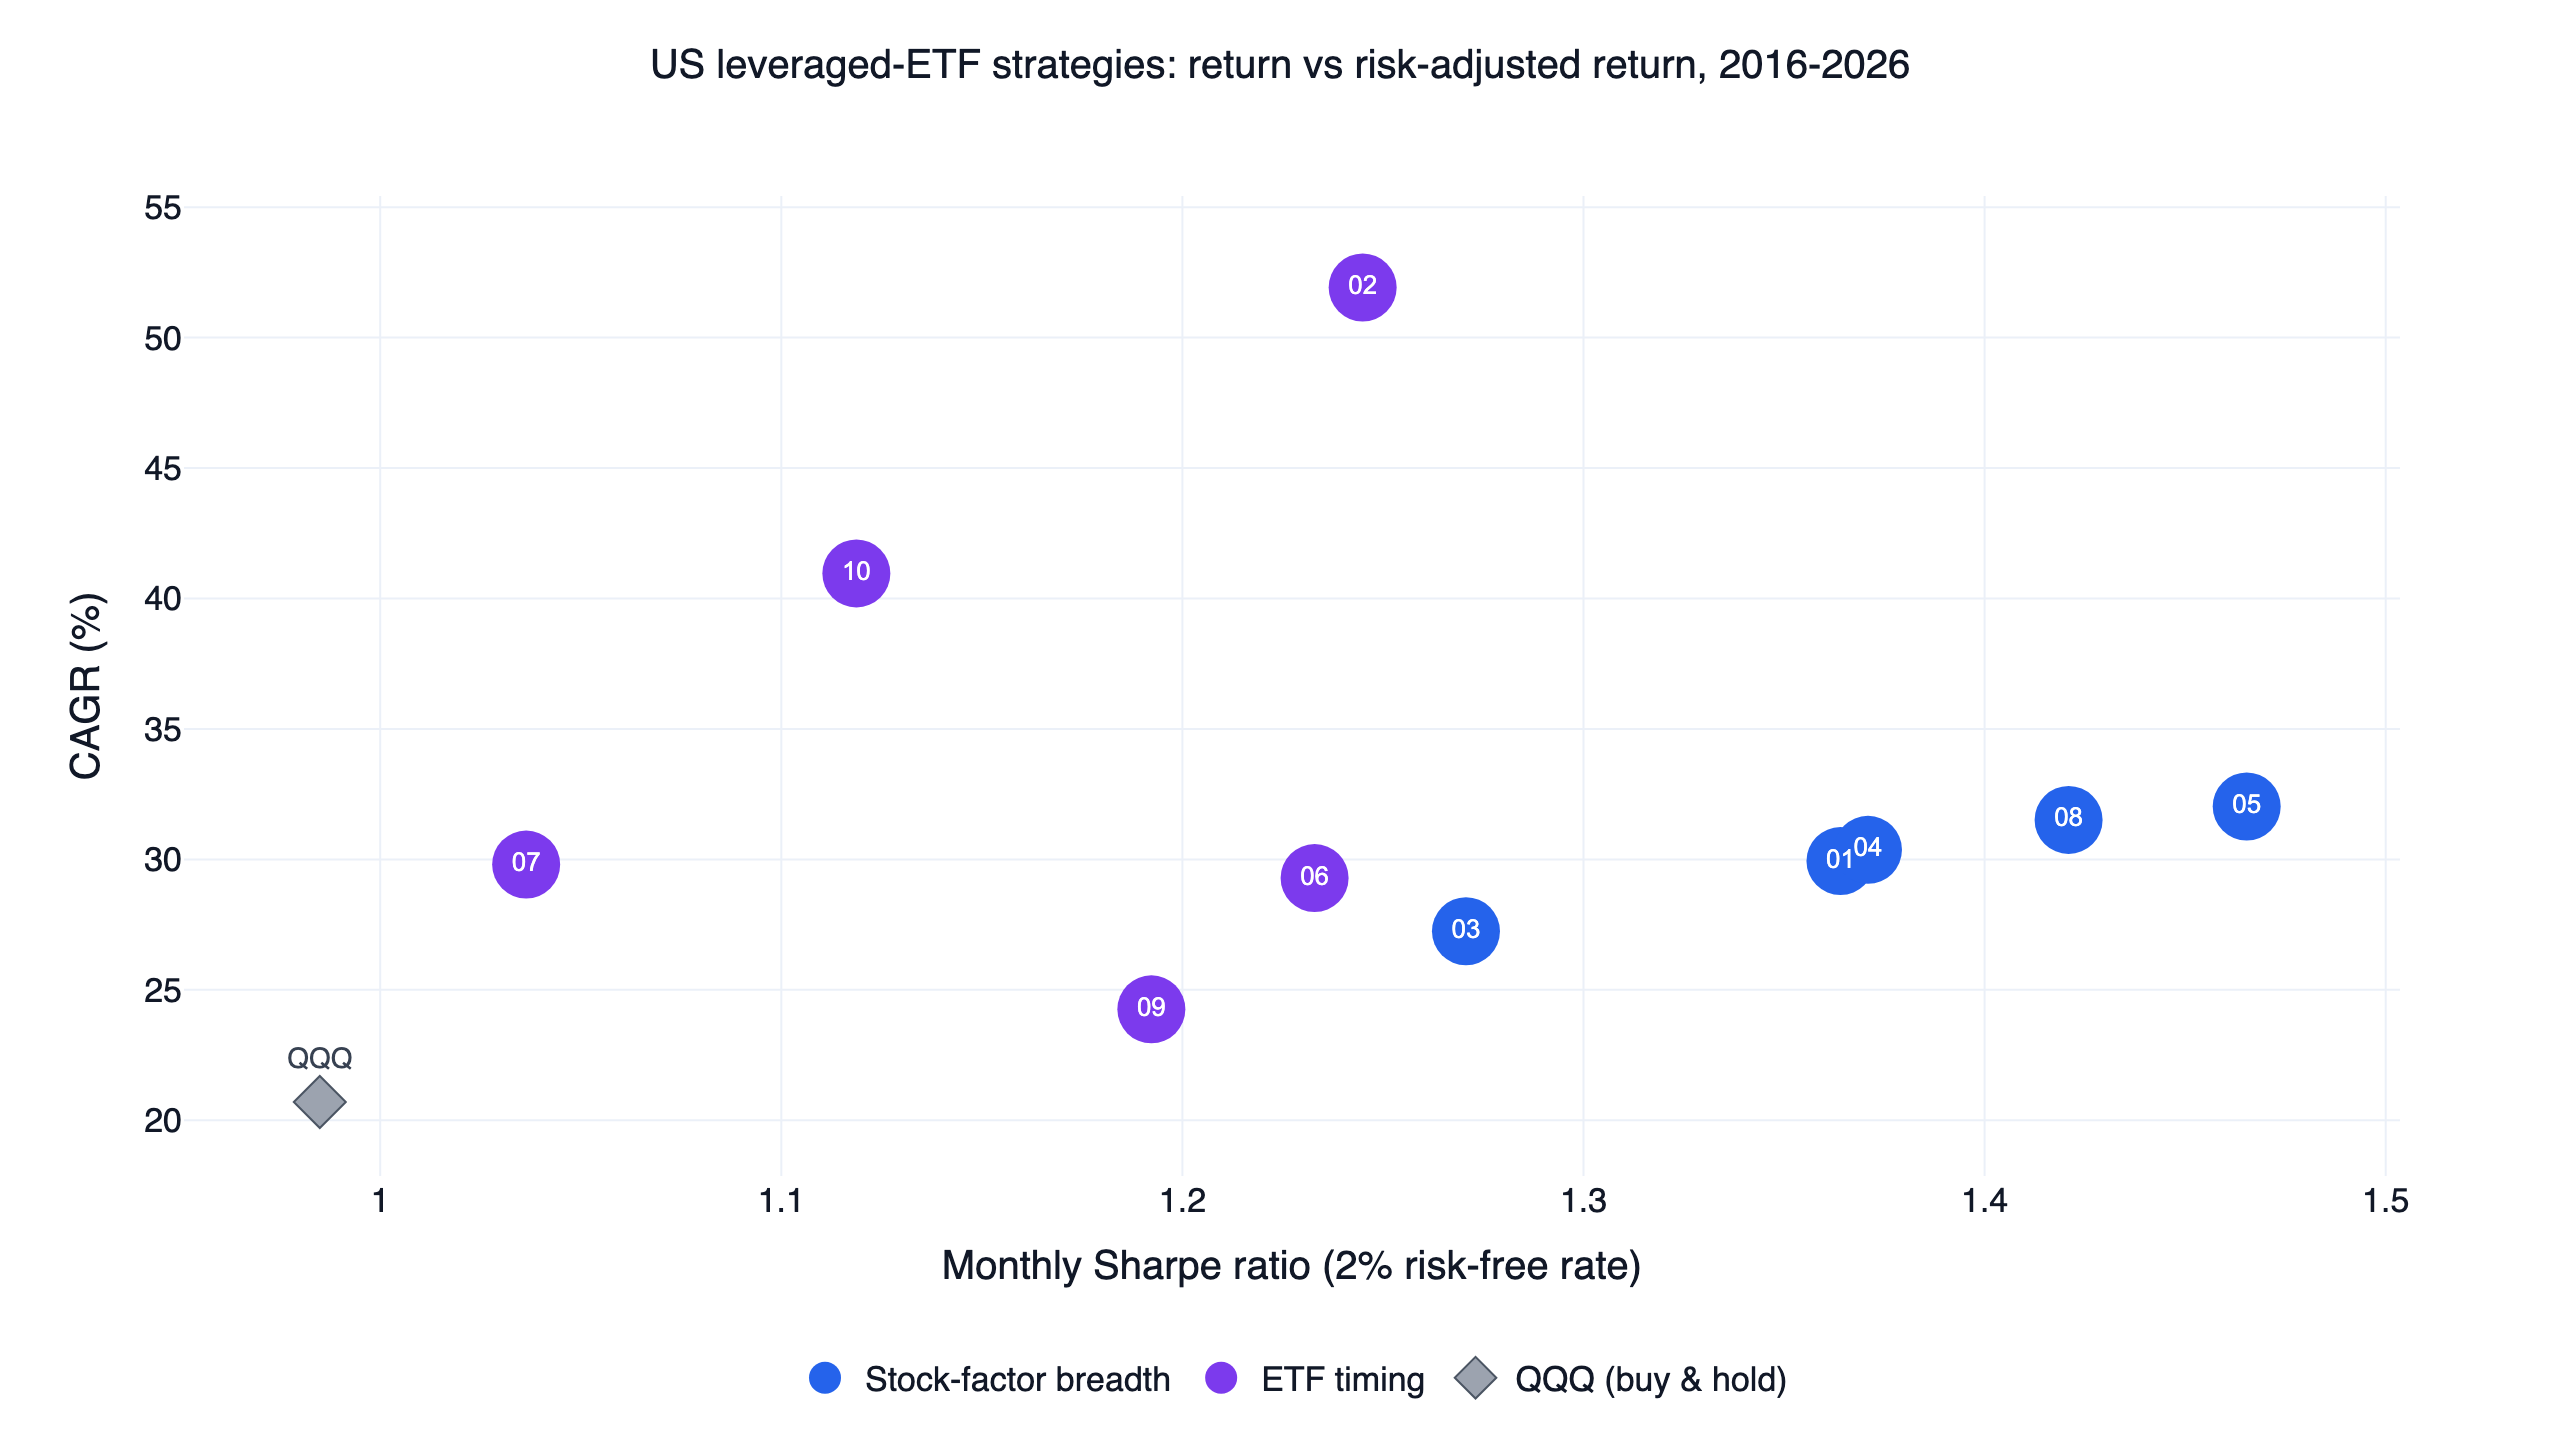
Can factor signals be used for market timing instead of stock picking? Yes. The US quant trading strategies comparison covers ten systems that switch in and out of 2x and 3x leveraged index ETFs; five use stock-level factor breadth as the signal and five use the ETFs' own price behaviour. They beat QQQ in that backtest, and the leverage is both part of the reason and an extra source of risk.
Further reading
- Low volatility investing strategy backtest and post-earnings announcement drift: two US strategies that apply a volatility filter and an earnings-surprise signal to leveraged index ETFs, with full code.
- Definitions of beta, alpha and the other terms used here: FinLab glossary.
- All research write-ups: FinLab blog; who we are: about FinLab.
Last updated: 2026-10 | Data window: 2017-08 to 2026-10 | Source: FinLab US factor backtest | Author: FinLab Quant Research (reviewed by a quantitative researcher)
Past performance does not represent future results. This page is for education only, is not investment advice, and does not constitute investment advice.
FinLab AI
Want to build your own strategy?
Describe your stock-picking ideas in natural language. AI automatically validates, backtests, and gives you answers
Start Free