Backtesting applies a specified investment rule to historical data to estimate how its portfolio would have behaved. A useful backtest shows the return path, losses, positions and costs, with the information available at each decision. It is a simulation of a rule under assumptions, not a prediction of future returns.
To backtest a portfolio, define the instruments, target weights, rebalancing dates and trading friction. To backtest a trading strategy, also define the signal and exit rules. A fixed SPY/QQQ allocation and a momentum system answer different questions, but both need a common date window and a fair passive benchmark.
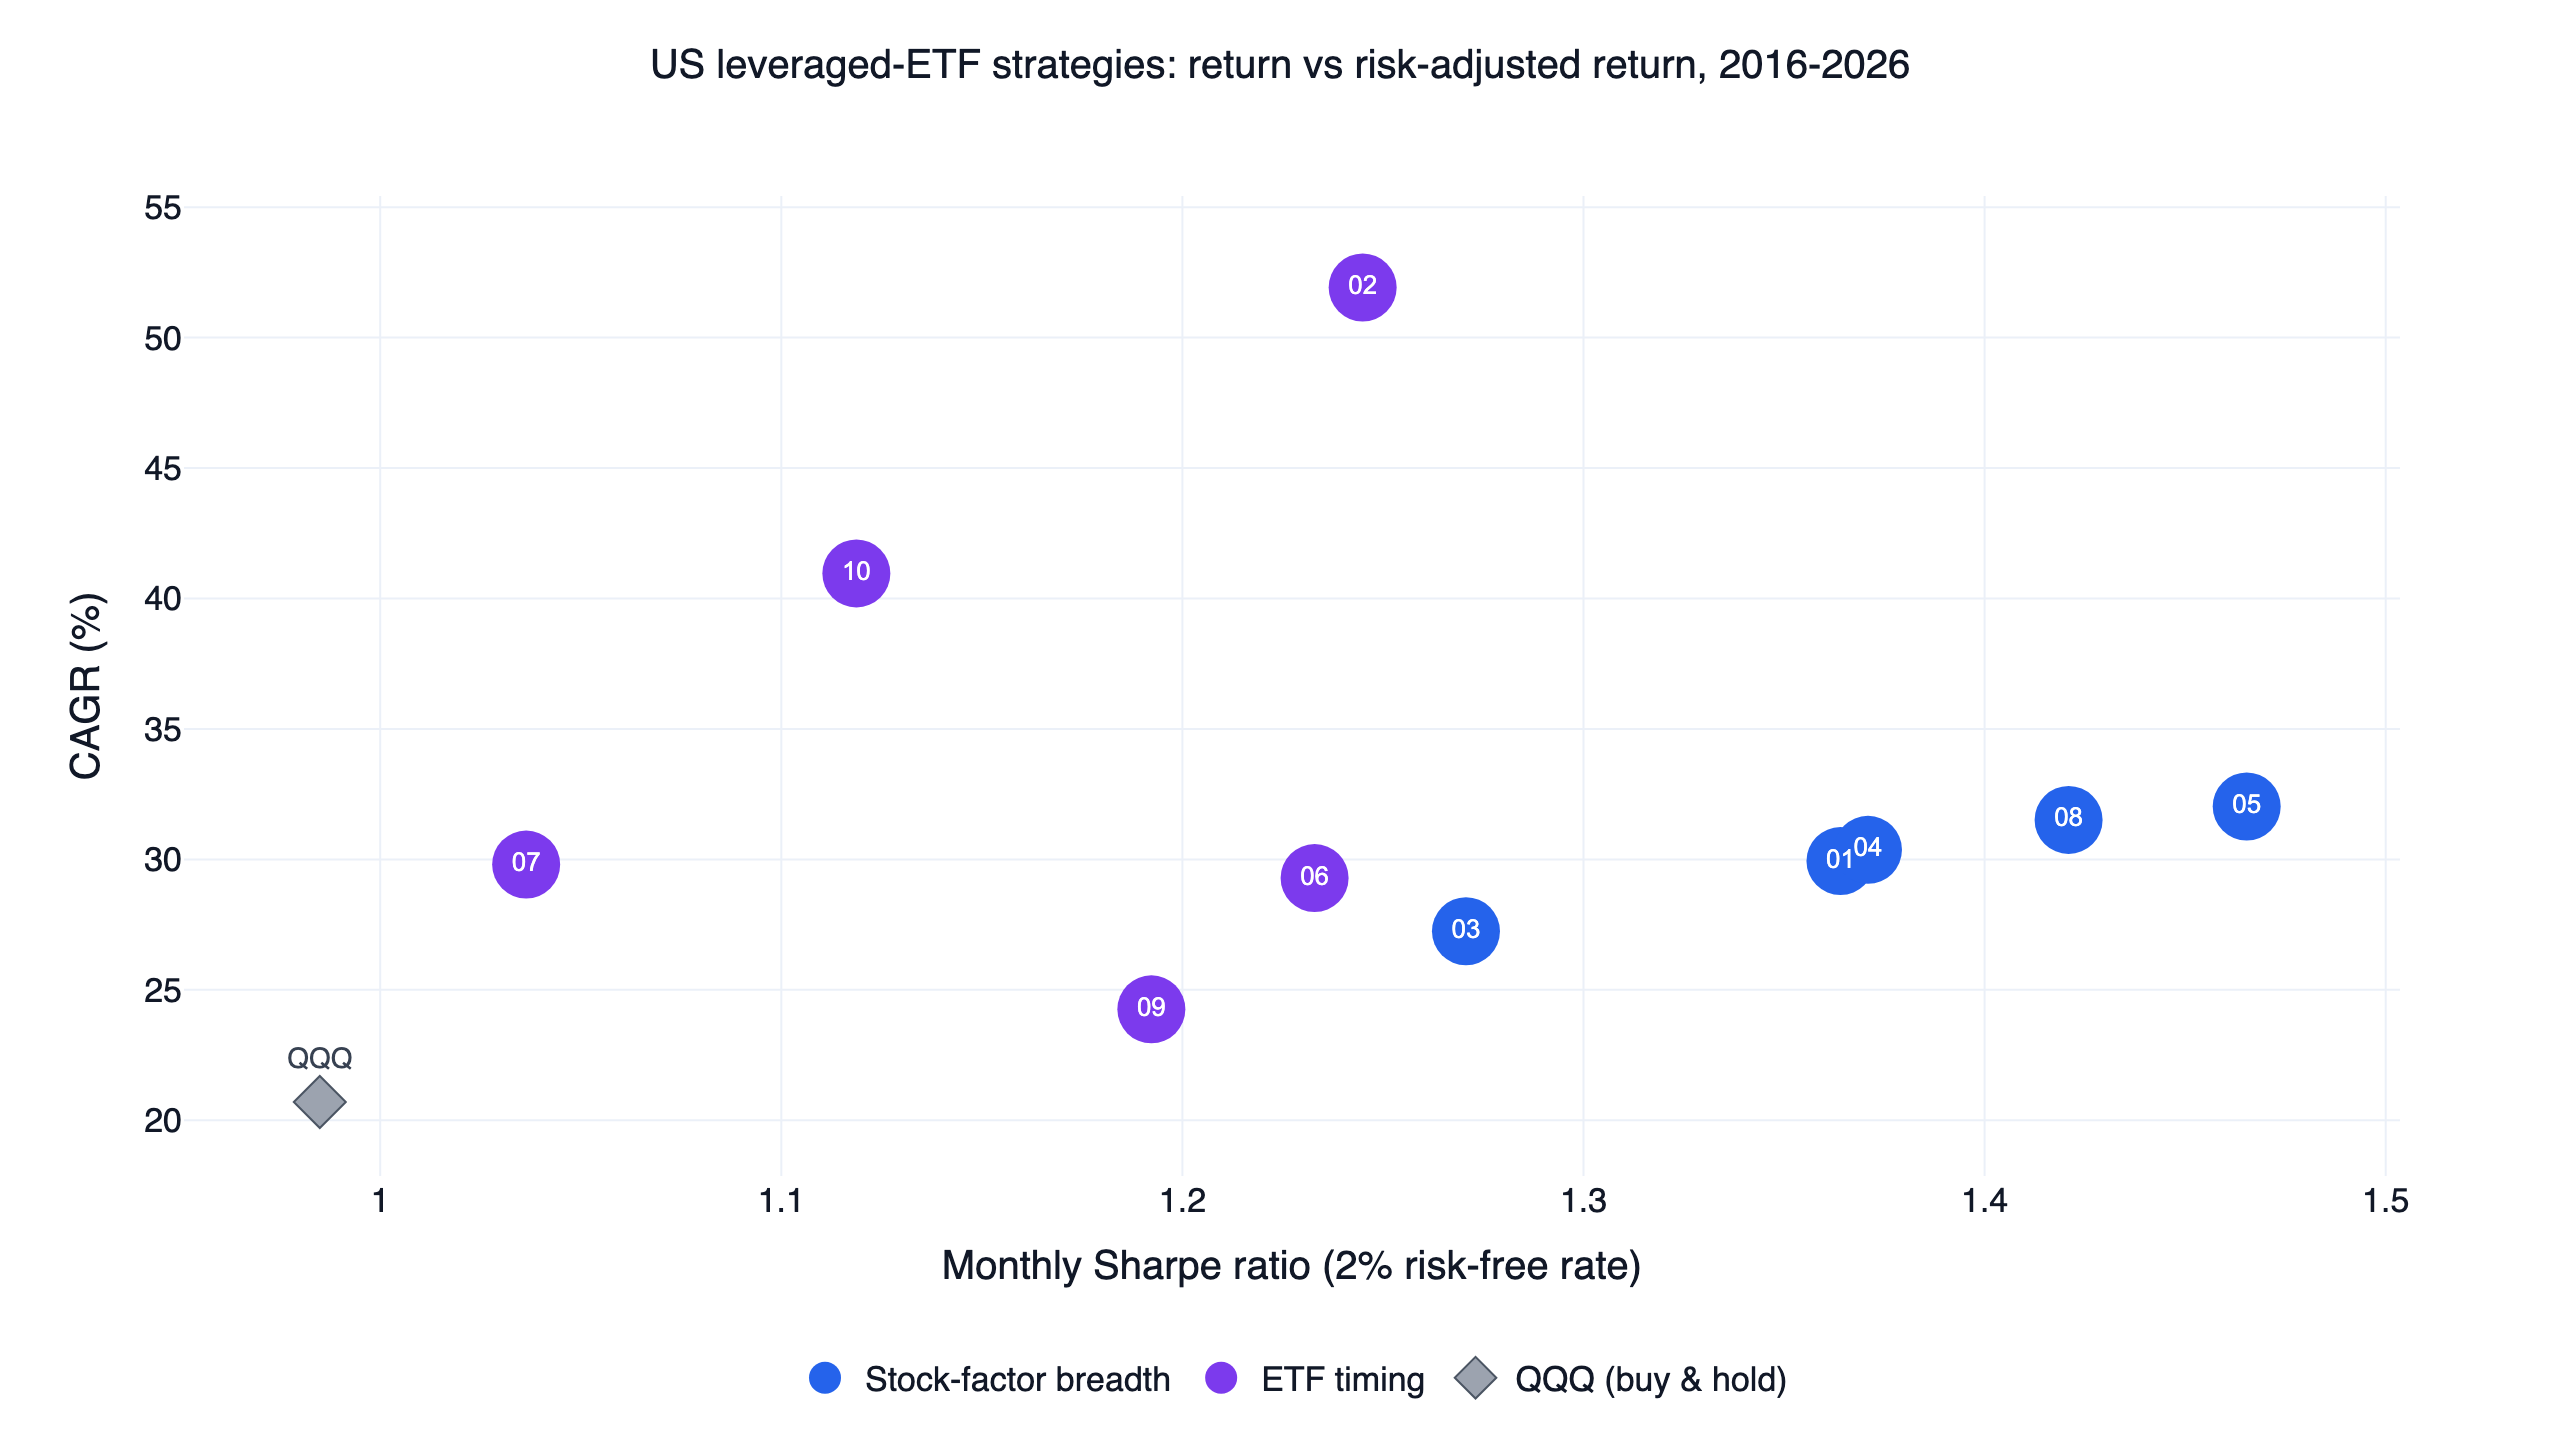
What a backtest can tell you
| Output | Question it answers | What to check alongside it |
|---|---|---|
| CAGR | How quickly did wealth compound? | Start date, end date, cash flows and costs |
| Sharpe ratio | How much excess return accompanied variability? | Return frequency and risk-free convention |
| Max drawdown | How far did equity fall from a previous peak? | Duration, recovery and the visible equity path |
| Positions and trades | What did the rule actually own and change? | Signal timing, weights, concentration and fills |
| Turnover | How much portfolio activity did the rule require? | Spreads, slippage, fees and capacity |
| Period-by-period returns | When did it succeed or fail? | Passive alternatives over identical dates |
A report cannot establish that you could have filled every historical trade at the modeled price. It cannot reveal the result of a market regime absent from the sample. Those limits affect short-horizon and illiquid strategies especially strongly. A long history helps, but a longer history with incorrect information timing can still produce a misleading result.
How to backtest a portfolio in Studio
- Open FinLab Studio and sign in using the normal account flow.
- Describe one complete experiment. For example: “Backtest a 50/50 SPY and QQQ portfolio from 2016, rebalance monthly, include 0.1% per-side trading friction, and compare dividend-adjusted QQQ and SPY over the same dates.”
- Ask the assistant to show the instruments, market, start and end dates, weights, costs and execution model before interpreting the result.
- Run the experiment. Inspect the returned equity curve, drawdown, monthly returns and trade list, and save the script and standalone report.
- Reserve an evaluation period and run a cost sensitivity check before changing the allocation. Compare every version with the original baseline.
The suggested 0.1% is a sensitivity assumption, not a broker quote. If you know your intended execution costs, state them. For a real portfolio, also specify whether new deposits, withdrawals, taxes and cash interest should be included. A time-weighted strategy report and an investor's money-weighted experience can differ when cash flows occur.
Studio supports a hosted workflow. If you prefer a local compatible agent, use the AI-assisted setup guide, then ask for the same experiment. The AI agent guide explains the research integration. A strategy simulation does not grant brokerage permissions or place real orders.
U.S. stocks and ETFs use different data markets
Use the U.S. stock market for single-name equities and the U.S. fund market for ETFs such as SPY and QQQ. FinLab exposes these as data.set_market("us") and data.set_market("us_fund"). Check the selected market when a strategy combines a stock-factor signal with an ETF execution portfolio.
Adjusted prices account for corporate actions in historical return calculations. Raw close and volume may be appropriate for a dollar-volume liquidity filter, while adjusted prices are needed for return comparisons. Do not mix a price-only benchmark with a dividend-adjusted strategy and attribute the difference to skill.
Company accounts need publication dates. A quarter ending in September may be reported in November, so a September trade cannot use that filing's result. A historical universe must also reflect which securities existed and were eligible then. The look-ahead-bias guide explains information timing and survivorship as distinct checks.
A Python example you can inspect
This experiment constructs an equal-weight ETF portfolio and saves its report. It is an instructional setup with no claimed return. The price table supplies observations and tradable columns; the position table supplies the target weights.
Show Code
from finlab import data
from finlab.backtest import sim

data.set_market("us_fund")
close = data.get("us_fund_price:adj_close")[["SPY", "QQQ"]]
position = close.notna().astype(float) * 0.5

report = sim(
    position.loc["2016-01-01":],
    resample="M",
    trade_at_price="close",
    fee_ratio=0.001,
    tax_ratio=0,
    upload=False,
)
report.to_html("portfolio_backtest.html")

stats = report.get_stats()
print(f"CAGR: {stats['cagr']:.2%}")
print(f"Monthly Sharpe: {stats['monthly_sharpe']:.2f}")
print(f"Max drawdown: {stats['max_drawdown']:.2%}")
The output report is the object to inspect. Check that both ETFs appear in the positions, that the rebalance frequency matches the request and that trading costs are present. Save the code before adding a trend condition. A simple baseline catches market-selection and weighting errors that an elaborate rule can hide.
For a measured reference, the U.S. momentum study offers its full strategy and daily equity curves. Reproduce the study without changing parameters first. Its leverage, stops and mixed defensive sleeve are materially different from the simple portfolio above.
Read published results on the same terms
The U.S. strategy comparison covers May 2, 2016 to October 26, 2026. Its monthly Sharpe column deducts a 2% annual risk-free rate. Here are four examples from that same experiment family:
| Portfolio | CAGR | Monthly Sharpe (2% risk-free) | Maximum drawdown |
|---|---|---|---|
| Momentum-based leveraged ETF system | 29.9% | 1.36 | -21.1% |
| Conservative ETF rotation | 24.3% | 1.19 | -19.3% |
| QQQ, dividend-adjusted buy and hold | 20.7% | 0.98 | -35.1% |
| SPY, dividend-adjusted buy and hold | 15.1% | 0.88 | -33.7% |
The rotation system's lower CAGR accompanies a shallower historical drawdown. That is a trade-off a portfolio researcher can evaluate. It is not a universal ranking: the strategy owns different exposures, may spend time in defensive assets and requires trading. The passive benchmarks supply an alternative that must be measured over the exact same interval.
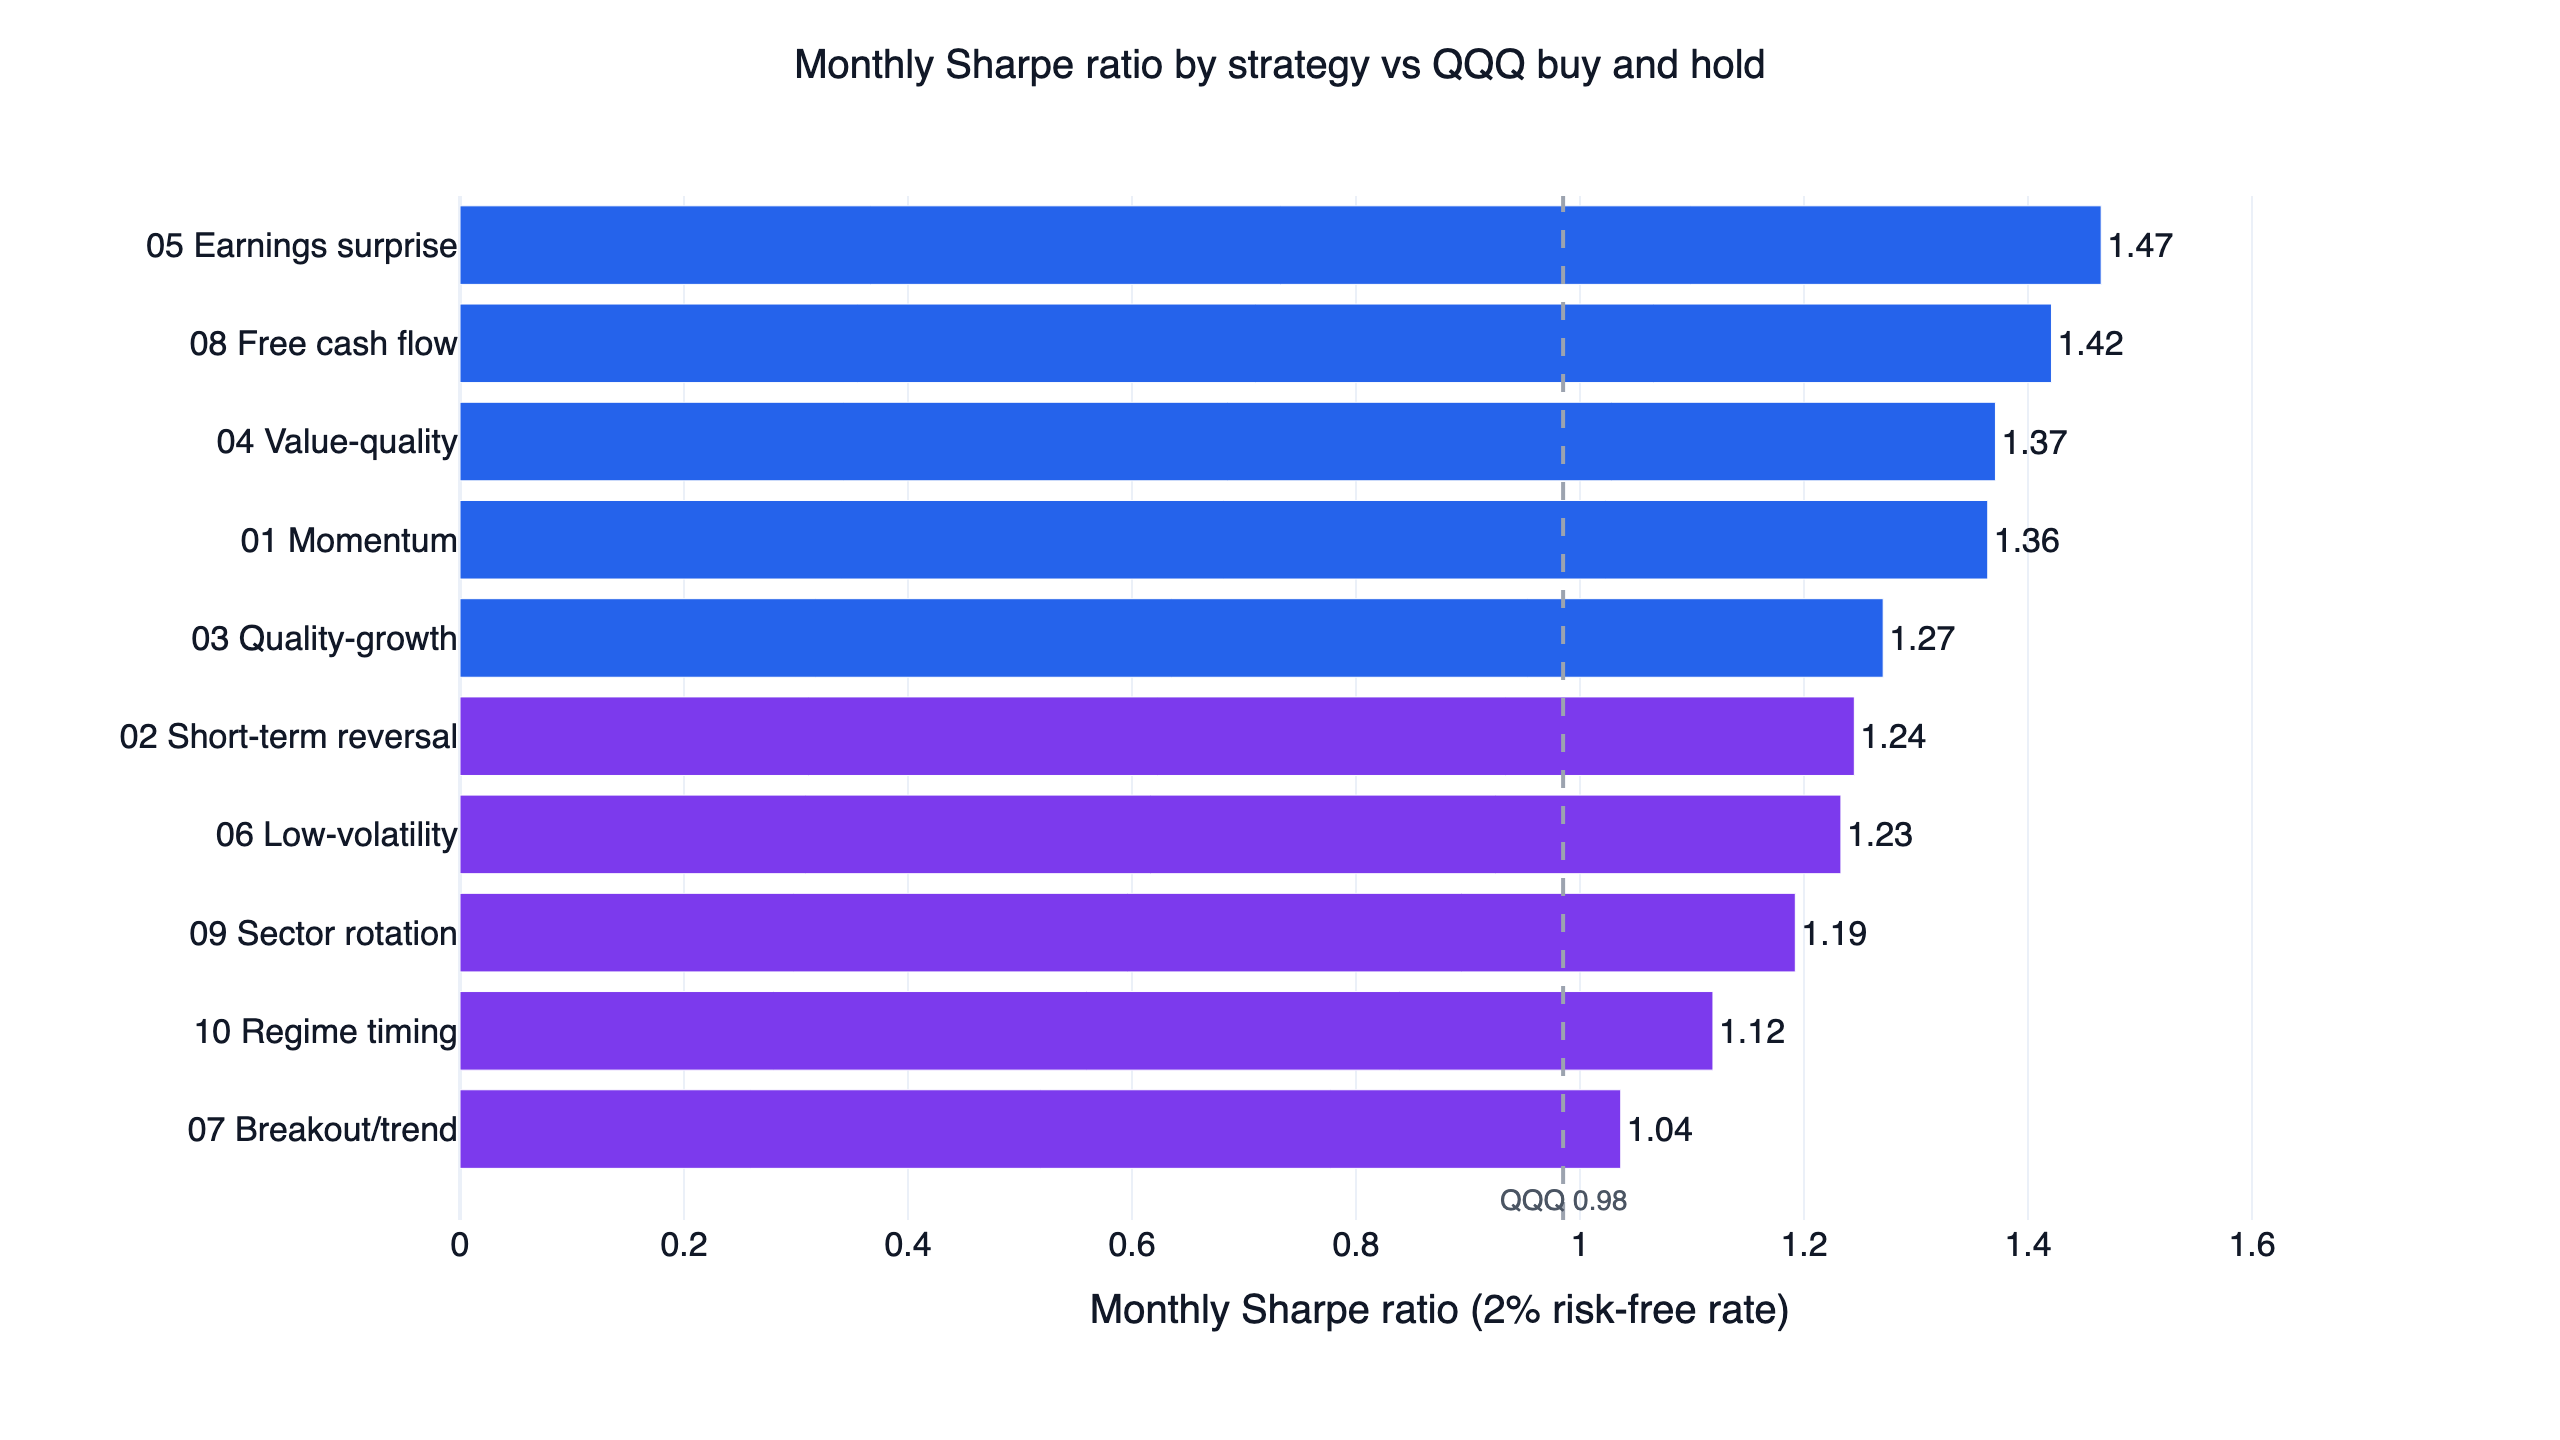
The research reports also show Sharpe values without the risk-free deduction in some tables. Momentum is 1.46 on that basis and 1.36 in the comparison above. This is a convention difference, not evidence of a new run. Always state the return frequency, annualization and risk-free rate when copying a ratio into a comparison.
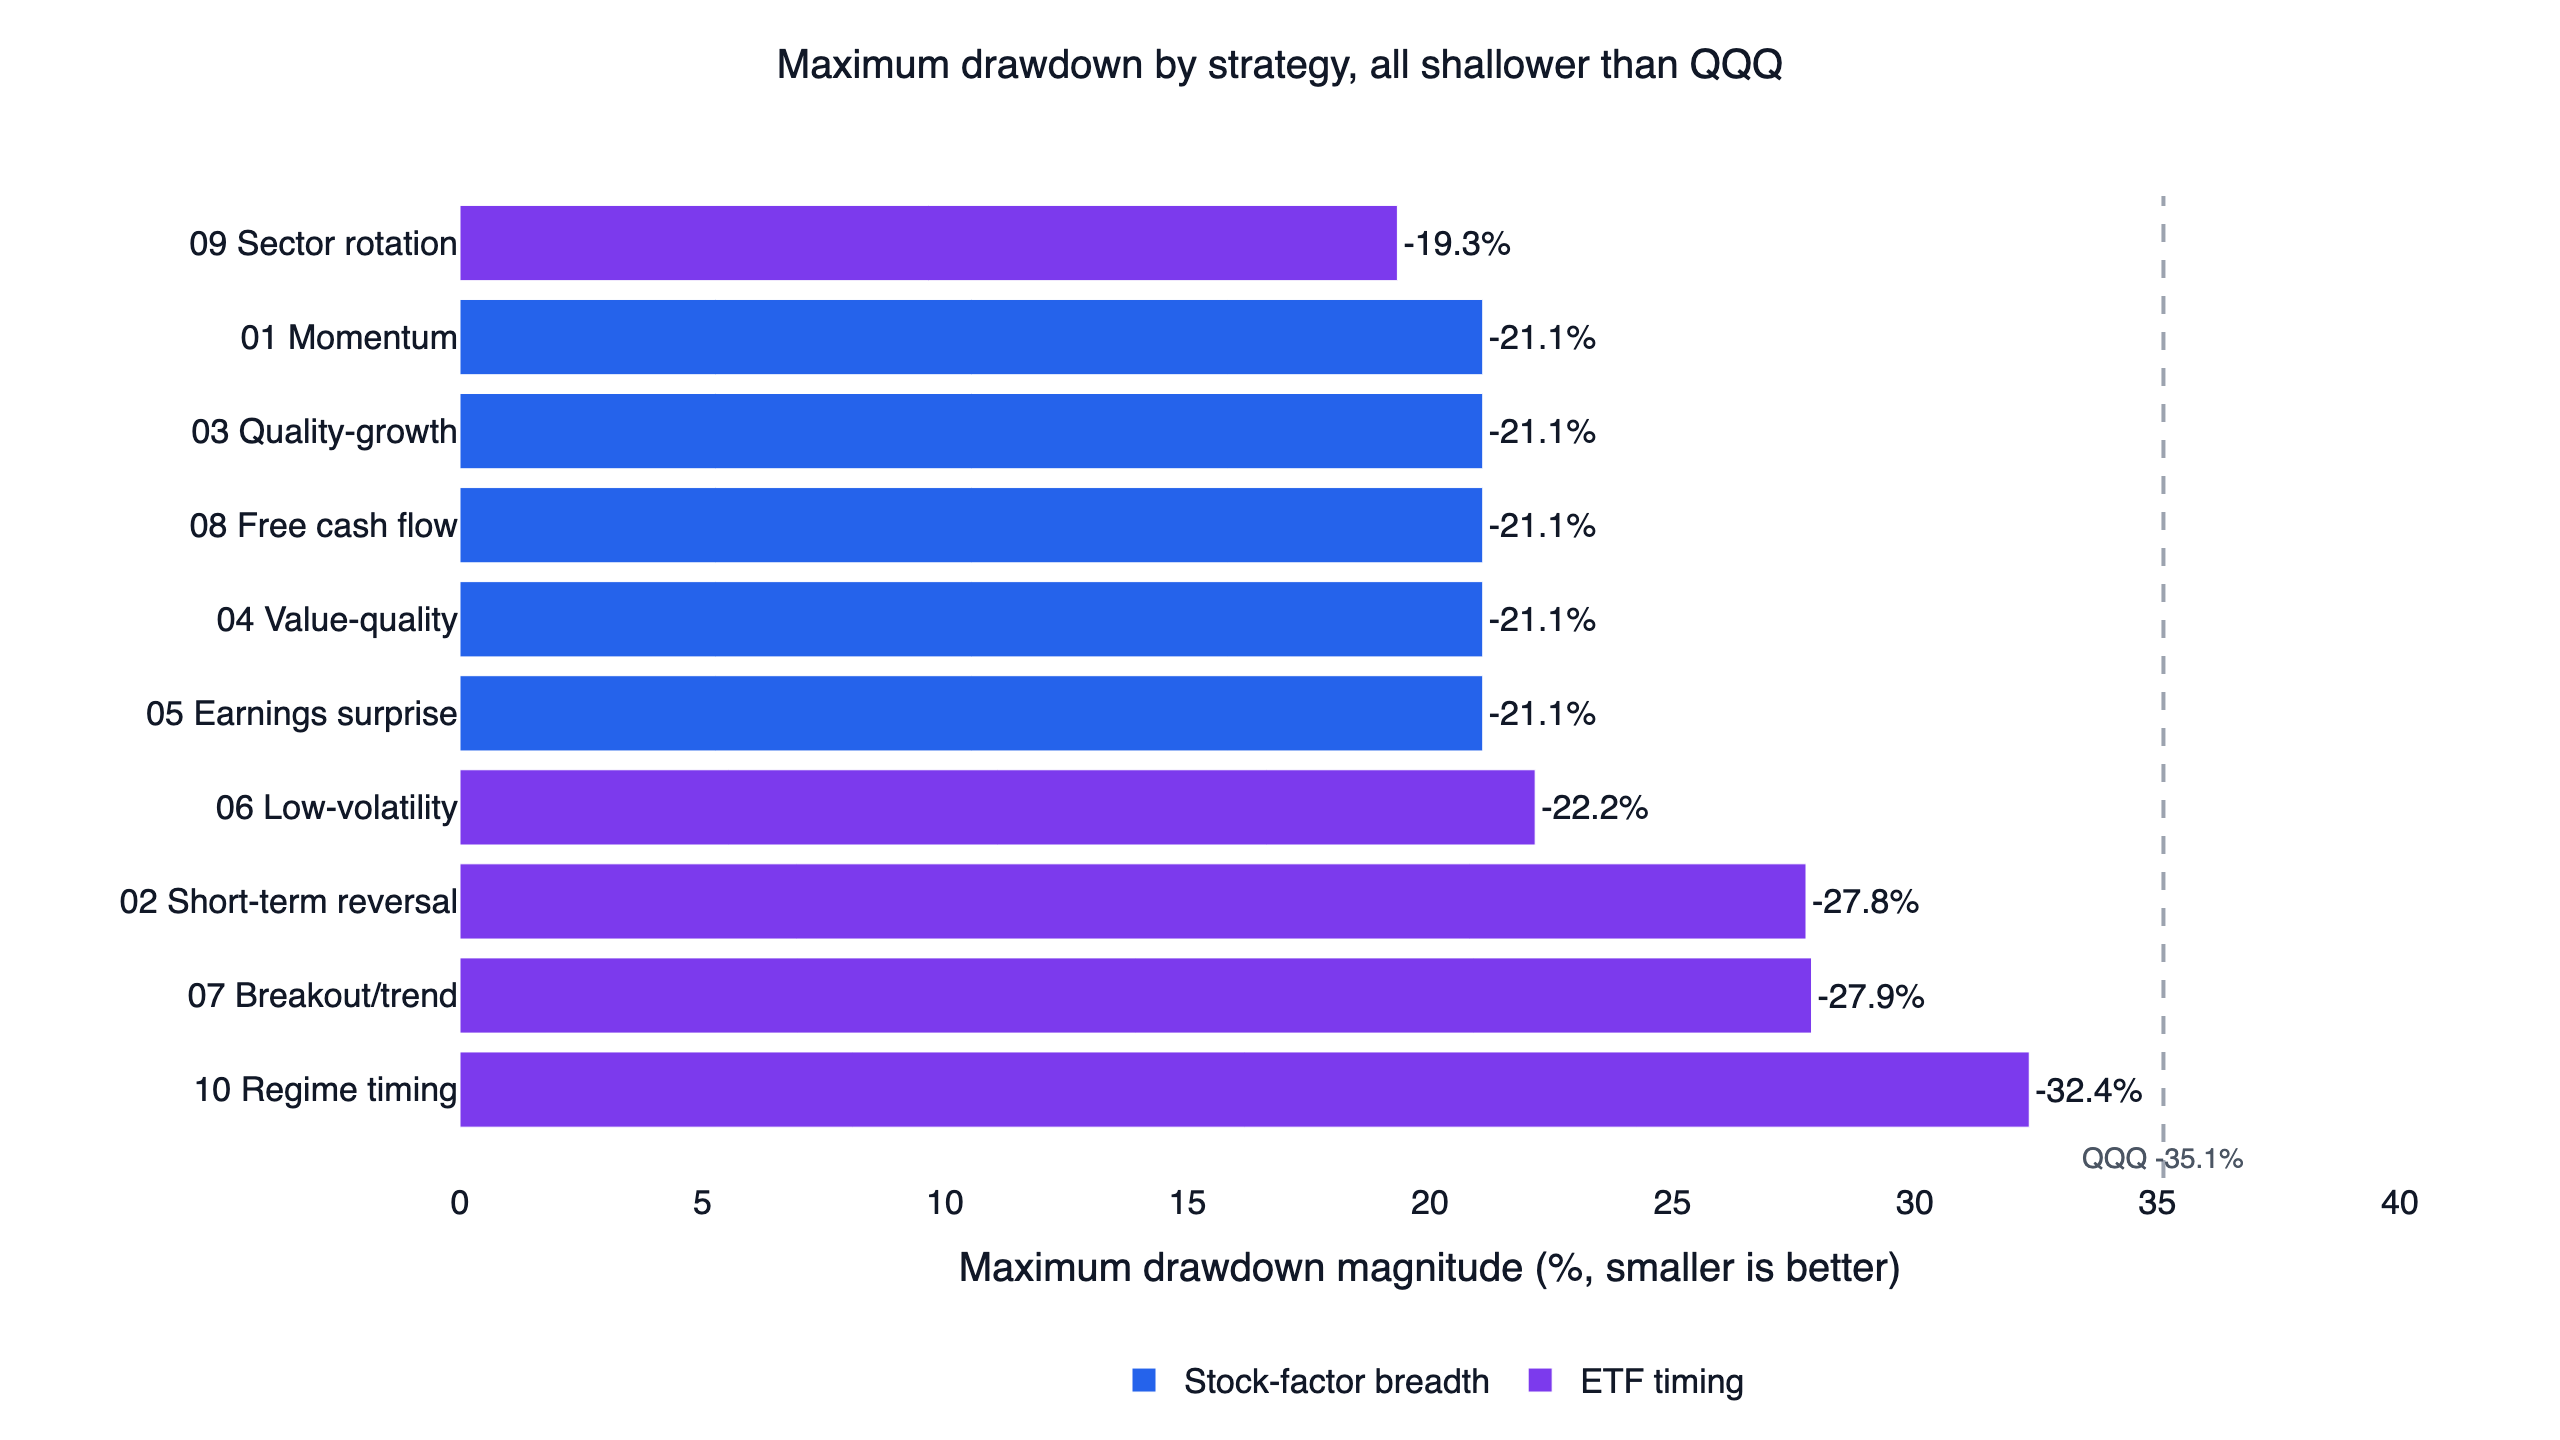
Maximum drawdown is path dependent. It can become deeper without changing the final portfolio value, and a monthly series can miss losses visible in daily data. Read the full curve and recovery duration. A holding-level stop also does not establish a maximum possible portfolio loss.
Validation beyond the full-window result
An evaluation period should be reserved before choosing the rule. Compare neighboring settings to see whether the result persists away from the single best parameter. Raise costs to see how much friction the apparent advantage can absorb. Keep a record of all variants tried, including failures.
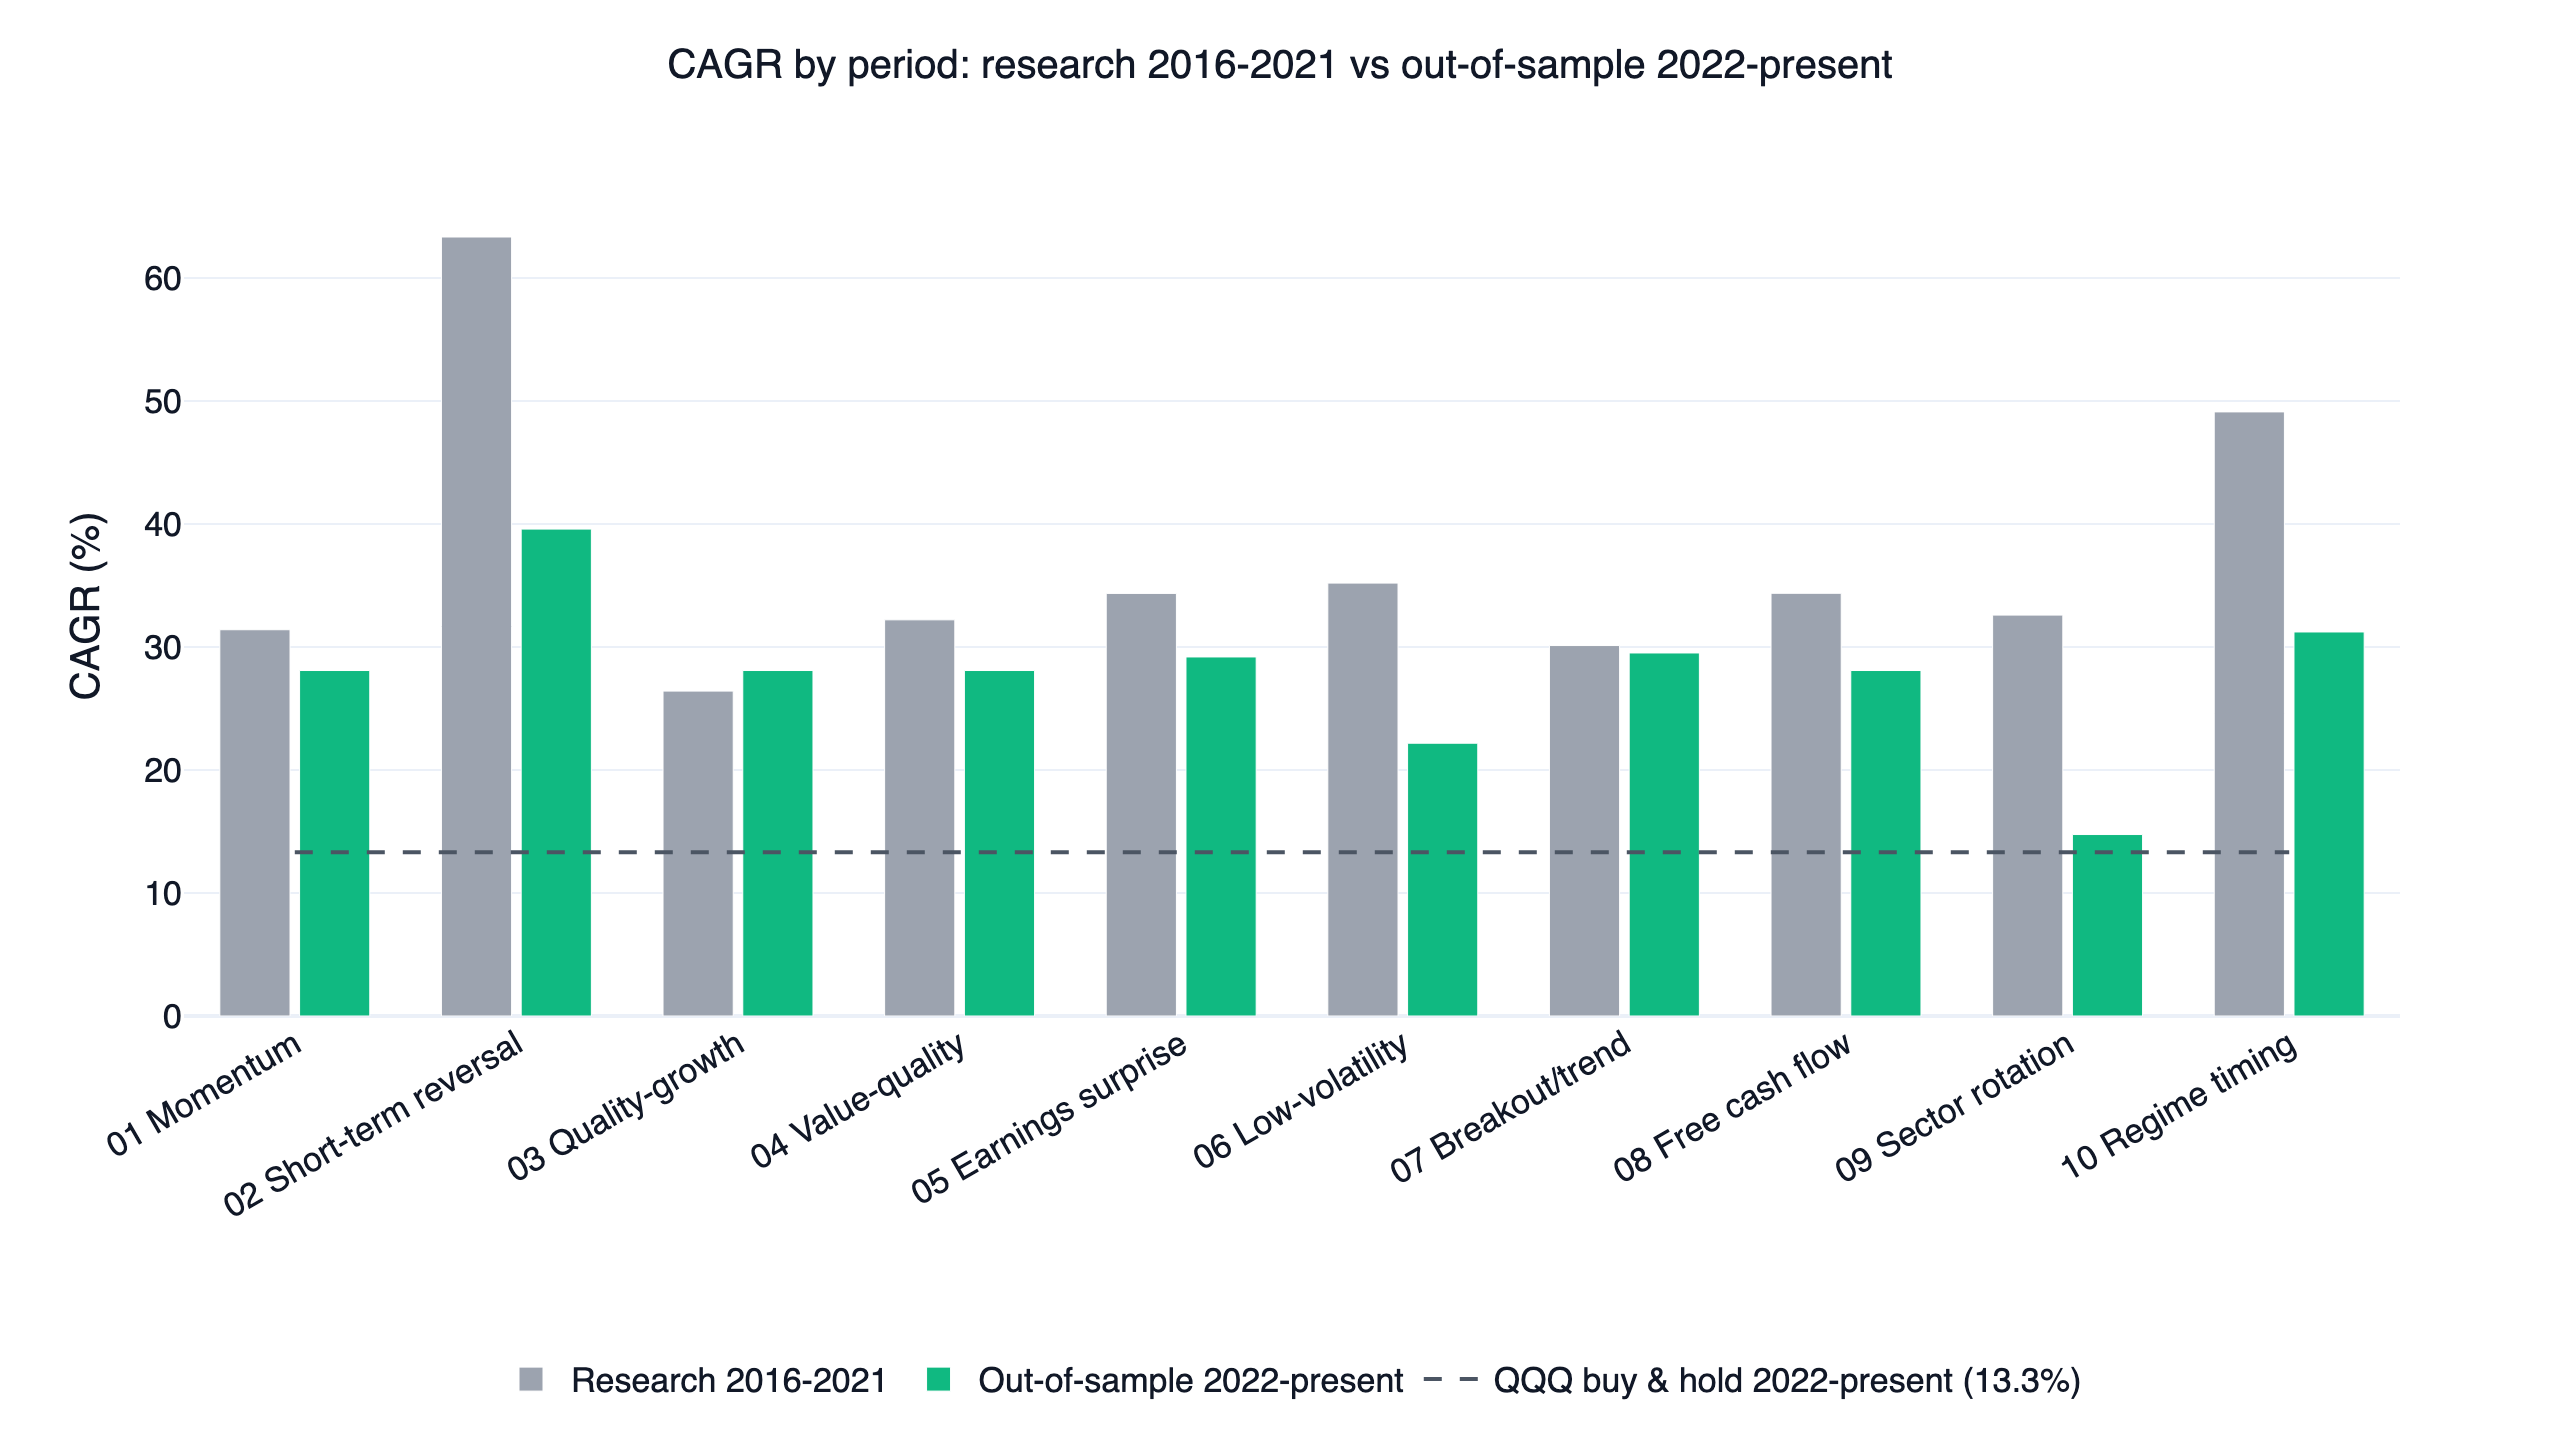
The published studies divide 2016–2021 from 2022 onward. Among eight versions checked for parameter sensitivity, two-halves performance and trading costs, seven passed all three. Breakout/trend failed the first-half comparison with QQQ. Quality growth and value-plus-quality were not separately checked, so the family should not be described as ten independent robustness passes.
These checks reduce some weaknesses without guaranteeing a durable edge. Related systems can share a common gate, instruments and overlapping trades. Four stock-factor versions in the comparison have identical later-period returns because they converge on the same ETF execution. Diversifying their names does not diversify their holdings.
Common backtesting mistakes
Choosing current winners retroactively. Today's constituents or surviving tickers can exclude securities that failed. A historical universe addresses a question that adjusted prices alone do not solve.
Trading on unavailable information. A completed close, revised account or future membership must not enter an earlier decision. Inspect when the signal became observable and when the simulator permits execution.
Confusing a signal with holdings. A stock-breadth signal can route the portfolio into leveraged ETFs. Read the actual position list before assuming the test measures a stock-selection portfolio.
Ignoring costs because commissions are zero. Spread, slippage and turnover still matter. The same per-side cost affects a monthly ETF rotation and a high-turnover stock strategy differently.
Optimizing the evaluation period. Repeatedly changing rules after seeing a holdout erodes its independence. Preserve earlier versions and use future observation to evaluate a frozen specification.
Choosing backtesting software
Choose a tool based on the experiment you need to audit: historical universe support, corporate-action treatment, filing dates, execution assumptions, costs and exportable results. A convenient chart is useful, but the underlying trade and position records determine whether you can explain the result.
Studio is suitable when you want to describe a U.S. research task and inspect the generated code and report in one workflow. A local Python setup offers direct control over files and dependencies. Either route needs an explicit specification. The algorithmic trading guide shows how to separate data, signals, positions and execution in a program.
For passive allocation questions, compare the lazy portfolio study. For an active allocation example, inspect ETF rotation. The general quant trading guide maps other research families and their assumptions.
Frequently asked questions
What does backtesting mean?
It means simulating a specified rule on historical observations under an execution and cost model. A complete result includes the assumptions and portfolio path. A historical price chart with an entry arrow is not enough to determine position weights, costs or a comparable portfolio return.
How far back should I test?
Use the history that supports the actual instruments, inputs and information timing. Include different market conditions when the data permits. Extending a sample with today's universe or unavailable historical fundamentals can make a longer test less credible.
Can I backtest a portfolio without writing Python?
You can describe the experiment in Studio in English. Ask for the generated code as well as the report so the assumptions are inspectable. Review weights, rebalancing and costs before interpreting the result.
Does a successful backtest prove the strategy will work?
No. The result is conditional on data, design choices, execution assumptions and the historical sample. A useful test can reject a weak idea or reveal a trade-off; subsequent performance remains uncertain.
Record the end date explicitly when comparing runs. Otherwise a new trading day can change the statistics even if the rules and software remain identical.
Sources and research notes
All performance numbers and figures here refer to the linked, dated U.S. comparison. Sharpe (1994) defines differential-return measurement. Lo (2002) discusses statistical uncertainty in Sharpe ratios. Bailey and coauthors explain why searching many backtests can select noise. These methodological references do not validate a particular FinLab strategy.
For education and research only. This is not investment advice. Historical performance does not guarantee future results. Leveraged ETF strategies can incur substantial losses and daily-reset effects.
Last updated: 2026-10. Backtest window cited: 2016-05-02 to 2026-10-26. Author: FinLab Quant Research, the team publishing reproducible stock and ETF strategy studies.