Run this strategy
Copy the prompt to reproduce the evidence above with the article’s data, assumptions, and risk checks.
Tell your AI:
Set up FinLab and rerun QQQ's average return by weekday and the skip-Monday backtest. Please read: https://finlab.finance/en/setup?relatedUrl=/en/blog/best-day-of-the-week-to-buy-stocks
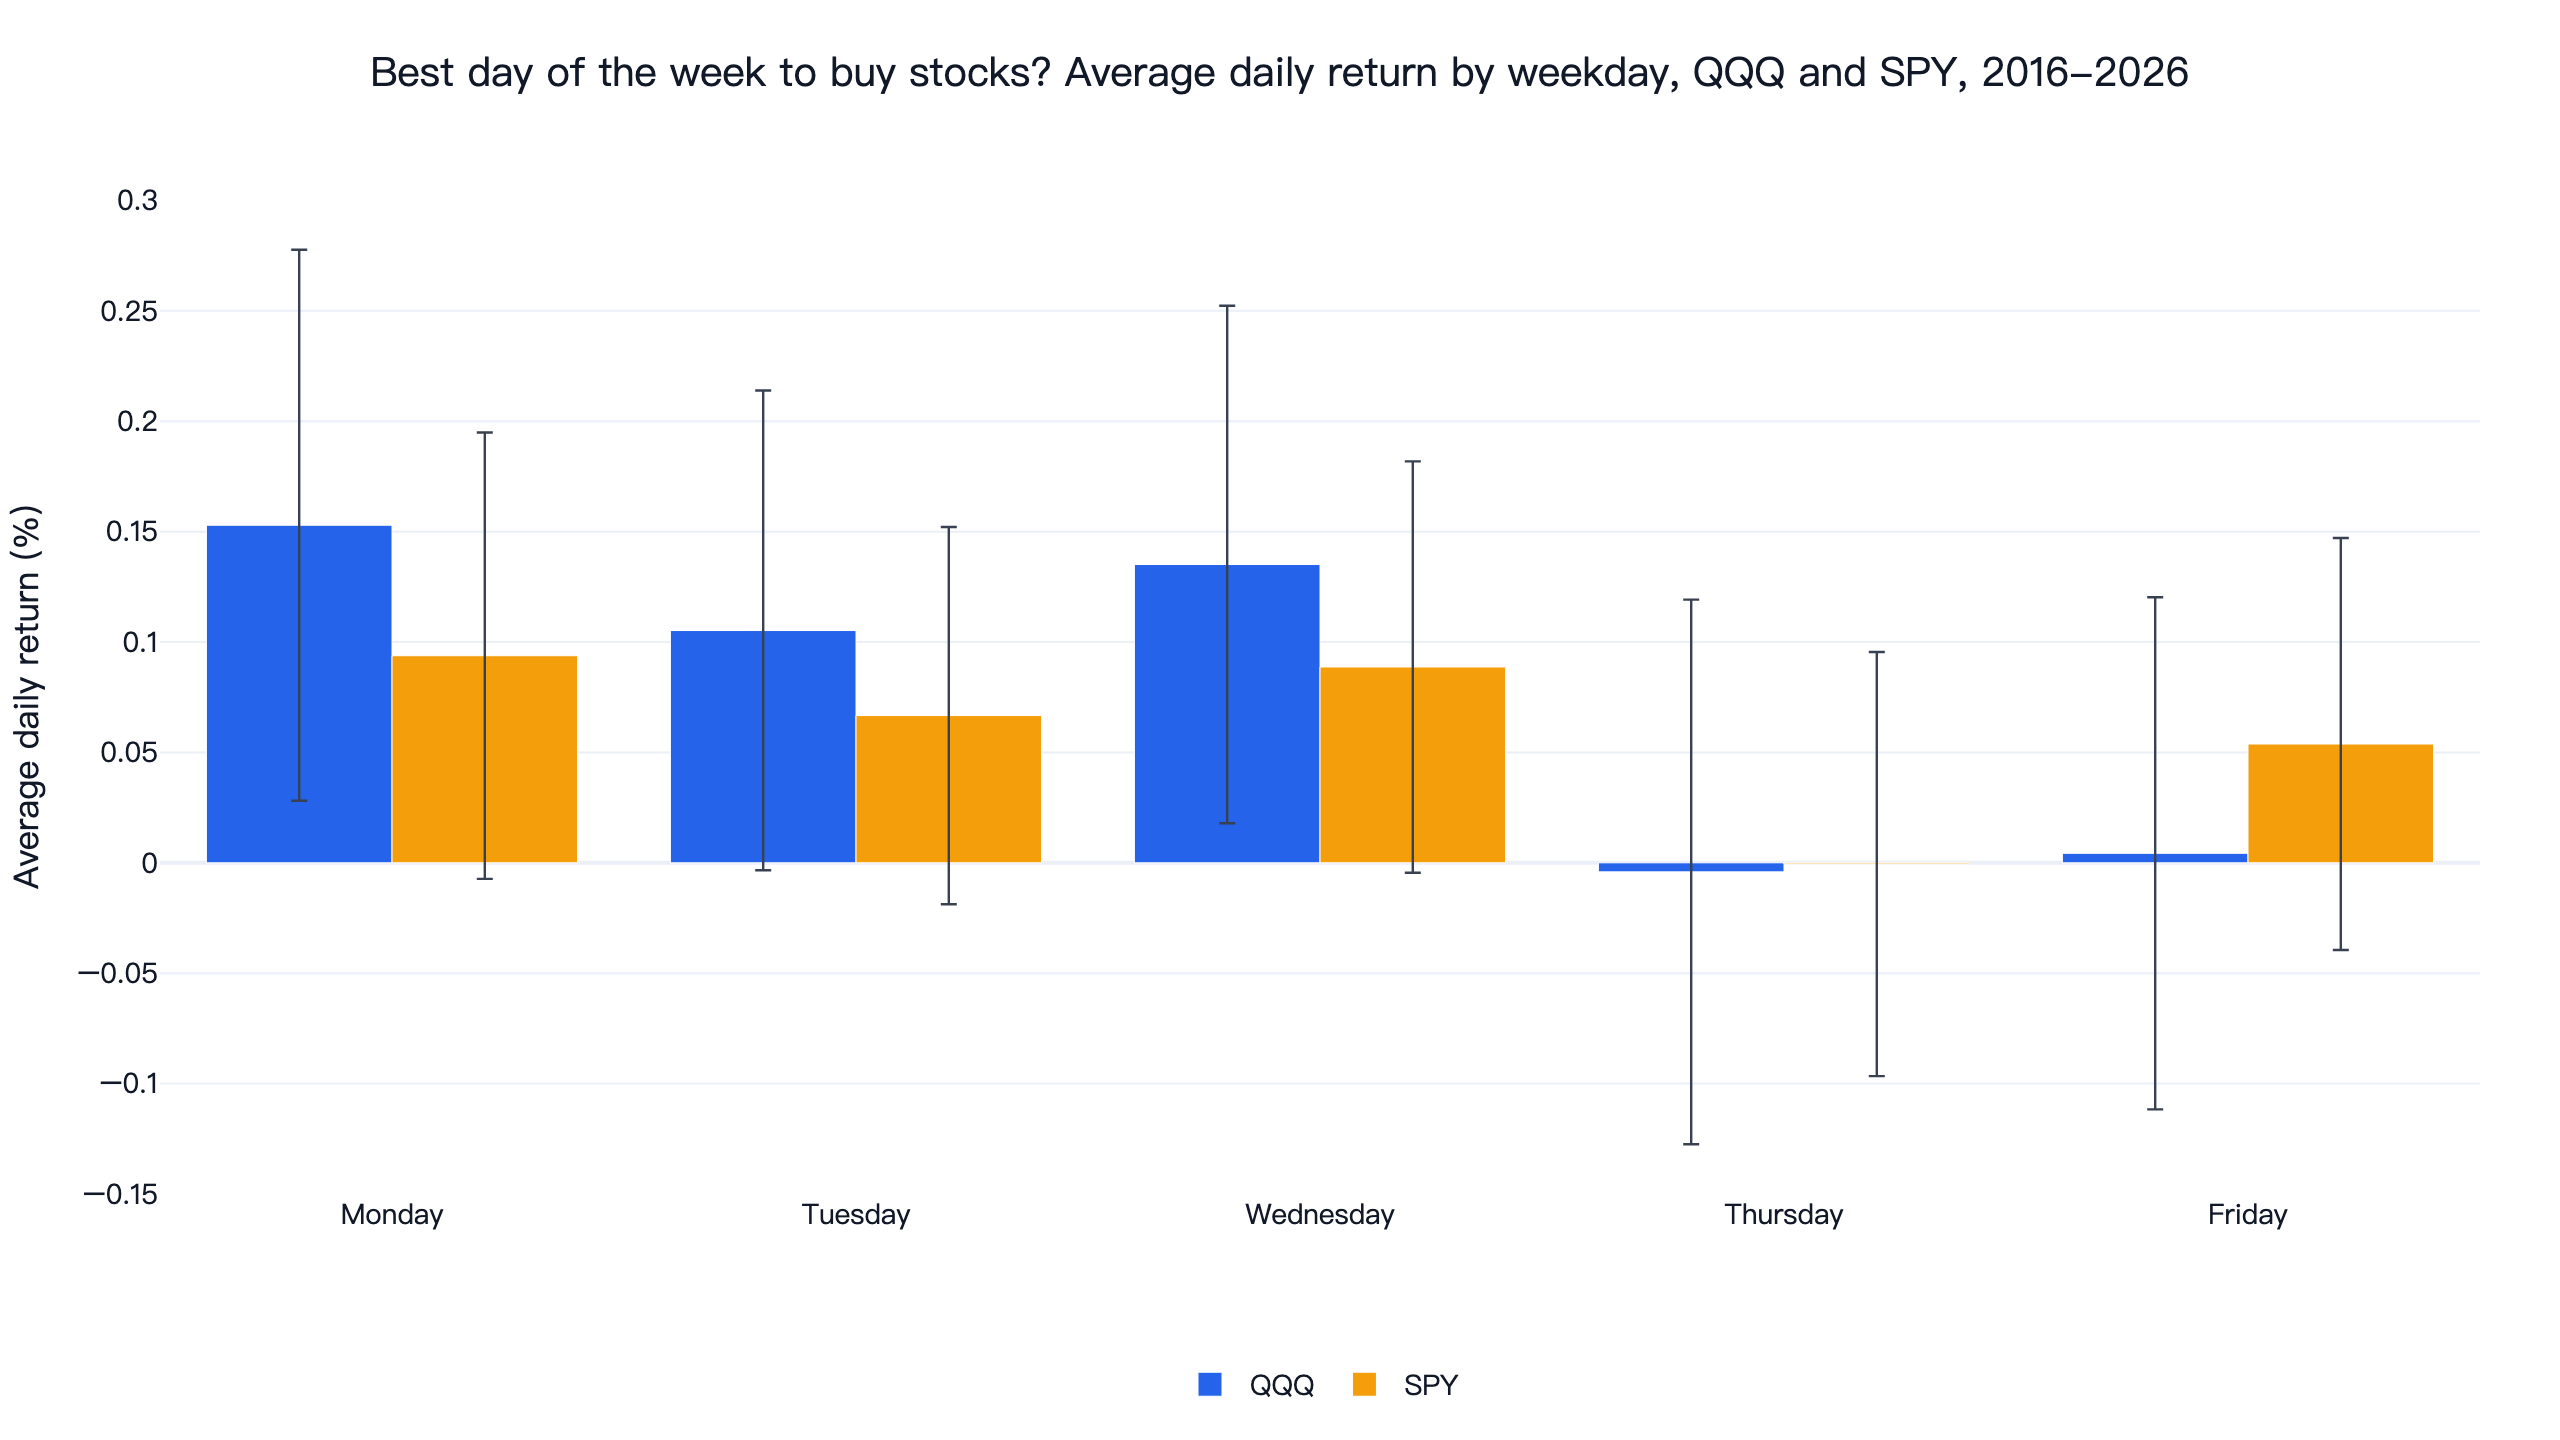
"Stocks fall on Mondays, so Monday is the best day to buy" is one of the oldest stock market rules, and it comes from research published in 1980. We tested it with finlab on QQQ and SPY from January 2016 to November 2026, and the last ten years ran the other way. Monday was QQQ's strongest day, with an average gain of 0.15% and 61.8% of Mondays up, while Thursday and Friday averaged close to zero. Turned into strategies, skipping Monday and holding only on Friday both trailed simply holding QQQ: neither design passed, and only 4 of their 18 settings beat it.
If the real question is which weekday to pick for a weekly purchase, the answer is that it barely matters. Buying 2.85 for Monday buyers and $2.87 for Friday buyers, a gap of less than 1%. Being invested every week is what moved the result.
Weekday returns at a glance
| Average daily return, 2016-01 to 2026-11 | Monday | Tuesday | Wednesday | Thursday | Friday | All days |
|---|---|---|---|---|---|---|
| QQQ with dividends | +0.153% | +0.105% | +0.135% | -0.004% | +0.004% | +0.078% |
| QQQ, 95% interval | +0.028% to +0.278% | -0.003% to +0.214% | +0.018% to +0.252% | -0.128% to +0.119% | -0.112% to +0.120% | — |
| QQQ, share of days up | 61.8% | 55.7% | 58.3% | 51.6% | 54.3% | — |
| SPY with dividends | +0.094% | +0.067% | +0.089% | -0.001% | +0.054% | +0.060% |
| Design (original setting) | Time in market | CAGR | Daily Sharpe | Max drawdown | Settings beating QQQ |
|---|---|---|---|---|---|
| D1 Skip Monday, hold QQQ the rest of the week | 79% | 12.1% | 0.68 | -30.9% | 4 of 9 |
| D2 Hold QQQ only on Friday | 21% | 0.2% | 0.07 | -24.7% | 0 of 9 |
| QQQ buy and hold, total return | 100% | 18.7% | 0.88 | -35.1% | benchmark |
"Monday's return" is the move from Friday's close to Monday's close, so it includes the weekend. The window is 2016-01-05 to 2026-11-05, the full history of FinLab's US ETF price table, and both designs use finlab's default US cost of zero.
What is the Monday effect?
The Monday effect, also called the weekend effect, was documented by French (1980). Using daily S&P Composite returns from 1953 to 1977, he found that Monday returns were negative on average while the other four days were positive, and the pattern held in each five-year subperiod. Gibbons & Hess (1981) found similar Monday weakness in US stock indexes. That is where "buy on Monday, sell on Friday" comes from.
Later work found the effect faded and then flipped for large companies. Mehdian & Perry (2001) studied US indexes from 1964 to 1999 and found significantly negative Mondays before 1987, while after 1987 Monday returns for the large-cap indexes turned significantly positive; small caps kept part of the old pattern. QQQ and SPY from 2016 to 2026 continue that reversed weekend effect: Monday is the best day, and the end of the week is the weakest.
How strong is the evidence? For QQQ, Monday against the other four days has a t-statistic of 1.31, and for SPY 0.73, so neither difference is statistically significant over ten years. Monday's interval for QQQ excludes zero, but so does Wednesday's, and the safer reading is that no weekday was reliably bad.
How a design had to pass
"Beats QQQ" means a higher daily Sharpe ratio than buying and holding QQQ with dividends reinvested, over exactly the same trading days. The daily Sharpe ratio is the mean daily return divided by its standard deviation, times √252, with no risk-free rate; the Sharpe ratio calculator shows the arithmetic. The rules were fixed before we looked at any result:
- Neighbouring parameters. Window length L (1, 2 or 3 trading days) times window shift o (one day earlier, no shift, one day later). At least 7 of the 9 settings must beat QQQ. The original setting is L = 1, o = 0: skip, or hold, exactly one day.
- Both halves. The window is split at its middle date, and the original setting must win in each half.
- Trading costs. It must win at finlab's default US cost of zero and again after paying 0.1% on every buy and every sell.
D2 holds QQQ only 21% of the time, so it must also beat QQQ held at the same average weight and beat QQQ on returns above T-bills (BIL).
The two designs
A week is a calendar week from Monday to Sunday. F is its first trading day (Monday, or Tuesday when Monday is a holiday) and E its last (usually Friday). Windows count trading days and can cross the weekend.
- D1 Skip Monday: sell QQQ at Friday's close and buy it back at Monday's close, so the weekend and Monday are in cash. That is French's finding turned into a rule. It is in the market 79% of the time and trades 52 times a year.
- D2 Hold only Friday: buy at Thursday's close and sell at Friday's close, earning only Friday's return.
The neighbouring settings move the window. For example, D1 with L = 2 and o = -1 skips Thursday and Friday, and D2 with L = 3 and o = 0 holds Wednesday through Friday.
Result 1: skipping Monday skipped the best day
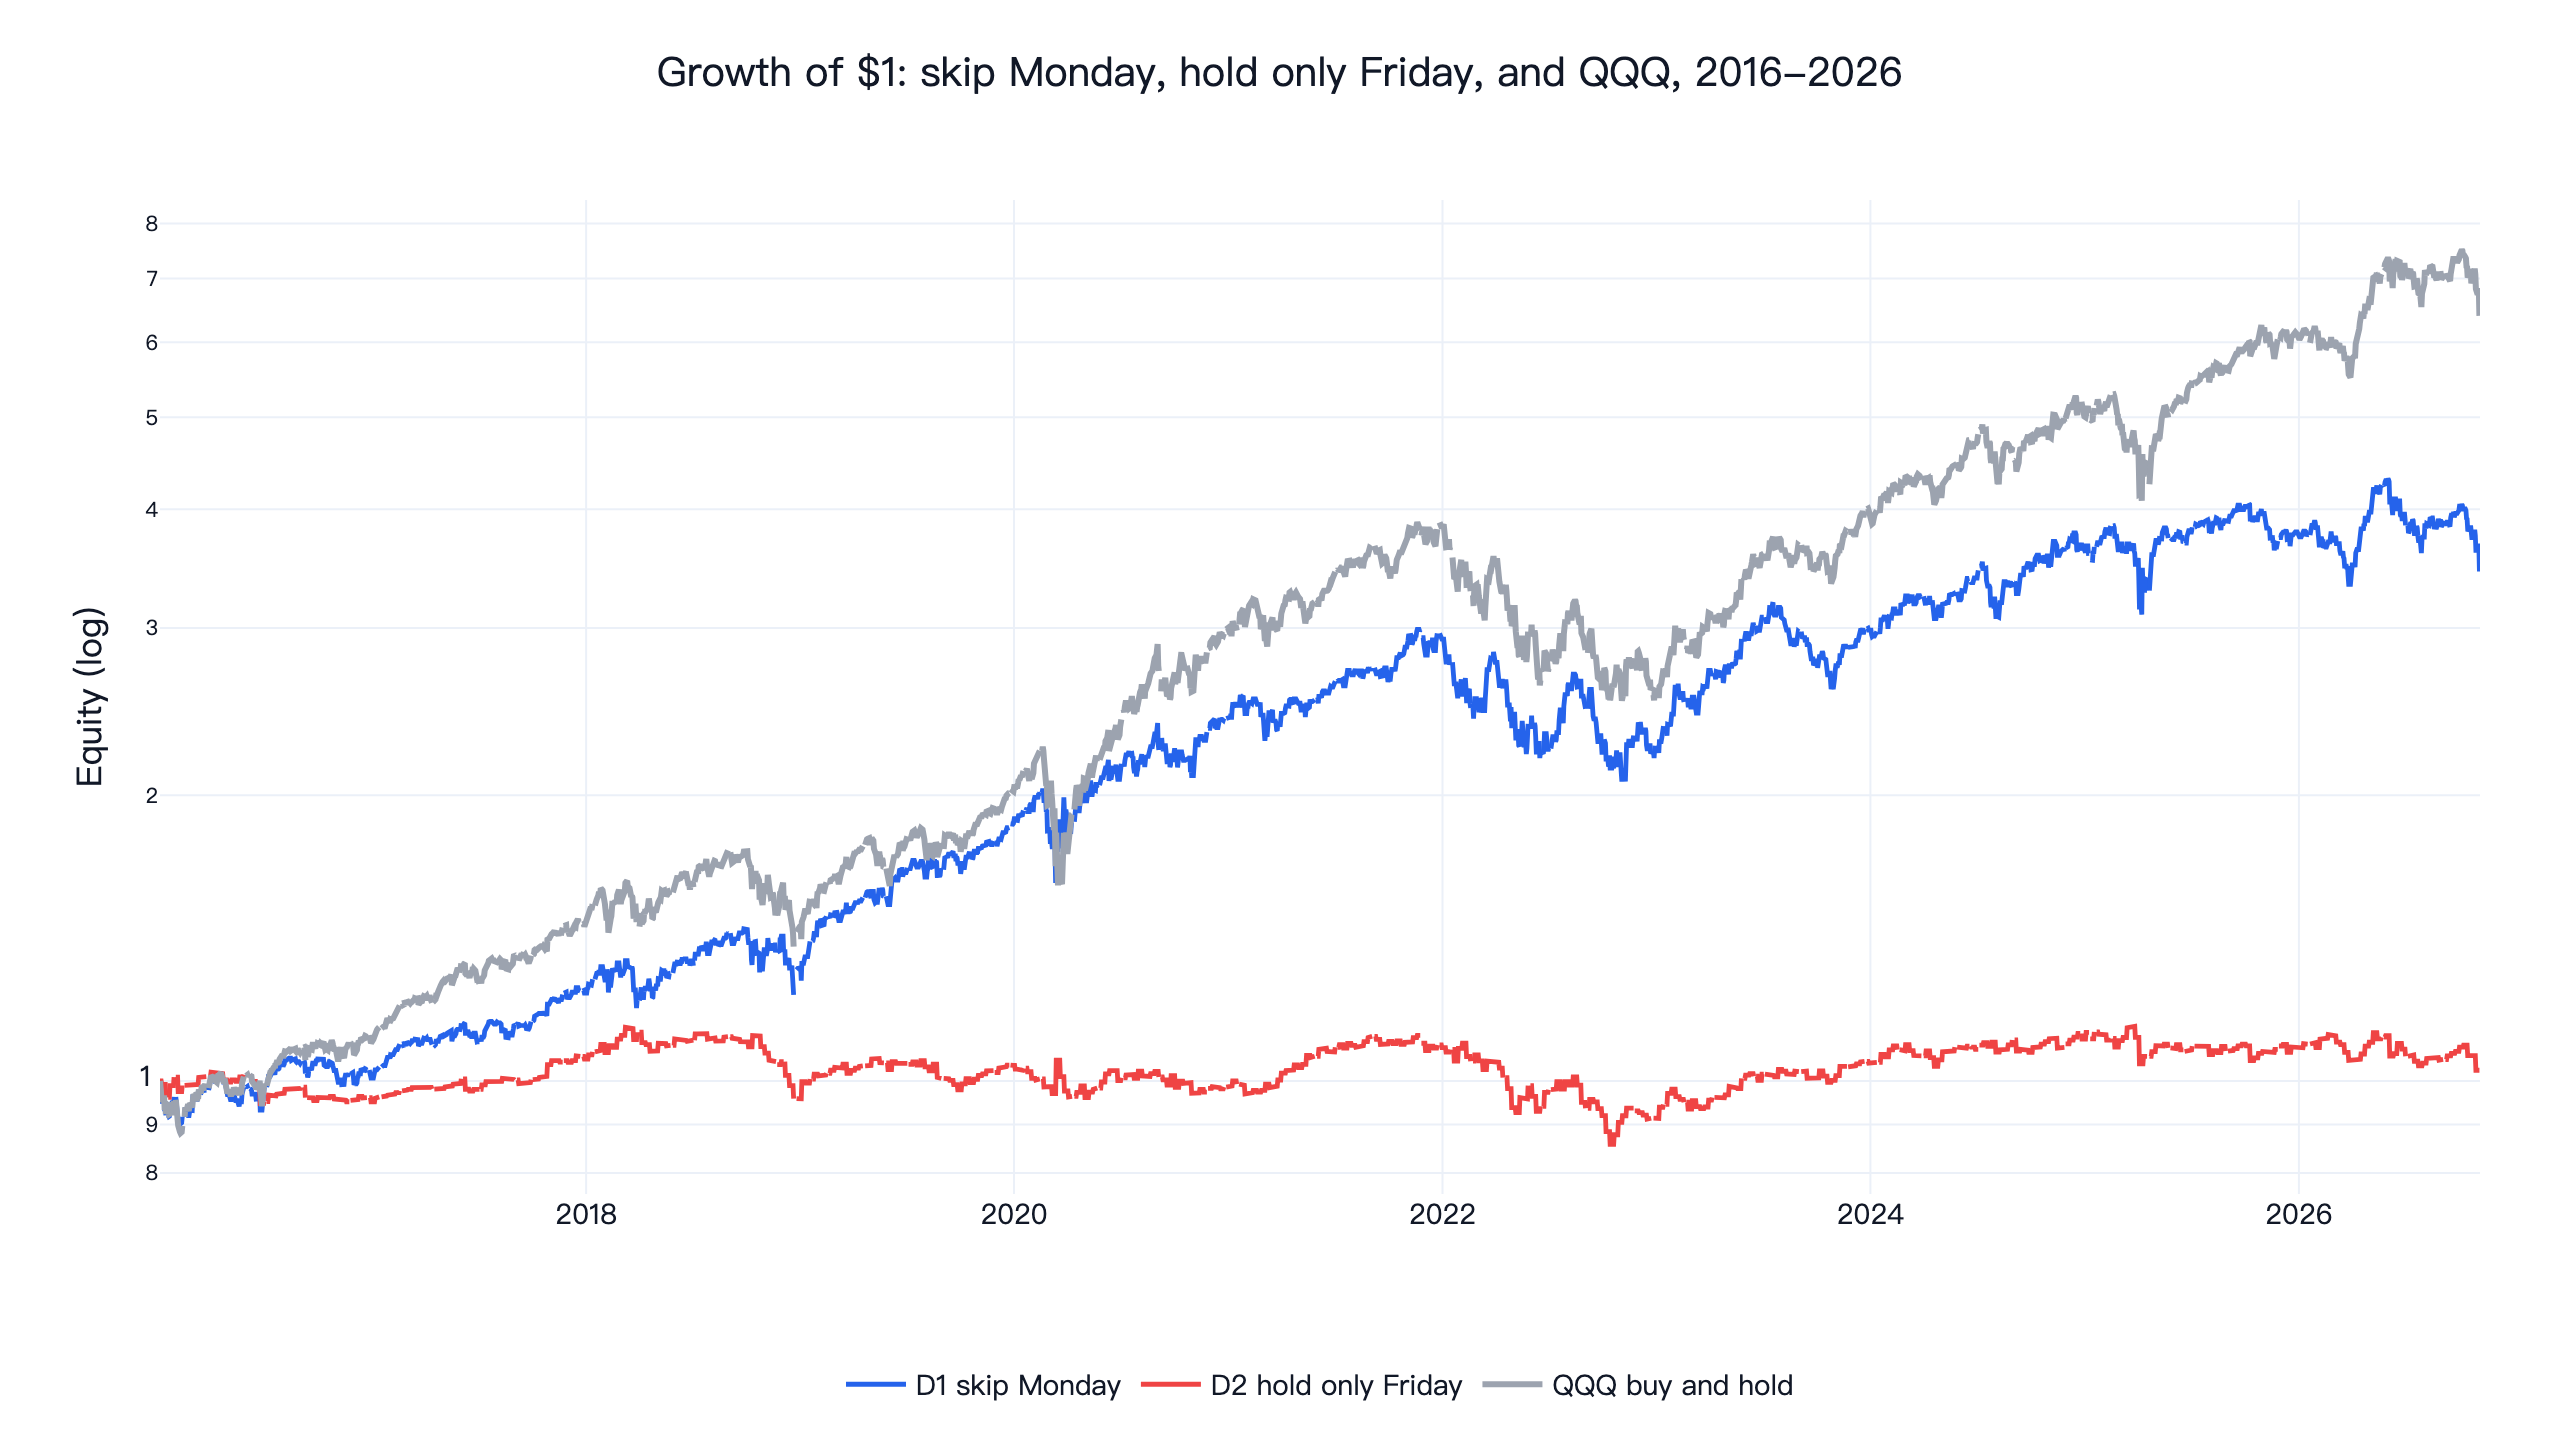
One dollar in QQQ with dividends reinvested grew to 3.44, and holding only on Friday to $1.03. D1's daily Sharpe was 0.68, with 1.01 and 0.37 in the two halves against QQQ's 1.09 and 0.67. At 0.1% per side, 52 round trips a year cost about 10% a year, and D1's CAGR fell from 12.1% to 1.0%. The same rule on SPY earned 11.2% a year with a daily Sharpe of 0.75, against 0.85 for SPY itself.
D2 scored a daily Sharpe of 0.07, and -0.14 on returns above BIL against QQQ's 0.78. Holding 21% QQQ every day, the same average weight, would have earned 4.0% a year; D2 earned 0.2%.
Result 2: 4 of 18 settings beat QQQ, none of them Monday
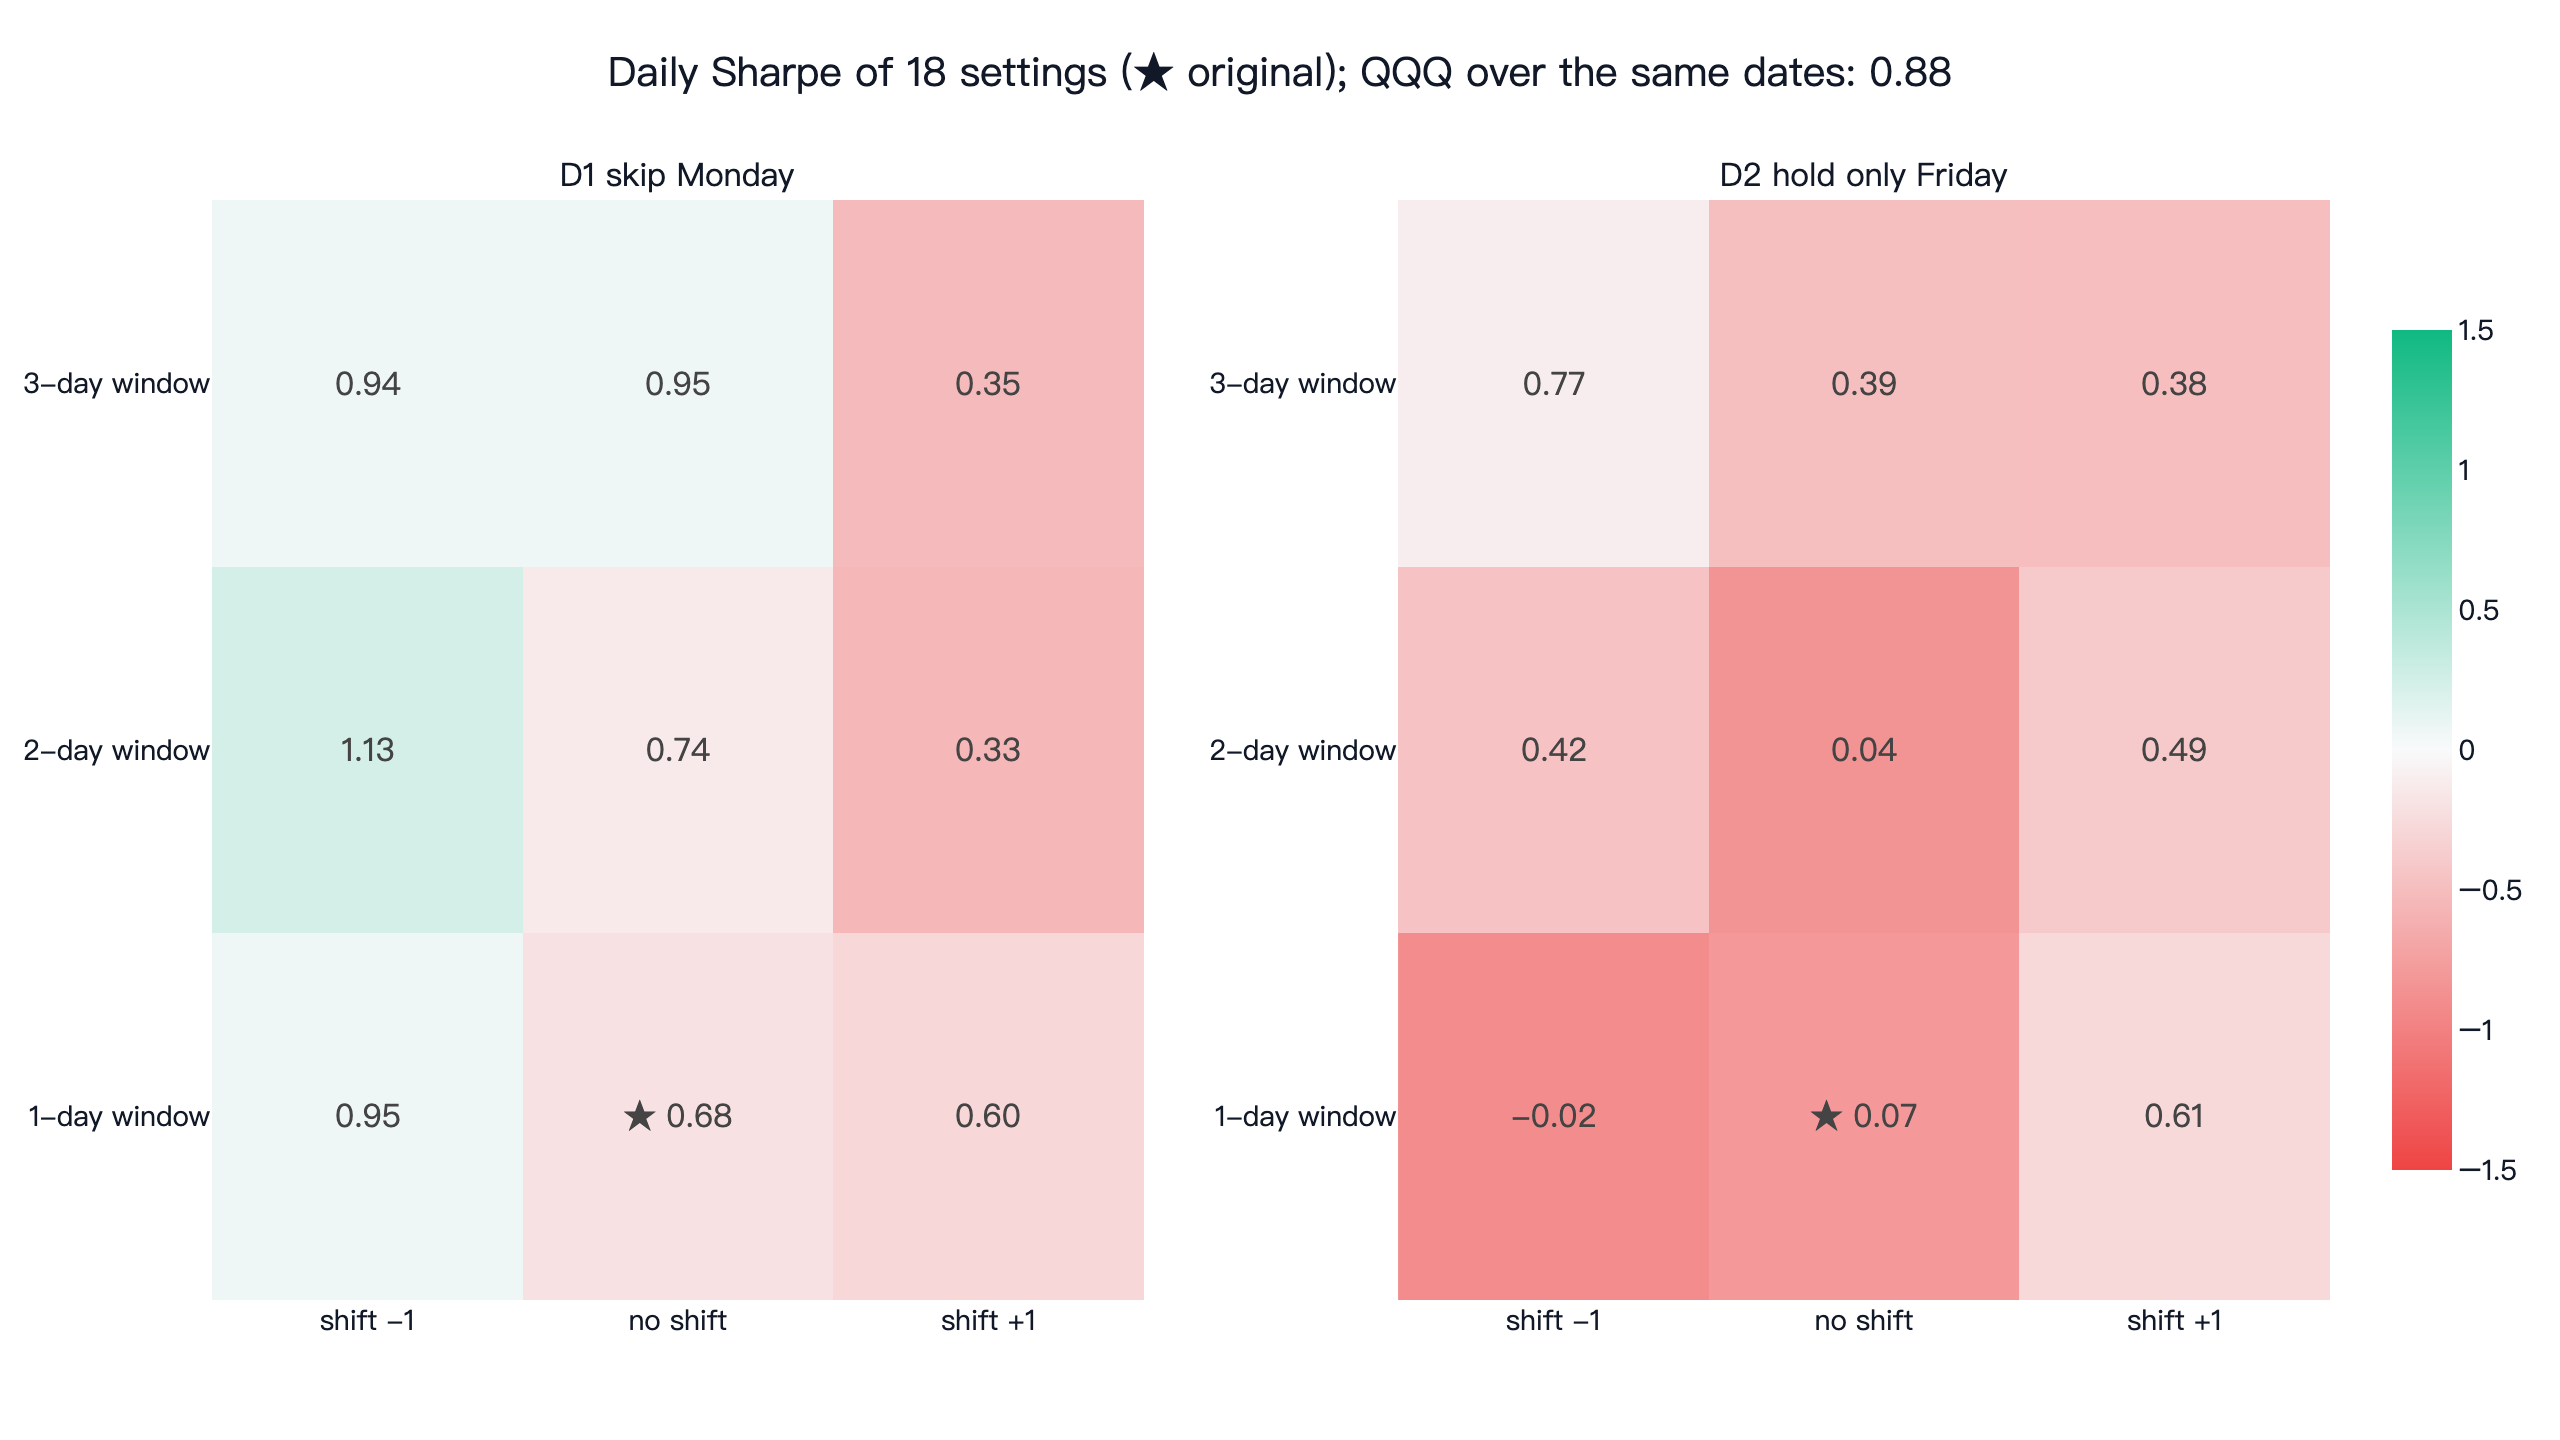
Four of D1's nine settings beat QQQ, and all four move the cash days to Thursday and Friday: skipping Friday (0.95), Thursday and Friday (1.13), Wednesday through Friday (0.94), or Thursday through Monday (0.95). The original, skipping Monday, scored 0.68, and shifting it to Tuesday was worse still (0.60). This reflects QQQ's flat Thursdays and Fridays in this decade, the opposite of the Monday effect. Four is short of the seven needed, and a rule that trades every week pays about 10% a year at 0.1% per side. All nine D2 settings lost; the best, holding Tuesday through Thursday, scored 0.77.
The best weekday changes every year
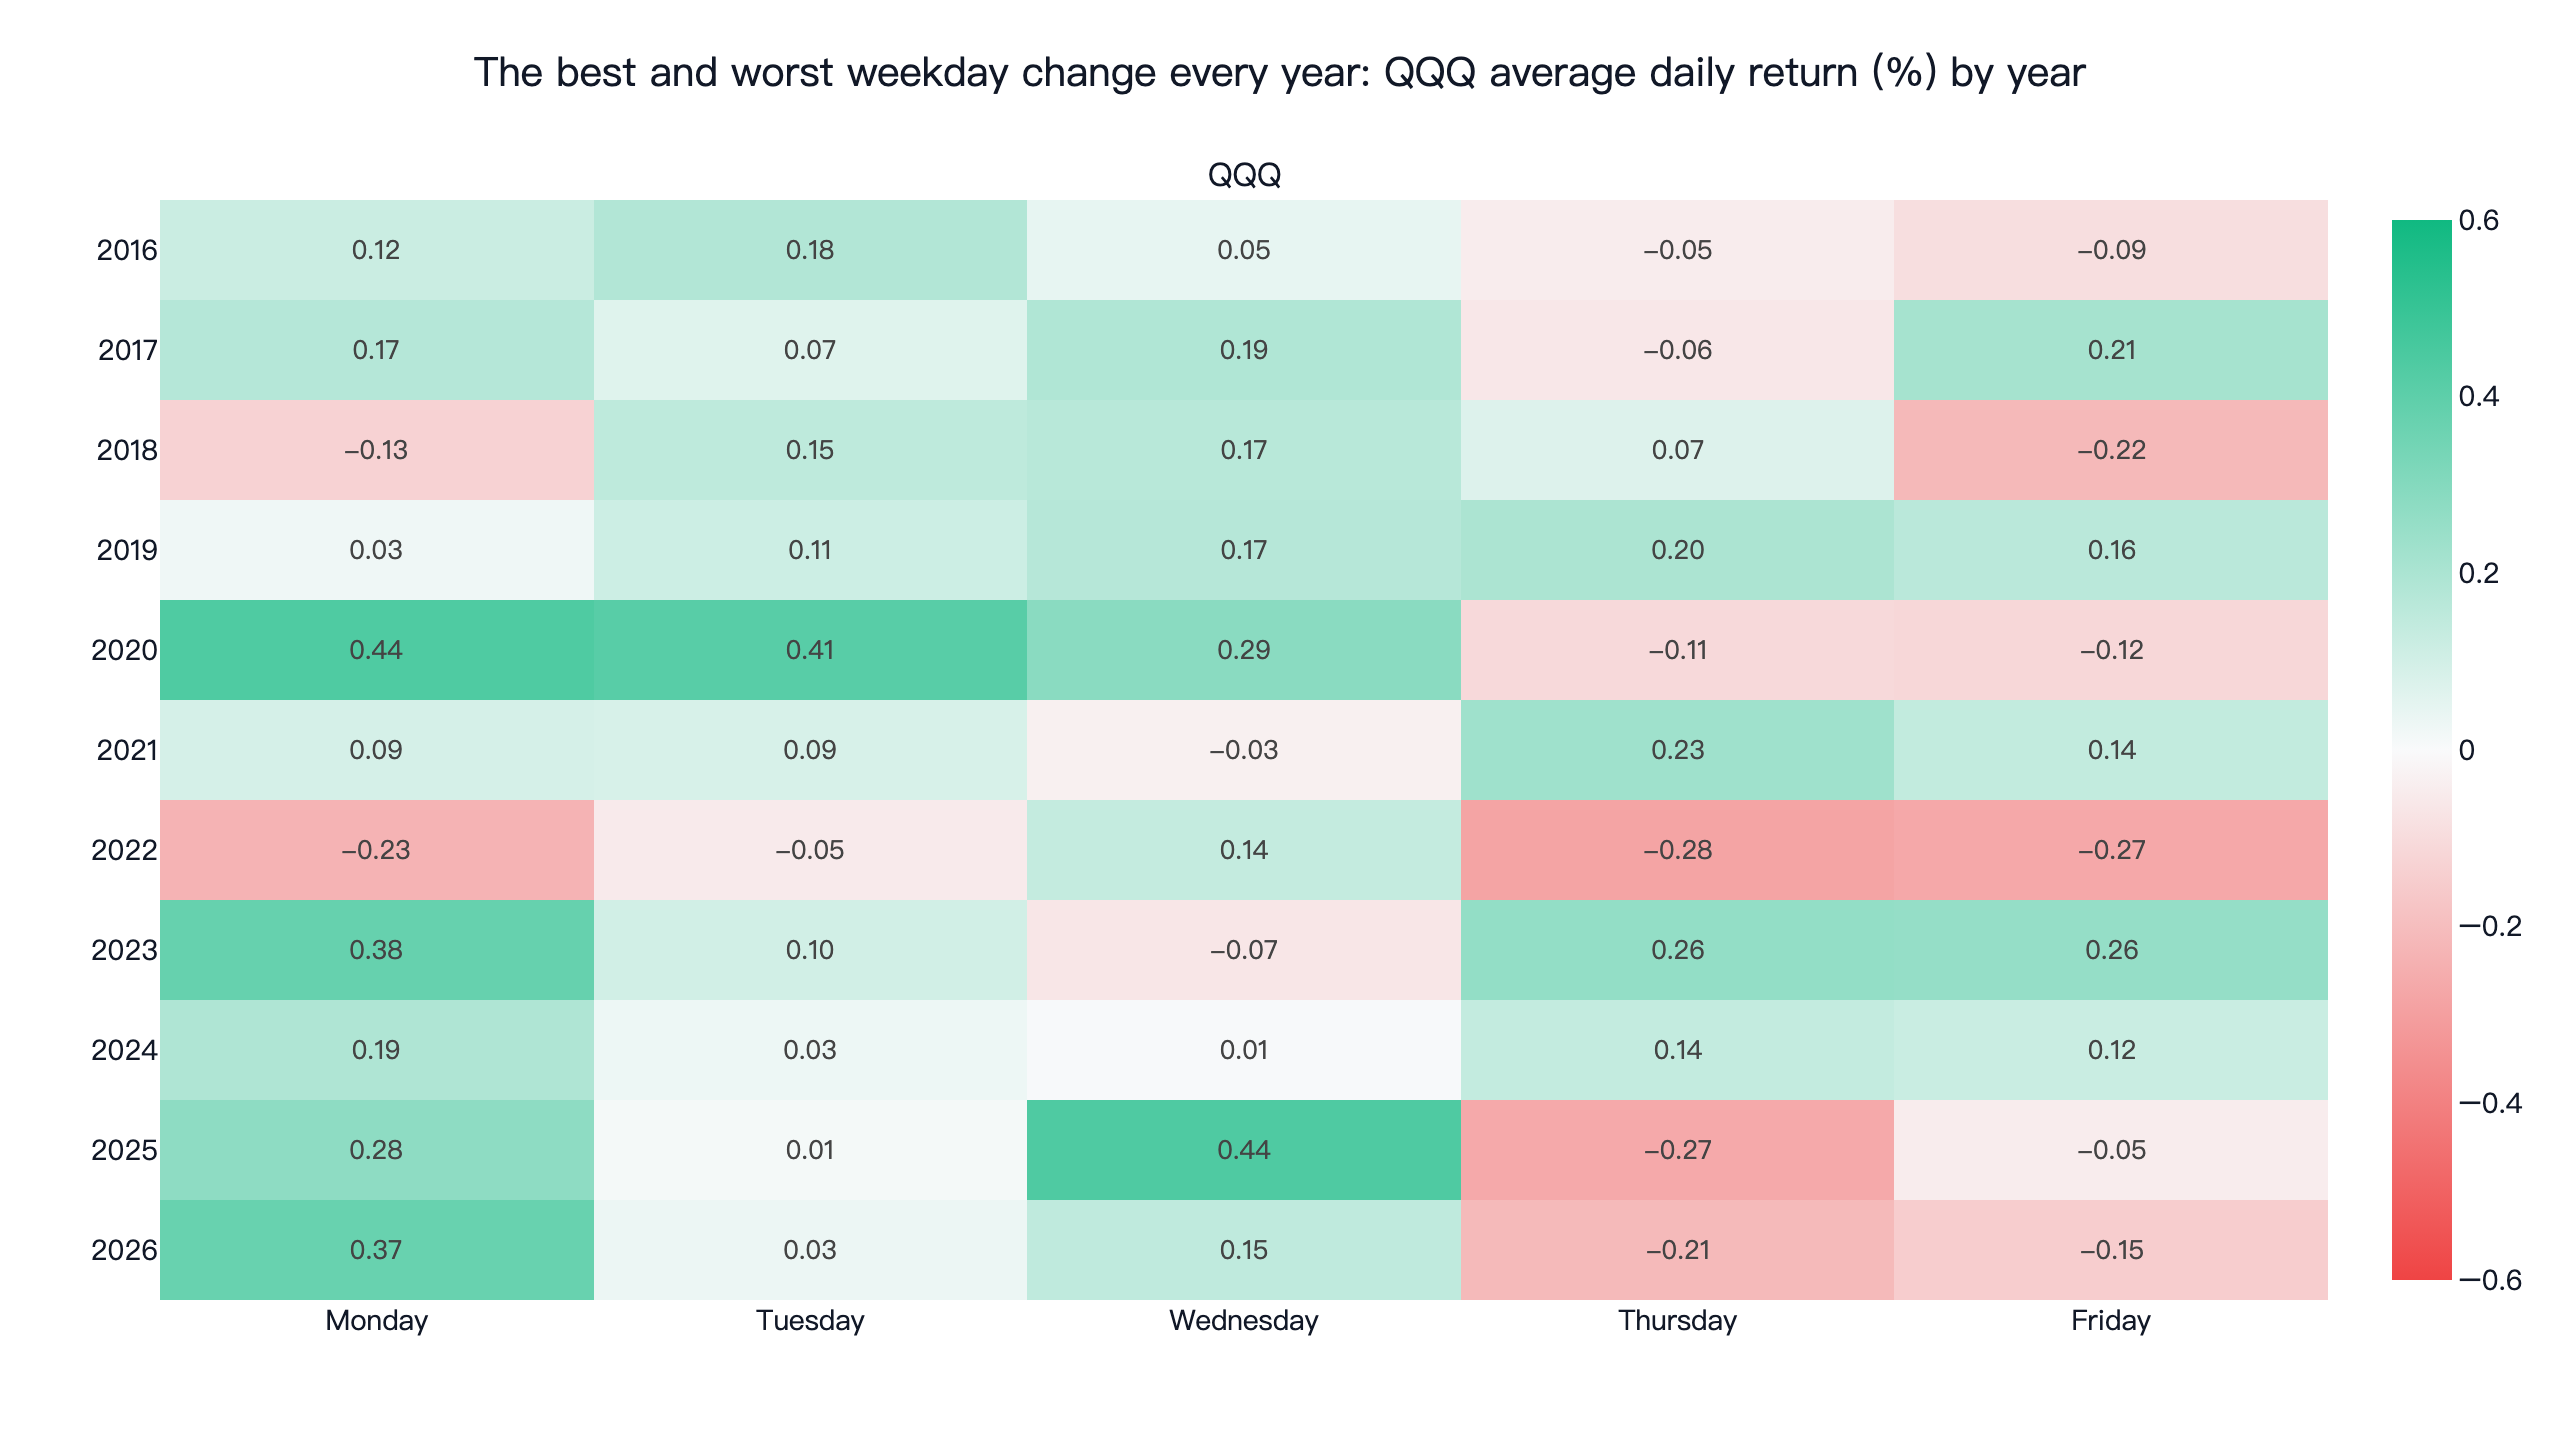
Year by year, the ranking keeps changing. In QQQ's 11 years Monday was the best day four times and the worst once. Thursday was the worst day four times, Friday and Wednesday three times each. In 2020 Monday and Tuesday averaged more than 0.4% a day; in 2022 every weekday except Wednesday averaged a loss.
That instability is why weekday effects are hard to trade. A year has 52 Mondays, and a 0.1% difference in the average is buried under daily moves of around 1%. It takes years to show up, and the next year may rank the days differently.
Weekly buying: which weekday is best?
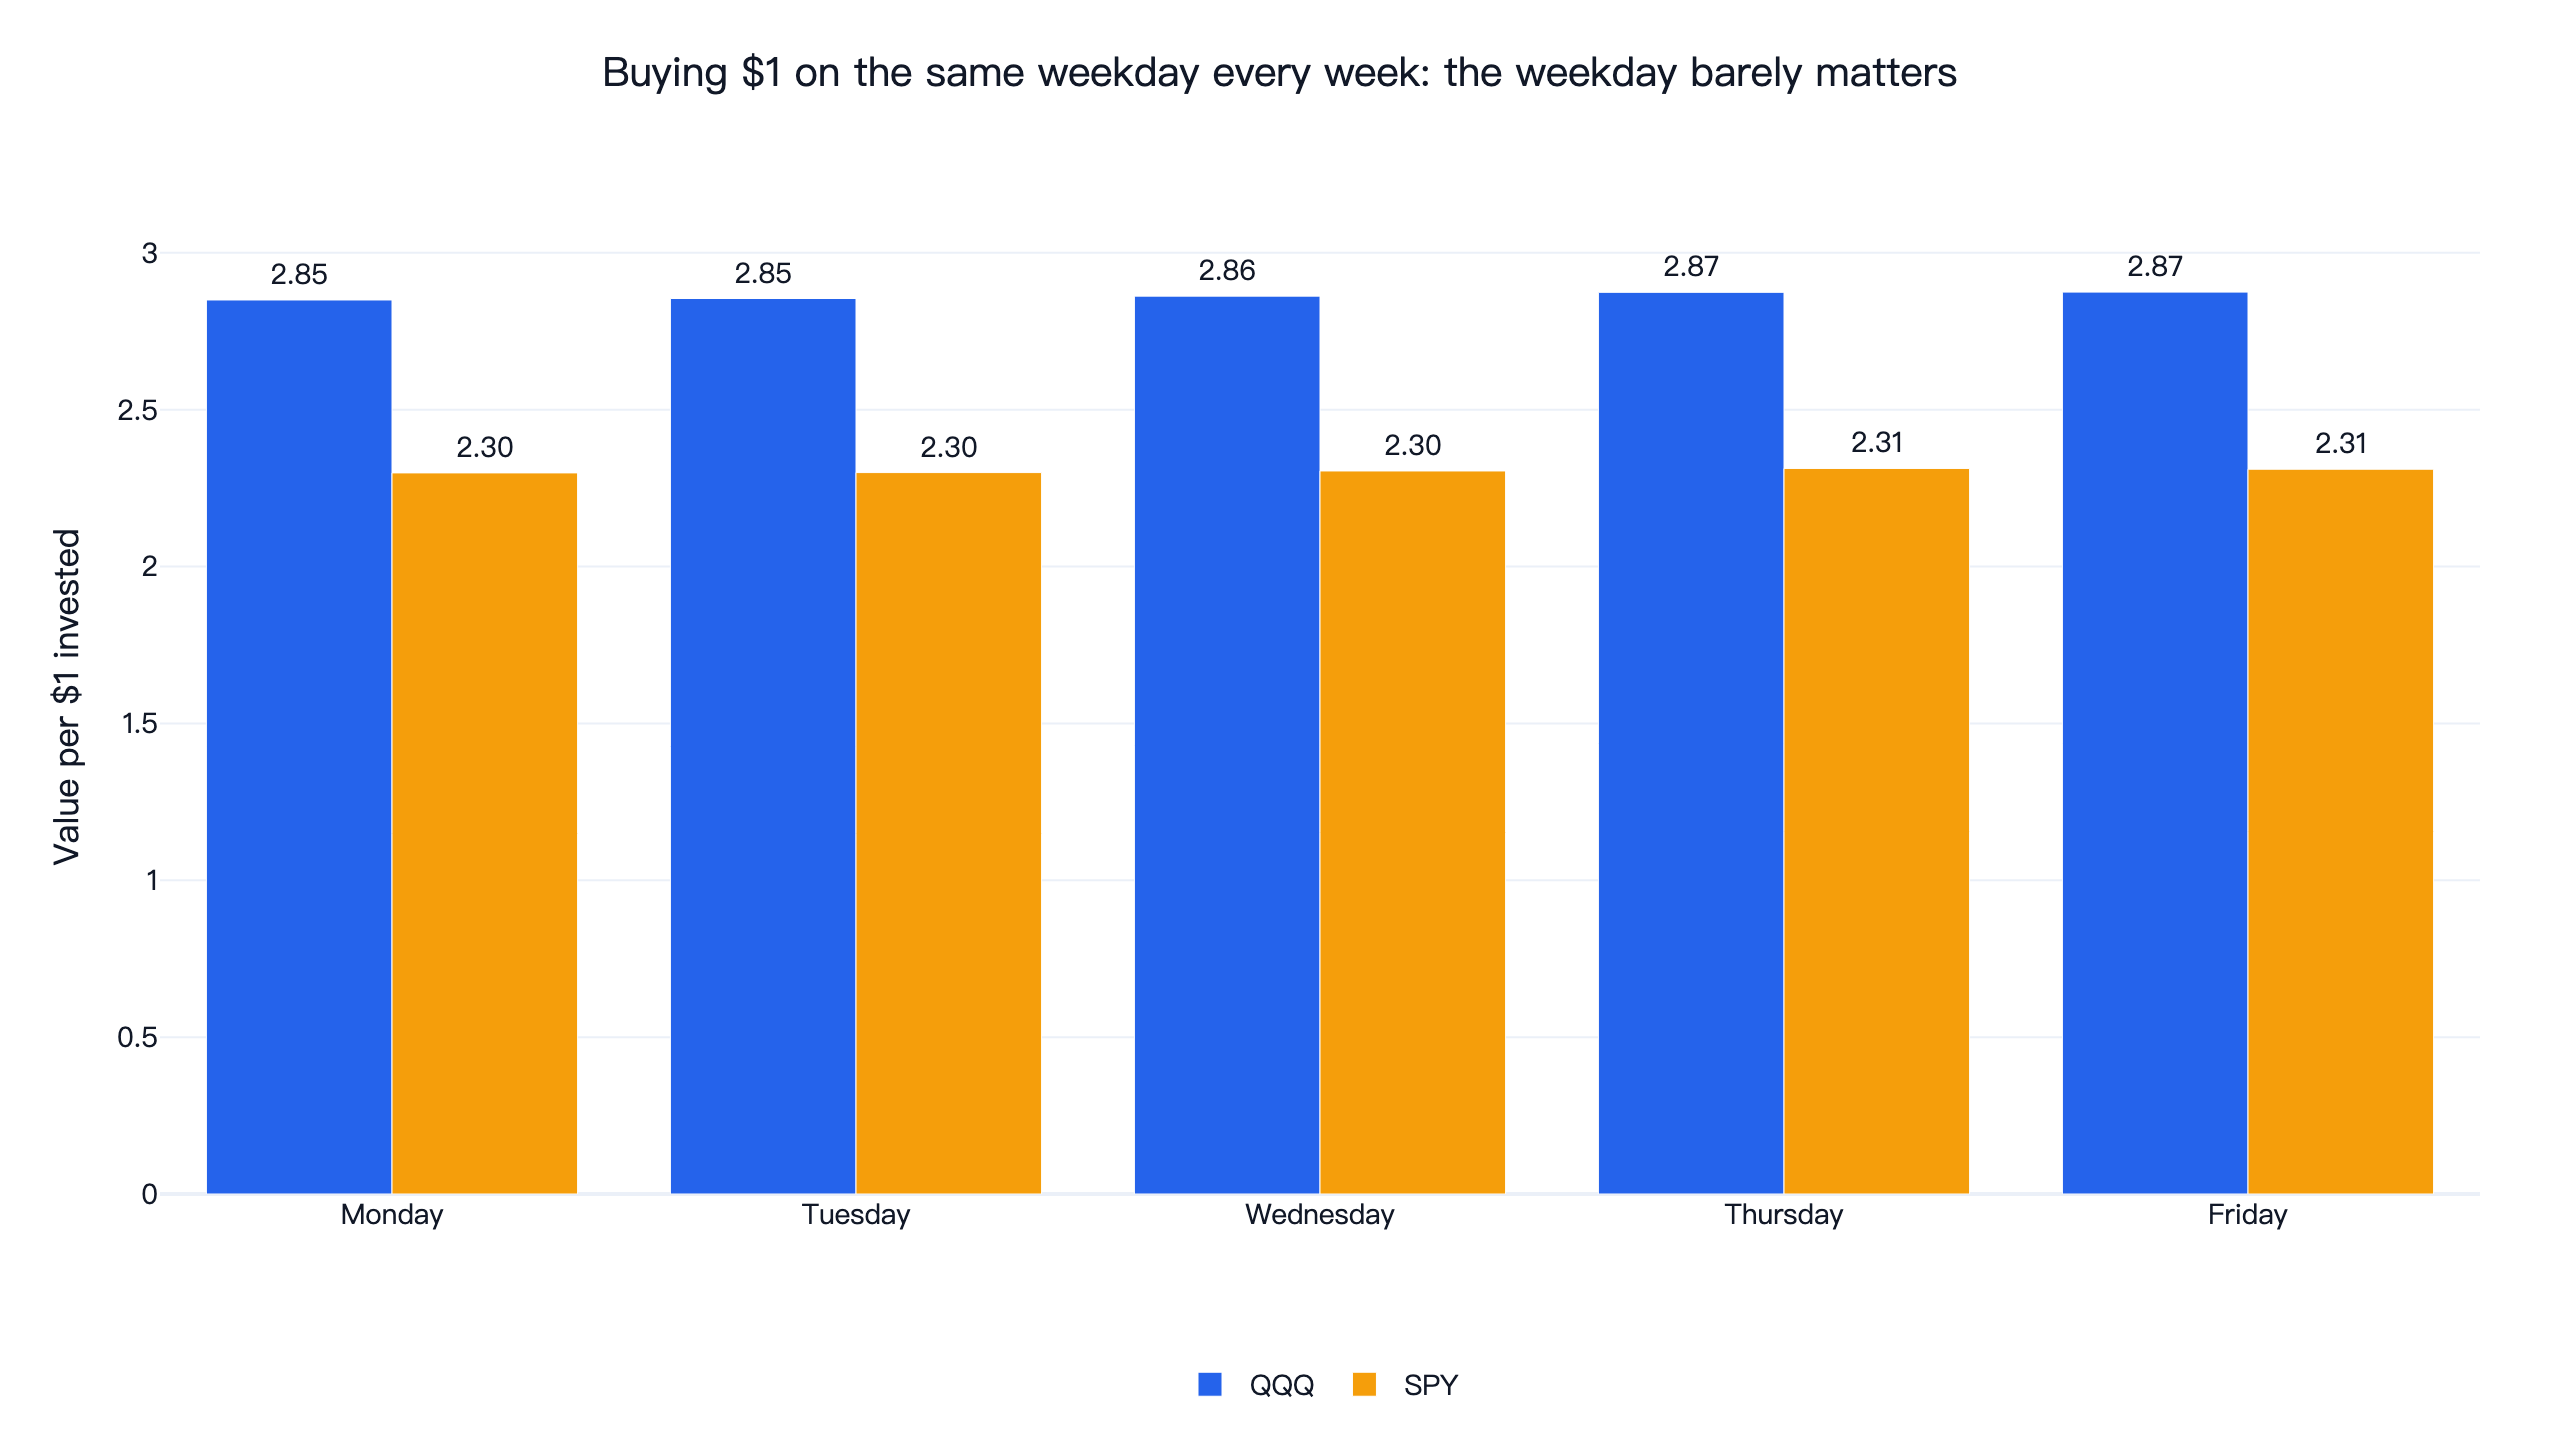
For most people, "the best day of the week to buy stocks" means the day to set a recurring purchase. We bought $1 at the close of the same weekday every week and held every purchase to the last day of data:
| Value per $1 invested | Monday | Tuesday | Wednesday | Thursday | Friday |
|---|---|---|---|---|---|
| QQQ, from January 2016 | $2.85 | $2.85 | $2.86 | $2.87 | $2.87 |
| SPY, from January 2016 | $2.30 | $2.30 | $2.30 | $2.31 | $2.31 |
The spread between the best and worst weekday was 0.9% for QQQ and 0.6% for SPY, and the best days for weekly buying were Thursday and Friday, which do not match the ranking by average daily return. Weeks with a holiday on the chosen day skip that purchase, so the number of purchases differs slightly by weekday (509 to 562 for QQQ). Any weekday works; staying with the plan matters far more than the day.
The code
This is the core of D1: find the first trading day of each week, stay in cash on that day, hold QQQ the rest of the time and compare daily Sharpe ratios.
Show Code
import pandas as pd
import finlab
from finlab import data
from finlab.backtest import sim

finlab.login()  # finlab guides you through login automatically
data.set_market("us_fund")
END = "2026-11-05"

# 1. QQQ with dividends reinvested, without the empty holiday rows
close = data.get("us_fund_price:adj_close")["QQQ"].dropna().loc[:END]
days = close.index

# 2. First trading day of each calendar week (Monday, or Tuesday after a Monday holiday)
week = pd.Series(days.to_period("W-SUN"), index=days)
first_day_of_week = ~week.duplicated()

# 3. Cash on that day: sell at Friday's close, buy back at Monday's close
hold = ~first_day_of_week

# 4. sim() trades at the next day's close, so the signal goes in two days early
signal = hold.shift(-2, fill_value=True)
report = sim(signal.astype(float).to_frame("QQQ"), resample=None, trade_at_price="close", upload=False)

# 5. Daily Sharpe of the rule and of QQQ over the same days
equity = report.creturn.reindex(days).ffill().loc[days[1]:]
for name, curve in [("Skip Monday", equity), ("QQQ buy and hold", close.loc[days[1]:])]:
    daily = curve.pct_change().dropna()
    print(name, round(daily.mean() / daily.std() * 252 ** 0.5, 2))
With data through 2026-11-05 this prints 0.68 and 0.88. Weekdays are known in advance, so shifting the signal two days earlier does not use any future price. The full research.py adds D2, the 18-setting grid, both halves, the cost and T-bill checks, the SPY reference, the weekday statistics with yearly averages and the weekly buying comparison.
Install the FinLab skill for your AI agent
You do not need to write the code above yourself. Install the FinLab skill in Claude Code, Codex or Gemini CLI with one command:
Show Code
npx skills add koreal6803/finlab-ai --skill finlab -g -yThen ask your agent in plain language, for example "show SPY's average return for each weekday by year" or "test holding QQQ from Monday's close to Wednesday's close, with neighbouring windows, both halves and 0.1% cost per trade". The AI agent setup page walks through each tool, the AI-assisted setup connects your FinLab account, and the same research runs in the browser at studio.finlab.finance.
Backtest method and limits
| Item | What we did |
|---|---|
| Window | 2016-01-05 to 2026-11-05, the full us_fund_price history (it starts on 2016-01-04, and the first buy is at that day's close). The 55 empty holiday rows are dropped first. |
| Weekday | The weekday of the return day: Monday is Friday's close to Monday's close. The designs use the first and last trading day of each calendar week. |
| Asset and weights | QQQ, 100% in the market or 0%. SPY is a reference only. |
| Idle cash | Earns nothing, finlab's default. D2 is also compared on returns above BIL. |
| Signal timing | Weekdays are known in advance. sim() trades at the next trading day's close, so signals are set two trading days early; see look-ahead bias. |
| Costs | finlab's US default of zero, plus a second run at 0.1% per side for spread and slippage. |
| Turnover | Both designs trade about 52 times a year (turnover). |
| Benchmark | QQQ buy and hold with dividends, no costs. |
| Sample | All in-sample: ten years, about 510 to 560 days per weekday. The halves are a stability check, not an out-of-sample test. Returns are close to close, so opening gaps after the weekend are not studied separately. |
What this result does and does not say
It says that in the last ten years the large-cap US market had no Monday effect; if anything Monday was the strongest day. Timing QQQ by weekday did not pass in any of our settings, and the cost of trading every week is far larger than any weekday difference we found.
It does not say weekdays never matter. Monday's open often carries weekend news, so day traders see larger gaps and swings; this study only measures close to close. For a long-term investor the conclusion is simple: pick any day for a recurring purchase, and keep the days in the market.
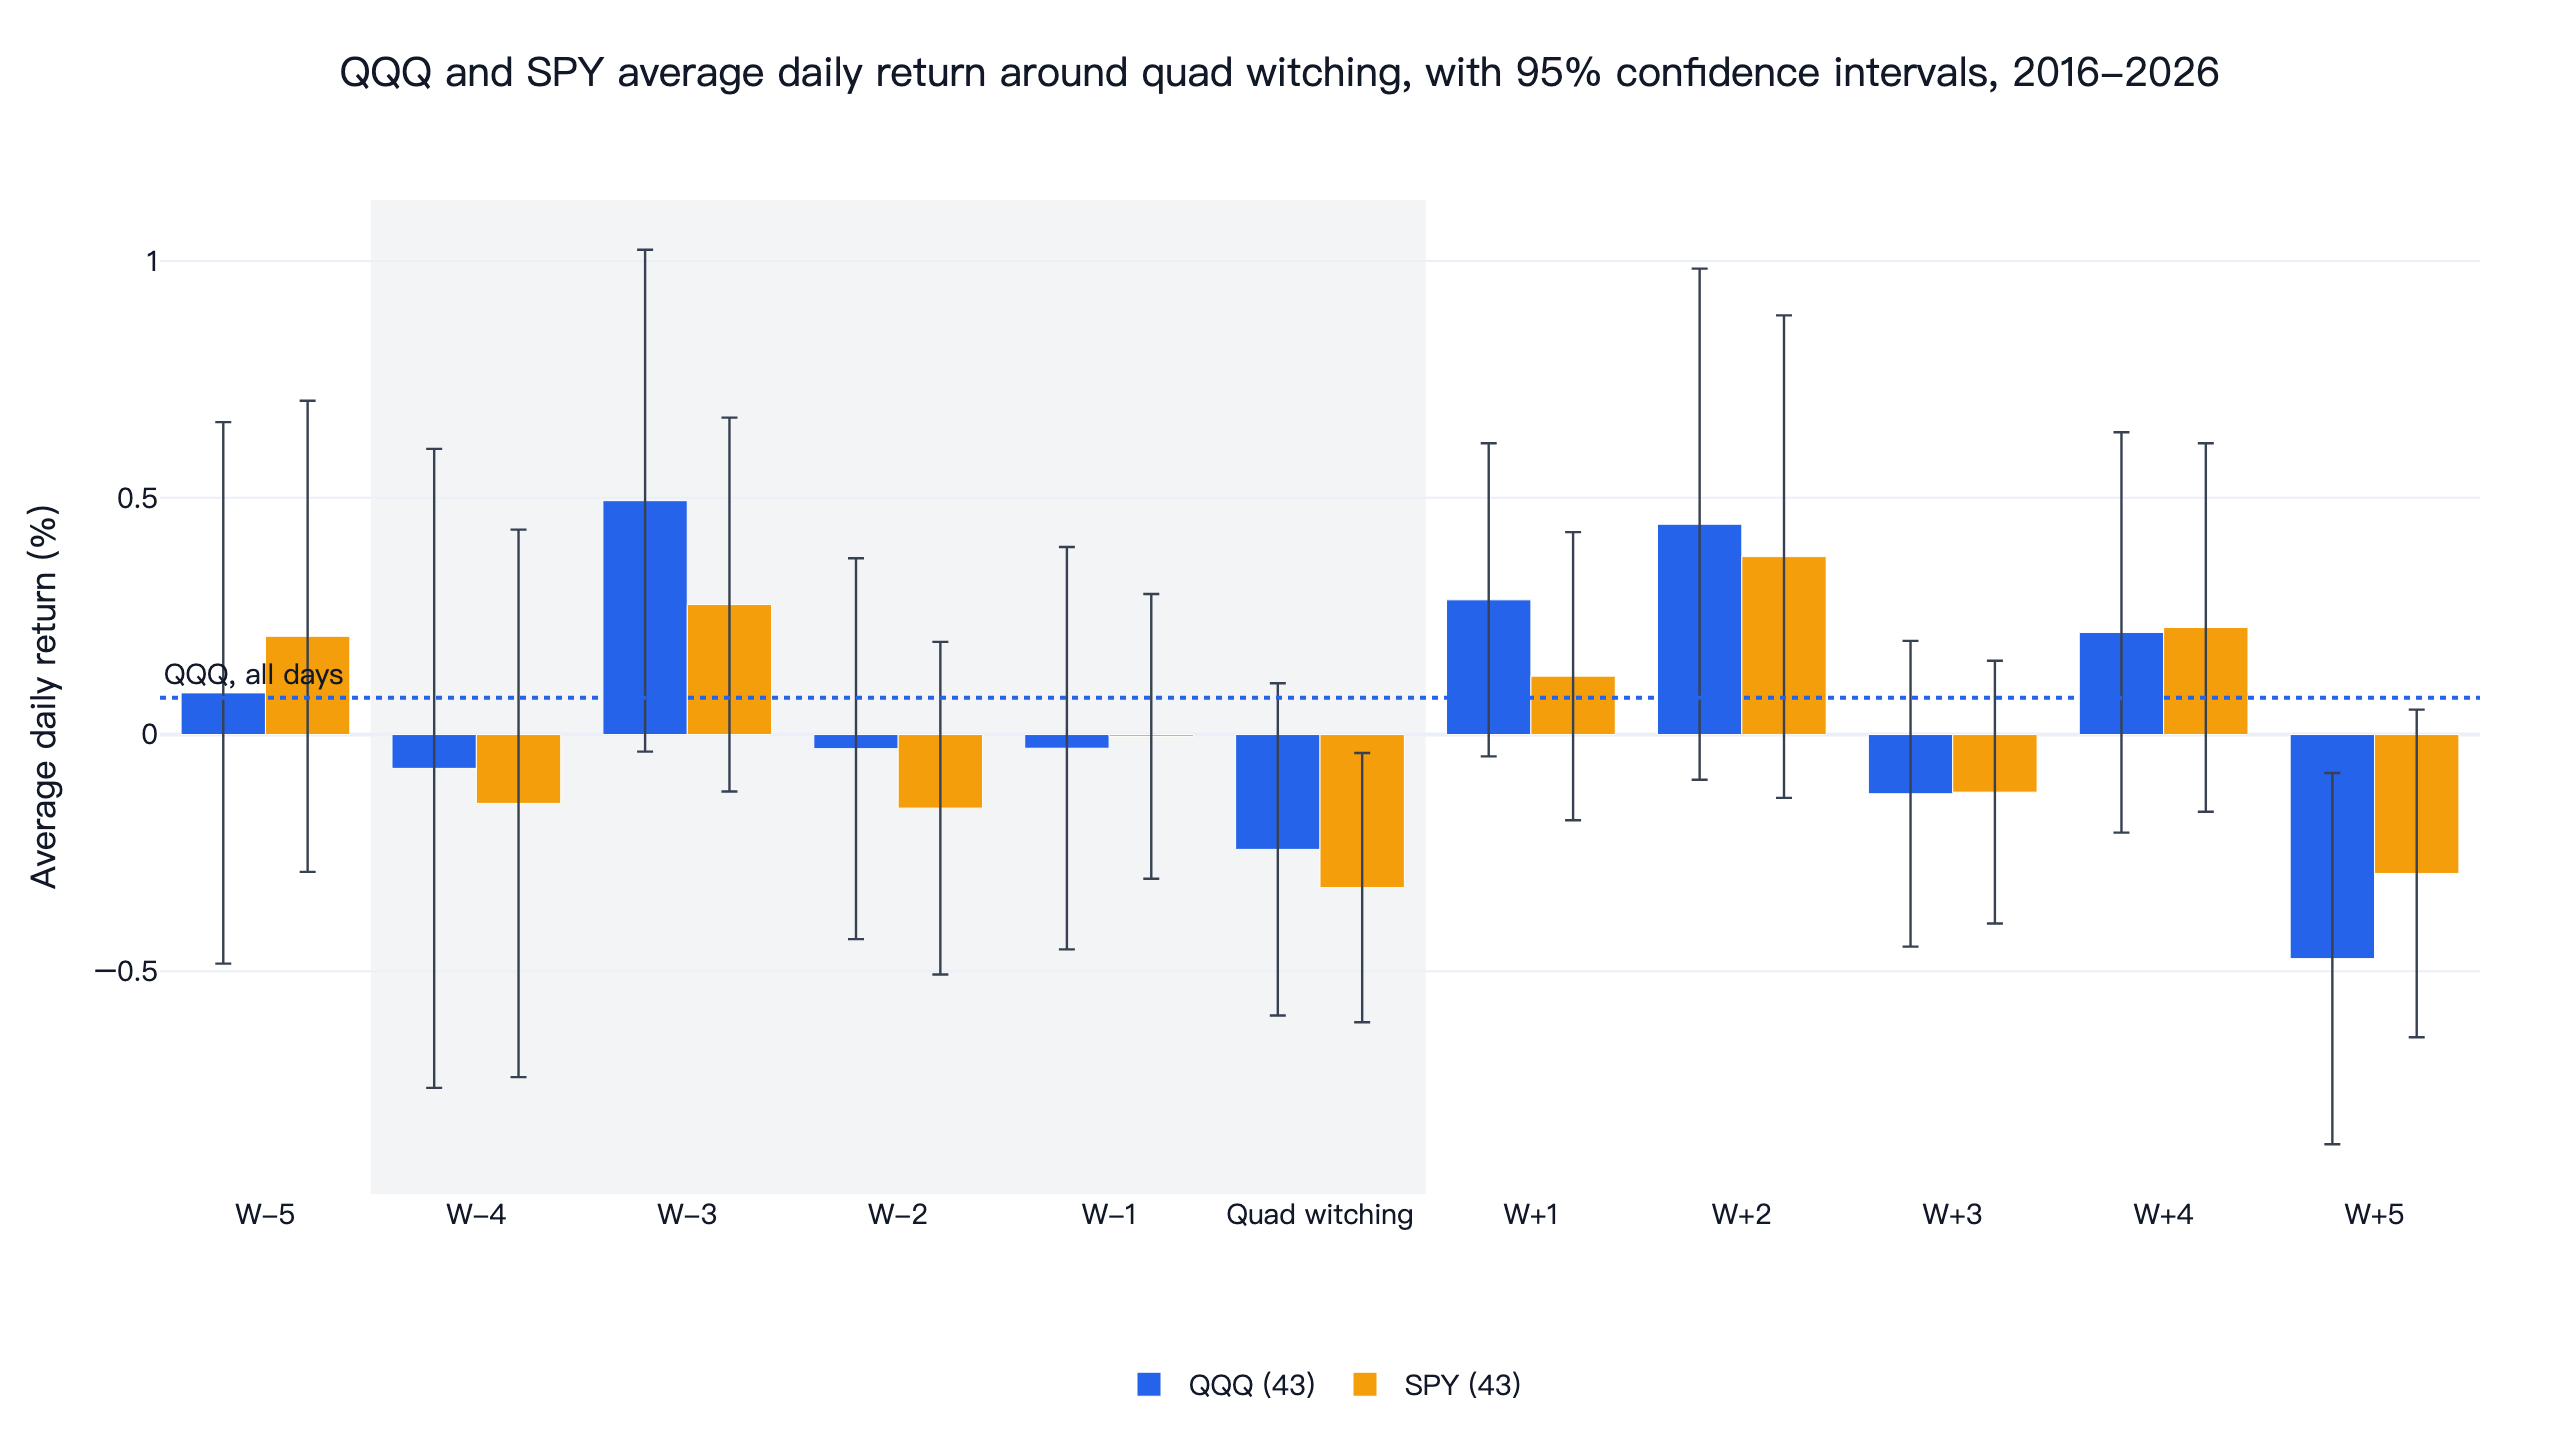
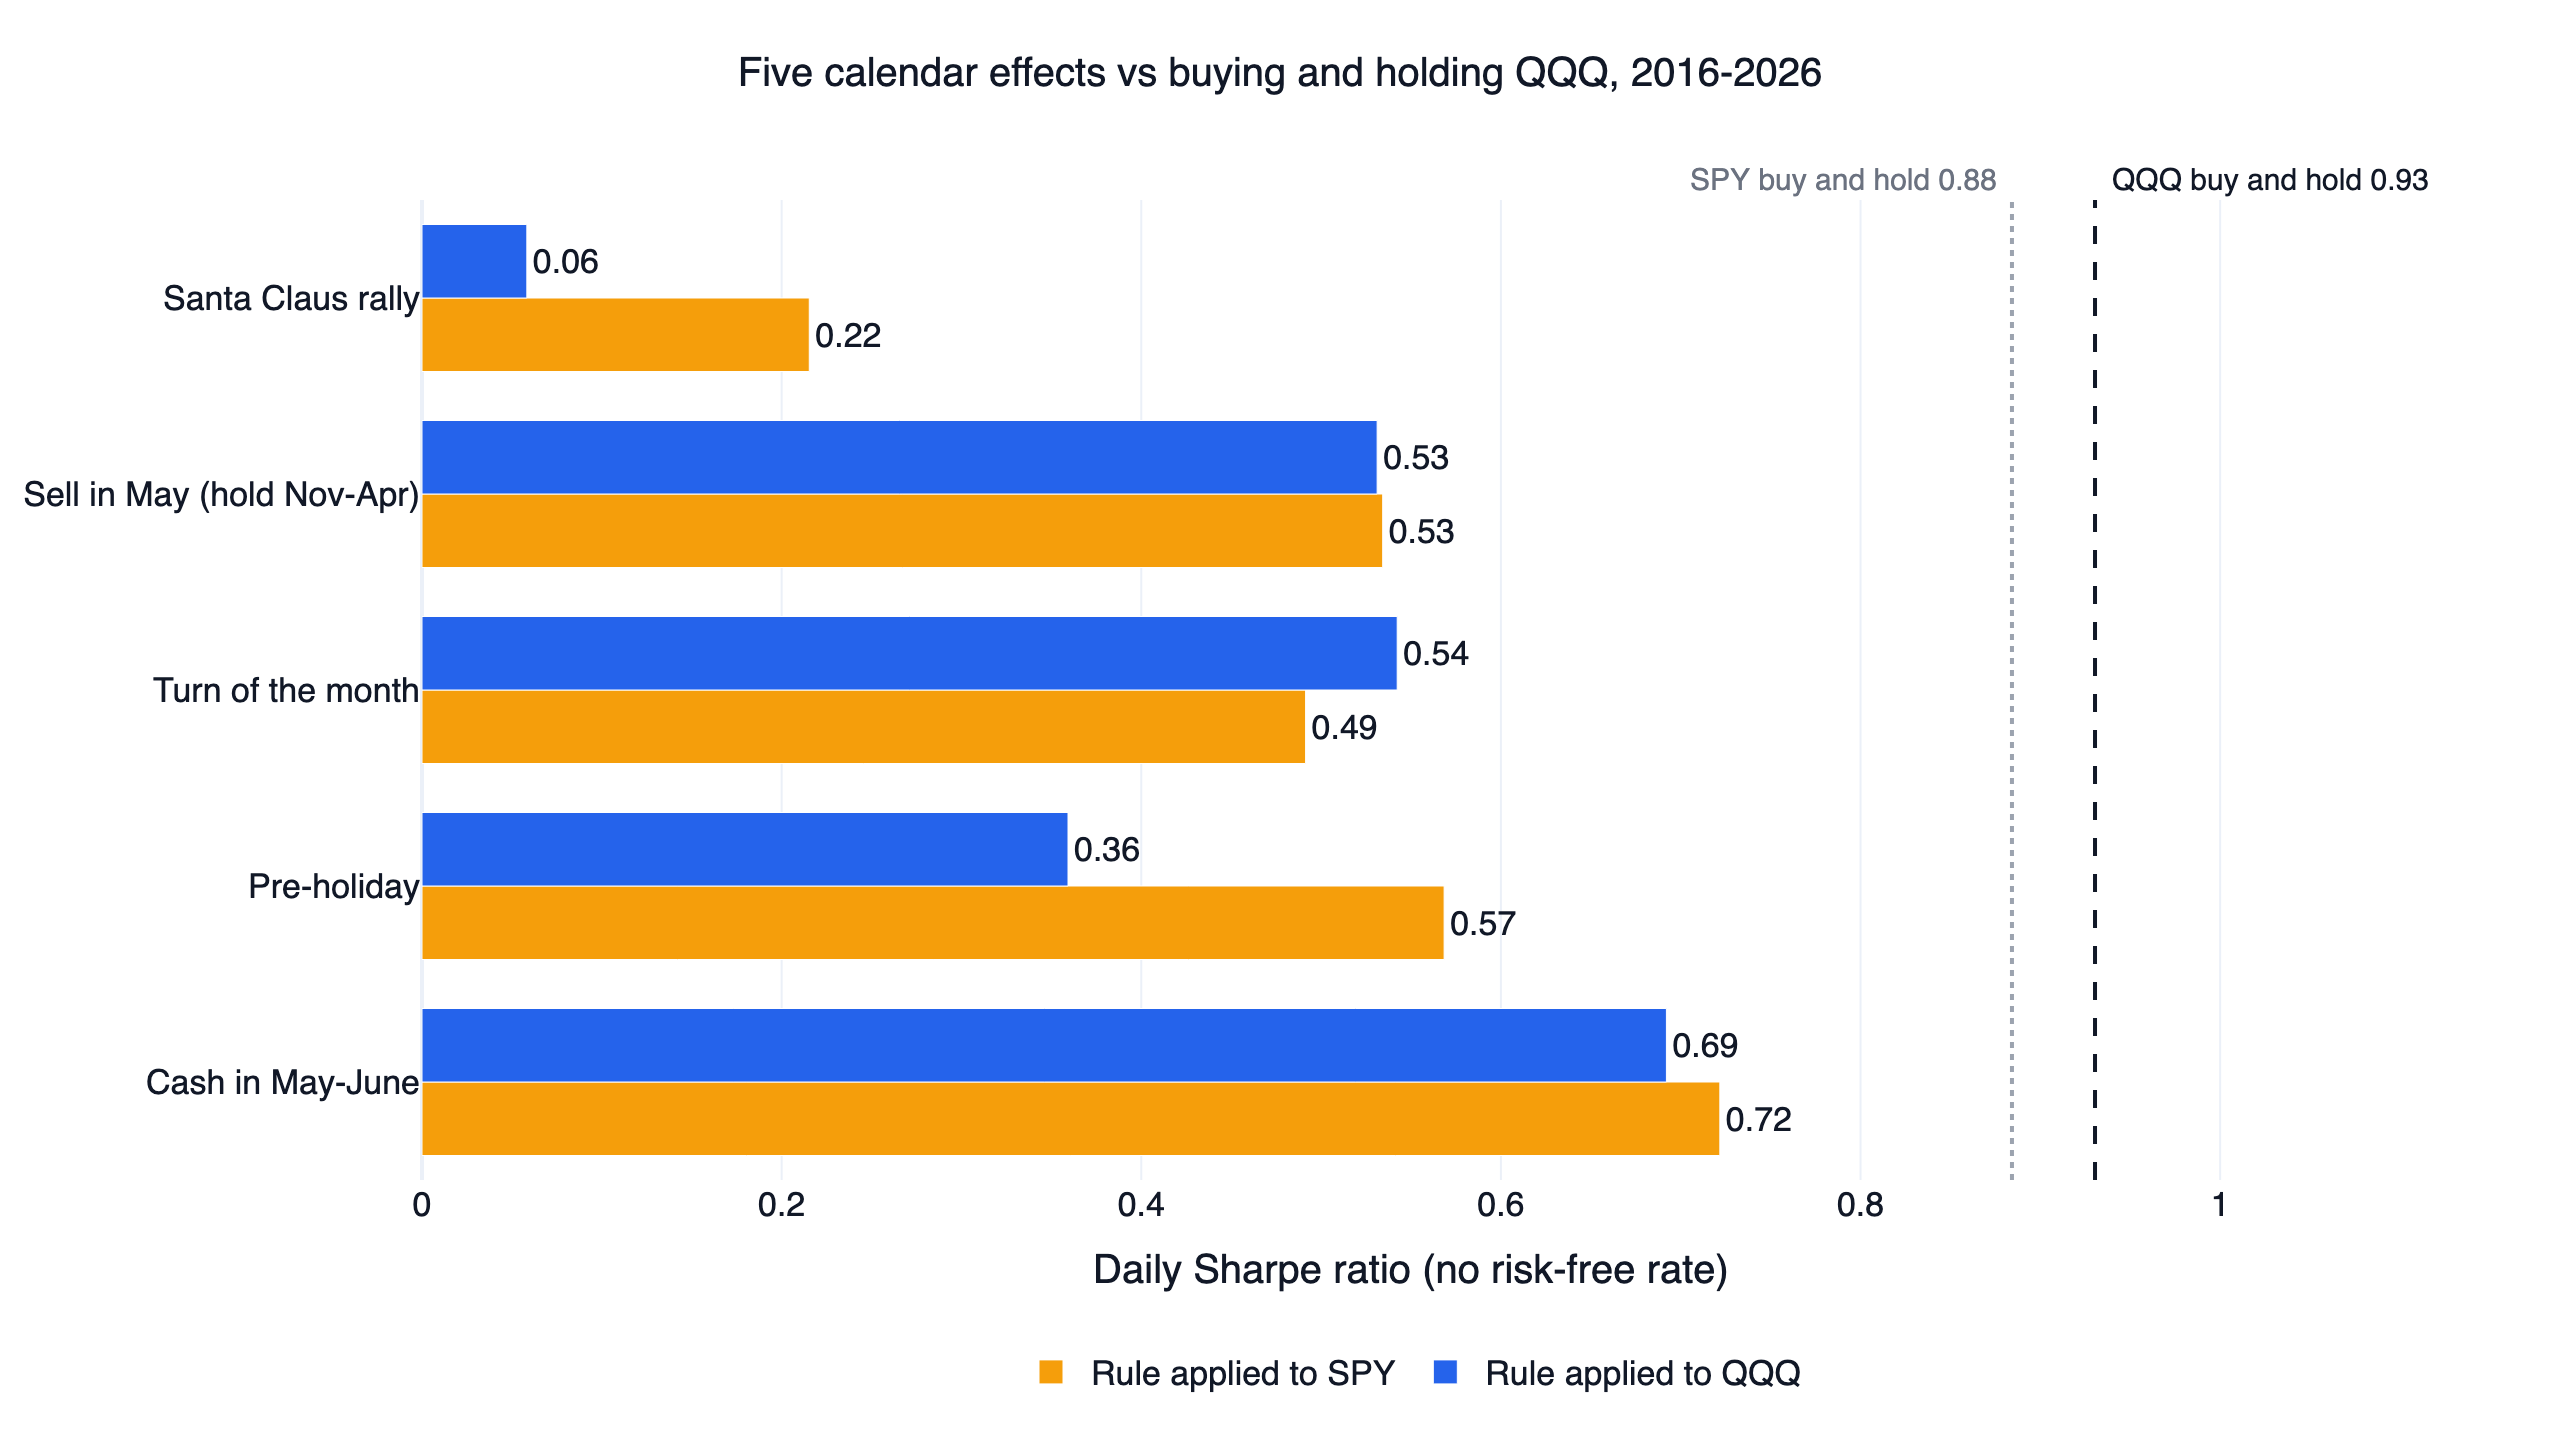
Our other calendar studies reach the same conclusion: quad witching and the Santa Claus rally and Sell in May did not beat holding QQQ either. The US timing rule that has passed all three checks since 2016 is the US ETF rotation strategy, which follows QQQ's trend and momentum and holds leveraged ETFs, with the risks that brings. Everything else is in the US quant strategies overview.
FAQ
What is the best day of the week to buy stocks?
For QQQ and SPY from 2016 to 2026, Monday had the highest average daily return and Thursday the lowest. The ranking changes every year, and buying on the same weekday every week ended within 1% whichever day was chosen.
Is the Monday effect still real?
Not for large US stocks. French (1980) found negative Mondays from 1953 to 1977, but after 1987 large-cap Mondays turned positive, and QQQ's Mondays averaged +0.15% from 2016 to 2026, the best day of the week.
Is Friday a good day to buy stocks?
In this decade Friday was one of QQQ's two weakest days, averaging +0.004%. Holding QQQ only on Fridays scored a daily Sharpe ratio of 0.07, against 0.88 for holding it all the time.
Should I avoid buying stocks on Monday?
No. Skipping Monday on QQQ earned 12.1% a year against 18.7% for holding, and every week out of the market on Monday was a week without the best average day.
What day of the week should I set my automatic investment?
Any day. A dollar invested every Monday in QQQ grew to 2.87; for SPY the range was 2.31.
Why do stocks behave differently on different days?
Proposed reasons include company news timed for Friday evenings, short sellers closing positions before the weekend, and differences in who trades early and late in the week. None of them produced a reliable pattern in this sample.
Can I rerun this myself?
Yes. Install the FinLab skill through the AI-assisted setup, download research.py below and run python research.py. It writes every number in this article to metrics.json.
Reproduce it yourself
- research.py: both designs, the 18-setting grid, both halves, the cost and T-bill checks, the SPY reference, weekday statistics and the weekly buying comparison.
- data.csv: daily equity curves of the designs and of QQQ with dividends.
- metrics.json: every statistic quoted in this article, including each setting, each weekday's interval and the yearly averages.
More US research is on the FinLab blog, the long-run comparison behind our benchmark is in QQQ vs SPY, VOO and VTI, the quant trading guide covers the basics, and the team behind it is on the about page.
Last updated: 2026-11 | Backtest window: 2016-01 to 2026-11 | Benchmark: QQQ total return | Author: FinLab Quant Research (reviewed by a quantitative researcher)
Past performance does not represent future results, and every result here is an in-sample backtest. This content is for education only, is not investment advice, and does not constitute investment advice.
FinLab AI
Want to build your own strategy?
Describe your stock-picking ideas in natural language. AI automatically validates, backtests, and gives you answers
Start Free