Run this strategy
Copy the prompt to reproduce the evidence above with the article’s data, assumptions, and risk checks.
Tell your AI:
Set up FinLab and compare who won every 1, 3 and 5 year hold among QQQ, SPY, VOO and VTI with dividends. Please read: https://finlab.finance/en/setup?relatedUrl=/en/blog/qqq-vs-spy-voo-vti-backtest
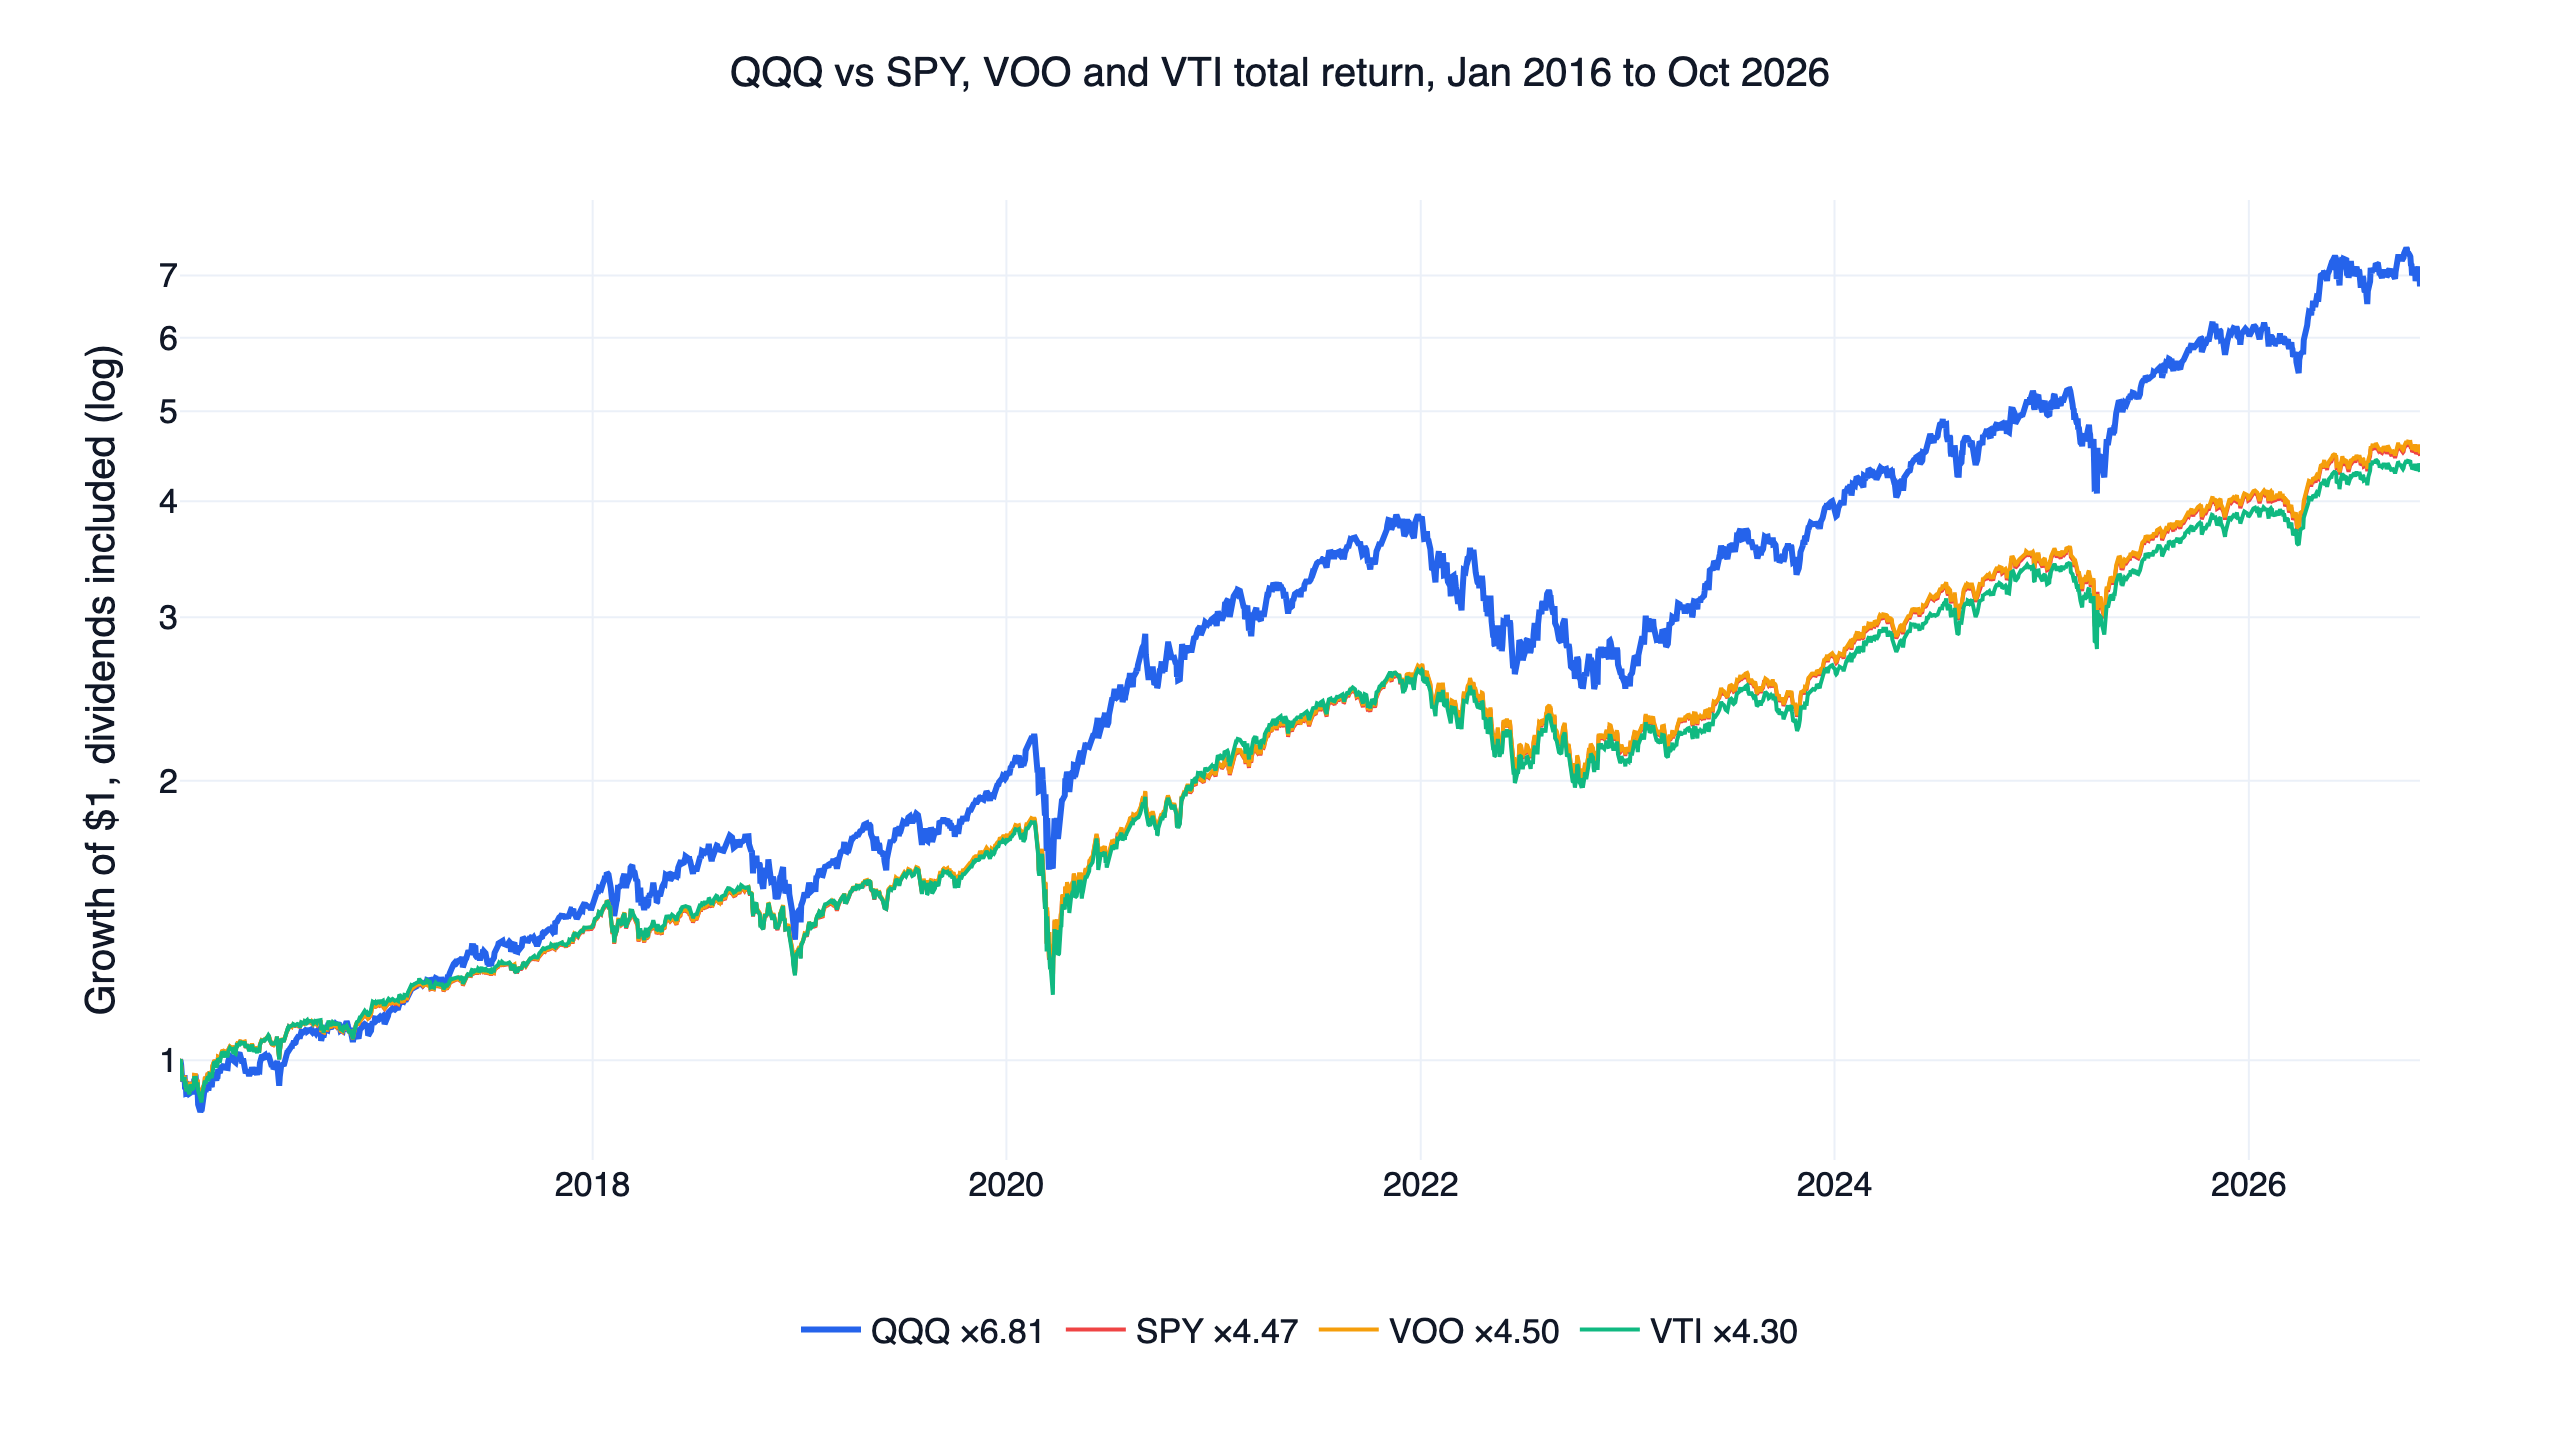
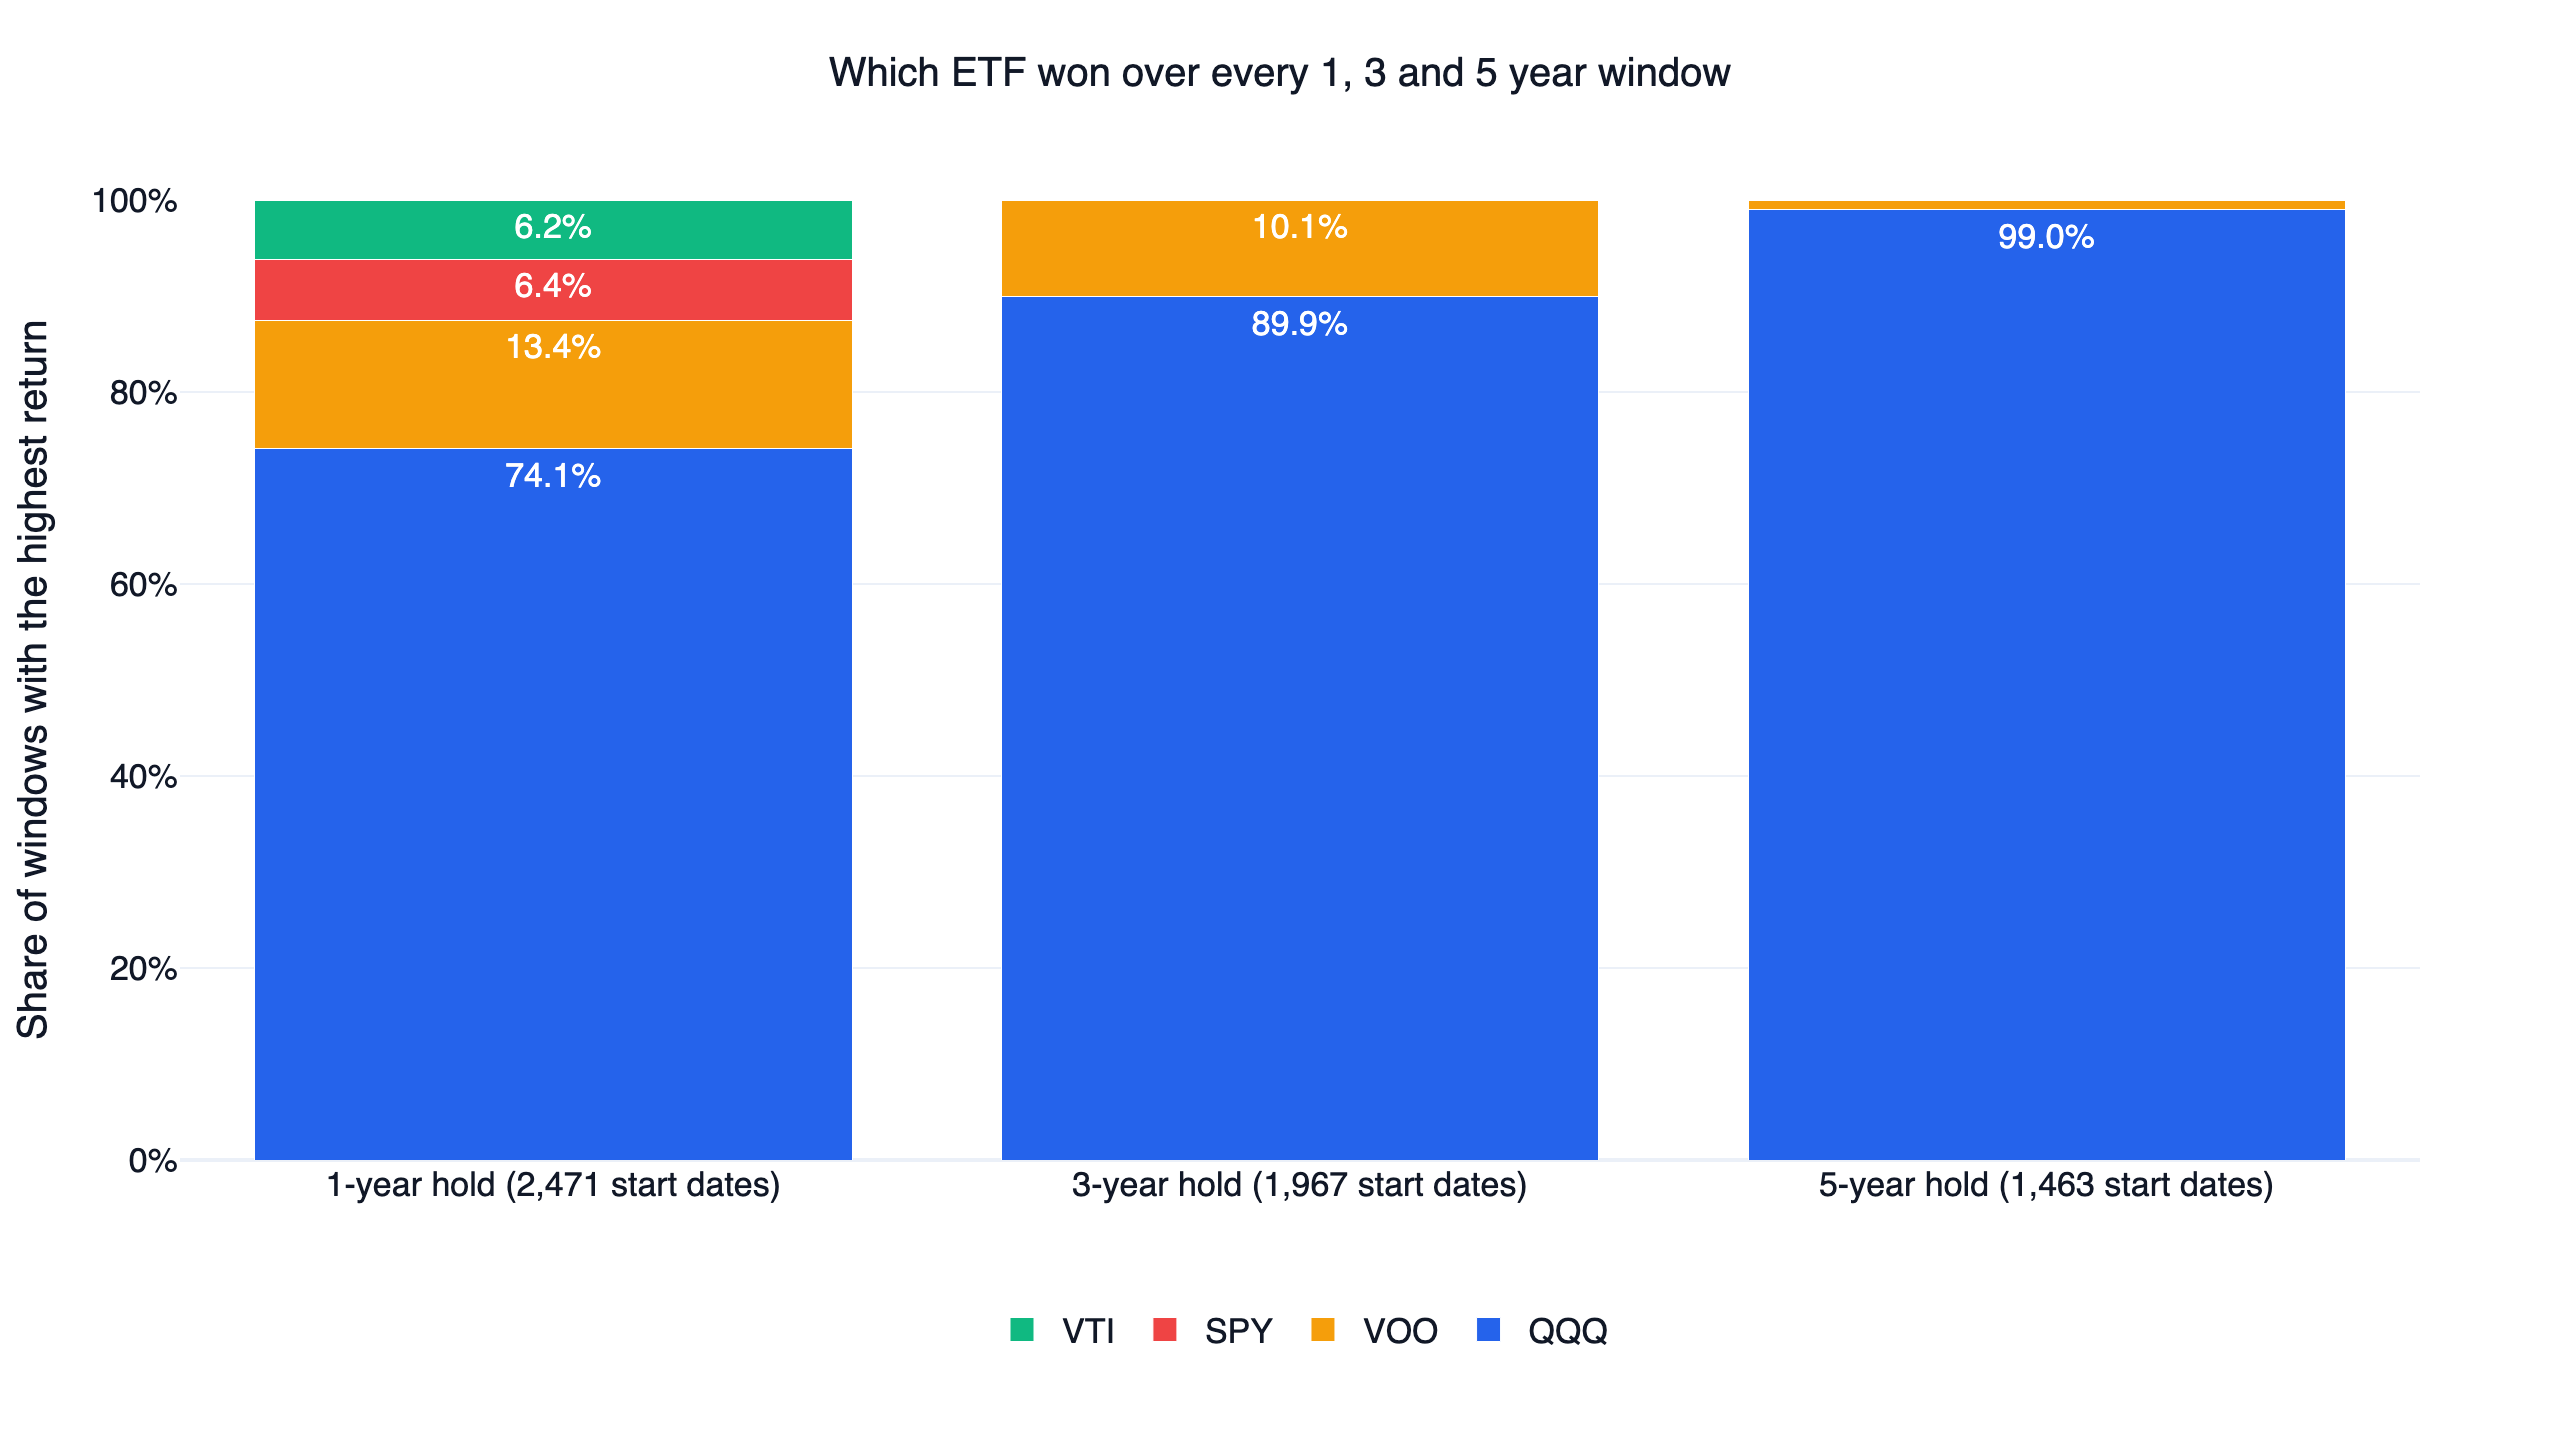
From January 2016 to October 2026, QQQ returned 19.4% a year with dividends reinvested, against 14.9% for SPY, 14.9% for VOO and 14.4% for VTI. Buy on any day and hold for five years, and QQQ was the best of the four from 99% of start dates. But the lead was concentrated in 2020 and 2023: without those two years QQQ returned 13.1% a year, slightly behind SPY's 13.3%, because 2022's shortfall is still in the sum. This sample has no dot-com crash in it, so it describes what happened in these ten years. It is not a ranking of the funds for the next ten.
The switching rules we tested are a cautionary example. Of 45 settings across five rules that move between QQQ, SPY and T-bills, 12 beat holding QQQ on daily Sharpe, and no rule passed our checks. The original settings owe almost all of their edge to 2022: take that year out and all five trail QQQ.
Key numbers
| 2016-01-04 to 2026-10-30, dividends reinvested; data through 2026-10-30, rerun 2026-11-01 | QQQ | SPY | VOO | VTI |
|---|---|---|---|---|
| Growth of $1 | $6.81 | $4.47 | $4.50 | $4.30 |
| Annual return (CAGR) | 19.4% | 14.9% | 14.9% | 14.4% |
| Annual volatility | 22.2% | 17.7% | 17.7% | 18.0% |
| Daily Sharpe (no risk-free rate) | 0.91 | 0.87 | 0.87 | 0.84 |
| Daily Sharpe above T-bills (BIL) | 0.81 | 0.75 | 0.75 | 0.72 |
| Maximum drawdown | -35.1% | -33.7% | -34.0% | -35.0% |
| 2022 drawdown | -35.1% | -24.5% | -24.5% | -25.4% |
| Worst calendar year | -32.6% | -18.2% | -18.2% | -19.5% |
| Expense ratio | 0.18% | about 0.09% | 0.03% | 0.03% |
| Trailing 12-month yield | 0.45% | 1.00% | 1.07% | 1.06% |
SPY and VOO track the same index and their daily returns correlate at 0.9988, so their lines sit on top of each other in the chart. VTI correlates with SPY at 0.996. Only one real choice remains: how much weight to give the Nasdaq-100. QQQ's correlation with SPY is 0.931 and its beta to SPY is 1.17.
QQQ costs about 0.09 percentage points more than SPY, and VOO about 0.06 less. Elton, Gruber and Busse (2004) studied S&P 500 index funds and found that performance differences between funds tracking the same index were driven mainly by expenses, yet investors did not always choose the cheapest fund. The holding windows below show that effect directly.
QQQ vs SPY, VOO and VTI over every 1, 3 and 5 year hold
We treated every trading day from January 4, 2016 as a purchase date, held for 252, 756 or 1,260 trading days (about 1, 3 and 5 years), and recorded which fund had the highest total return. QQQ came first in 74.1% of one-year windows, 89.9% of three-year windows and 99.0% of five-year windows, and most of the rest went to VOO (13.4%, 10.1% and 1.0%).
| Hold | Start dates | QQQ beats SPY | QQQ beats VOO | QQQ beats VTI | VOO beats SPY | VOO beats VTI |
|---|---|---|---|---|---|---|
| 1 year | 2,471 | 76.9% | 76.5% | 78.8% | 81.5% | 68.2% |
| 3 years | 1,967 | 90.7% | 89.9% | 98.7% | 96.0% | 85.7% |
| 5 years | 1,463 | 99.0% | 99.0% | 100.0% | 99.6% | 85.9% |
| Hold | QQQ median | SPY median | VOO median | VTI median | QQQ worst | SPY worst | Worst QQQ minus SPY |
|---|---|---|---|---|---|---|---|
| 1 year | 25.4% | 17.0% | 17.1% | 17.0% | -34.8% | -19.7% | -15.9 pts |
| 3 years | 75.5% | 47.6% | 47.8% | 46.9% | 17.3% | 1.2% | -5.1 pts |
| 5 years | 131.4% | 98.3% | 98.7% | 91.5% | 69.4% | 50.6% | -1.9 pts |
These are cumulative returns over the window, not annualised. The windows overlap heavily and the last five-year window starts on 2021-10-22, so 1,463 start dates still cover only one stretch of about 11 years. They are not 1,463 independent experiments.
VOO's win rate over SPY rises with the holding period, from 81.5% to 99.6%. Over the full period VOO returned 0.07 points a year more than SPY, close to their 0.06 point fee gap, and the median five-year gap was about 0.5 points. SPY is a trust, and we did not separate out any effect of that structure. In the VOO vs VTI comparison, VTI holds thousands of extra small and mid-size companies, which lagged large caps over this period, so VOO won 85.9% of five-year windows. That is a style result that could reverse in a period led by smaller companies.
QQQ vs SPY: the lead came from two years
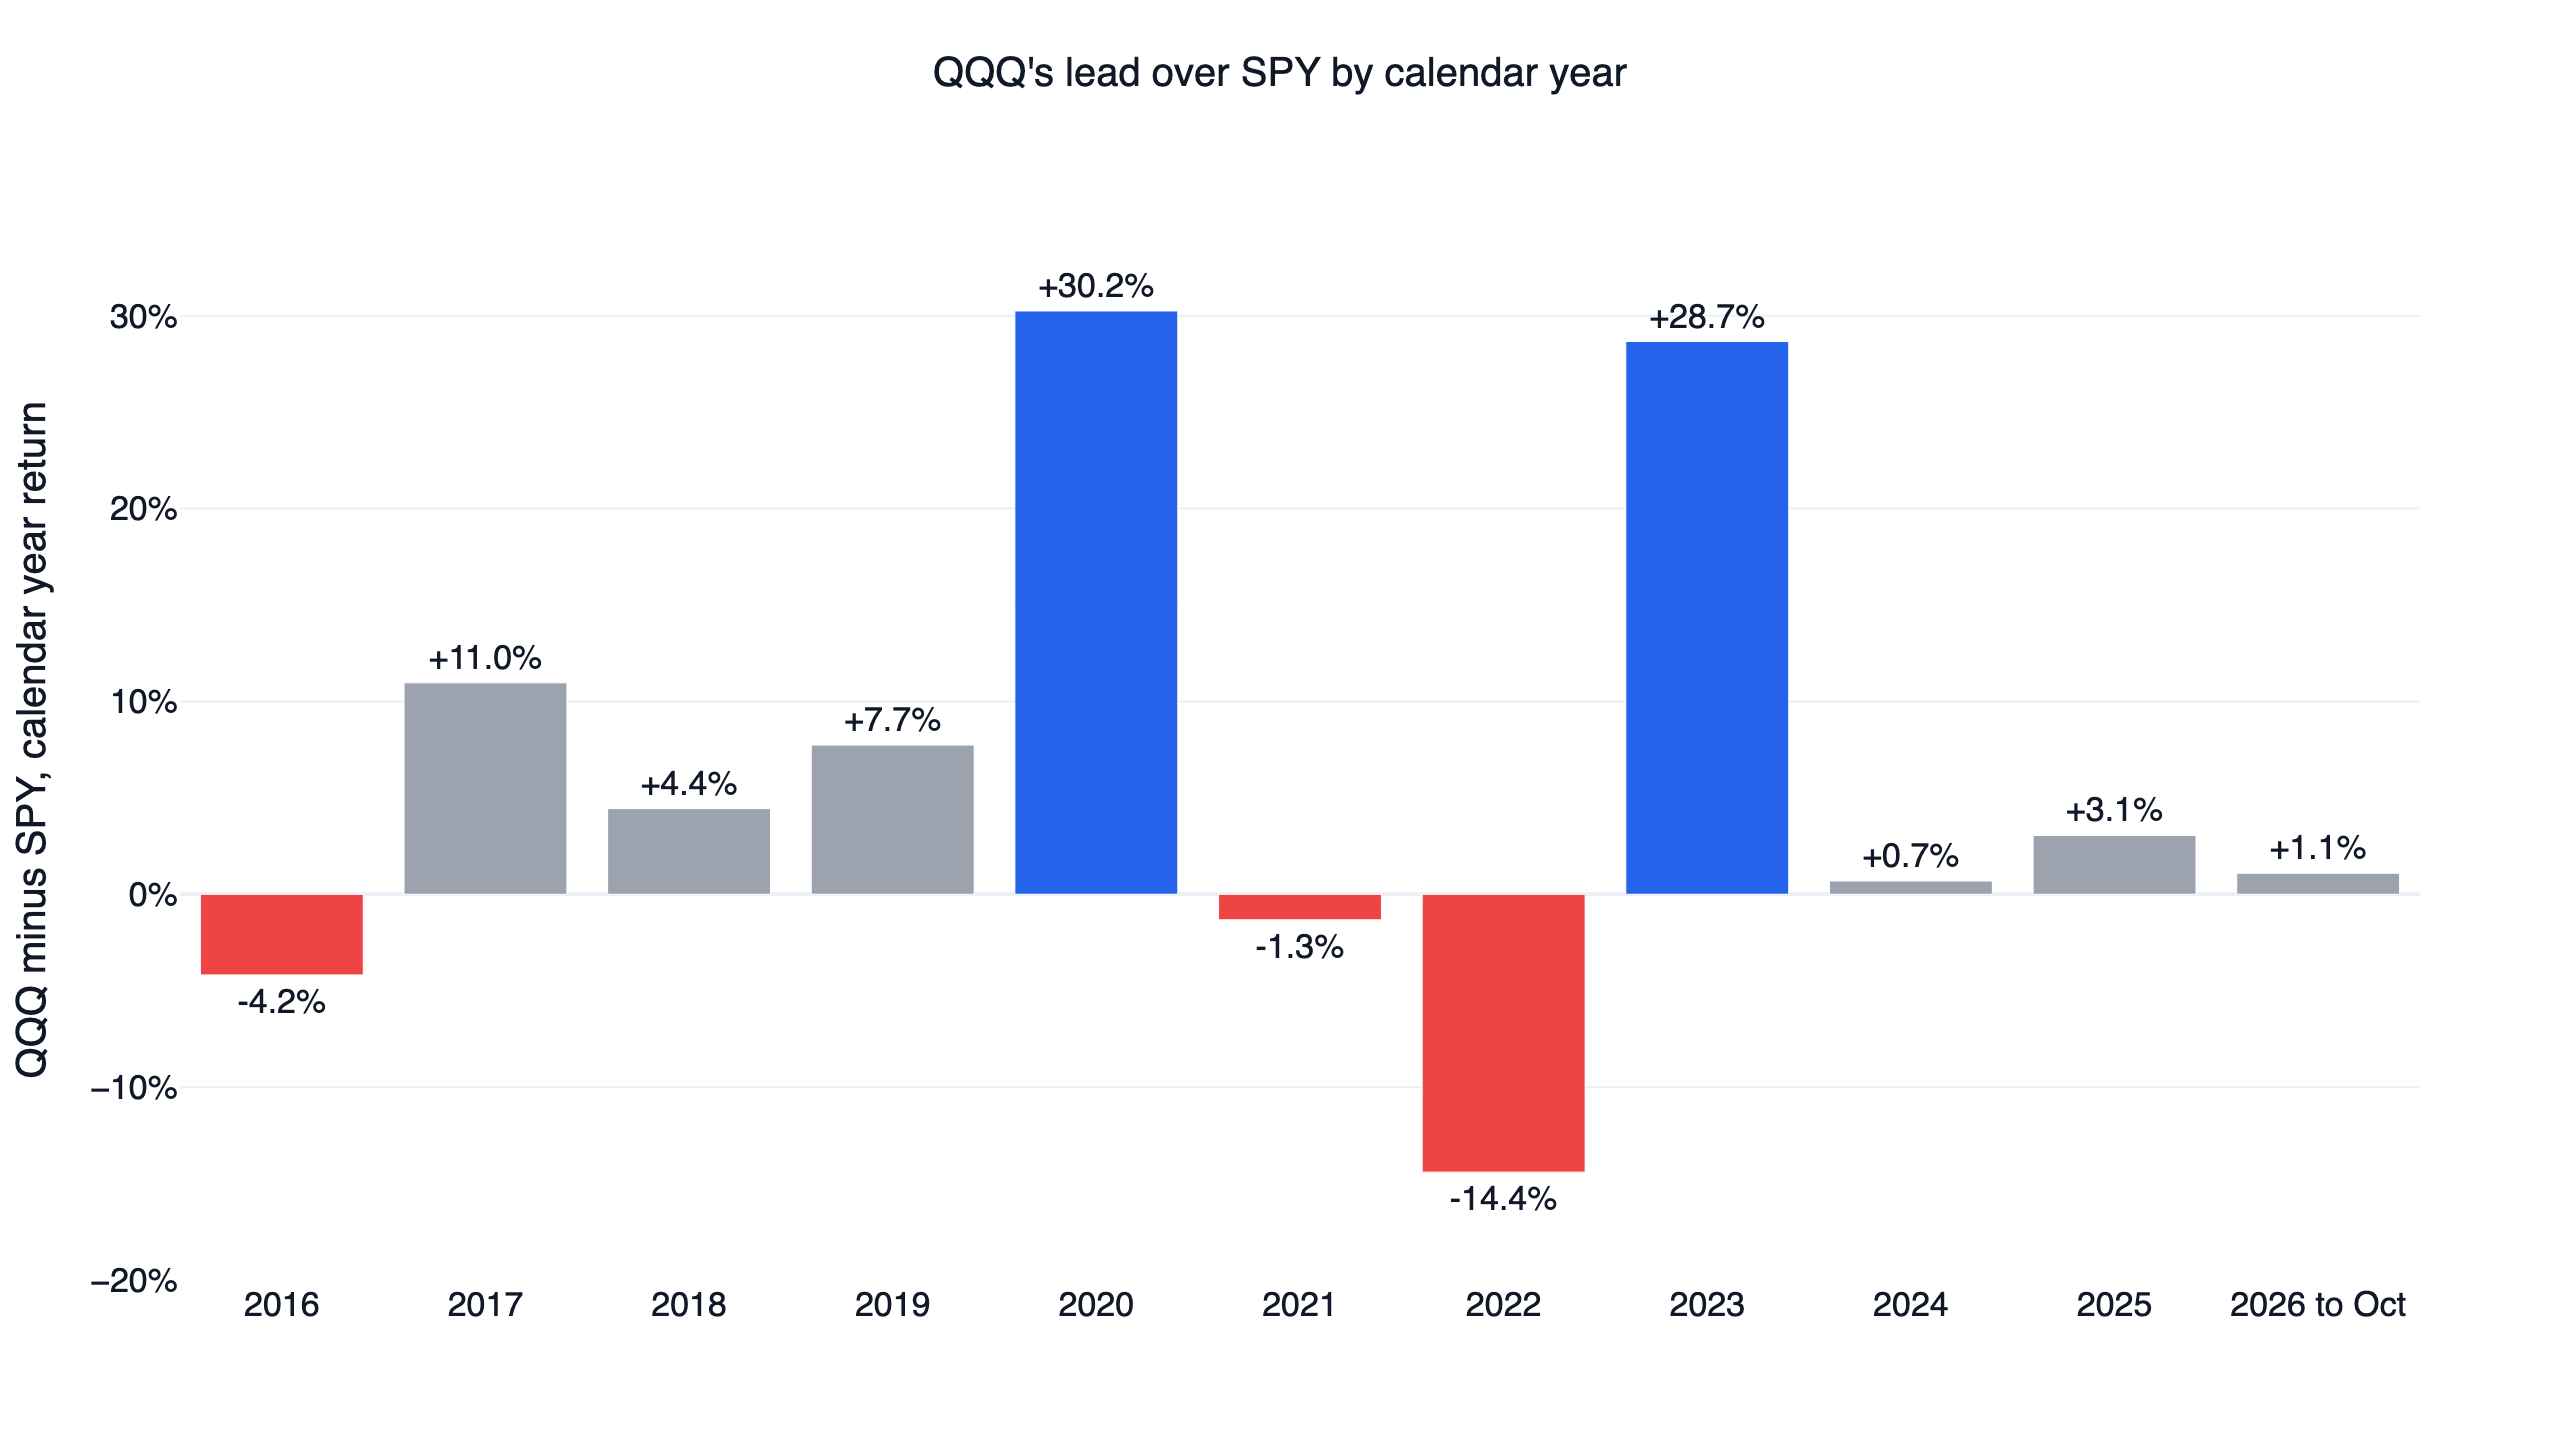
QQQ beat SPY in 8 of 11 calendar years, counting 2026 through October. That looks steady, but the size of the lead was very uneven.
| Year | QQQ | SPY | Gap (points) |
|---|---|---|---|
| 2016 (from the Jan 4 close) | 9.4% | 13.6% | -4.2 |
| 2017 | 32.7% | 21.7% | +11.0 |
| 2018 | -0.1% | -4.6% | +4.4 |
| 2019 | 39.0% | 31.2% | +7.7 |
| 2020 | 48.6% | 18.4% | +30.2 |
| 2021 | 27.4% | 28.7% | -1.3 |
| 2022 | -32.6% | -18.2% | -14.4 |
| 2023 | 54.9% | 26.2% | +28.7 |
| 2024 | 25.6% | 24.9% | +0.7 |
| 2025 | 20.8% | 17.7% | +3.1 |
| 2026 to October | 12.8% | 11.7% | +1.1 |
Without 2020 and 2023, the remaining nine years compound at 13.1% a year for QQQ and 13.3% for SPY. Part of that tie comes from 2022, when QQQ fell 14.4 points behind; QQQ still won 6 of those nine years. Take 2022 out as well and QQQ returned 20.9% a year against 18.1%. The accurate summary is that QQQ won most years by a little, won 2020 and 2023 by a lot and lost 2022 by a lot, and those three years set the final gap. The lead has been small lately: about 5 points in total across 2024, 2025 and the first ten months of 2026.
The risk was not symmetrical either. QQQ's 2022 drawdown reached -35.1% against SPY's -24.5%, and both funds got back to their old highs on the same day, 2023-12-13, nearly two years later. Someone who bought either fund at the end of 2021 waited the same time, and took a noticeably deeper loss in QQQ on the way.
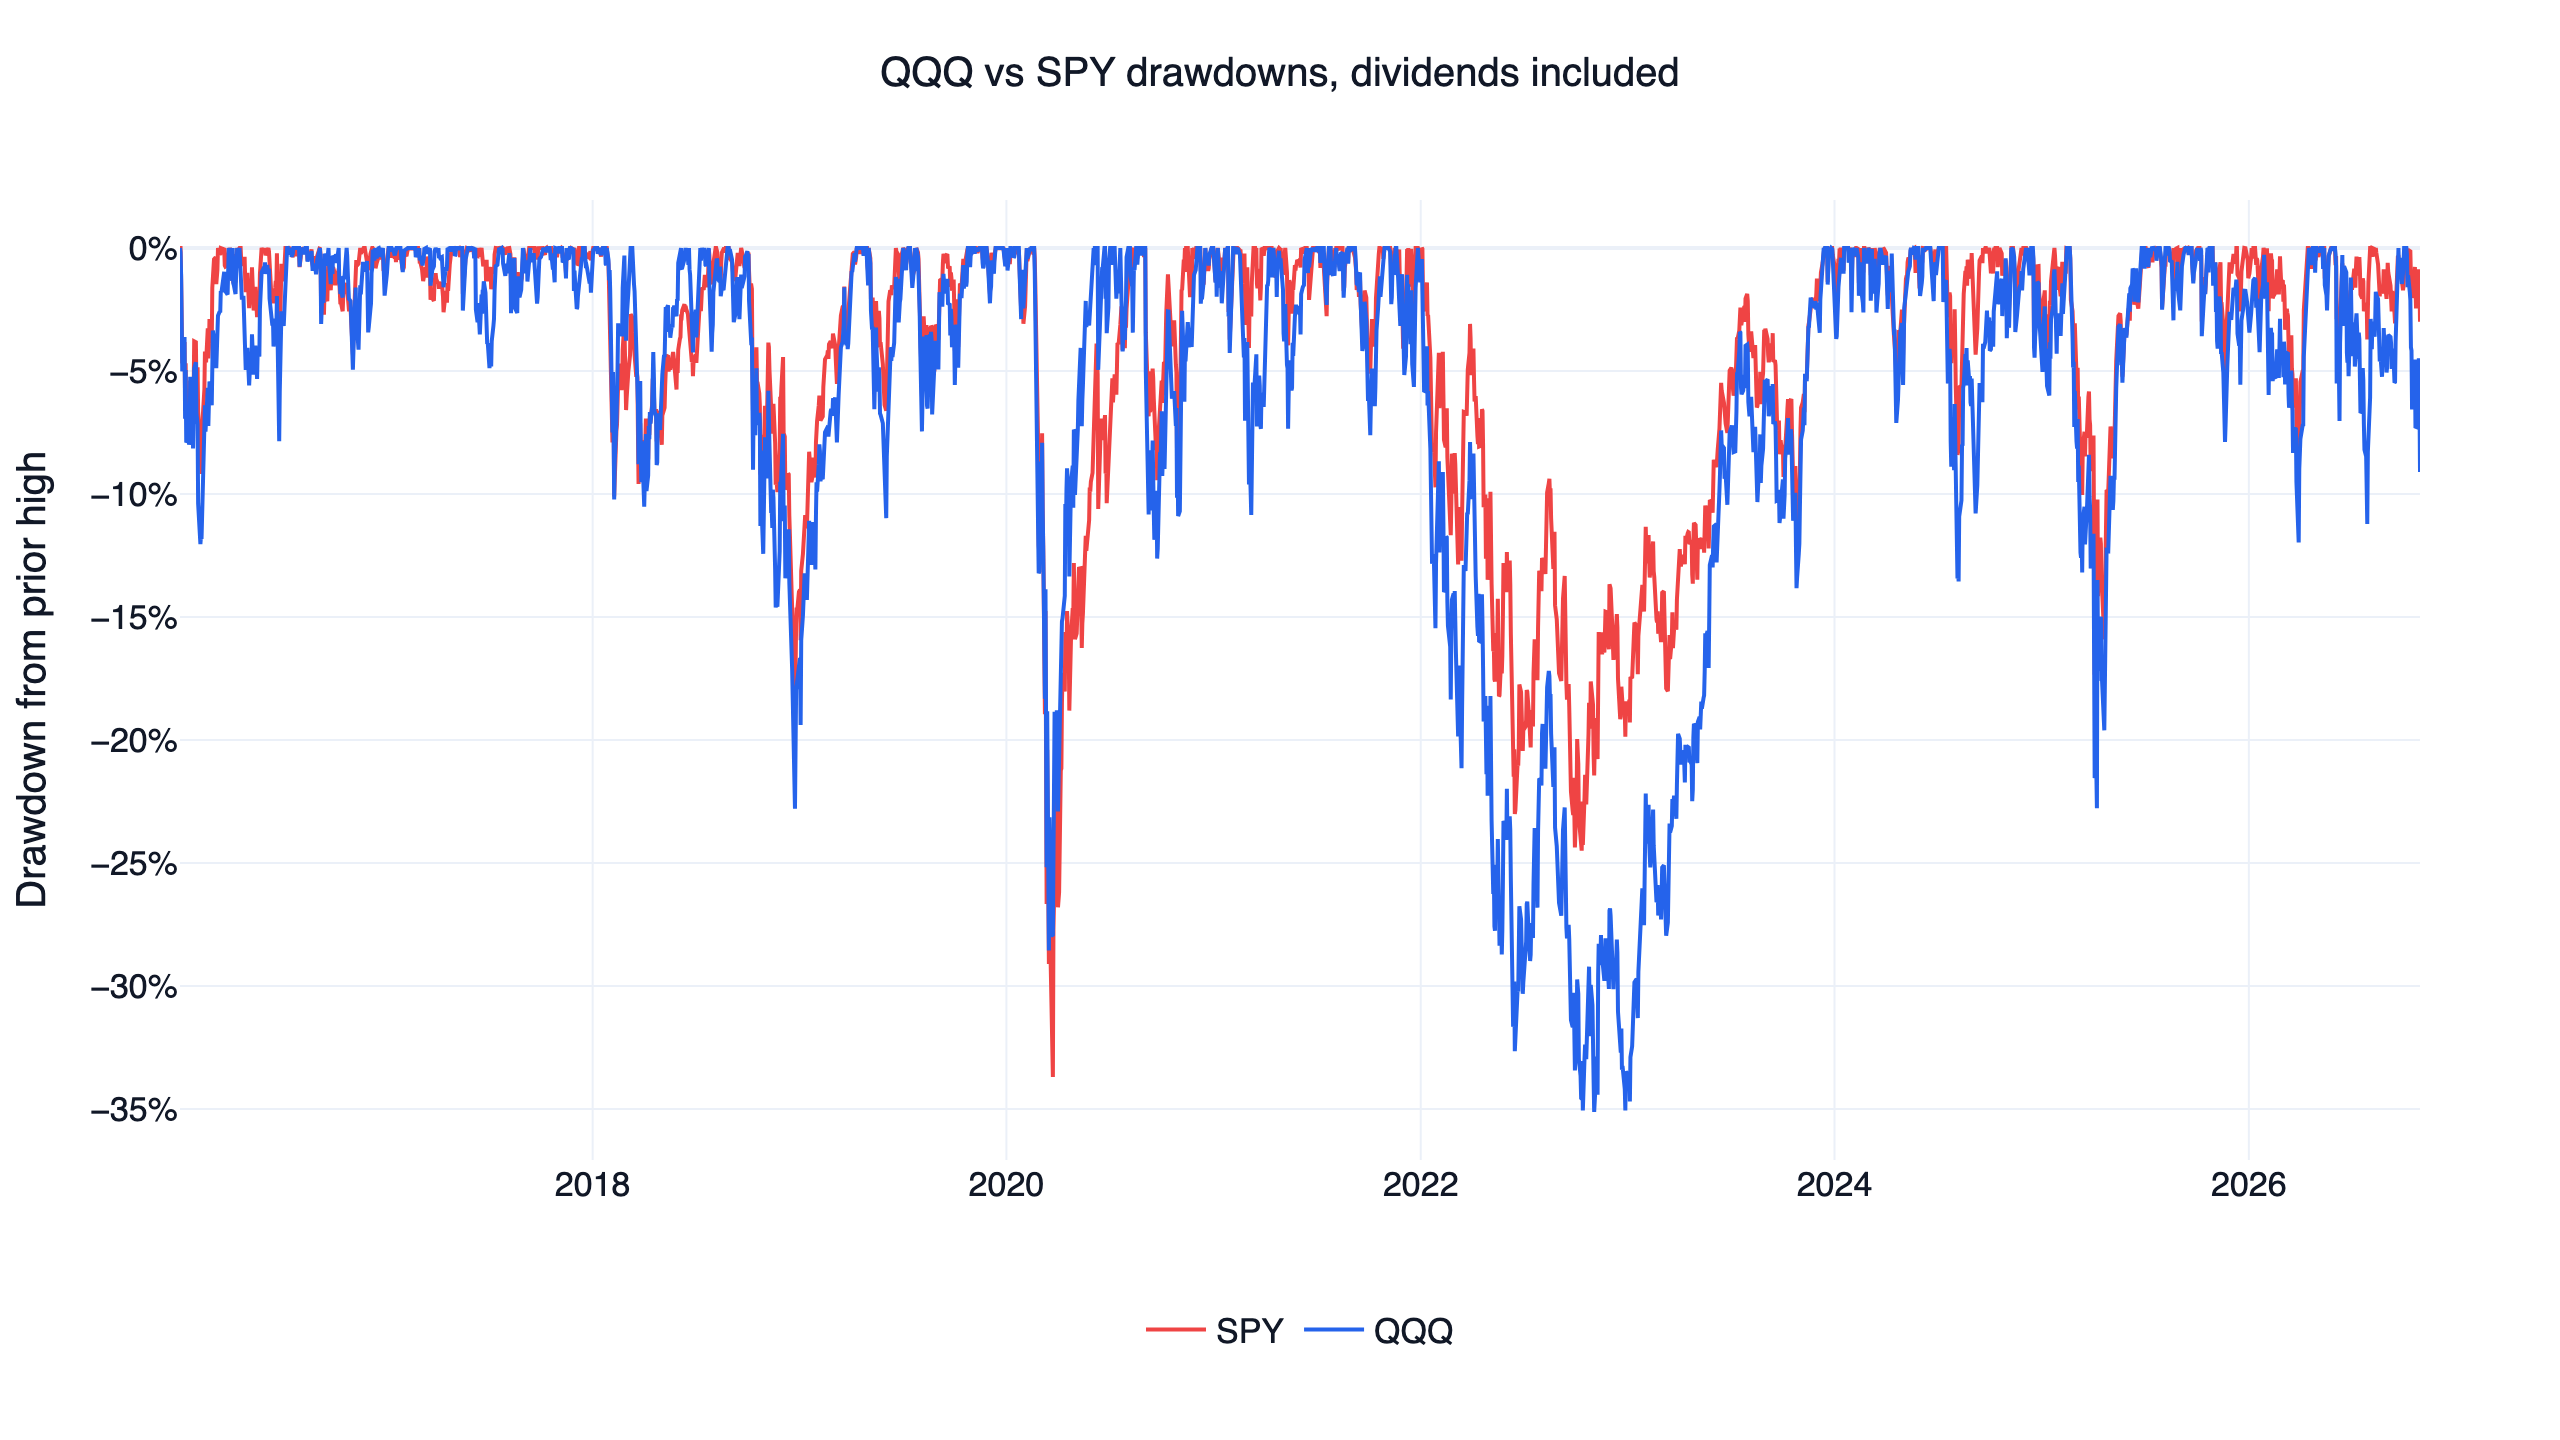
SPY's own maximum drawdown of -33.7% came in February and March 2020, when QQQ fell less. The two full-period drawdowns are close, on different dates, so QQQ does not always fall further. It fell further in 2022.
The biggest limit of this study is the start date. FinLab's fund prices begin in 2016, so the sample has no dot-com bust: the Nasdaq Composite lost more than 75% from its March 2000 peak of 5,048.62 to October 2002. No win rate built on 2016-2026 data includes that scenario.
Concentration and sector mix
FinLab's data has no ETF holdings, so these numbers are estimates from each day's index members (us_index_constituents) and market values (etl:us_market_value), counting a company with two share classes once. They use no float adjustment and ignore the Nasdaq-100's weight adjustments, so read them for direction and not as exact weights. At the end of 2016 only 456 of 505 member tickers have market value data; most of the missing ones were later acquired, so the early top 10 share is slightly high.
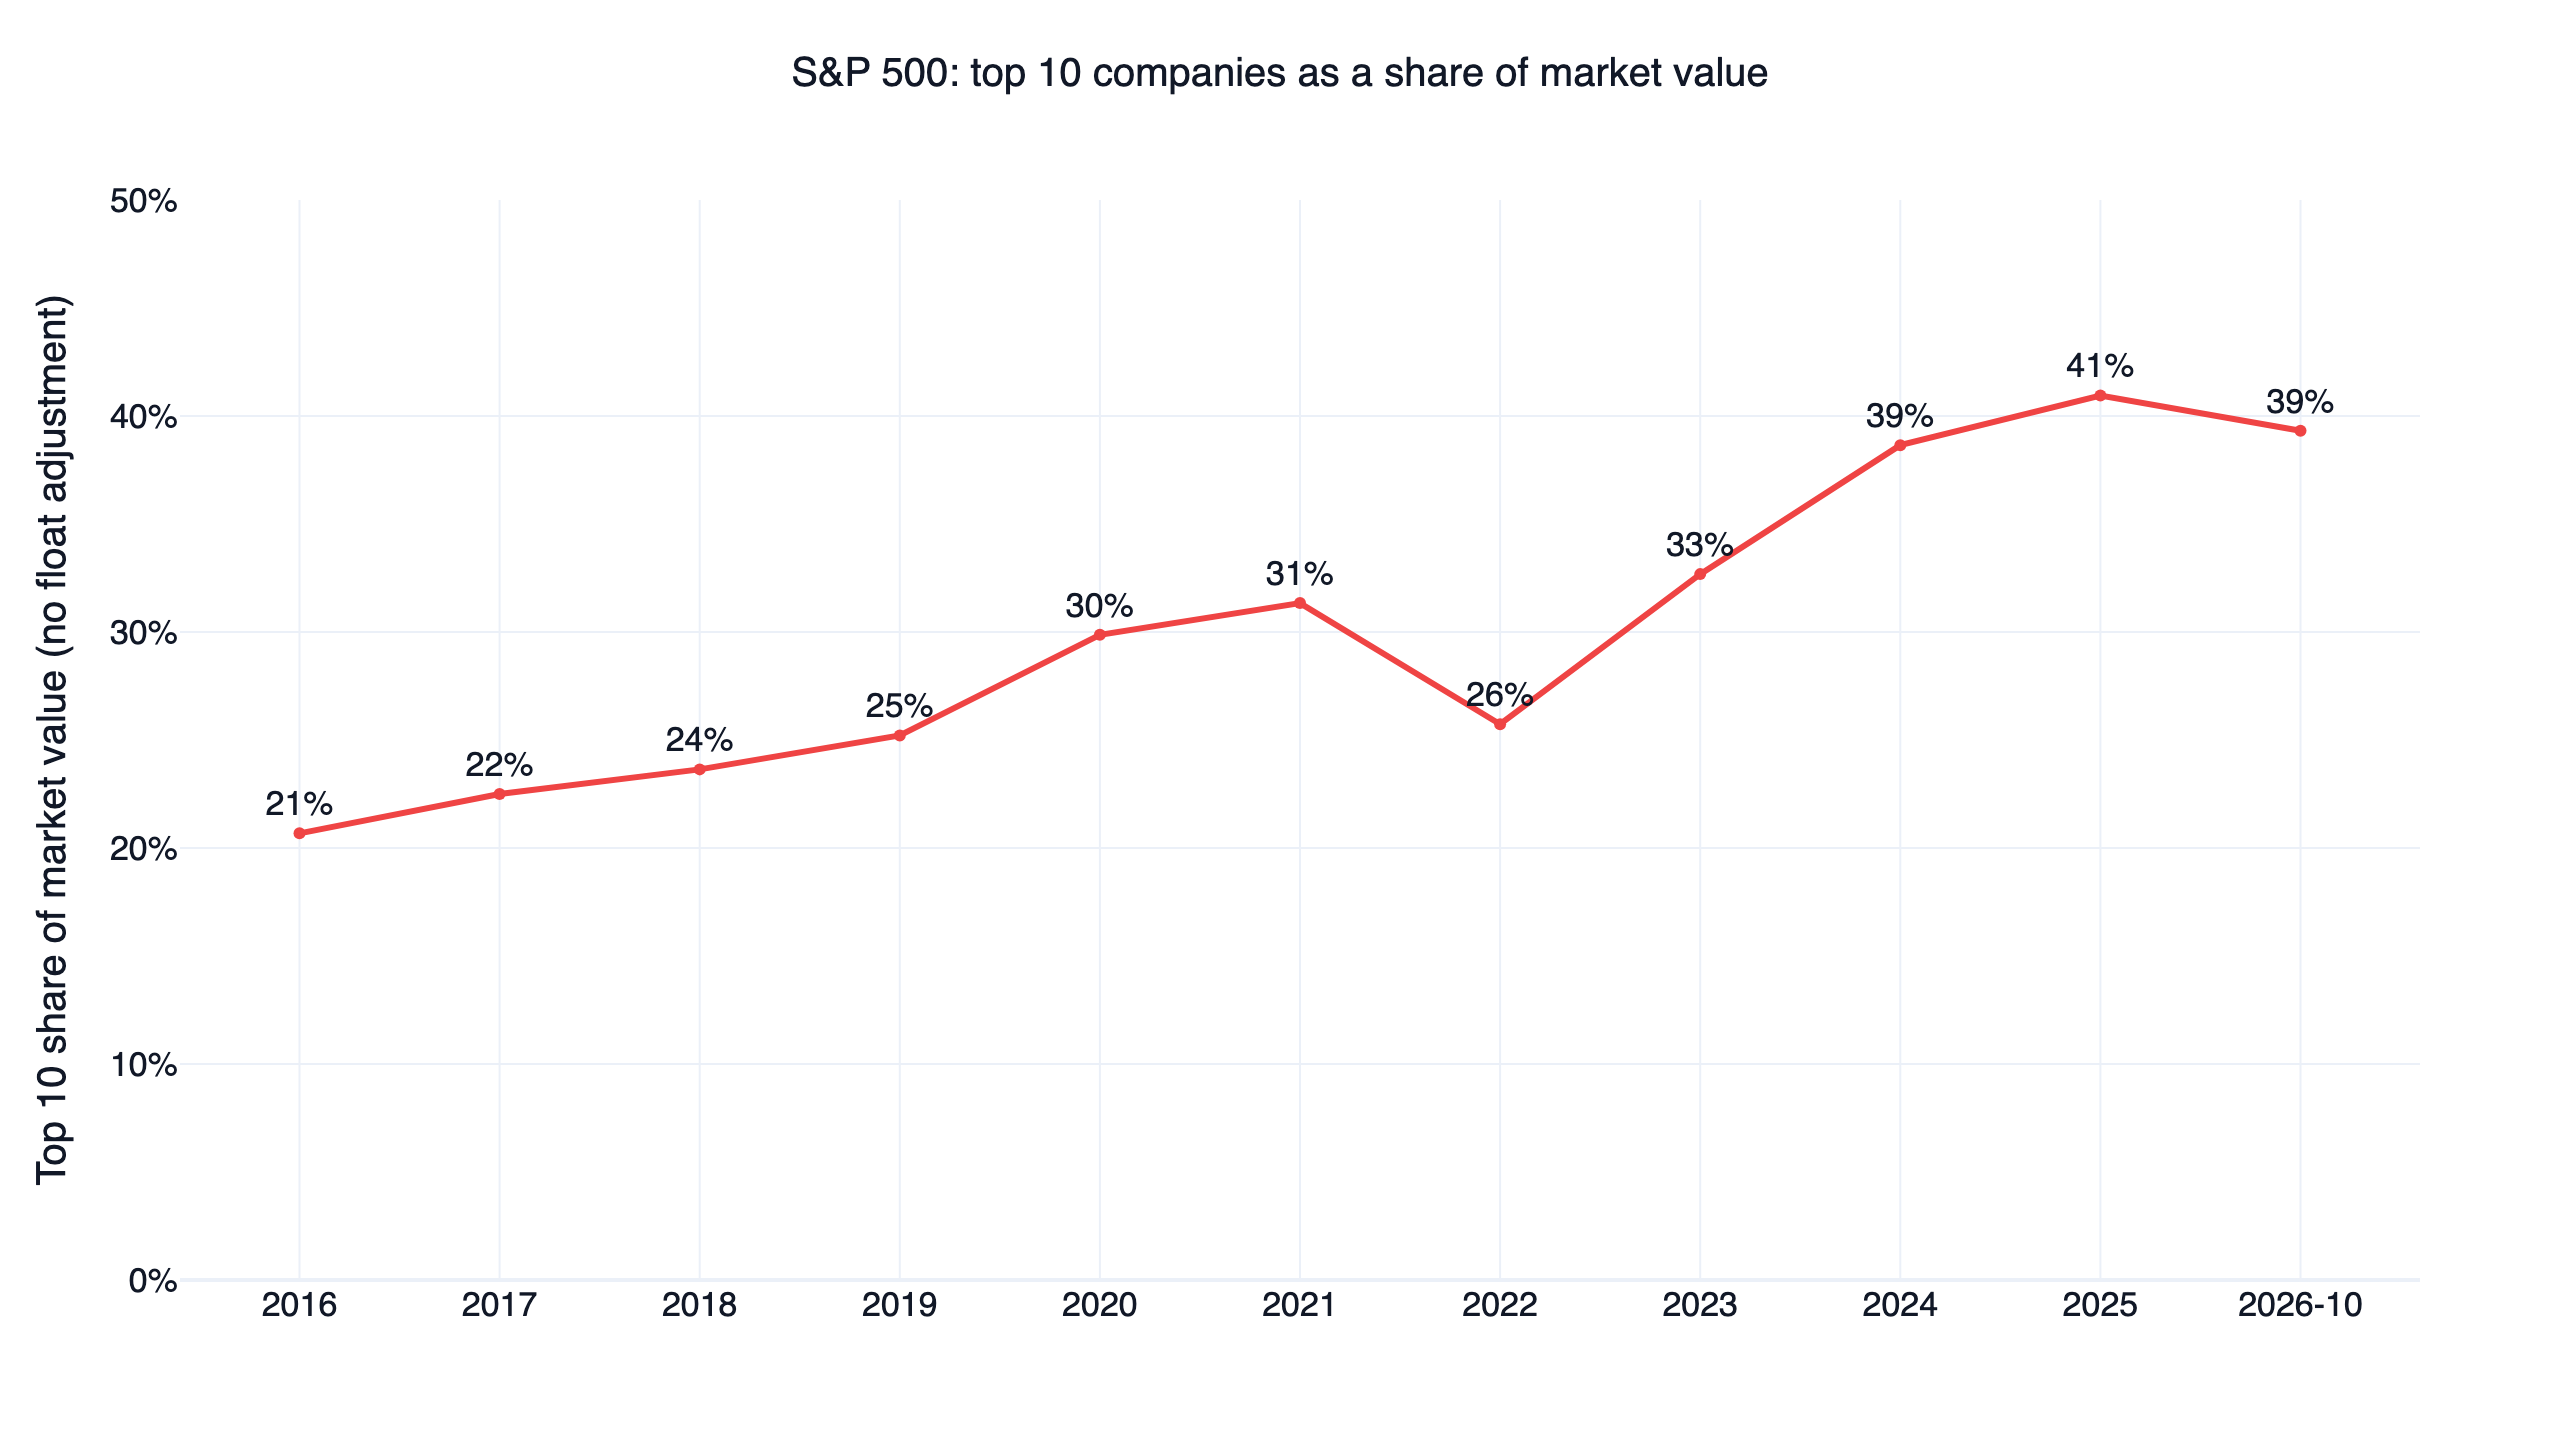
- The S&P 500 has concentrated too. The top 10 companies went from 21% of index market value at the end of 2016 to 39% in October 2026.
- QQQ's weights are adjusted. In QQQ's semi-annual report for March 31, 2026, the ten largest holding lines add up to 46.8% of net assets, with Alphabet's two share classes listed separately. Pure market value, counting Alphabet once, would put the Nasdaq-100's top 10 at 69.8% that day; most of the difference comes from the index's weight adjustments. The same-day S&P 500 estimate is 38.2%.
- The overlap is large. At the end of October 2026, 85 of the 100 Nasdaq-100 companies were also in the S&P 500, and those 85 were about 53% of S&P 500 market value. Someone holding both QQQ and VOO owns the same largest companies twice.
- VOO and VTI are nearly the same fund. The S&P 500 is about 84% of the market value of US common stocks, so VTI's extra names carry little weight.
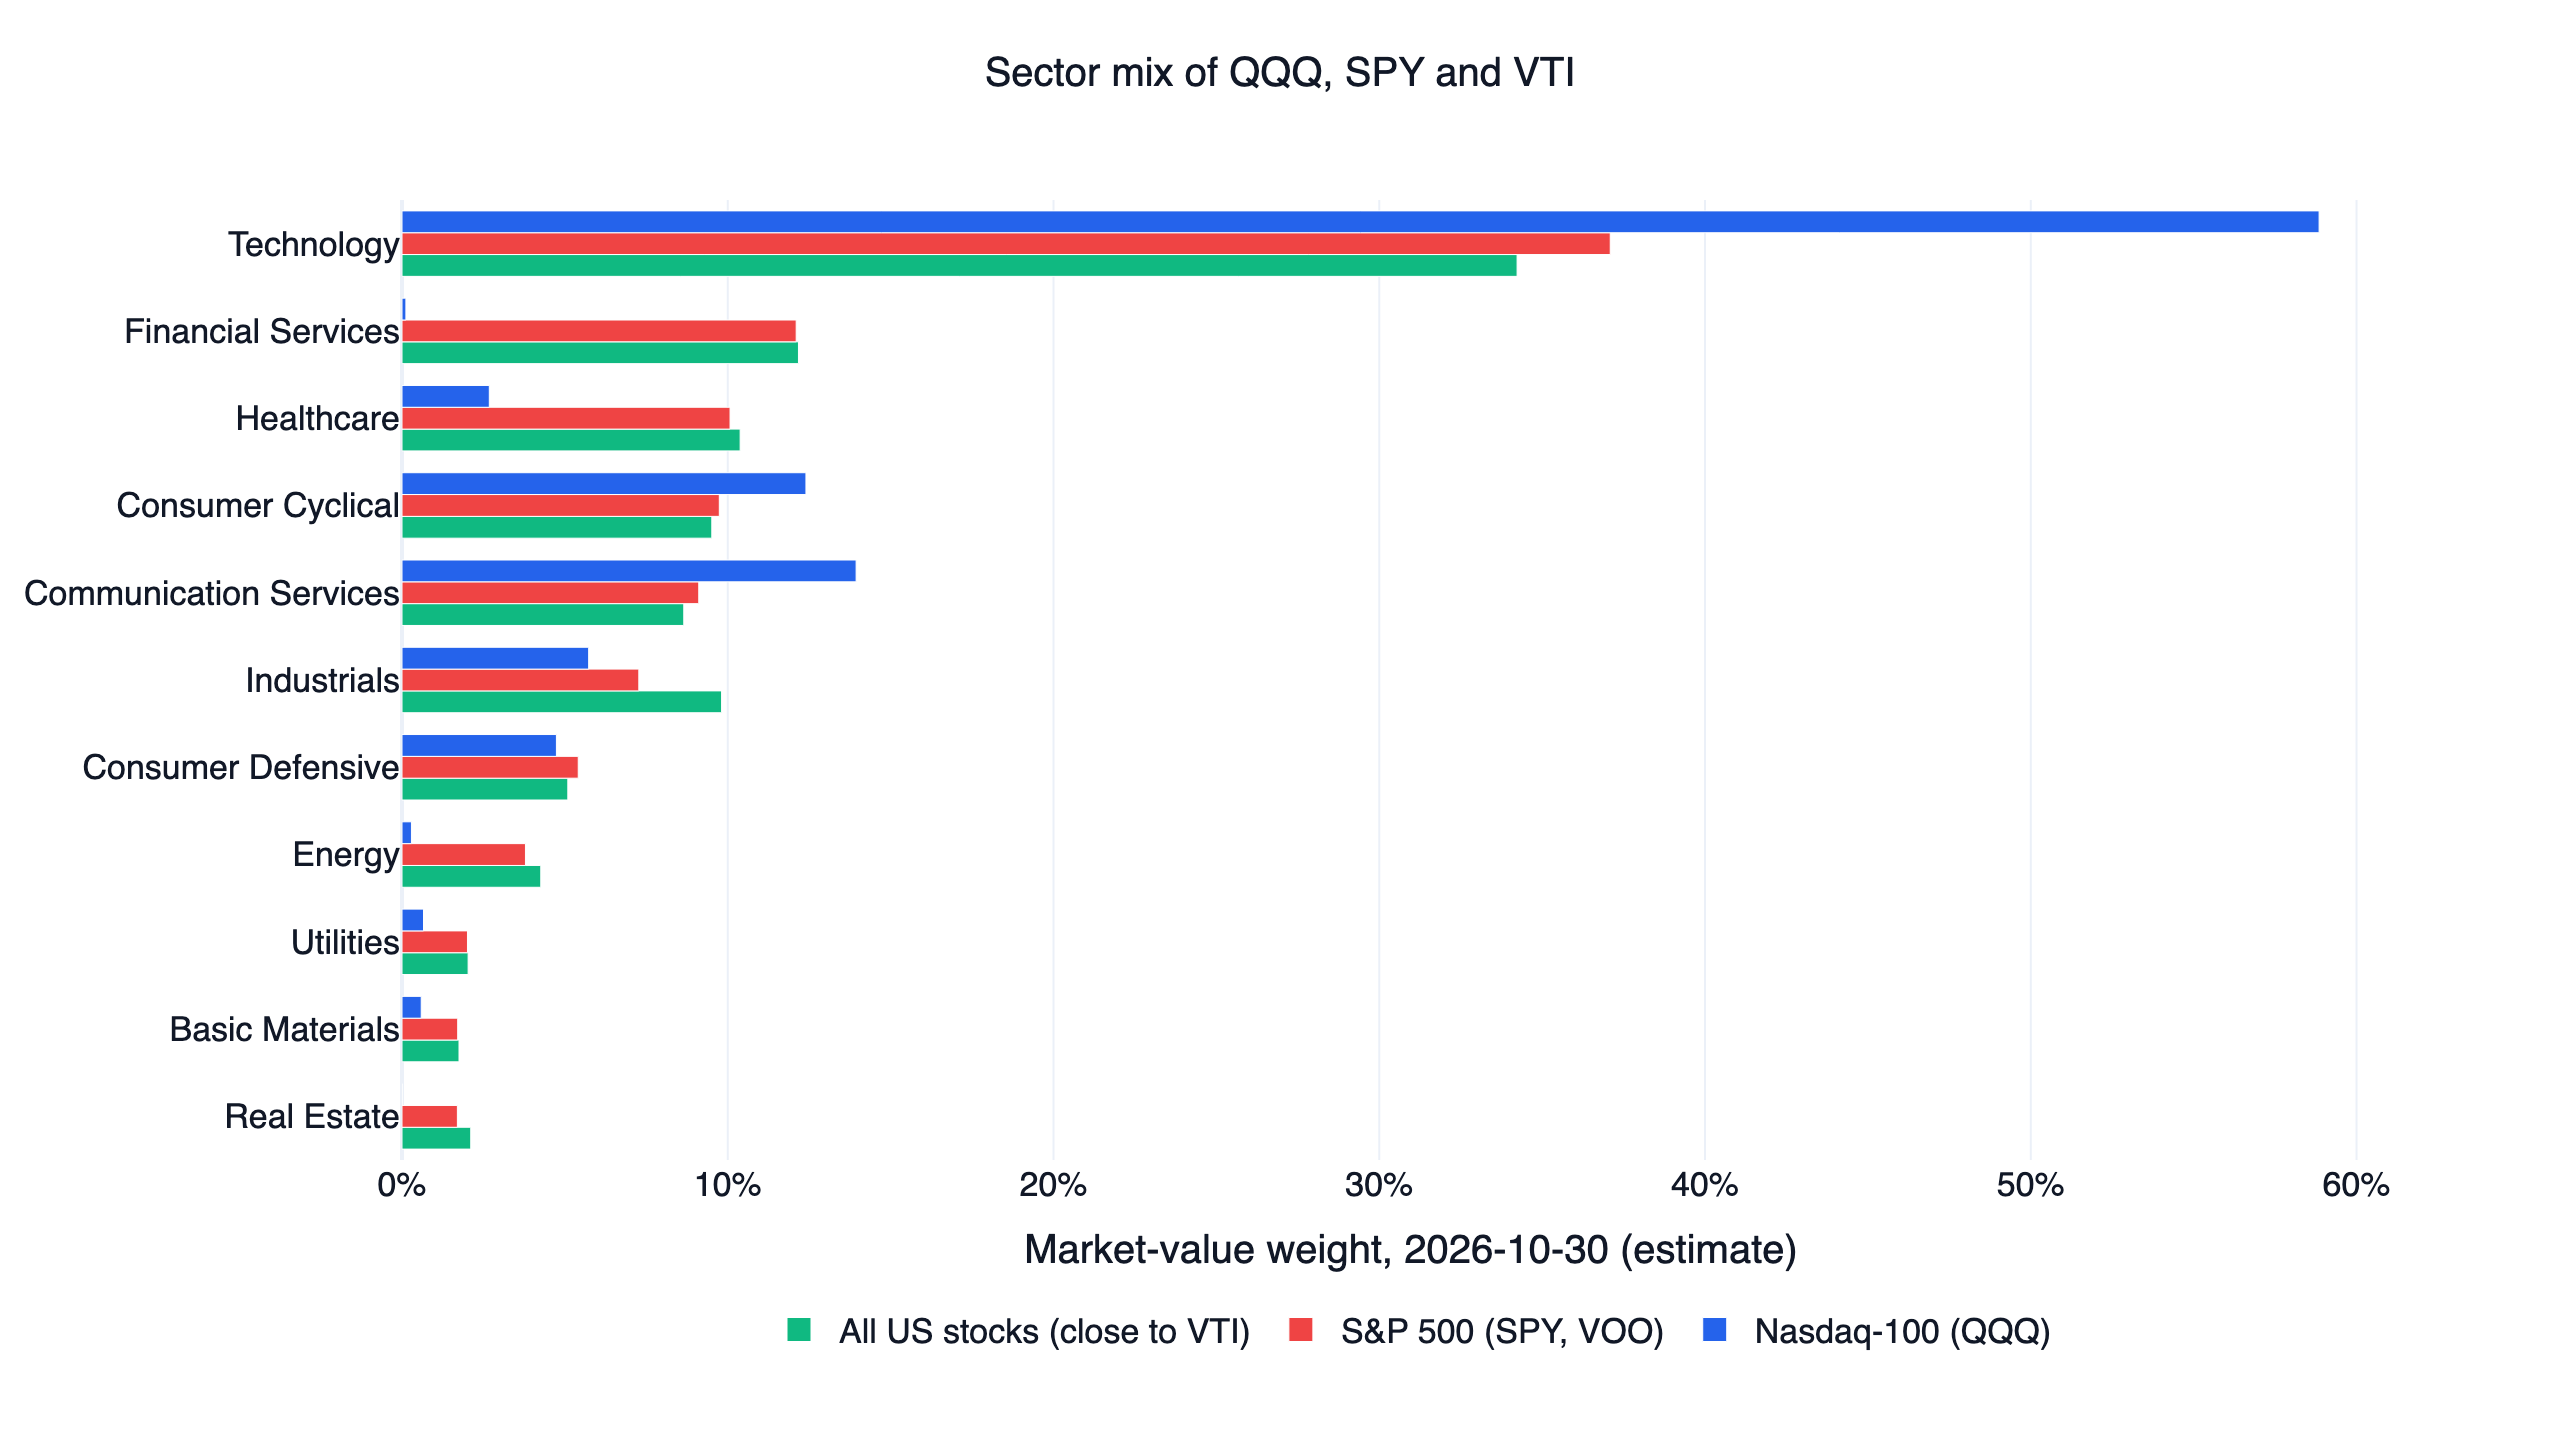
Sector mix is the main difference between QQQ and SPY. By market value, the Nasdaq-100 was 58.9% technology and 13.9% communication services, with 0.1% in financials and 0.3% in energy. The S&P 500 was 37.1% technology, 12.1% financials and 10.1% health care. The fund's actual weights and categories differ: in its March 2026 report, semiconductors, software, hardware, communications equipment and IT services total about 50% of net assets. The Nasdaq-100 excludes financial companies by rule, so QQQ holds large caps without banks and insurers. Bessembinder (2018) found that US stock market wealth creation came from a small number of companies. A concentrated holding leads only if it happens to own those companies.
5 switching rules, fixed before we ran them
QQQ won in rallies and lost in 2022, so the natural question is whether an investor could hold QQQ most of the time and step aside when it weakens. Before looking at any result we fixed these five rules and their nine settings each:
| Rule | Definition | Settings (original in bold) |
|---|---|---|
| Relative strength | Hold whichever of QQQ / SPY has the higher L-month return | L 9/12/15 months × check weekly/monthly/quarterly |
| Trend to SPY | QQQ while it closes above its L-day average, otherwise SPY | L 150/200/250 days × weekly/monthly/quarterly |
| Trend to BIL | QQQ while it closes above its L-day average, otherwise the T-bill ETF BIL | as above |
| Dual momentum (combination) | The relative strength pick, if its return also beats BIL over the same months, otherwise BIL | L 9/12/15 months × weekly/monthly/quarterly |
| Trend cascade (combination) | QQQ above its average, else SPY above its own average, else BIL | L 150/200/250 days × weekly/monthly/quarterly |
These rules come from the momentum and trend literature. Brock, Lakonishok and LeBaron (1992) tested moving average rules, Faber (2007) timed asset classes with a 10-month average, Moskowitz, Ooi and Pedersen (2012) documented the persistence of 12-month returns, and Antonacci (2012) combined relative and absolute momentum into dual momentum.
The window is 2017-04-28 to 2026-10-30 because the longest look-back is 15 months. Signals are read at a close and traded at the next close, using finlab sim on dividend-adjusted fund prices. "Beats QQQ" means a higher daily Sharpe than QQQ over the same dates. A rule had to pass all of these:
- Neighbouring settings: at least 7 of 9 settings beat QQQ.
- Both halves: the original setting beats QQQ in each half of the window.
- Costs: the original beats QQQ at finlab's default US cost (zero) and at 0.1% per side.
- Fixed weights: the original beats the same funds held at its average weights, rebalanced monthly.
- Best year removed: the original still beats QQQ without the year of its largest lead.
- Cash holders: Trend to BIL, dual momentum and the cascade must also beat QQQ on returns above T-bills, because a Sharpe with no risk-free rate flatters anything parked in short bills.
- Combinations: each must have a higher Sharpe than both single rules it combines.
Results: no switching rule passed
| Rule (original) | Daily Sharpe | CAGR | Max drawdown | Settings beating QQQ | First / second half | At 0.1% per side | Without 2022 | Verdict |
|---|---|---|---|---|---|---|---|---|
| Relative strength, 12 months | 0.95 | 19.9% | -28.6% | 4 / 9 | 1.02 / 0.88 | 0.94 | 1.17 | Fails |
| Trend to SPY, 200 days | 0.93 | 19.5% | -28.6% | 4 / 9 | 1.00 / 0.86 | 0.92 | 1.18 | Fails |
| Trend to BIL, 200 days | 0.93 | 16.9% | -28.6% | 3 / 9 | 0.88 / 1.01 | 0.92 | 1.03 | Fails |
| Dual momentum, 12 months | 0.89 | 17.4% | -28.6% | 1 / 9 | 0.92 / 0.88 | 0.88 | 1.04 | Fails |
| Trend cascade, 200 days | 0.74 | 13.1% | -28.6% | 0 / 9 | 0.77 / 0.71 | 0.72 | 0.96 | Fails |
| QQQ buy and hold | 0.88 | 19.4% | -35.1% | benchmark | 0.98 / 0.78 | 0.89 | 1.23 | |
| SPY buy and hold | 0.84 | 14.7% | -33.7% |
The first half runs from May 2017 to January 2022 and the second from January 2022 to October 2026. QQQ is held over the same dates as each rule: the quarterly settings fill their first trade later, so their QQQ comparison is 0.895, and the 0.1% reruns start one trading day earlier, so theirs is 0.89 with no cost taken from QQQ.
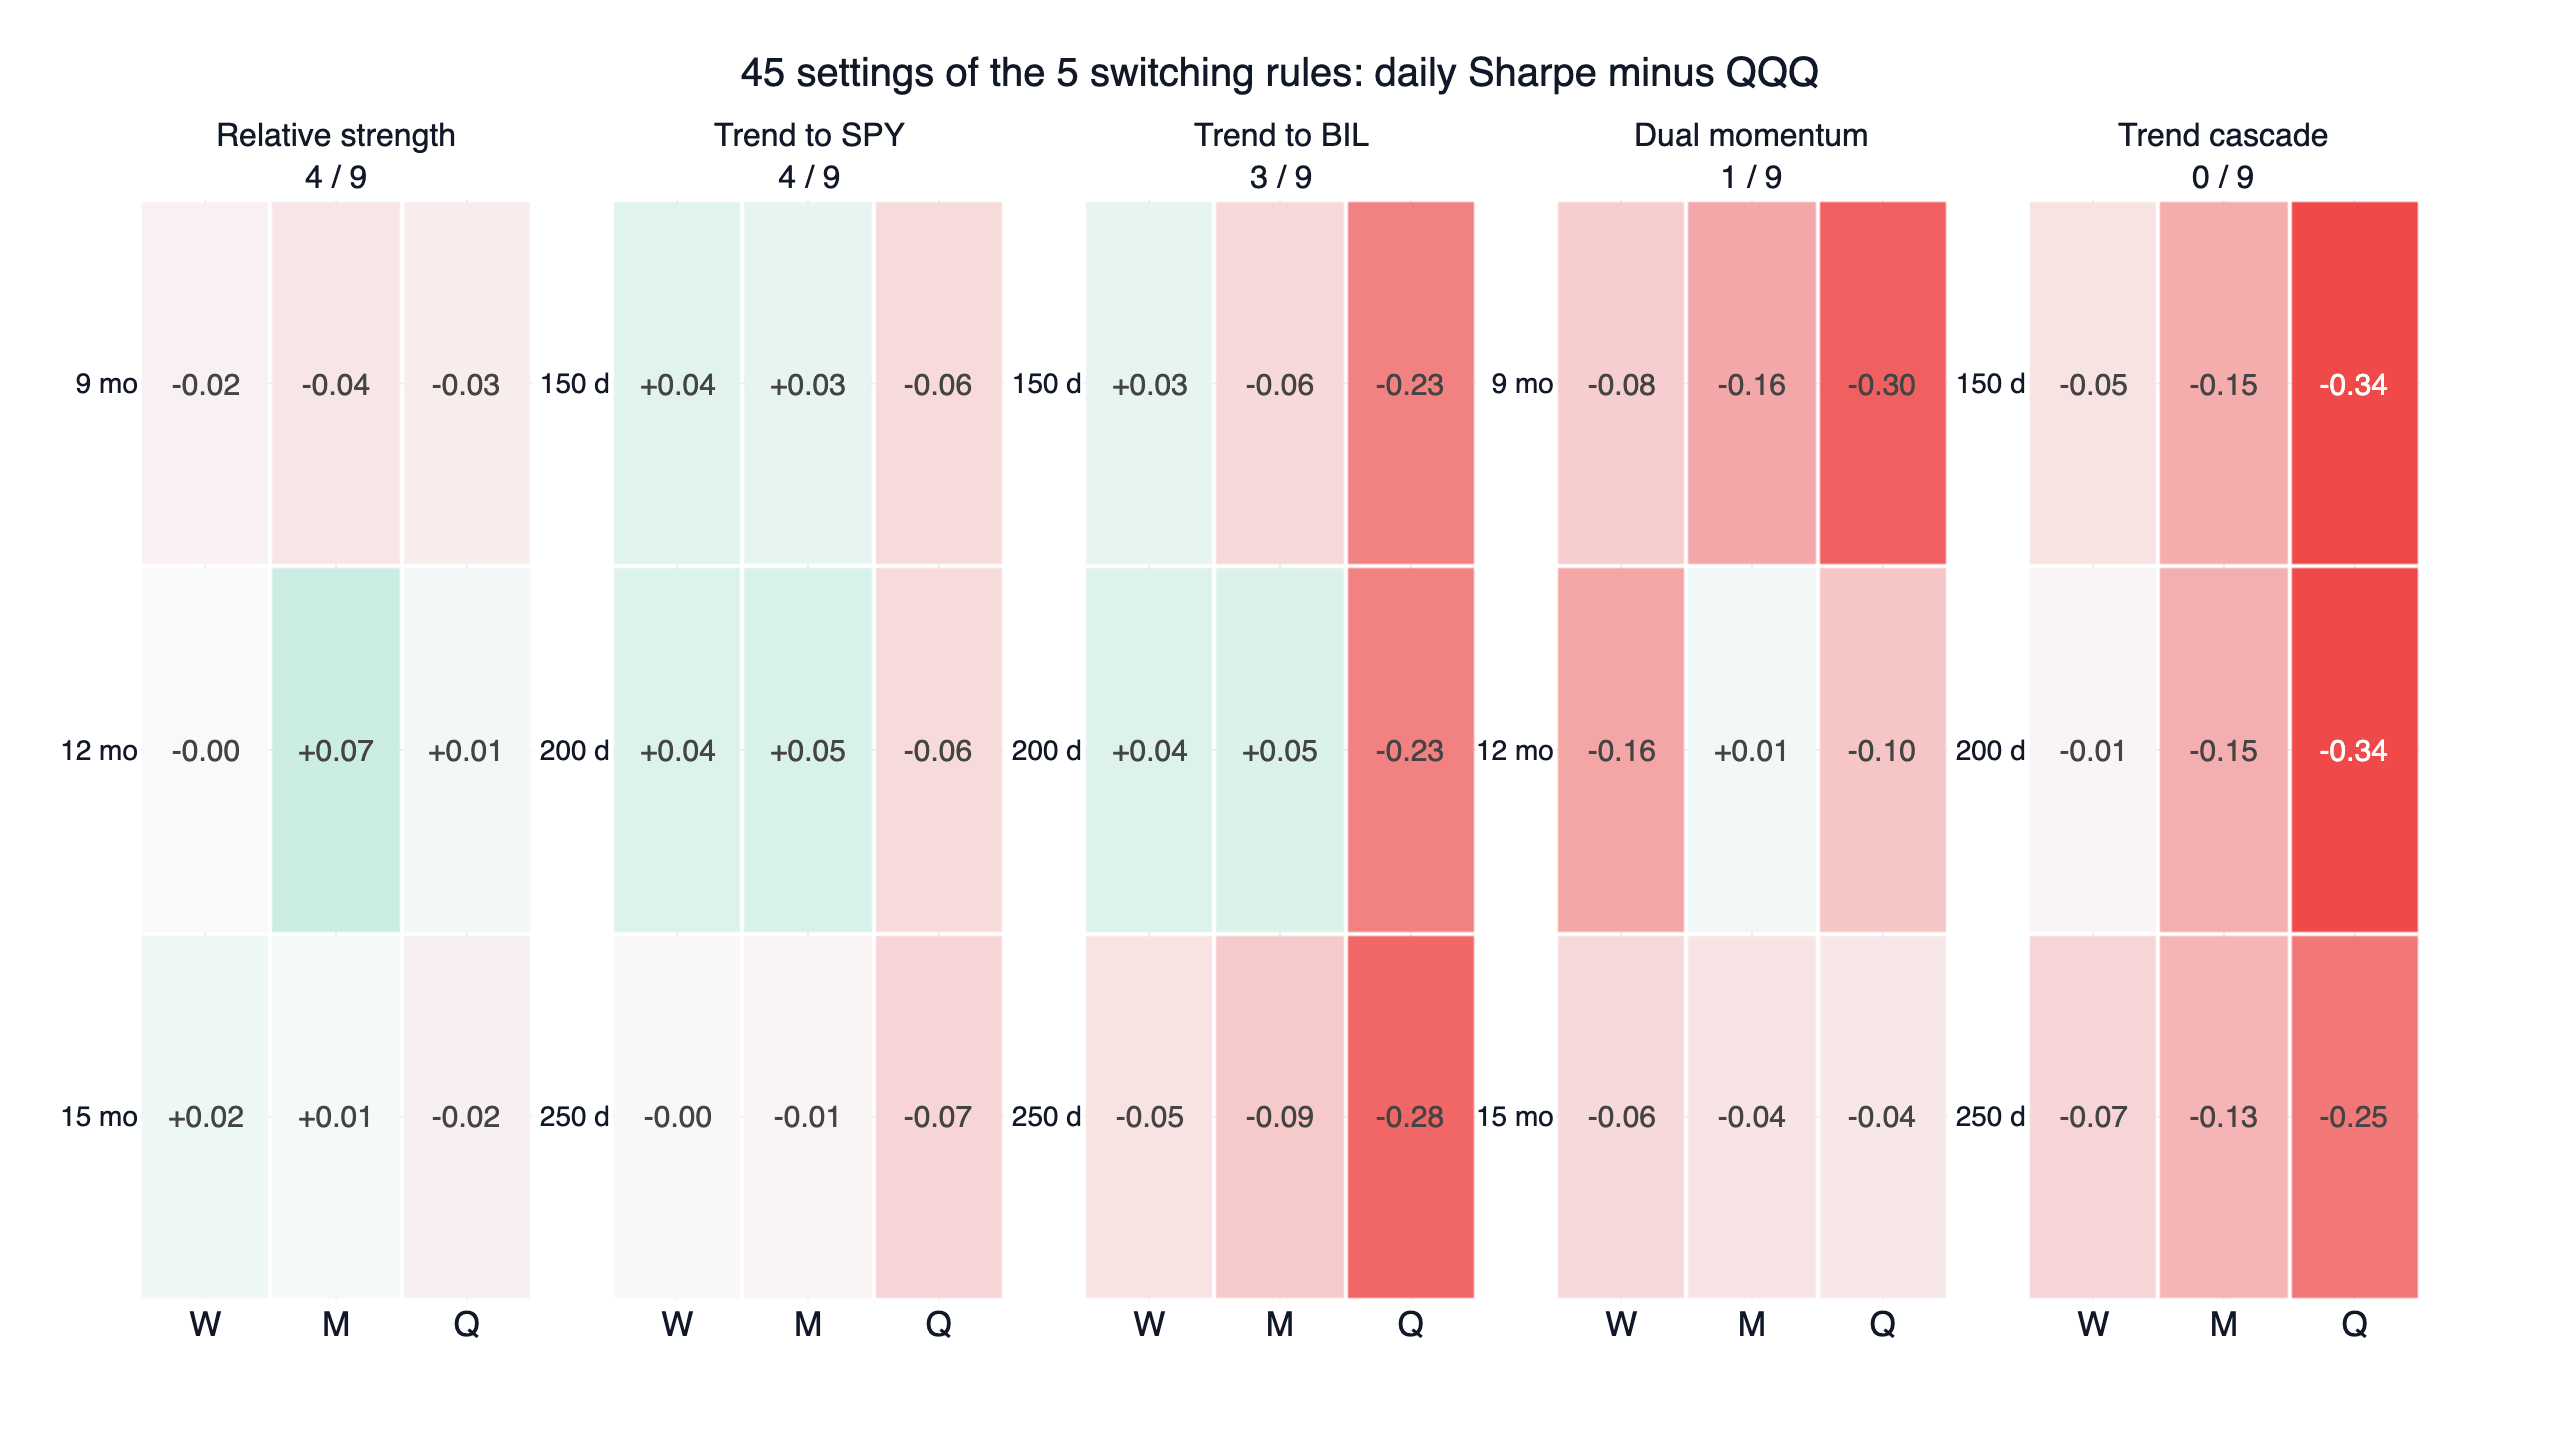
Relative strength looks best but is a single point. Twelve months checked monthly scored 0.95 with 19.9% a year, and passed both halves, the costs and the fixed-weight control. Check it weekly and it drops to 0.88; use 9 months checked monthly and it scores 0.84; use 15 months and 0.89. Only 4 of 9 settings won, so there is no plateau. Harvey, Liu and Zhu (2016) warn that the more tests you run, the more likely something looks significant by chance; 12 winners out of 45 is not evidence that a rule works.
Trend to SPY only works at 150 to 200 days with a weekly or monthly check. Those four settings won, and all of the 250-day and quarterly ones lost. Quarterly checks did worst, at 0.82 to 0.84, because the rule sees the market only four times a year.
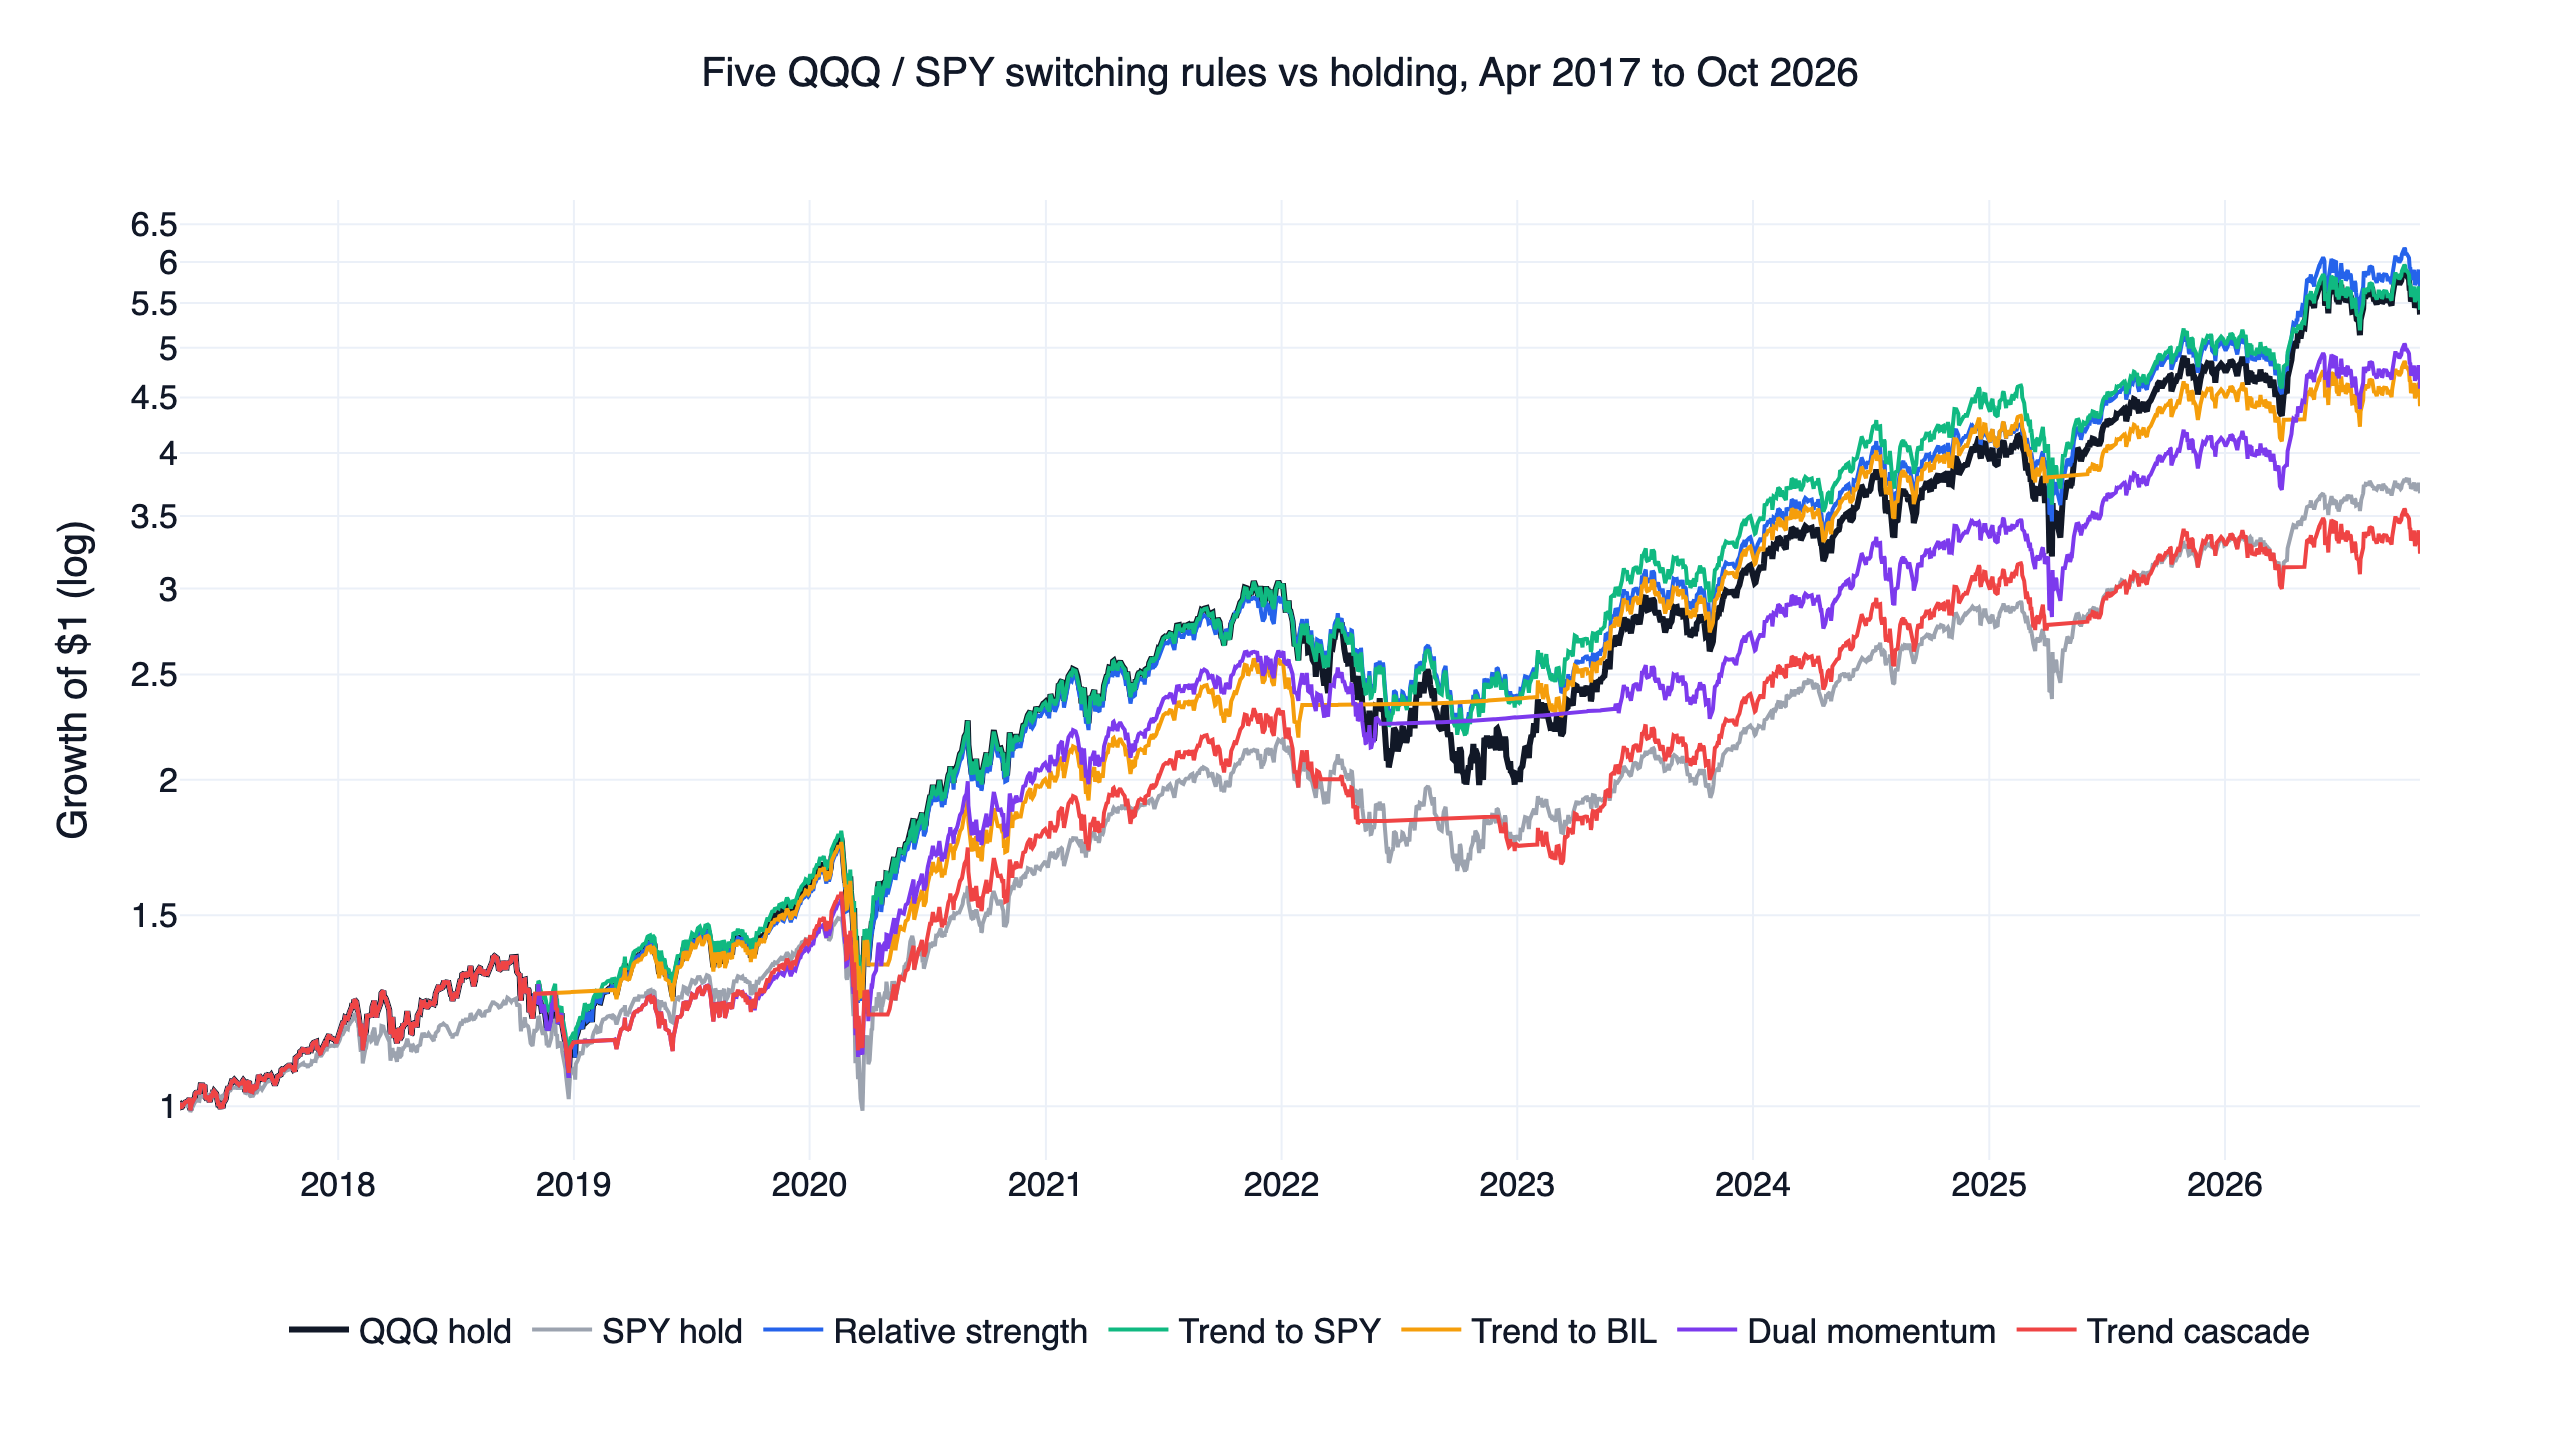
Trend to BIL gives up return. It earned 16.9% a year, 2.4 points less than QQQ. Its first half lost to QQQ (0.88 against 0.98) because part of the rebound from late 2018 through 2020 was spent in BIL.
The combinations did not improve anything. Dual momentum won in 1 of 9 settings, fell behind QQQ at 0.1% per side, and did not beat QQQ above T-bills (0.77 against 0.78). The cascade won in none. The extra filter added switches: 13 and 17 in nine and a half years, against 10 for the single rules.
A monthly check cannot catch a one-month crash. All five rules share a maximum drawdown of -28.6%, from February to March 2020. The fall was over before the month-end check, so every rule was still in QQQ.
The edge came from 2022
All five rules had their largest lead over QQQ in 2022. QQQ lost 32.6% that year, while Trend to BIL lost 6.8%, dual momentum 12.0% and relative strength 17.9%. Recompute daily Sharpe without 2022 and QQQ scores 1.23, against 0.96 to 1.18 for the rules. All five trail.
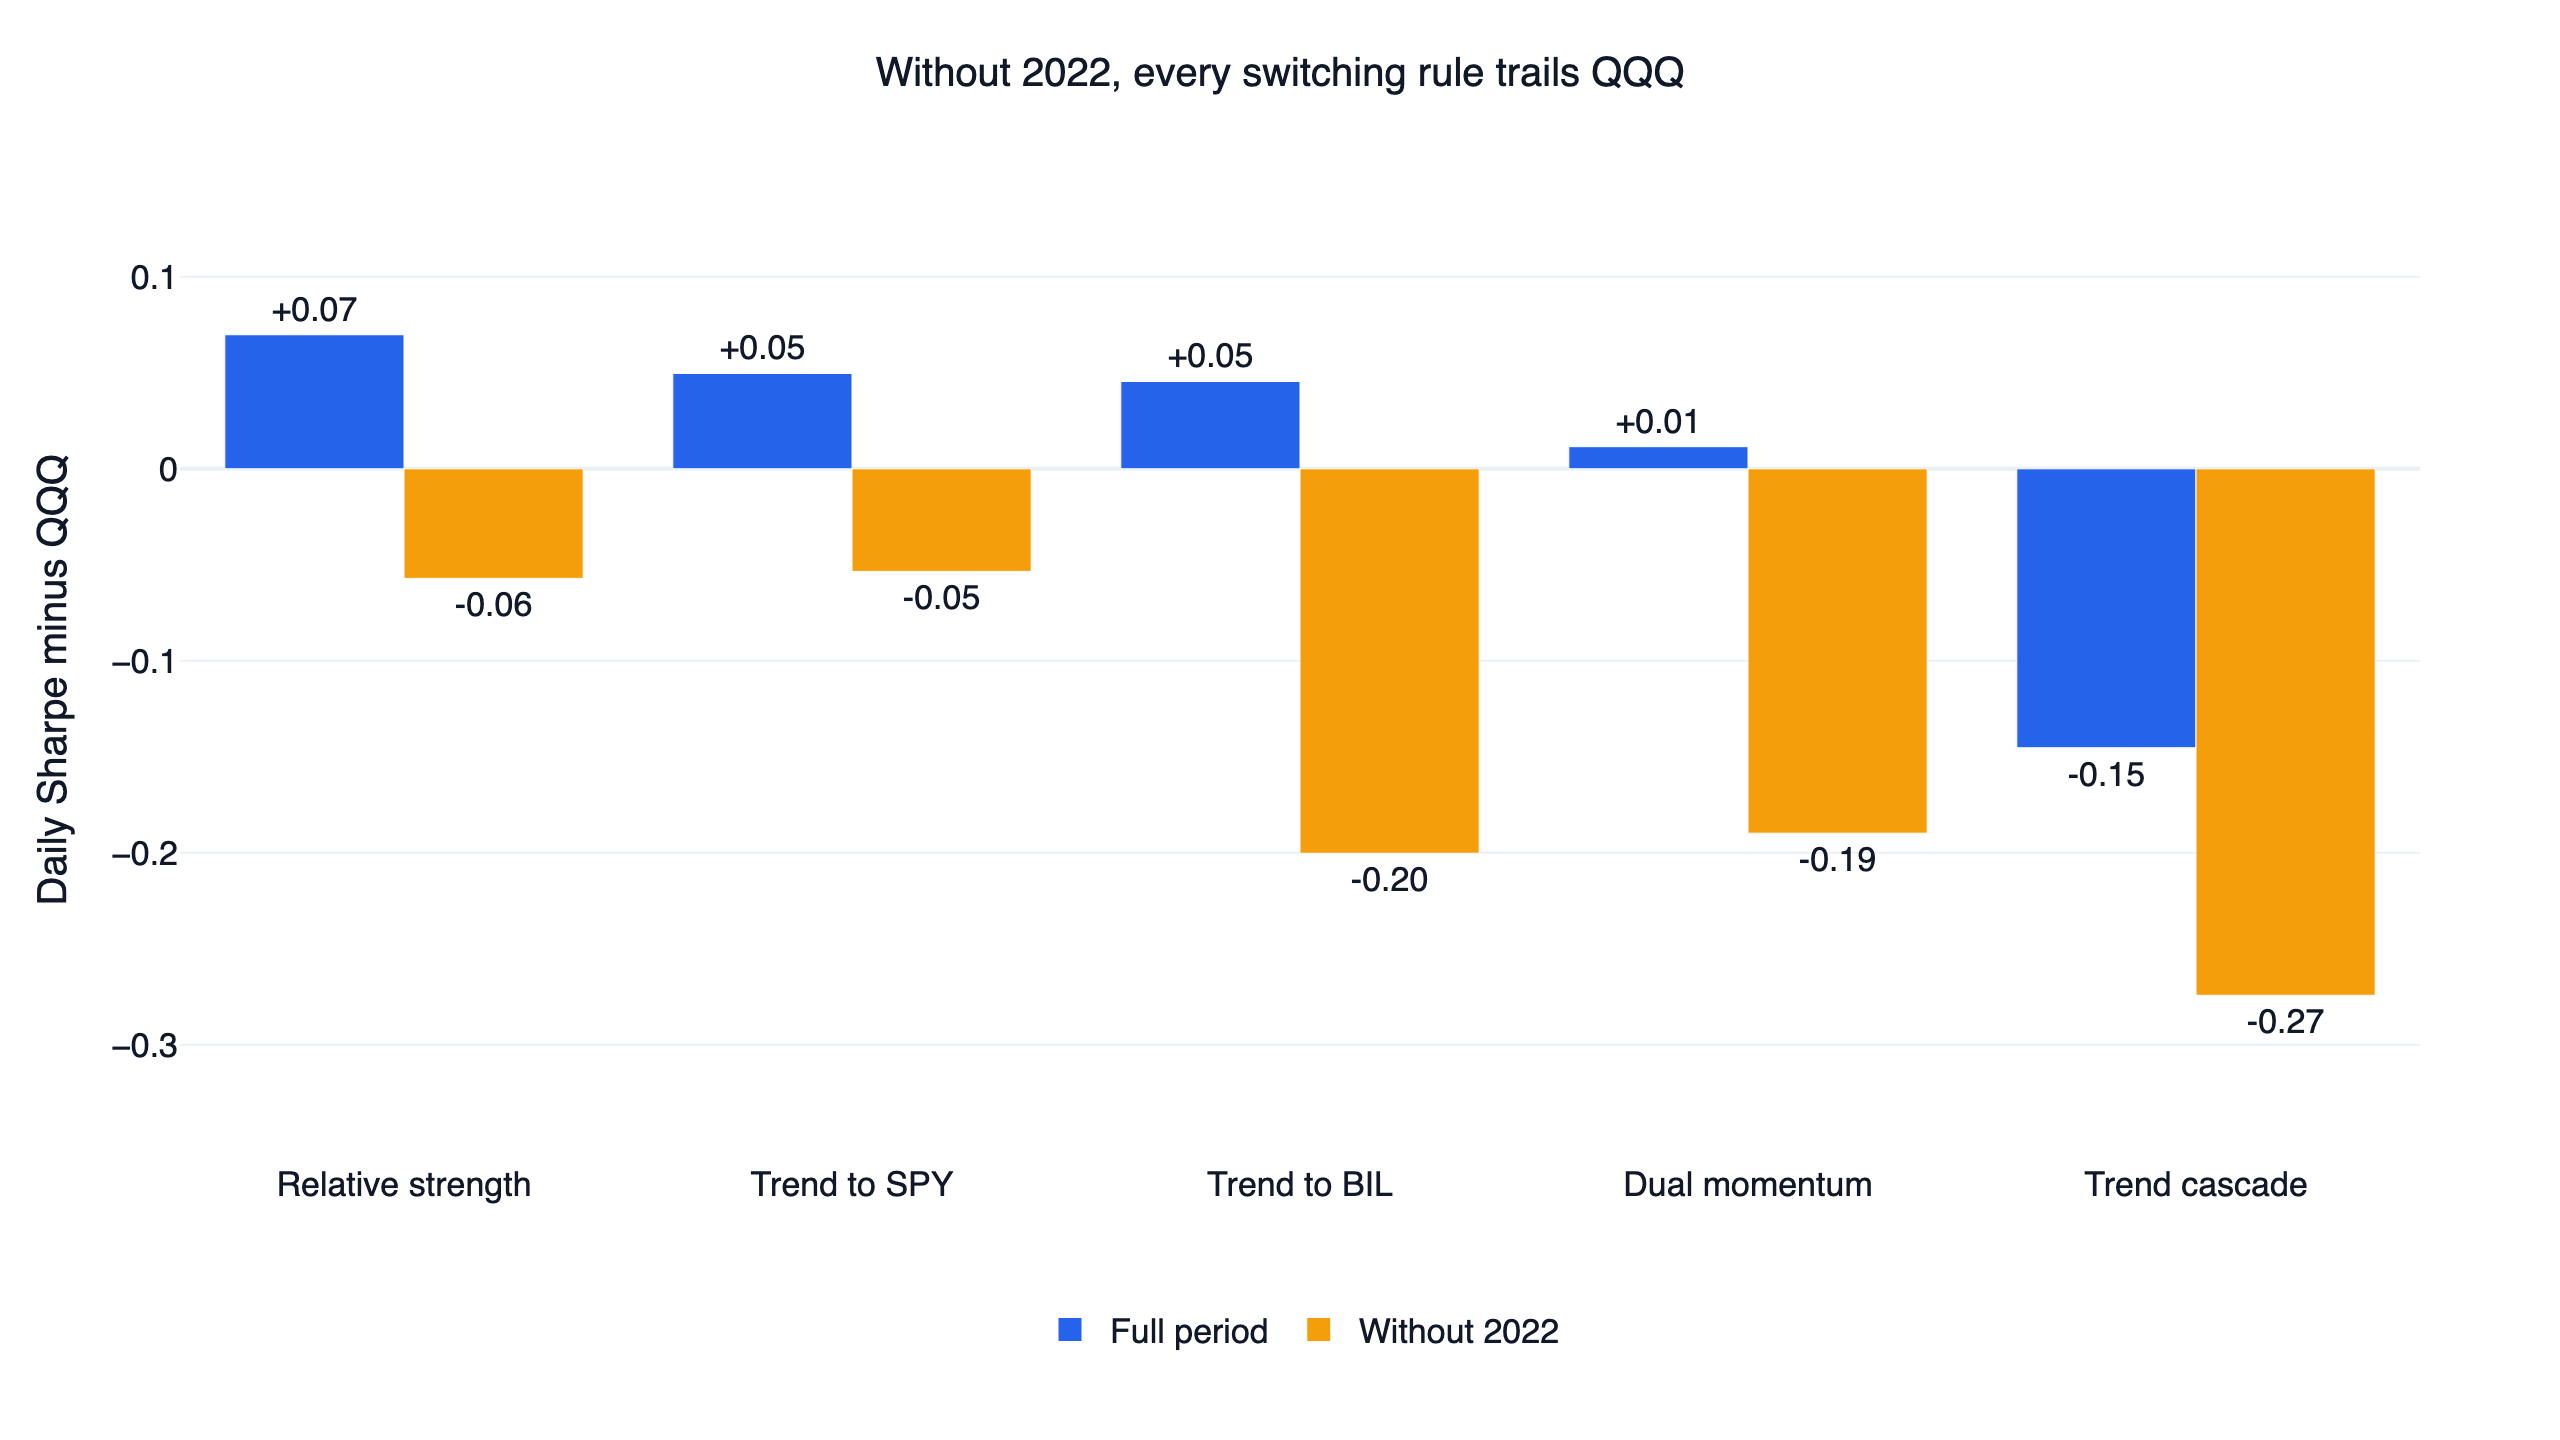
The rules did reduce the loss in 2022. That was one event, and the price was paid in other years: relative strength made 39.4% in 2023 against QQQ's 54.9%, because it was still in SPY early in the rebound. It switched only 10 times in nine and a half years, so its decisions were tested only a handful of times. Simply holding 78% QQQ and 22% SPY scored 0.88 with 18.4% a year, without any signal.
Our other QQQ research points the same way. The leveraged ETF timing backtest tested QQQ and SPY golden crosses, the edge of QQQ volatility targeting also sits mostly in 2022, and the lazy portfolio backtest compares fixed stock and bond mixes.
The code
The core of the relative strength rule, using dividend-adjusted prices and a monthly check:
Show Code
import finlab
import pandas as pd
from finlab import data
from finlab.backtest import sim

finlab.login()  # finlab guides you through login
data.set_market("us")
data.truncate_end = "2026-10-30"

# 1. Prices with dividends, trading days only
prices = data.get("us_fund_price:adj_close")[["QQQ", "SPY"]].dropna()

# 2. Return over the last 12 months (252 trading days)
momentum = prices / prices.shift(252) - 1

# 3. Hold the stronger fund
qqq_leads = momentum["QQQ"] > momentum["SPY"]
position = pd.DataFrame({"QQQ": qqq_leads, "SPY": ~qqq_leads}).astype(float)

# 4. Check at each month end, fill at the next close
report = sim(
    position.loc["2017-04-28":],
    resample="M",
    trade_at_price="close",
    market="us_fund",
    upload=False,
)

# 5. Daily Sharpe, no risk-free rate
returns = report.creturn.pct_change().dropna()
print(round(returns.mean() / returns.std() * 252 ** 0.5, 2))
With data through 2026-10-30 this prints 0.95, the same as the table. The full research.py covers the holding comparison, all 45 settings and every control.
Install the FinLab skill for your AI agent
You do not need to write the code yourself. Install the FinLab skill in Claude Code, Codex or Gemini CLI with one command:
Show Code
npx skills add koreal6803/finlab-ai --skill finlab -g -yThen ask your agent in plain language, for example "use a 10-month average instead of 200 days" or "add a rule that holds VTI when QQQ is below its average". The AI agent setup page walks through each tool, the AI-assisted setup connects your FinLab account, and the same research runs in the browser at studio.finlab.finance.
Backtest method and limits
| Item | Choice |
|---|---|
| Window | Holding comparison 2016-01-04 to 2026-10-30; switching rules 2017-04-28 to 2026-10-30. FinLab's fund prices start in 2016, so the dot-com bust and the 2008 financial crisis are not in the sample. |
| Data | us_fund_price:adj_close with dividends, holiday rows removed. Data through 2026-10-30, rerun 2026-11-01. |
| Expense ratios | From issuer documents checked in November 2026: QQQ, SPY (0.0945%), VOO, VTI. |
| Costs | finlab US defaults are zero commission and tax; originals rerun at 0.1% per side. Holding comparison has no trading costs; fund expense ratios are already in the prices. |
| Slippage, capacity | Not estimated; 0.1% per side stands in. All five funds are large and individual orders are small against their volume. |
| Look-ahead | Signals use data known at a close and trade at the next close (look-ahead bias). Index members and market values are as of each day; sectors come from the current company profile. |
| Weights | Each rule holds one fund at 100%. No leverage. |
| Turnover | With a monthly check, about 1 to 2 switches a year: 10 to 17 in nine and a half years. |
| In and out of sample | The whole period is in-sample. The two halves are a stability check. |
| Taxes | Not included. |
What this result does and does not say
- From 2016 to 2026 QQQ returned more than SPY, VOO and VTI, and that lead came mainly from 2020 and 2023. Projecting it forward is a bet that large-cap technology keeps out-earning the market.
- VOO and SPY track the same index, and VOO returned 0.07 points a year more over this period, close to the fee gap.
- VTI and VOO overlap almost completely. The difference is the small and mid-cap share, which cost VTI a little here.
- None of the five switching rules passed, mainly because the settings were unstable and the edge came from one year. We did not publish any of them as a live strategy.
- This study does not cover markets before 2016, personal taxes, options or margin.
For the same index in two wrappers, see QQQM vs QQQ, which breaks down fees, tracking and liquidity. To run your own version, start with the backtesting guide, and see the program trading overview and the US quant trading strategies overview for the wider picture.
FAQ
Is VOO or QQQ better?
Over 2016 to 2026 QQQ returned more, 19.4% a year against 14.9%, but it fell about 14 points more in 2022 and its volatility was 4.5 points higher. VOO holds 500 companies including financials and energy; QQQ excludes financials and is much heavier in technology. The difference is how much technology concentration you want to carry.
Should I hold both QQQ and SPY?
Their daily correlation is 0.931, and 85 Nasdaq-100 companies are also in the S&P 500. Holding both raises your weight in the largest companies and adds limited diversification. A fixed 78% QQQ and 22% SPY scored 0.88, about the same as QQQ alone.
What is the difference between VOO and SPY?
They track the same index, at 0.03% and about 0.09%. VOO won 99.6% of five-year windows, by about 0.5 points in the median window. SPY has larger trading volume and options markets, which short-term traders may value; this study did not test that.
QQQ vs VTI: how different are they?
VTI behaved almost exactly like VOO (correlation 0.9956), so QQQ vs VTI is close to QQQ vs VOO. QQQ beat VTI in every five-year window here, and VTI is the more diversified of the two, with about 34% in technology by our estimate against about 59% for the Nasdaq-100.
Should I sell QQQ when it falls below its 200-day average?
In this backtest, moving to BIL with a monthly check scored 0.93 against 0.88 for QQQ, but earned 2.4 points less a year, only 3 of 9 settings won, and the edge came from 2022. Without 2022 it scored 1.03 against 1.23. It reduced that one drawdown; it did not deliver a stable excess return.
Why not use a longer history?
FinLab's fund prices start in 2016. QQQ listed in 1999, and the dot-com bust matters a great deal for this comparison. It is not in our data, so none of these win rates should be read as a long-run law.
Can I rerun this myself?
Yes. Install FinLab through the AI-assisted setup and run the research.py below, or change the conditions in conversation at FinLab Studio.
Reproduce it yourself
- research.py: the holding comparison, rolling windows, concentration and sectors, and five rules with 45 settings and all controls.
- data.csv: daily total-return equity of the four funds and the five rules, and QQQ minus SPY over rolling three-year windows.
- metrics.json: every statistic quoted here.
More research: US ETF rotation, covered call ETFs and the Magnificent 7 vs QQQ, US sector rotation and US factor investing.
Last updated: 2026-11 | Backtest window: 2016-01 to 2026-10 | Benchmark: QQQ total return | Author: FinLab Quant Research (reviewed by a quantitative researcher)
Past performance does not represent future results, and every result here is an in-sample backtest. The funds named are used to describe research results, not as recommendations. This content is for education only and does not constitute investment advice.
FinLab AI
Want to build your own strategy?
Describe your stock-picking ideas in natural language. AI automatically validates, backtests, and gives you answers
Start Free