Run this strategy
Copy the prompt to reproduce the evidence above with the article’s data, assumptions, and risk checks.
Tell your AI:
Set up FinLab and rerun the Rule of 40, Magic Formula and CANSLIM screens against QQQ. Please read: https://finlab.finance/en/setup?relatedUrl=/en/blog/us-famous-stock-screens-backtest
We rebuilt six stock screens that investors know by name, the Rule of 40, Joel Greenblatt's Magic Formula, William O'Neil's CANSLIM, the Graham number, dividend growth, and the equal-weight S&P 500, and ran each on point-in-time US data. From August 2017 to October 2026, five of them trailed QQQ on risk-adjusted return: the best was the Magic Formula at a daily Sharpe of 0.76 against 0.90 for QQQ with dividends reinvested, and none of their 63 neighbouring parameter settings beat QQQ. Dividend growth, which our data can only test from 2021, did pass all three checks over 2021-2026, but the win comes from the start date: it lost to QQQ from four of the seven start dates we tested between 2020 and 2023, and trailed SPY from all seven. So none of the six counts as a working strategy in this study.
The six screens at a glance
| Screen (source) | Window | Daily Sharpe | QQQ, same dates | CAGR | Max drawdown | Settings beating QQQ | First / second half Sharpe |
|---|---|---|---|---|---|---|---|
| Rule of 40 (Feld 2015) | 2017-08 to 2026-10 | 0.67 | 0.90 | 17.5% | -53.1% | 0 / 9 | 0.87 / 0.48 |
| Magic Formula (Greenblatt 2005) | 2017-08 to 2026-10 | 0.76 | 0.90 | 14.4% | -36.2% | 0 / 9 | 0.57 / 0.97 |
| CANSLIM (O'Neil 1988) | 2017-08 to 2026-10 | 0.62 | 0.90 | 10.4% | -28.1% | 0 / 27 | 0.49 / 0.77 |
| Graham number (Graham 1973) | 2017-08 to 2026-10 | 0.51 | 0.90 | 10.0% | -56.6% | 0 / 9 | 0.51 / 0.52 |
| Equal-weight S&P 500 | 2017-08 to 2026-10 | 0.67 | 0.90 | 11.4% | -38.9% | 0 / 9 | 0.65 / 0.70 |
| Dividend growth (3 years of raises) | 2021-01 to 2026-10 | 0.87 | 0.79 | 12.0% | -18.4% | 7 / 9 | 0.60 / 1.22 |
| QQQ, total return | 2017-08 to 2026-10 | 0.90 | benchmark | 19.9% | -35.1% | 0.90 / 0.89 | |
| SPY, total return | 2017-08 to 2026-10 | 0.84 | reference | 14.8% | -33.7% |
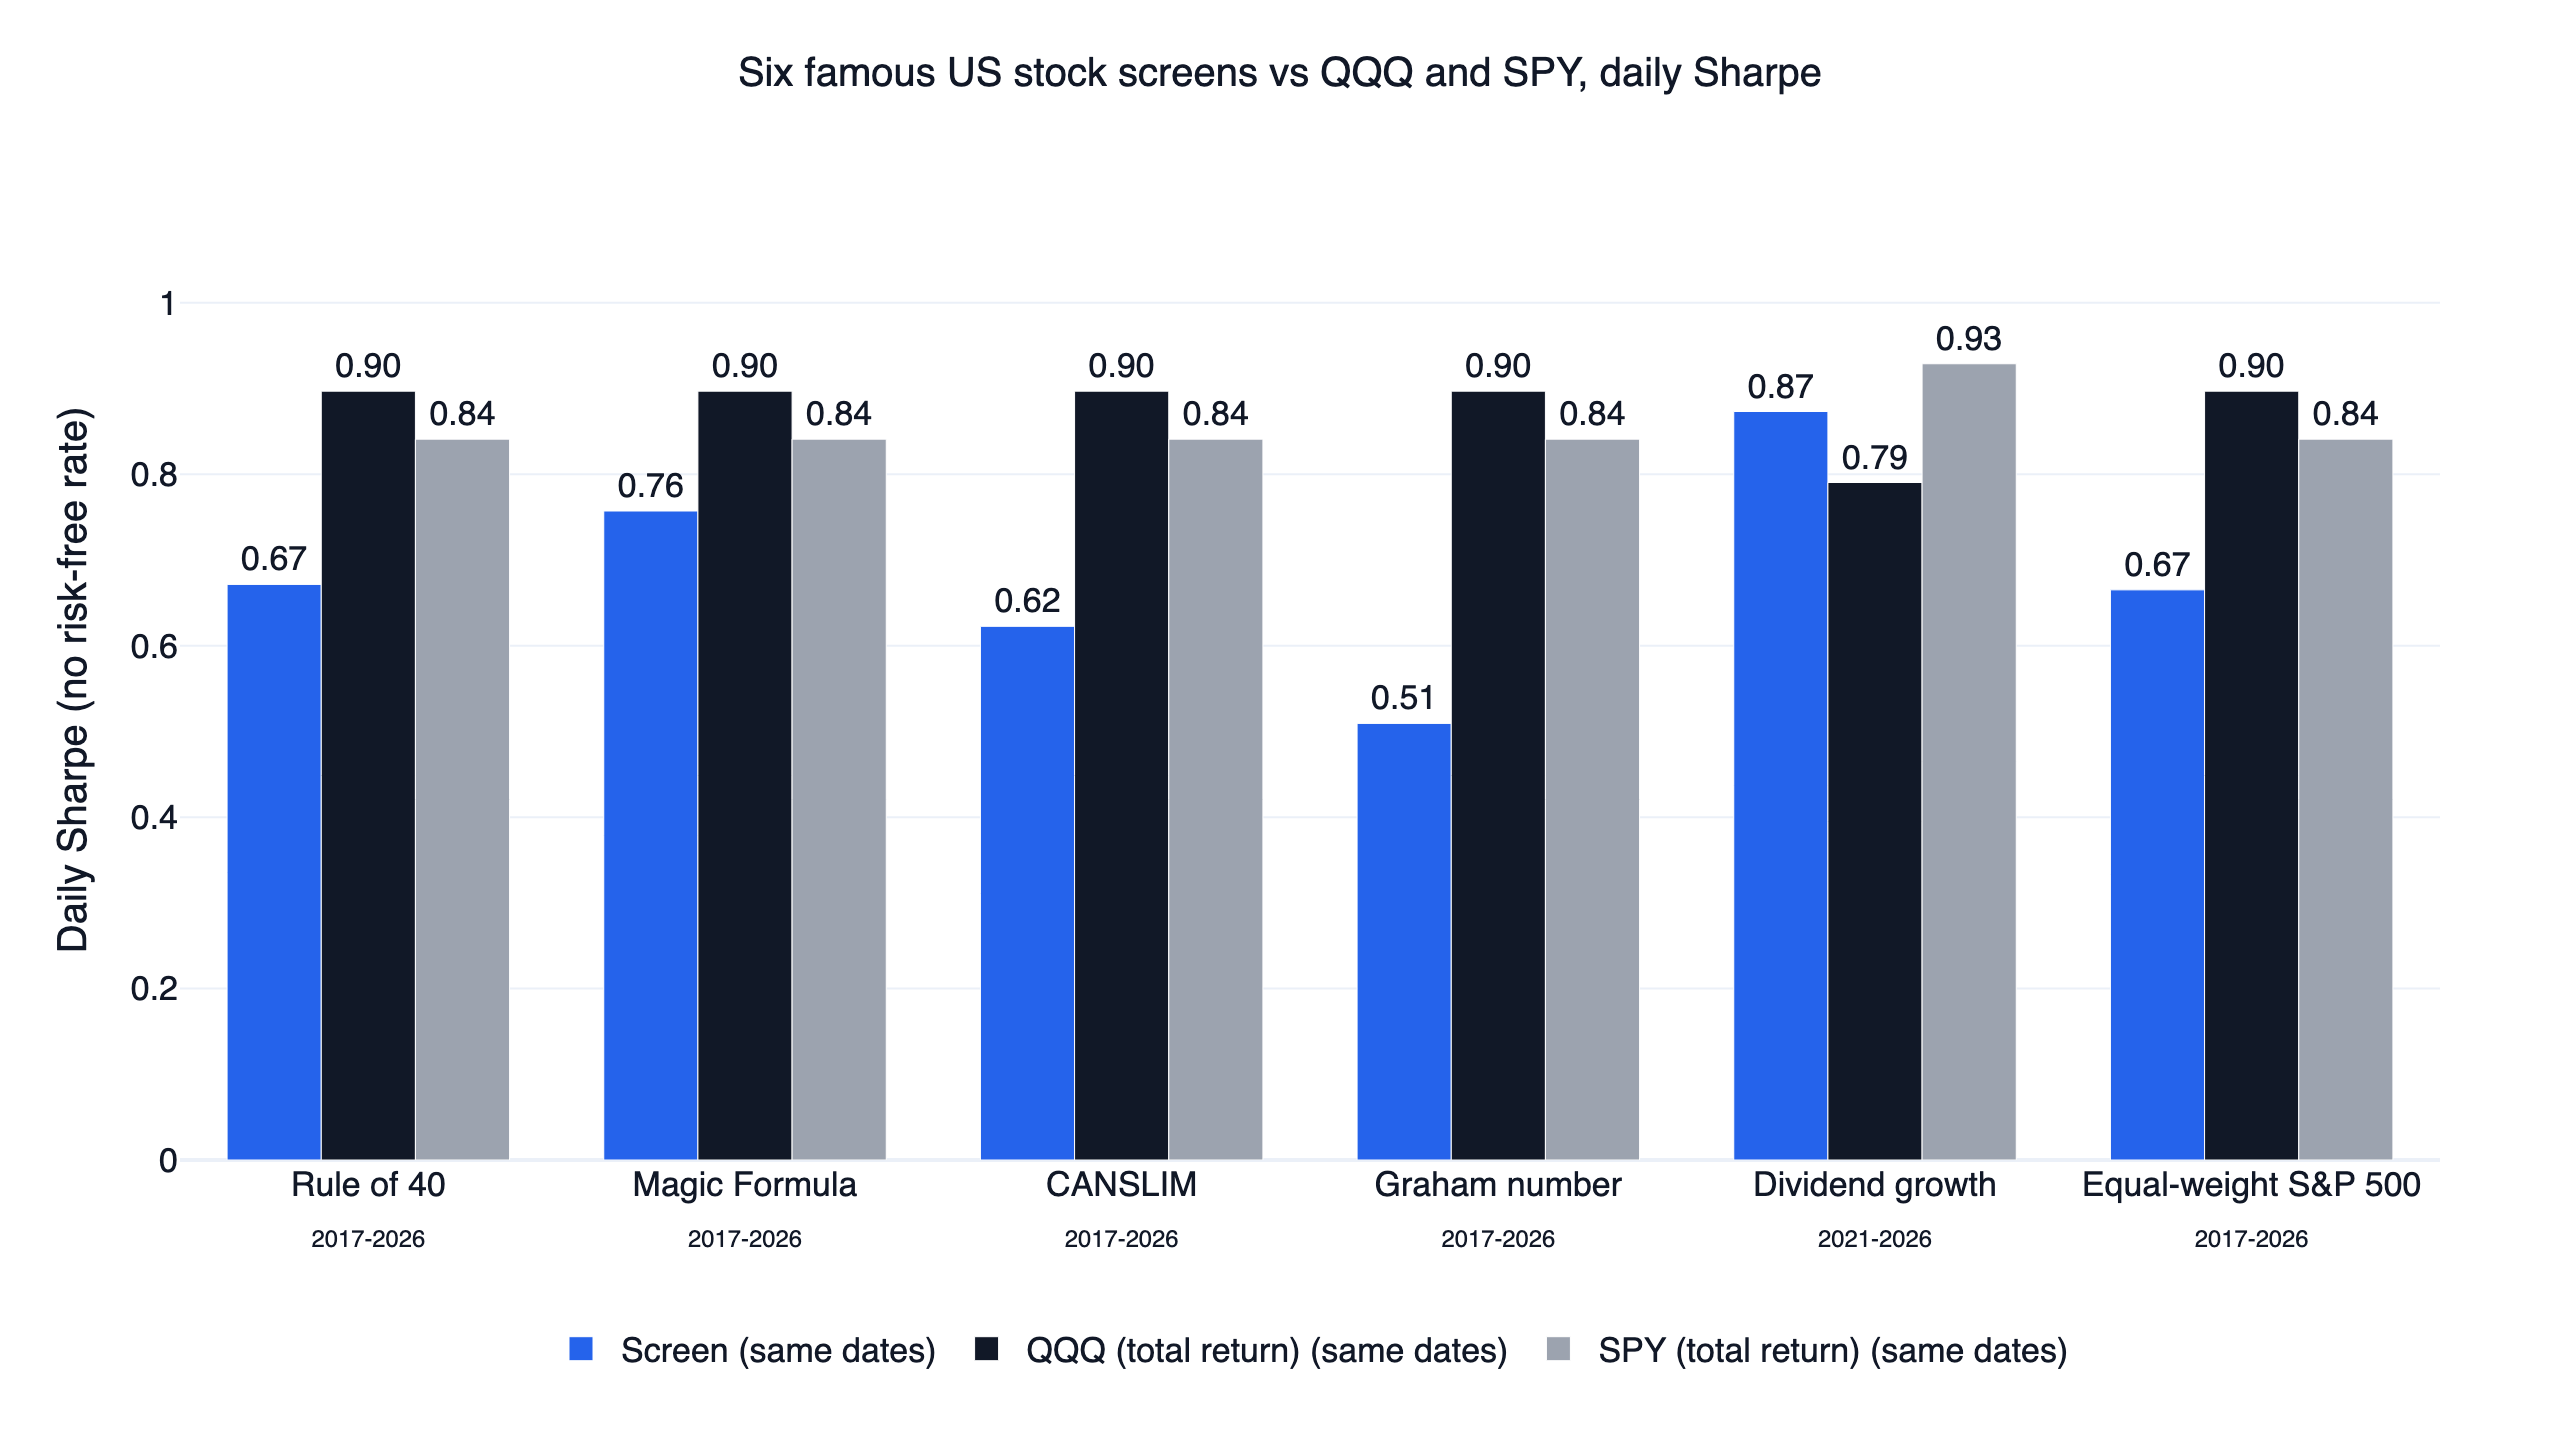
Every portfolio starts on the first day of its window and ends on 2026-10-27; QQQ and SPY are buy and hold with dividends reinvested over the same days. In the dividend-growth window QQQ's Sharpe is 0.79 and SPY's is 0.93.
How a screen had to pass
"Beat" means one thing here: a higher daily Sharpe ratio than QQQ total return over exactly the same trading days. Sharpe is the mean daily return over its standard deviation, annualised with √252, with no risk-free rate subtracted. (The US strategy comparison reports monthly Sharpe, on which QQQ scores higher, so its figures are not directly comparable with these.) A screen counted as working only if it passed all three checks, the same ones used in the 10-factor study:
- A plateau, not a peak. Each screen's two main parameters were set to the published value with one neighbour on each side, nine settings in all (27 for CANSLIM, which has three). At least 70% of them had to beat QQQ.
- Both halves. The window was cut at its midpoint (2022-03-15; 2023-12-01 for dividend growth), and the base setting had to beat QQQ in each half.
- Costs included. Every run uses finlab
sim()with its default US cost model (USMarket: zero commission, no transfer tax), the norm at commission-free brokers. The base setting also had to stay ahead of QQQ with 0.1% cost per side.
Dividend growth could only be tested over a shorter window, because its data starts later, so after passing these three it got two more checks: the same rule rerun from seven different start dates, and a comparison of companies grouped by their dividend record.
The six screens and how each was built
All fundamentals come from FinLab's us_income_statement, us_balance_sheet and us_cash_flow tables, which date each number by its SEC filing date, so nothing enters a score before the 10-Q or 10-K is public. The company list keeps firms that were later acquired or delisted, keeps one share class per company, and drops ADRs, ETFs and funds. Stocks must trade above 5 million a day of volume, and a stock is skipped for a year after any ±50% day (usually a data error or a ticker reuse).
- Rule of 40. Venture capitalist Brad Feld (2015) popularised the rule that a software company's revenue growth plus profit margin should reach 40%. We use trailing-twelve-month revenue growth plus free-cash-flow margin, and each month hold every software company (FMP's "Software - Application" and "Software - Infrastructure" industries) worth at least $2 billion that scores 40% or more, equal weight. That averaged 50 stocks.
- Magic Formula. In Greenblatt (2005), stocks are ranked on earnings yield (EBIT over enterprise value) and return on capital (EBIT over net working capital plus net fixed assets), and the best combined ranks are bought. We follow the book's large-company test: the 1,000 largest US-based companies by market value, excluding financials and utilities (we also drop real estate), holding the top 30. The book holds each pick for a year; we rebalance quarterly and report monthly and yearly rebalancing below. Enterprise value is market value plus debt, preferred stock and minority interest, minus cash and short-term investments.
- CANSLIM. O'Neil's (1988) seven-letter method, as far as the data allows. C: latest quarterly EPS up at least 25% from a year earlier. A: trailing-twelve-month EPS up at least 25% (O'Neil asks for three years of 25% growth; our statements start in 2015). N: price within 15% of its 52-week high. L: relative strength in the top 20% of the universe, using a weighted 3, 6, 9 and 12-month return. M: SPY above its 200-day average, otherwise cash. S (share supply) and I (institutional sponsorship) are left out because there is no point-in-time history for them. The universe uses a common CANSLIM liquidity floor: price at least $15 and a 50-day average of 400,000 shares a day. Rebalanced weekly.
- Graham number. In the revised Intelligent Investor, Graham (1973) told the defensive investor to pay no more than 15 times earnings and 1.5 times book value, or a product of P/E and P/B of at most 22.5. A price below √(22.5 × EPS × book value per share) is the same test. We compute P/E and P/B from market value, trailing net income and stockholders' equity, so share-count changes and splits cancel, and hold every stock that passes among the 1,000 largest US-based companies outside financials and real estate. That averaged 111 stocks.
- Dividend growth. Trailing-365-day dividends per share (split-adjusted, with special dividends above 2.5 times the stock's usual payment removed) higher than a year earlier, three years in a row, among the 500 largest US-based companies. Studies of dividend changes, such as Benartzi, Michaely & Thaler (1997), find that raises look back at past earnings more than they predict future ones, which is one reason to test the rule rather than assume it.
- Equal-weight S&P 500. Every S&P 500 member on each day at the same weight, rebalanced quarterly like the S&P 500 Equal Weight Index. DeMiguel, Garlappi & Uppal (2009) found that this naive 1/N weighting is hard for optimised portfolios to beat; the question here is whether it beats QQQ.
Result 1: five screens trail QQQ, and SPY too
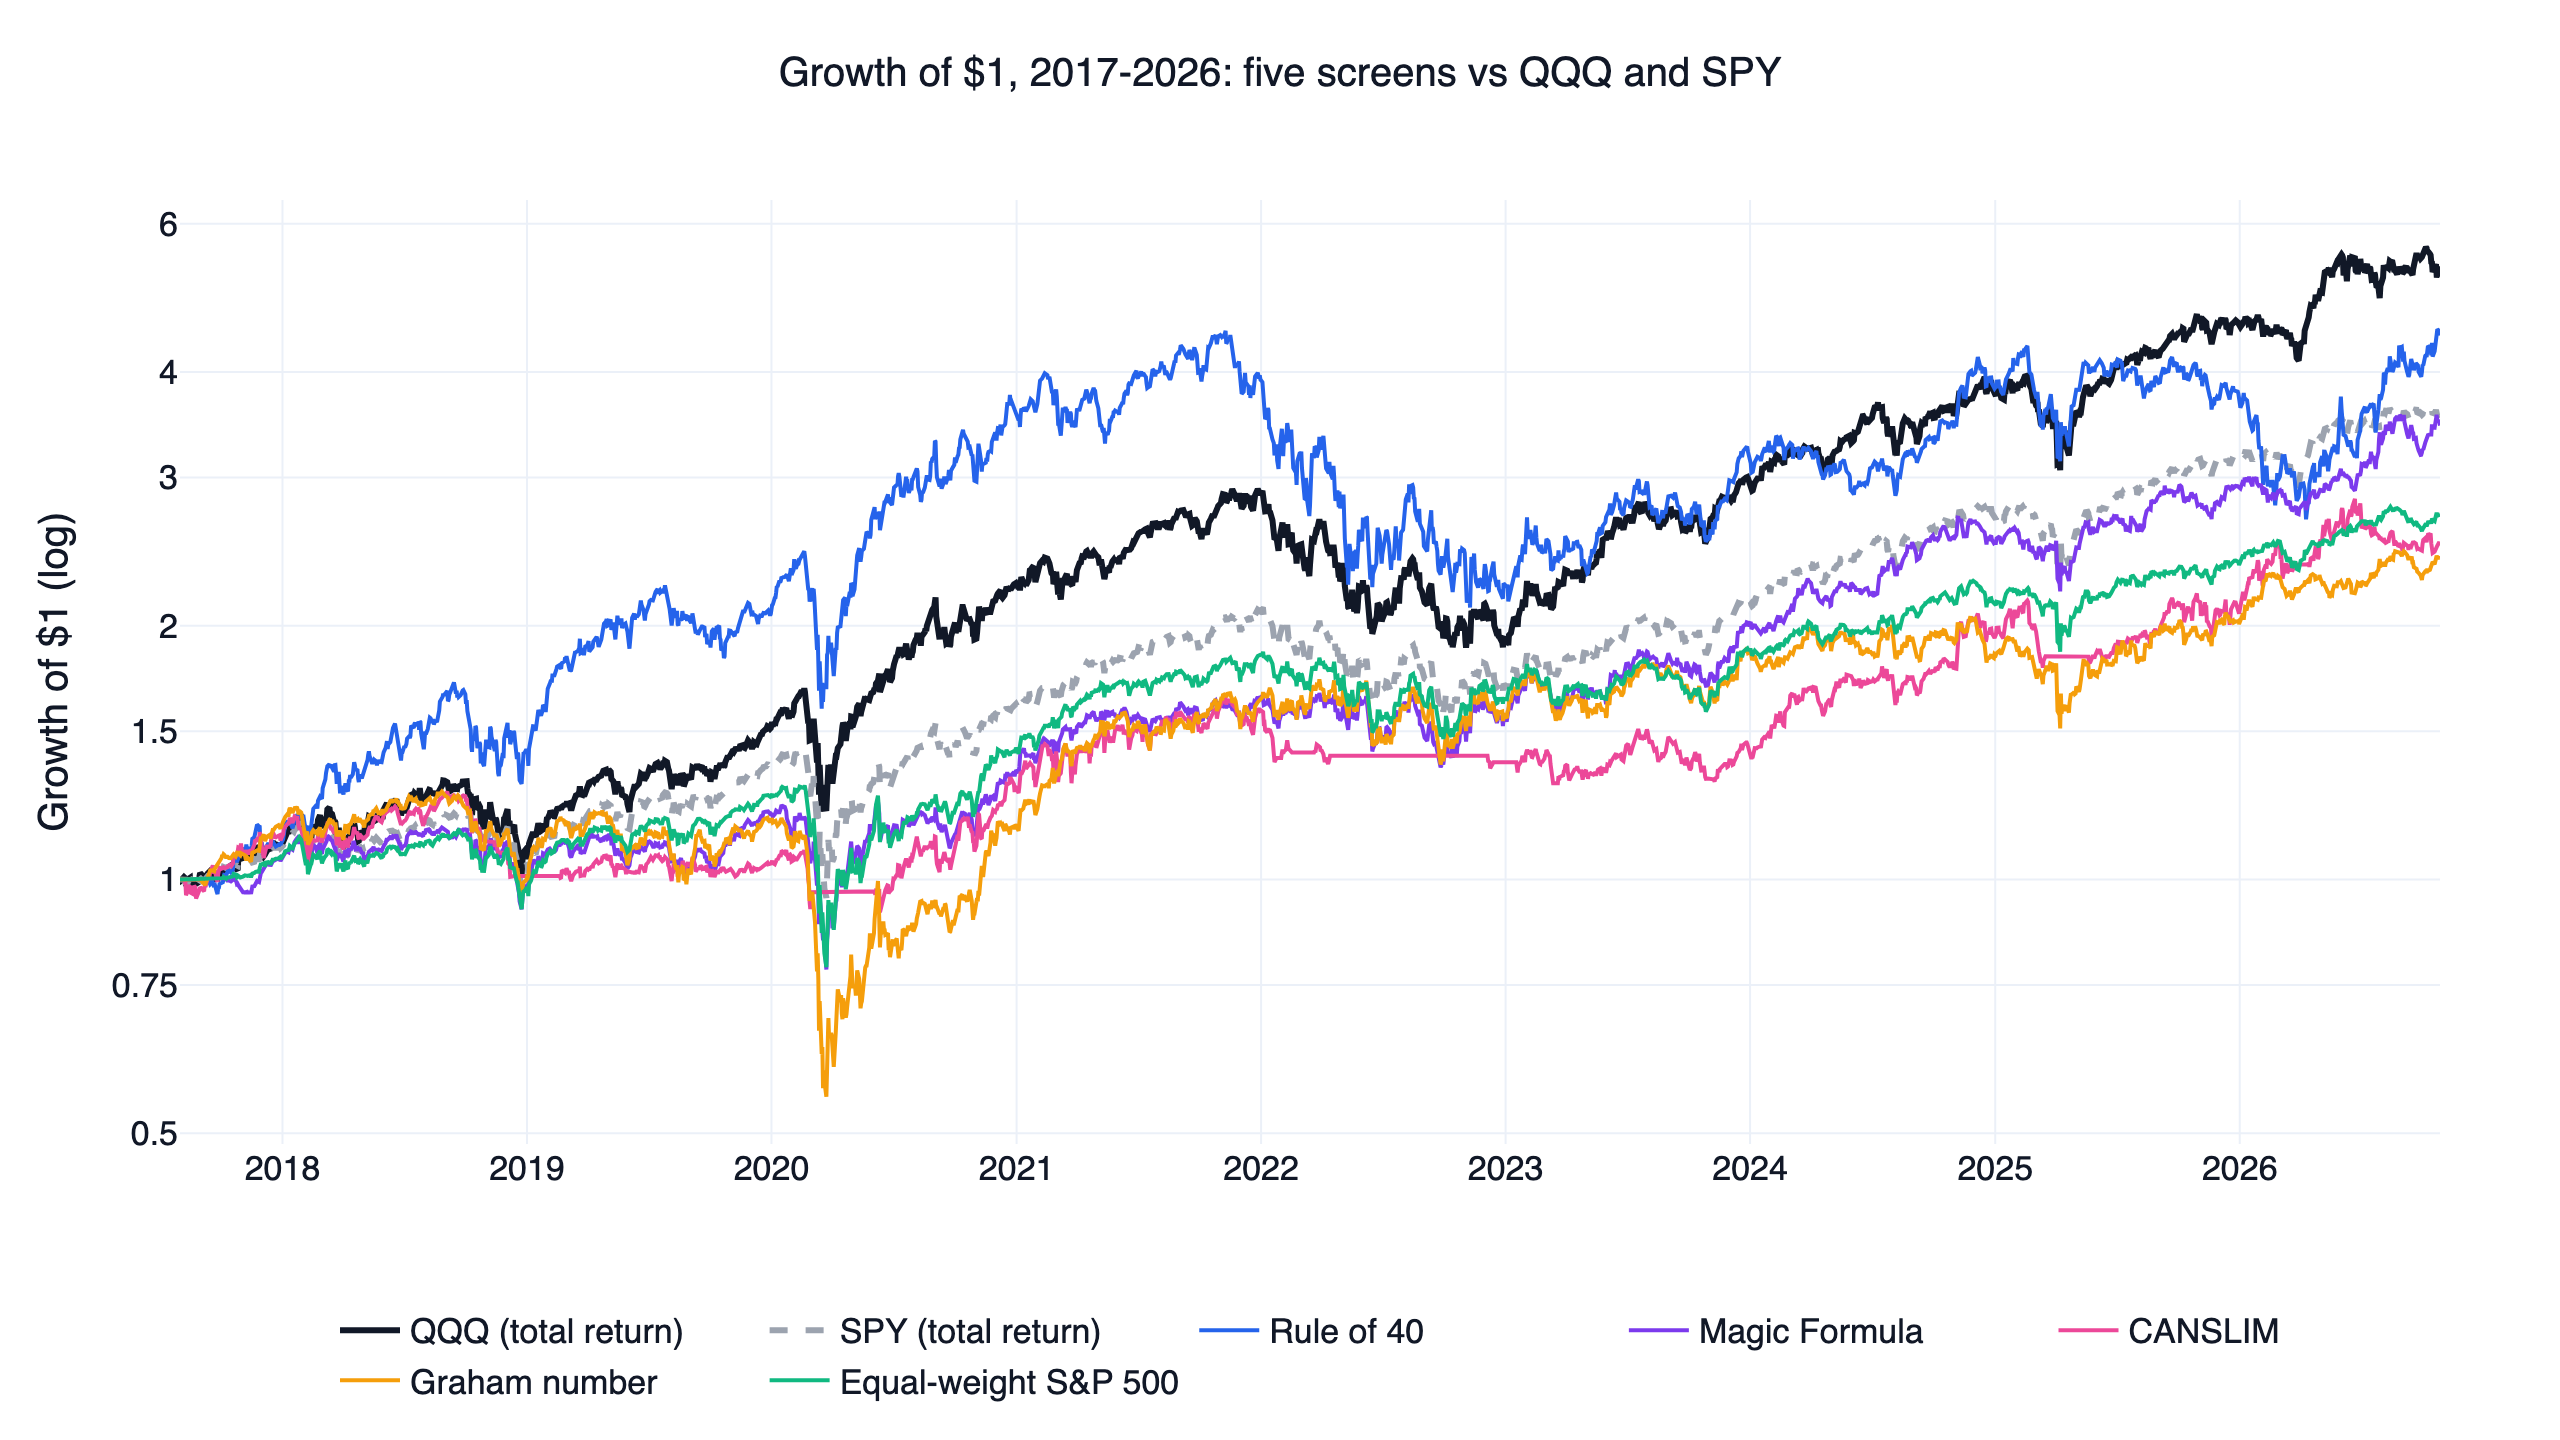
The chart at the top puts each screen next to QQQ and SPY over its own dates. Over 2017-2026 the closest was the Magic Formula at 0.76, followed by the Rule of 40 and the equal-weight S&P 500 at 0.67, CANSLIM at 0.62, and the Graham number at 0.51. QQQ scored 0.90 and SPY 0.84, so these five screens also lost to the plain S&P 500.
Raw returns tell the same story. QQQ compounded at 19.9% a year. The Rule of 40 came closest at 17.5%, but with a 53.1% drawdown and 31% annual volatility against QQQ's 35.1% and 23%. The other four returned 10.0% to 14.4% a year.
Result 2: no plateau for five of the six
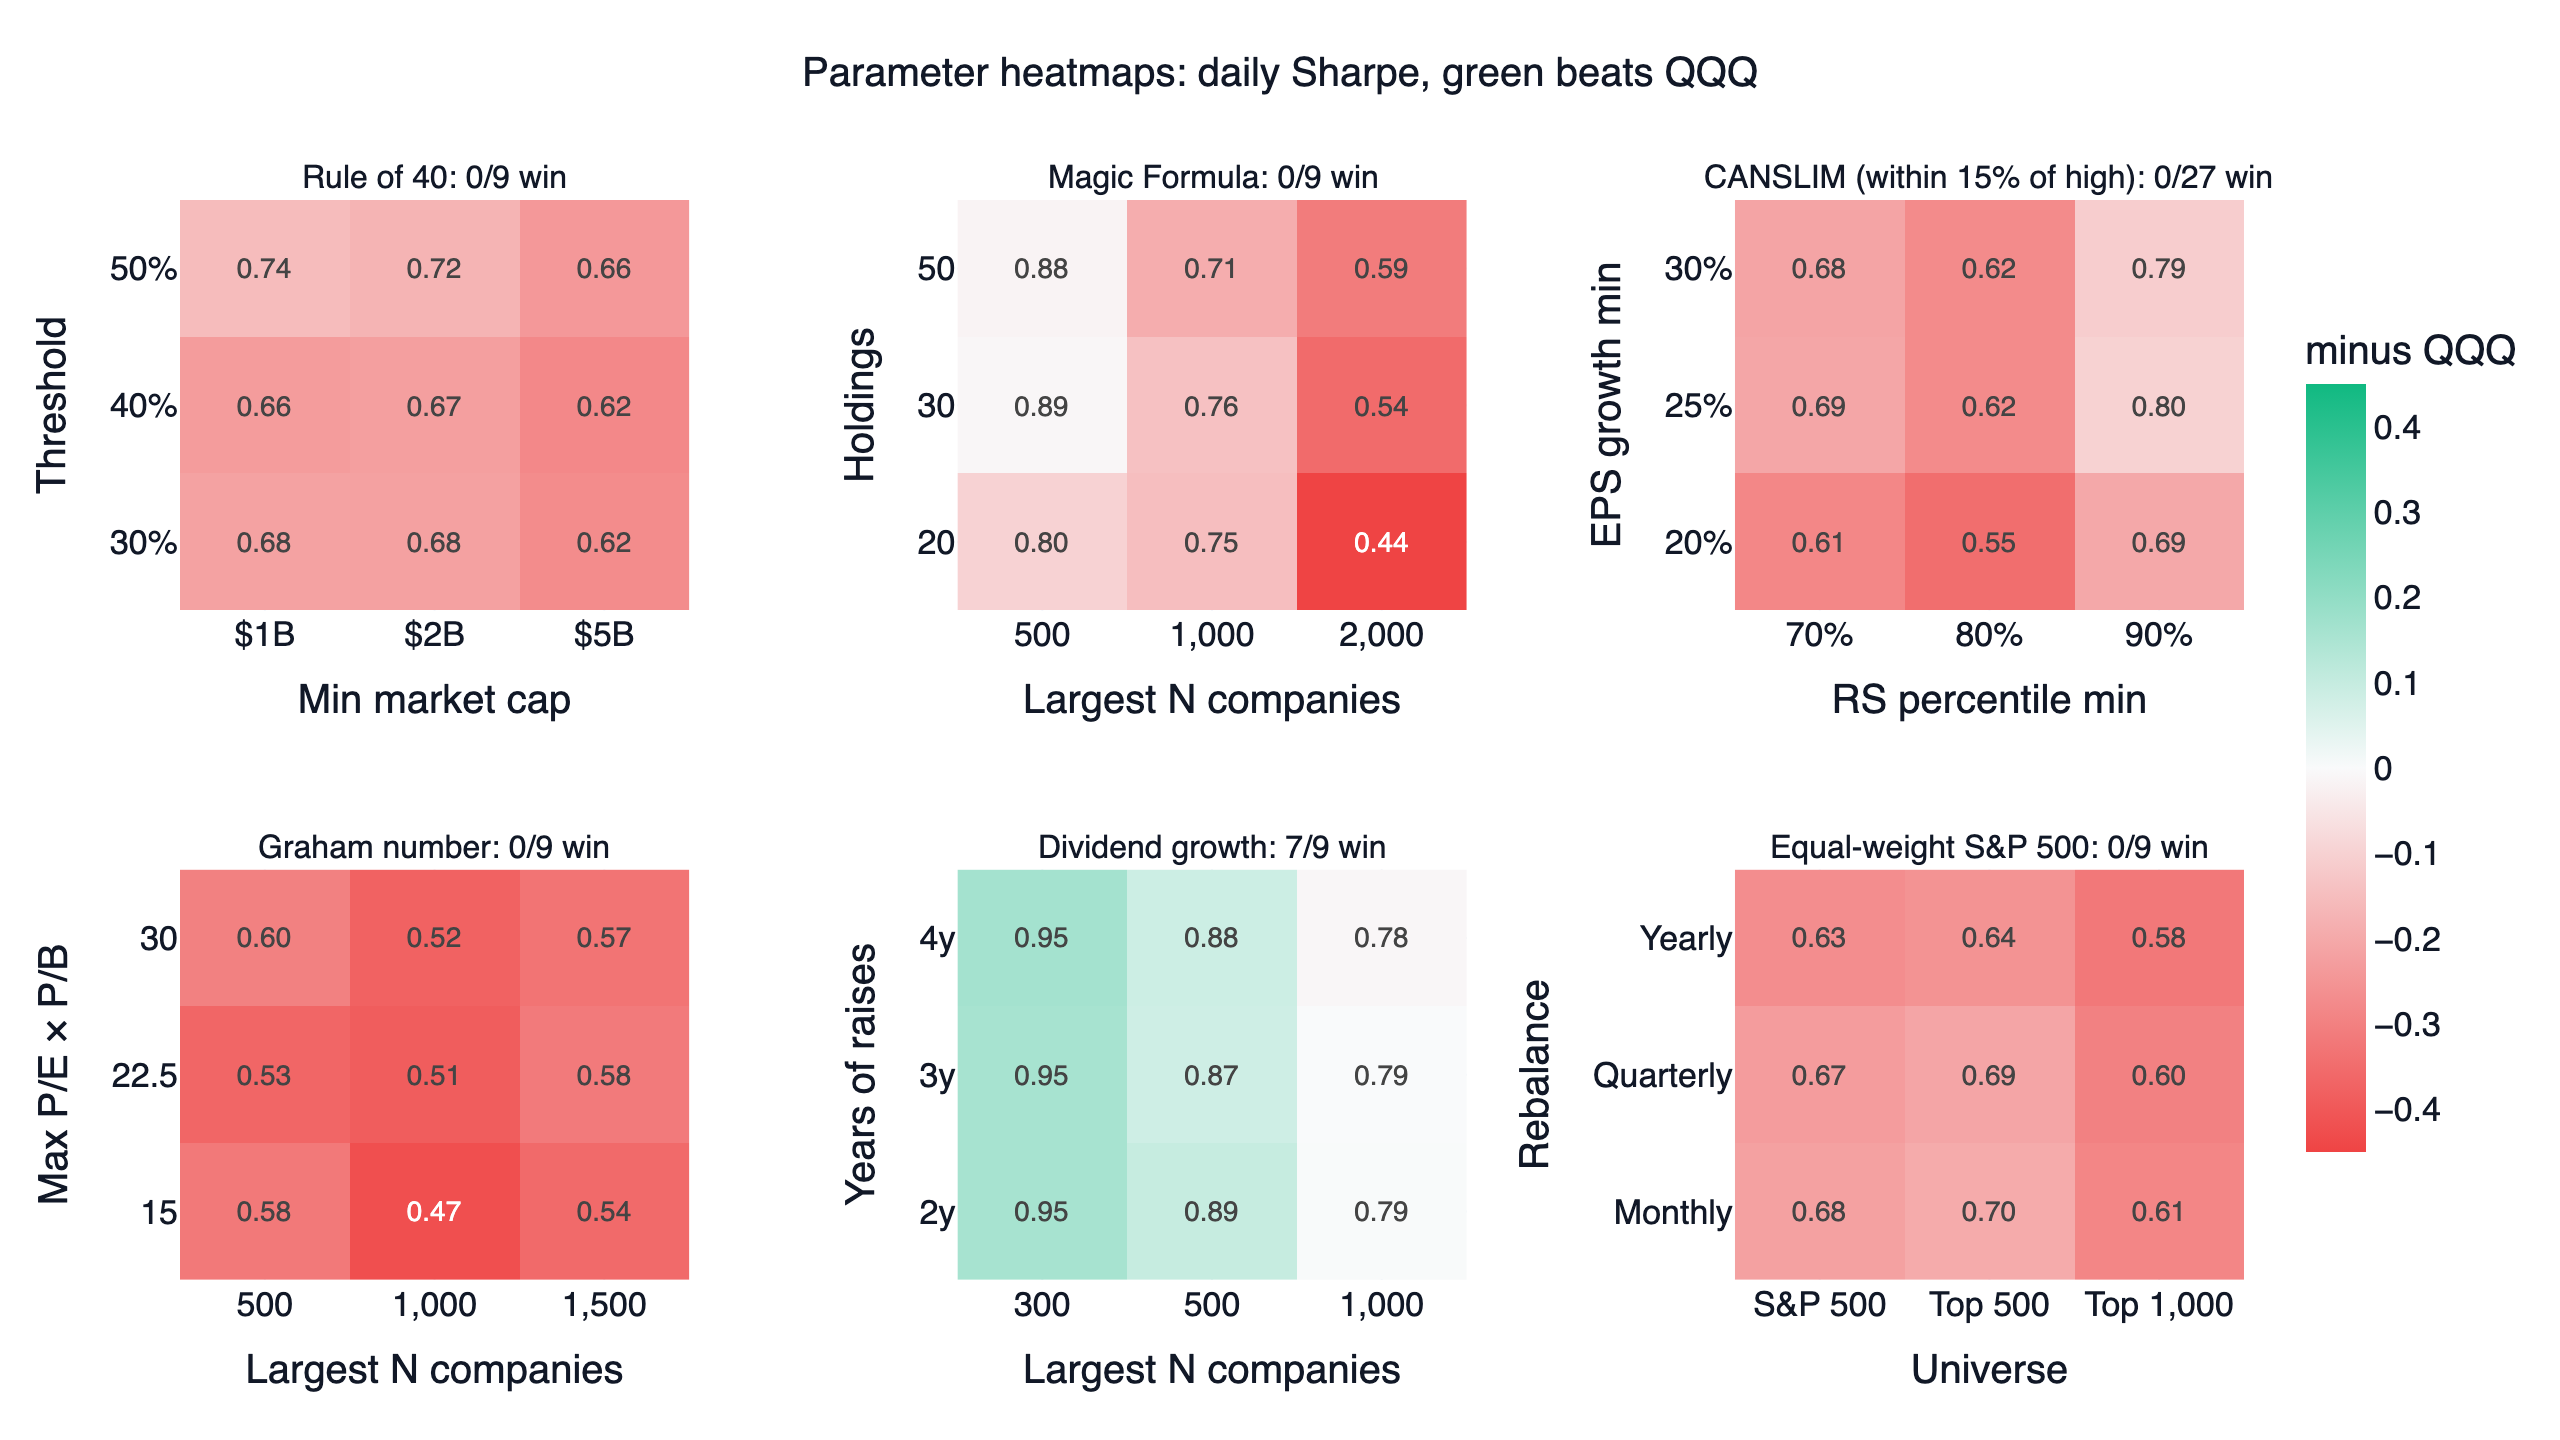
Each cell is one setting's daily Sharpe; the colour is the gap to QQQ over the same dates. Five panels are red throughout: 0 of 9 for the Rule of 40, the Magic Formula, the Graham number and the equal-weight S&P 500, and 0 of 27 for CANSLIM (the panel shows the nine settings at 15% from the high; the other 18 are in metrics.json). The closest single settings were the Magic Formula among the 500 largest companies, with 30 stocks (0.89 against 0.90) and with 50 (0.88); CANSLIM's best was 0.80, with the relative-strength bar raised to the top 10%.
Two patterns run through the grid. Restricting the Magic Formula to bigger companies helped: with 30 stocks it scored 0.89 among the 500 largest against 0.54 among the 2,000 largest. And the strictest Rule of 40 bar, 50%, did best at every market-cap floor (0.72 against 0.67 for 40% at $2 billion). Neither moved a setting past QQQ.
Result 3: most screens did improve on their own universe
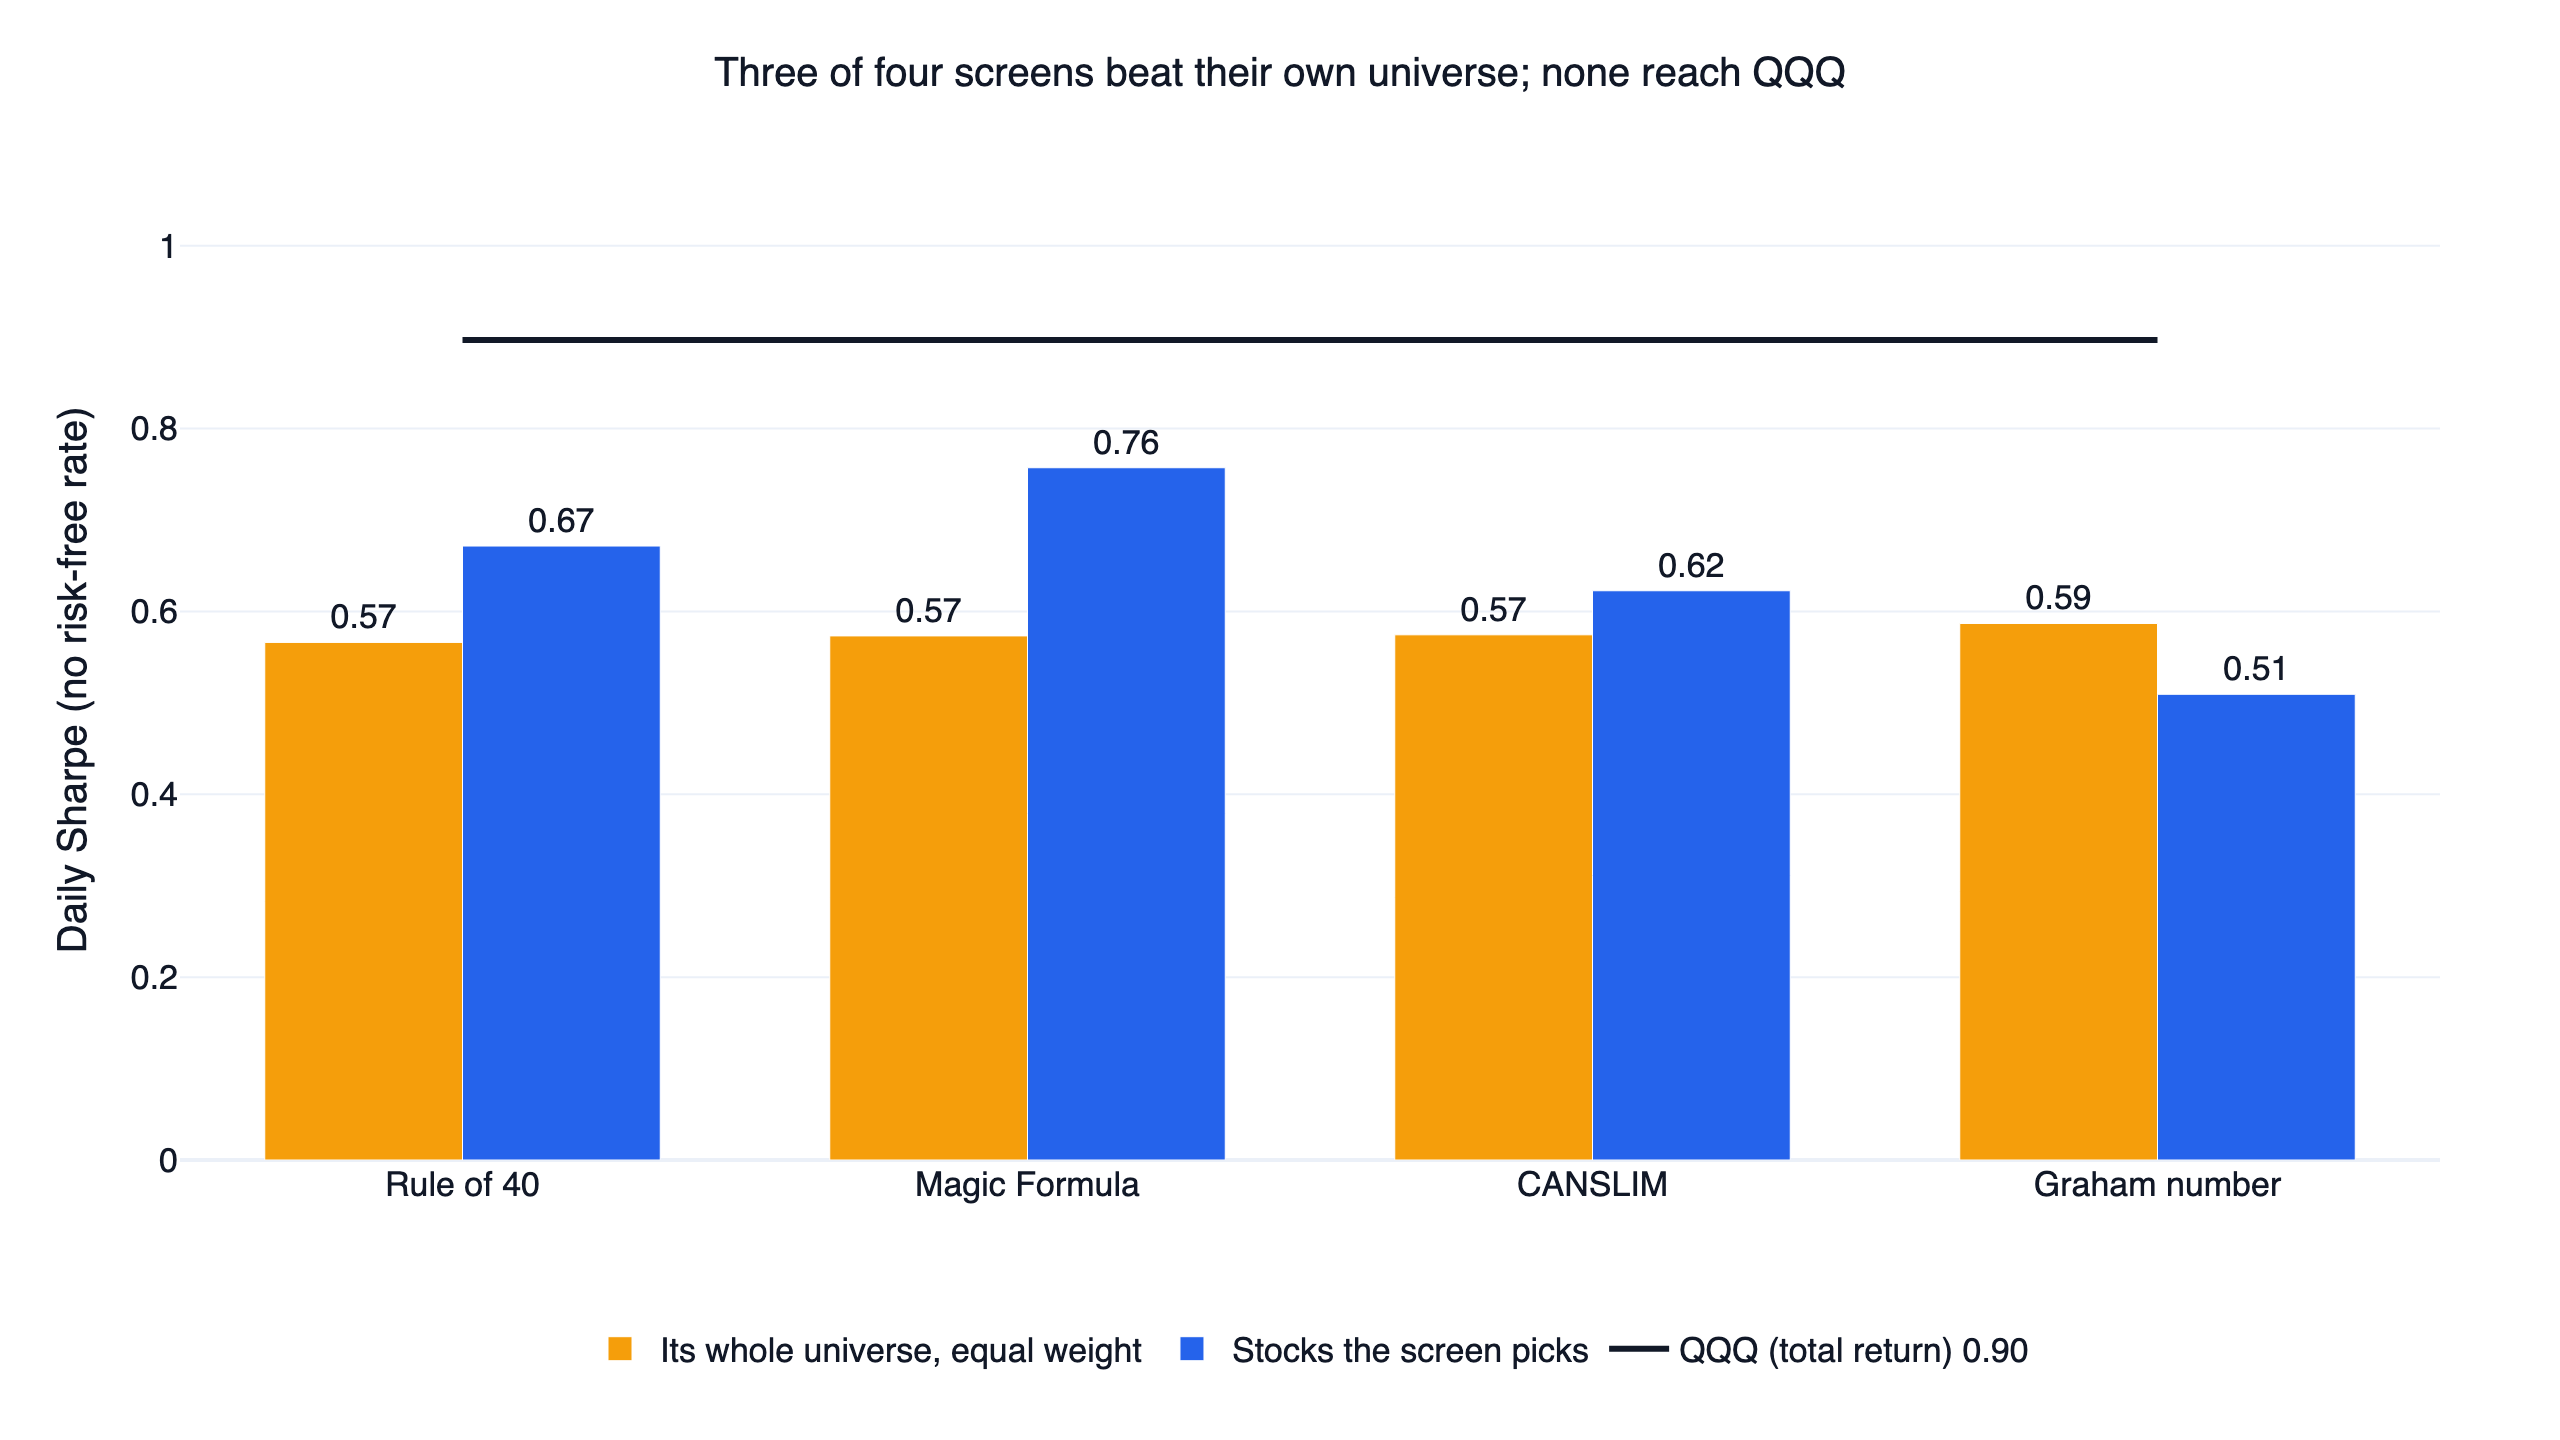
A fair question is whether a screen picks better stocks than the pool it chooses from. For three of the four full-window screens that pick individual stocks, it did. The Magic Formula's 0.76 compares with 0.57 for an equal-weight portfolio of all 1,000 eligible companies. The Rule of 40 scored 0.67 against 0.57 for every software company above $2 billion, and CANSLIM 0.62 against 0.57 for its liquid universe. The Graham number went the other way: 0.51 against 0.59 for its own universe. Its portfolio leaned on energy (20%) and consumer cyclicals (25%) and fell furthest in the 2020 crash: a 56.6% drawdown and -1.6% for the year, the weakest of the five screens in 2020.
The problem is the distance between the average US stock and QQQ. An equal-weight portfolio of the S&P 500 scored 0.67 over this window, and so did the Invesco S&P 500 Equal Weight ETF (RSP, 0.67; the two had a 0.997 daily correlation). Market-cap weighting put far more money in the largest technology companies, and that gap was larger than anything a screen added.
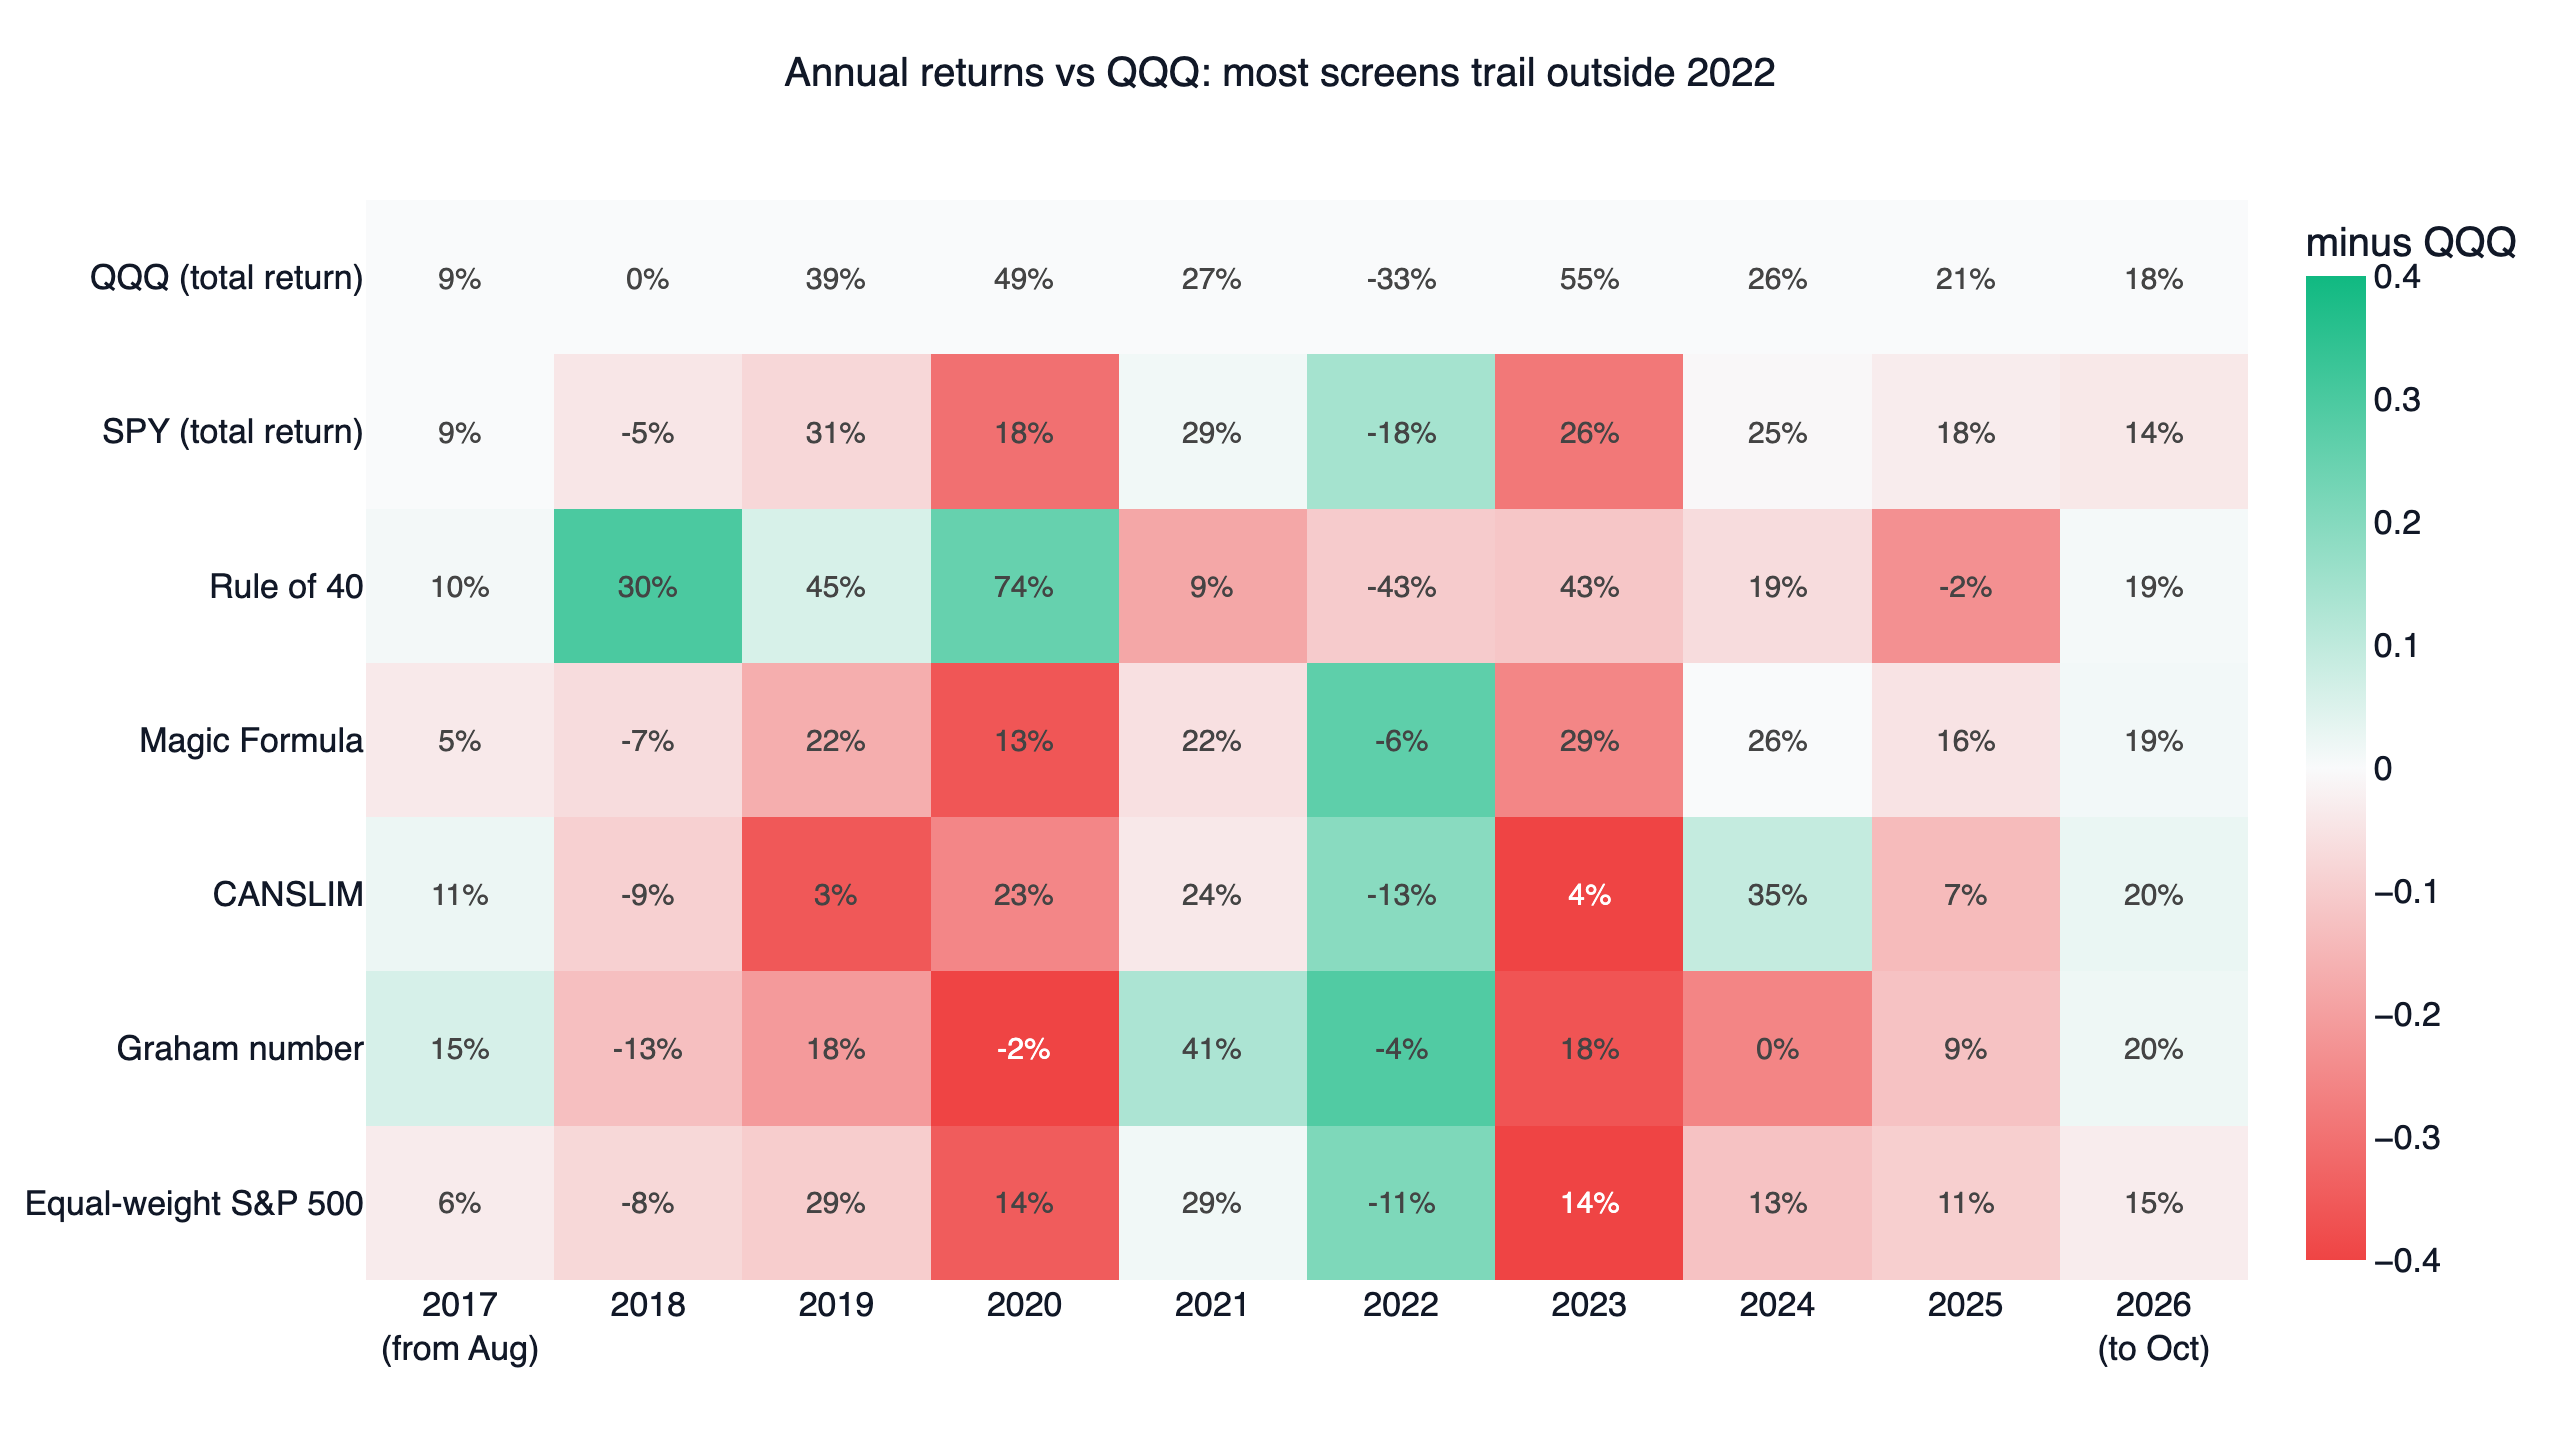
The year-by-year chart shows where it happened. In 2022 every screen lost less than QQQ's -32.6%, apart from the Rule of 40, which fell 42.8%. But in 2020 and 2023 QQQ rose 48.6% and 54.9%, while the Magic Formula, CANSLIM, the Graham number and the equal-weight S&P 500 returned between -1.6% and 29.3%, a gap one good year in 2022 did not close. The Rule of 40 is the mirror image: it beat QQQ in 2018, 2019 and 2020 as software stocks soared, then trailed it in every full year from 2021 to 2025, which is why its first-half Sharpe (0.87) and second-half Sharpe (0.48) are so far apart. The growth-of-a-dollar chart below puts the same path in one picture: one dollar in the Rule of 40 led QQQ from 2018 through 2022, traded the lead with it from 2023, fell behind for good in July 2025, and ended at 5.34 for QQQ and 2.41 and $3.46.
Dividend growth: it passes the checks, but the edge is in the start date
FinLab's dividend history starts in January 2016, so three years of raises can first be measured at the start of 2020 and four years at the start of 2021. To give all nine grid settings (two to four years of raises, the 300, 500 or 1,000 largest companies) the same window, the test starts on 2021-01-04. On those dates the base setting holds about 242 stocks with a median dividend yield of 2.0% and passes every check: a Sharpe of 0.87 against 0.79 for QQQ, 7 of 9 settings ahead (both losing settings use the 1,000-company universe, and a third, two years of raises in that universe, won by 0.003), both halves ahead (0.60 against 0.48, then 1.22 against 1.16), and 0.86 after 0.1% cost per side. It also lost only 8.7% in 2022, when QQQ fell 32.6%.
Before calling that a strategy we asked two more questions, and both answers were no.
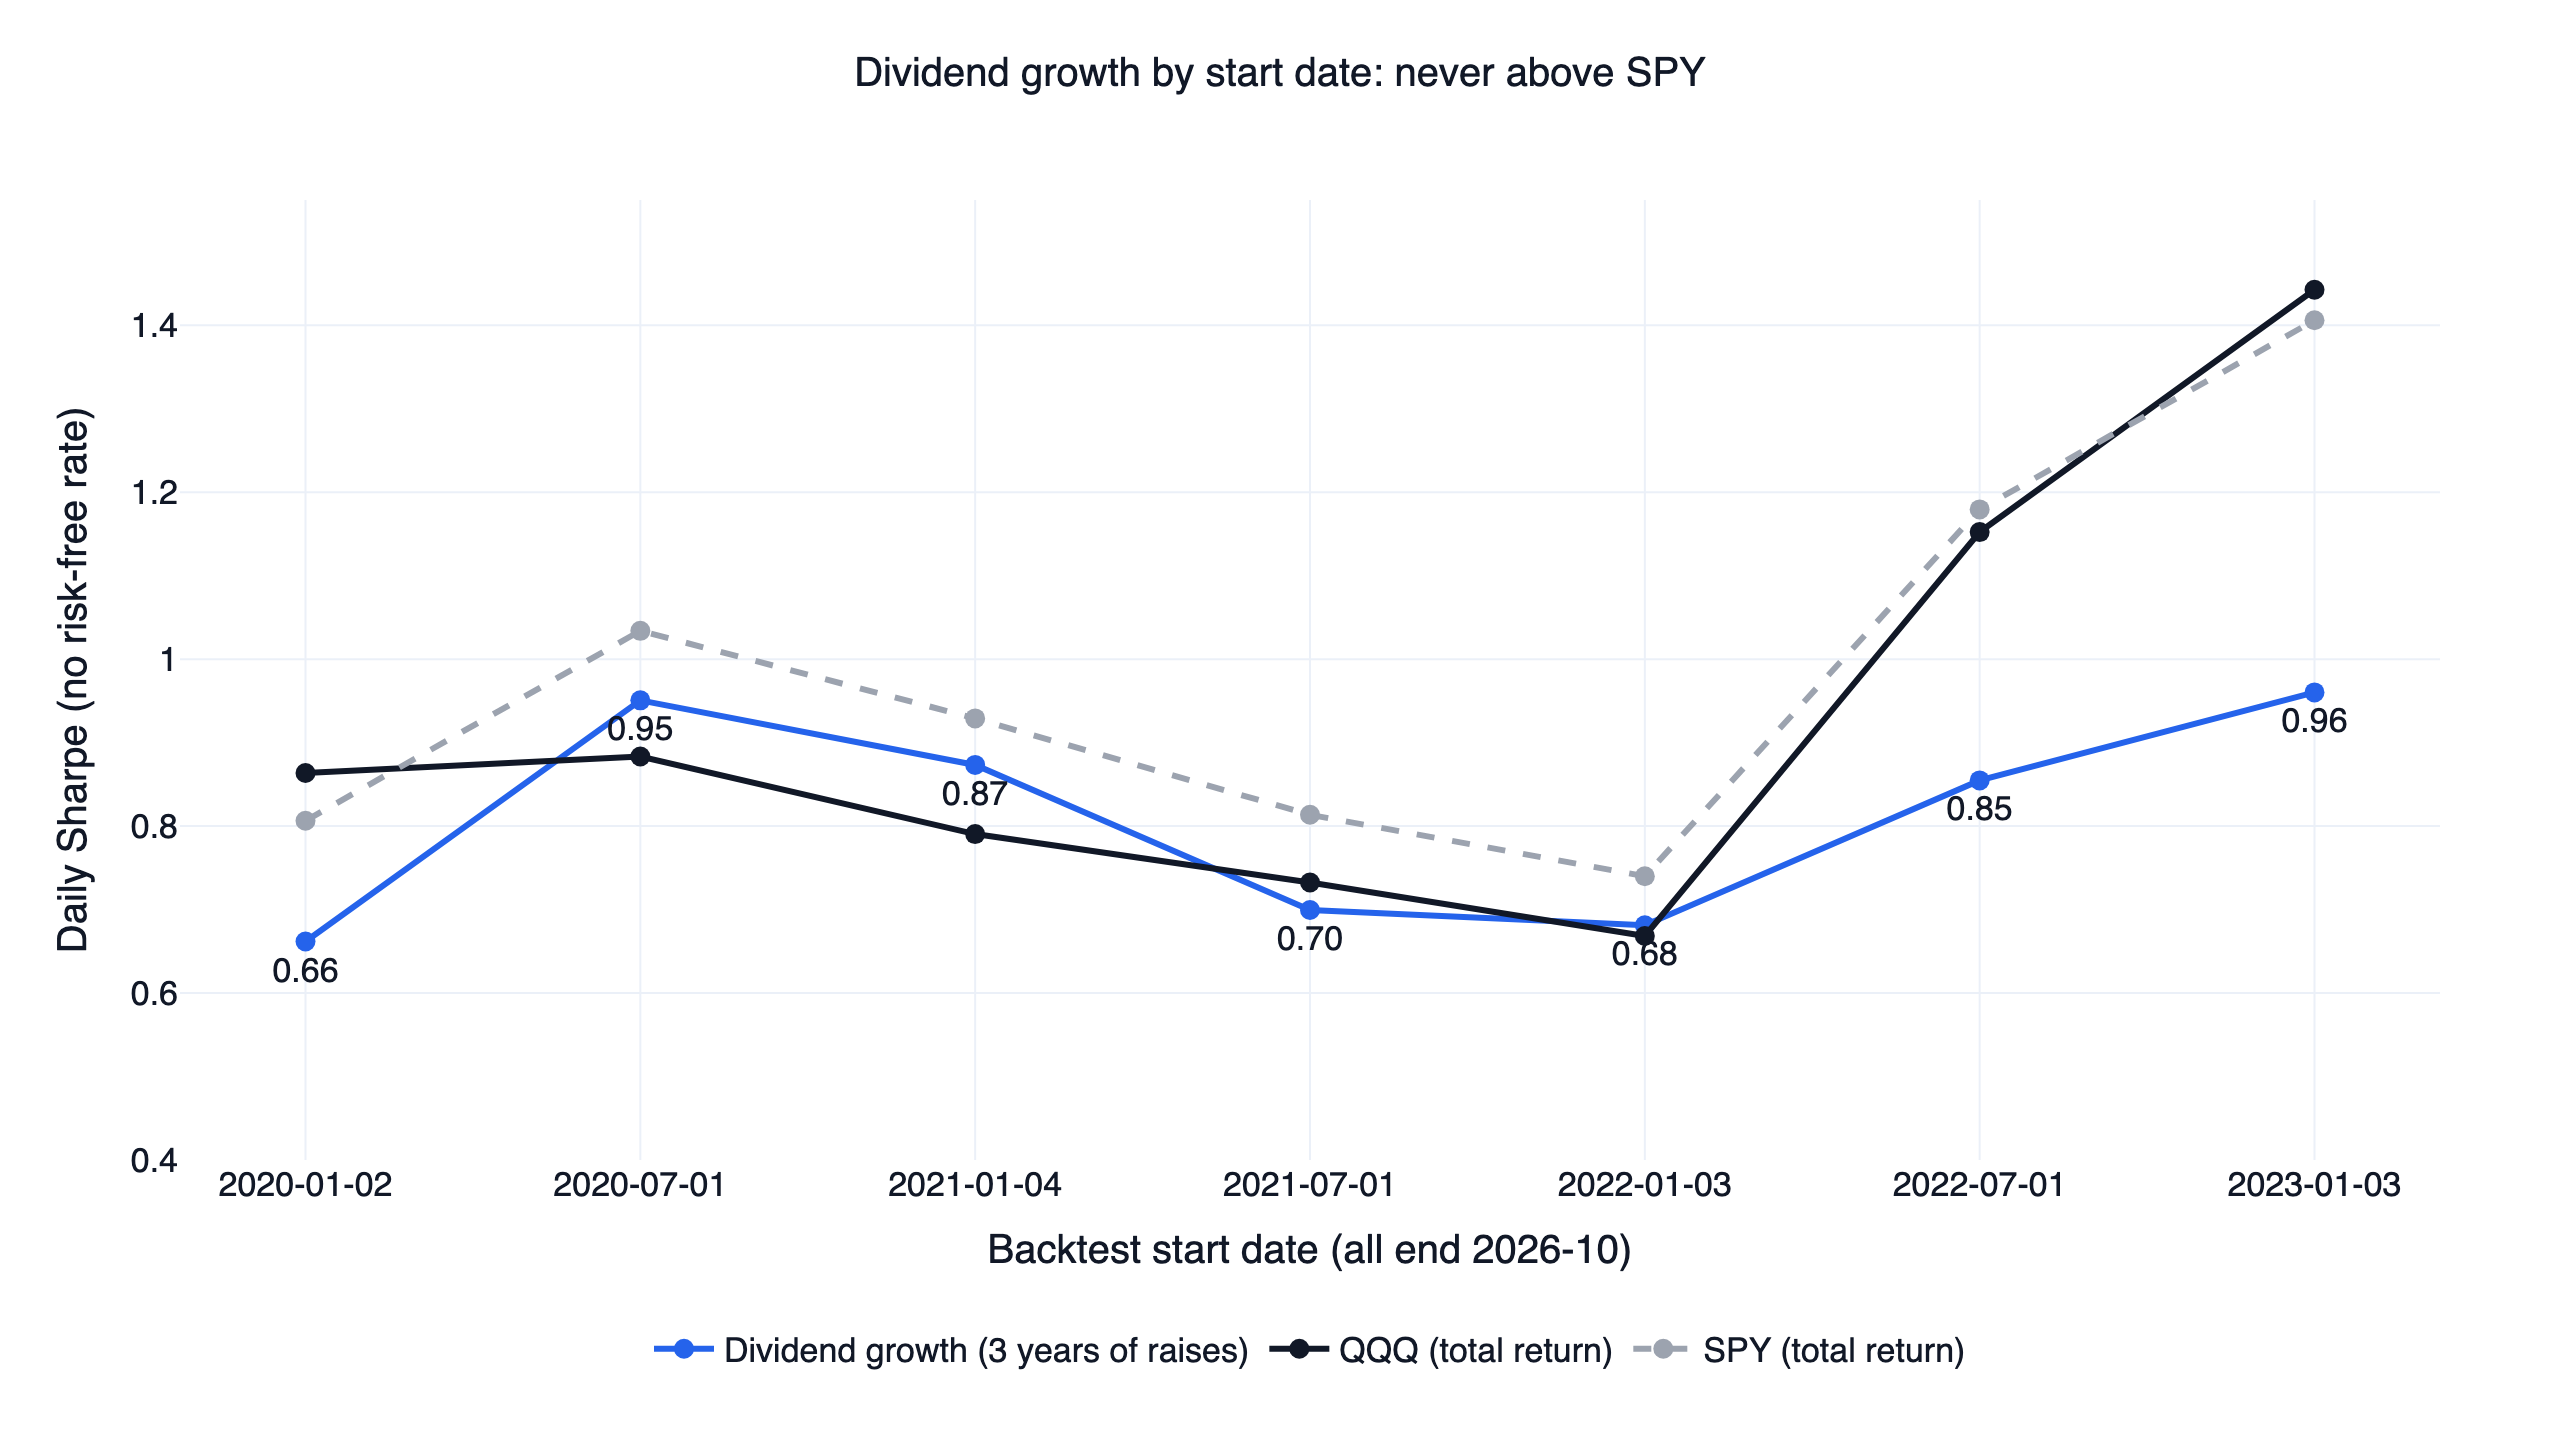
Does the result survive a different start date? We ran the same rule from seven start dates, every six months from January 2020 to January 2023. It beat QQQ from three of them (July 2020, January 2021, and by 0.01 from January 2022) and lost from the other four: 0.66 against 0.86 from January 2020, and 0.96 against 1.44 from January 2023. Starting in 2021 puts the 2022 bear market near the front of a short window, which is the part of the cycle where QQQ looks worst. SPY had a higher Sharpe than the dividend screen from every one of the seven start dates, and over 2021-2026 four of the five dividend ETFs we checked scored higher too: Vanguard Dividend Appreciation (VIG) 0.90, Schwab U.S. Dividend Equity (SCHD) 0.93, WisdomTree U.S. Quality Dividend Growth (DGRW) 0.98 and iShares Core Dividend Growth (DGRO) 1.00, while SPDR S&P Dividend (SDY) scored 0.77. Over the longer 2017-2026 window VIG, SCHD and DGRO scored 0.80 to 0.83, below QQQ's 0.90. Shorter dividend records that can be tested earlier also lost: one year of raises from 2018 scored 0.65 against 0.87, and two years from 2019 scored 0.74 against 0.97.
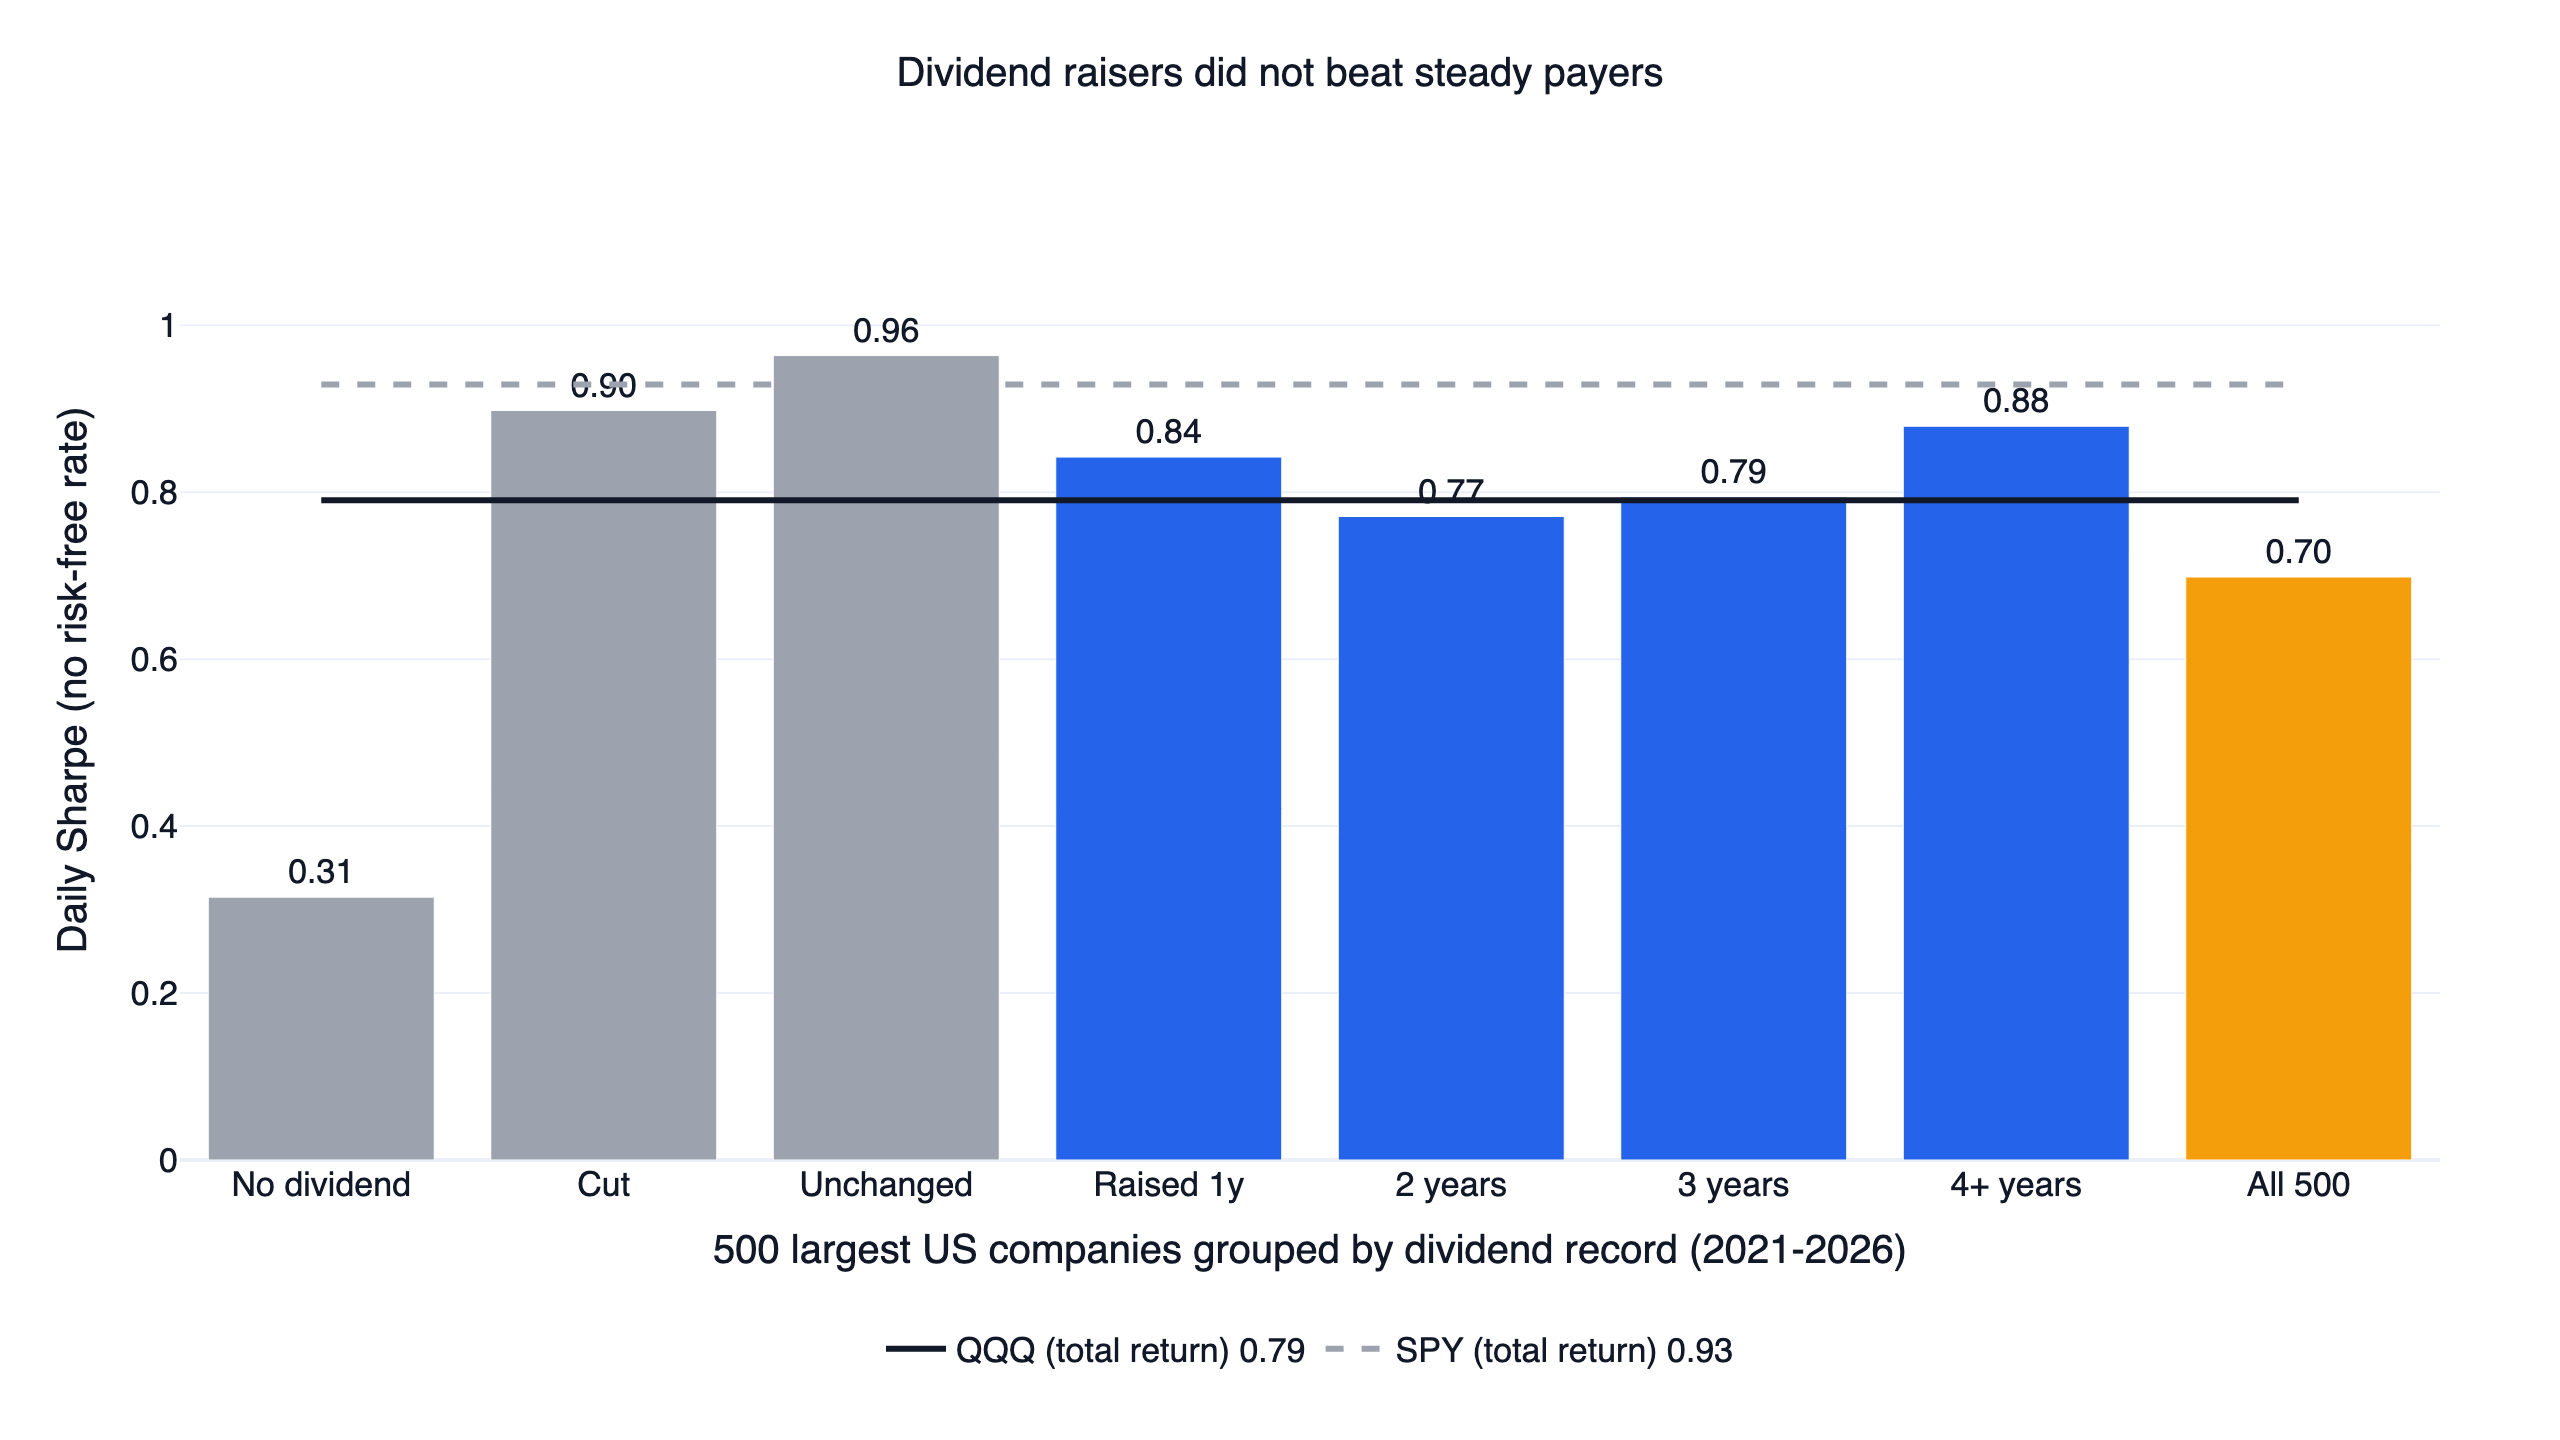
Is the dividend growth doing the work? Inside the same 500 companies, we grouped stocks by their dividend record and held each group equal weight over 2021-2026. Companies that paid no dividend scored 0.31 and dragged the whole 500 down to 0.70. Every dividend-paying group beat that, but the raisers were not the best of them: companies that held their dividend unchanged scored 0.96, companies that cut it 0.90, companies with one, two or three straight years of raises 0.84, 0.77 and 0.79, and four or more years 0.88, about what the screen itself scored (that group is most of its holdings; the others average 22 to 35 stocks). Over this window paying a dividend separated the groups; raising it every year added nothing on top.
So the rule passed our checks over the one window the data allows, but the margin depends on where that window starts, and SPY and most dividend ETFs did better over the same window without the screen. We do not count it as a working strategy.
Notes on each screen
Rule of 40. The screen is a bet on software staying in favour. Its best stretch was 2018-2020, its worst 2022 (-42.8%) and 2025 (-2.4% while QQQ rose 20.8%). Turnover was low, 0.85 of the portfolio a year, so costs barely mattered (0.66 with 0.1% per side).
Magic Formula. Healthcare was the largest weight (27%), then technology (19%). Rebalancing monthly (0.72) or once a year (0.65) did not help compared with quarterly (0.76). It beat QQQ in the second half (0.97 against 0.89) but scored 0.57 in the first.
CANSLIM. The portfolio held no stocks in 18% of weeks, mostly because of the market filter (SPY was below its 200-day average on 17% of days), which held the maximum drawdown to -28.1%; without it the drawdown was -40.7% and the Sharpe 0.58. The screen turned over about ten times a year, the most of the six, so 0.1% cost per side cut its Sharpe from 0.62 to 0.52 and its CAGR from 10.4% to 8.2%. Adding O'Neil's 8% stop loss changed almost nothing (0.63).
Graham number. Ten-year earnings stability and a 20-year dividend record, two of Graham's other defensive criteria, cannot be checked with data that starts in 2015, so this tests the valuation rule alone. Looser and tighter bars (P/E × P/B of 15 or 30) and bigger or smaller universes all landed between 0.47 and 0.60.
Equal-weight S&P 500. Monthly, quarterly and yearly rebalancing gave 0.68, 0.67 and 0.63. Using the 500 or 1,000 largest companies instead of the official member list did not change the conclusion.
The code
The core of the Rule of 40 test fits in a few steps: build the score from trailing statements, keep software companies worth at least $2 billion, and compare the monthly portfolio with QQQ.
Show Code
import finlab
from finlab import data
from finlab.backtest import sim

finlab.login()  # finlab guides you through login automatically
data.set_market("us")

# 1. Trailing-twelve-month revenue and free cash flow (dated by SEC filing date)
revenue = data.get("us_income_statement:revenue").rolling(4).sum()
free_cash_flow = data.get("us_cash_flow:free_cash_flow").rolling(4).sum()

# 2. Rule of 40 score = revenue growth + free-cash-flow margin
revenue_growth = revenue / revenue.shift(4) - 1
fcf_margin = free_cash_flow / revenue
rule_of_40 = revenue_growth + fcf_margin

# 3. Software companies worth at least $2 billion, trading above $5
profile = data.get("us_company_profile")
is_software = profile["industry"].isin(["Software - Application", "Software - Infrastructure"])
software = profile.loc[is_software & (profile["security_type"] == "common_stock"), "stock_id"]
large = (data.get("etl:us_market_value") >= 2e9) & (data.get("us_price:close") > 5)

# 4. Hold every software stock scoring 40% or more, equal weight, monthly
position = (rule_of_40 >= 0.40) & large
position = position[position.columns.intersection(software)]
report = sim(position.loc["2017-08-01":], resample="M", upload=False)

# 5. Daily Sharpe against QQQ (dividends reinvested) over the same days
equity = report.creturn
qqq = data.get("us_fund_price:adj_close")["QQQ"].reindex(equity.index).ffill()
for name, curve in [("Rule of 40", equity), ("QQQ", qqq)]:
    daily = curve.pct_change().dropna()
    print(name, round(daily.mean() / daily.std() * 252 ** 0.5, 2))
With data through 2026-10-27 this prints 0.64 and 0.89. Its curves start at the first monthly rebalance (2017-09-01), which is why QQQ reads 0.89 here and 0.90 in the table. The full research.py measures from 2017-08-01 and adds the $5 million volume floor, the ±50% filter and one share class per company, which gives the Rule of 40 its 0.67. It also builds the other five screens, and --grid and --extras reproduce every heatmap, half, cost run and dividend test in this article.
Install the FinLab skill for your AI agent
You do not need to write the code above yourself. Install the FinLab skill in Claude Code, Codex or Gemini CLI with one command:
Show Code
npx skills add https://github.com/koreal6803/finlab-ai --skill finlabThen ask your agent in plain language, for example "run Greenblatt's Magic Formula on the 500 largest US companies and compare it with QQQ" or "rerun the Graham number screen with financials included and check both halves of the window". The AI agent setup page walks through each tool, the AI-assisted setup connects your FinLab account, and the same research runs in the browser at studio.finlab.finance.
Backtest method and limits
| Item | How it was handled |
|---|---|
| Window | 2017-08-01 to 2026-10-27 for five screens, the first month with a year of filings and prices. Dividend growth: 2021-01-04 to 2026-10-27, the first day a four-year record of raises can be measured. |
| Universe | Common stocks from FinLab's US company profile, including later-delisted firms; one share class per company; no ADRs, ETFs or funds. Price above 5 million a day, and no ±50% day in the prior year. The equal-weight S&P 500 uses the official member list with no extra filters. Magic Formula, Graham number and dividend growth use US-based companies only, so statements and prices share a currency. |
| Look-ahead | Statement items enter on their SEC filing date. Market value, the S&P 500 member list and dividends are point-in-time. Sector, industry and security-type flags come from today's company profile, which is a small look-ahead for the sector exclusions and the Rule of 40 software list. The profile is refreshed daily, so rerunning research.py on a later date can move a Sharpe ratio by 0.01 or 0.02. |
| Weighting | Equal weight, no single-stock cap beyond that. Rule of 40, Graham number and dividend growth hold every stock that passes, so the count floats; Magic Formula holds 30; CANSLIM holds all passing stocks and goes to cash when SPY is below its 200-day average. |
| Rebalancing | Monthly (Rule of 40, Graham number, dividend growth), quarterly (Magic Formula, equal weight), weekly (CANSLIM). Trades at the next day's close. |
| Costs | finlab USMarket defaults: zero commission, zero tax. Each base setting was rerun with 0.1% per side. Slippage was not modelled. |
| Turnover | One-way, per year: Rule of 40 0.85, dividend growth 1.1, Magic Formula 1.2, Graham number 2.5, CANSLIM about 10. |
| Benchmark | QQQ total return, buy and hold, no costs; SPY and RSP for reference. Daily Sharpe without a risk-free rate. |
| Sample | All results are in-sample over about nine years (under six for dividend growth). The halves are a stability check, not out-of-sample validation. Capacity was not estimated. |
What this result does and does not say
It says that from 2017 to 2026, holding any of these six screens as a long-only US stock portfolio was a worse use of capital than QQQ on a risk-adjusted basis, under every nearby setting we tried, except for dividend growth in one short window that SPY also won. It does not say the methods are useless. Greenblatt's and O'Neil's results came from decades that did not include a market led by a handful of trillion-dollar technology companies, and most of these screens did pick better stocks than the pool they chose from. It also fits the broader evidence: McLean & Pontiff (2016) found that returns to 97 published stock predictors were 58% lower after publication.
For someone deciding whether to run one of these screens with real money, the practical reading is narrower: against an index as concentrated as QQQ, a famous name is not enough, and a single good window is not enough either. The US strategies on FinLab that did pass all three checks, such as the momentum study and the quality value backtest, use stock-level signals to decide when to hold leveraged Nasdaq ETFs rather than as a stock list, which adds leverage risk. The factor investing overview and the price-to-book study cover the academic versions of value and quality on the same data.
FAQ
Does the Magic Formula still work? Not against QQQ over 2017-2026. With 30 stocks from the 1,000 largest US companies it scored a daily Sharpe of 0.76 against 0.90, and none of 9 neighbouring settings won; the closest, 30 stocks from the 500 largest, reached 0.89. It did beat an equal-weight portfolio of its own universe (0.57).
Does the Rule of 40 predict stock returns? Among software companies above $2 billion, those passing the rule scored 0.67 against 0.57 for all of them, so it helped a little. It did not beat QQQ, and it fell 42.8% in 2022.
Does CANSLIM work as a screen? As a mechanical screen without O'Neil's chart-pattern judgement and without institutional ownership data, no: 0.62 against 0.90, and 0 of 27 settings beat QQQ. Its market filter did hold the maximum drawdown to -28.1%, the lowest of the five screens tested over the full window and below QQQ's -35.1%.
What is the Graham number formula? √(22.5 × earnings per share × book value per share). A price below it is the same as P/E × P/B below 22.5, Graham's limit of 15 times earnings and 1.5 times book. Holding every large US company under that line scored 0.51, the lowest of the six.
Do dividend growth stocks beat the market? Over 2021-2026 our three-year dividend growth screen beat QQQ (0.87 against 0.79) but not SPY (0.93), and it lost to QQQ from four of seven start dates. Companies that kept their dividend flat did better than those that raised it in that window.
Is equal weight better than market-cap weight for the S&P 500? Not over 2017-2026. The equal-weight S&P 500 scored 0.67 and compounded at 11.4% a year, against 0.84 and 14.8% for SPY, and it matched the RSP ETF almost exactly.
Why compare with QQQ instead of the S&P 500? QQQ is the benchmark FinLab uses for every US strategy, so results are comparable across the site. SPY is in the summary table and the main charts; all six screens trailed it over their own windows.
Can I rerun this myself?
Yes. Install the FinLab skill through the AI-assisted setup, download research.py below, and run python research.py --grid --extras.
Reproduce it yourself
- research.py: all six screens, the parameter grids, both halves, the cost runs and the dividend tests.
- data.csv: daily equity curves of the six base screens, plus QQQ, SPY and RSP.
- metrics.json: every statistic quoted in this article, including all 72 grid settings.
More US research is on the FinLab blog. The team behind it is on the about page, examples of what users build are on use cases, and metric definitions are in the glossary.
Last updated: 2026-10 | Backtest window: 2017-08 to 2026-10 (dividend growth 2021-01 to 2026-10) | Benchmark: QQQ total return | Author: FinLab Quant Research (reviewed by a quantitative researcher)
Past performance does not represent future results, and every result here is an in-sample backtest. This content is for education only, is not investment advice, and does not constitute investment advice.
FinLab AI
Want to build your own strategy?
Describe your stock-picking ideas in natural language. AI automatically validates, backtests, and gives you answers
Start Free