Run this strategy
Copy the prompt to reproduce the evidence above with the article’s data, assumptions, and risk checks.
Tell your AI:
Set up FinLab and rerun the S&P 500 52-week high backtest against QQQ and RSP. Please read: https://finlab.finance/en/setup?relatedUrl=/en/blog/52-week-high-stocks-backtest
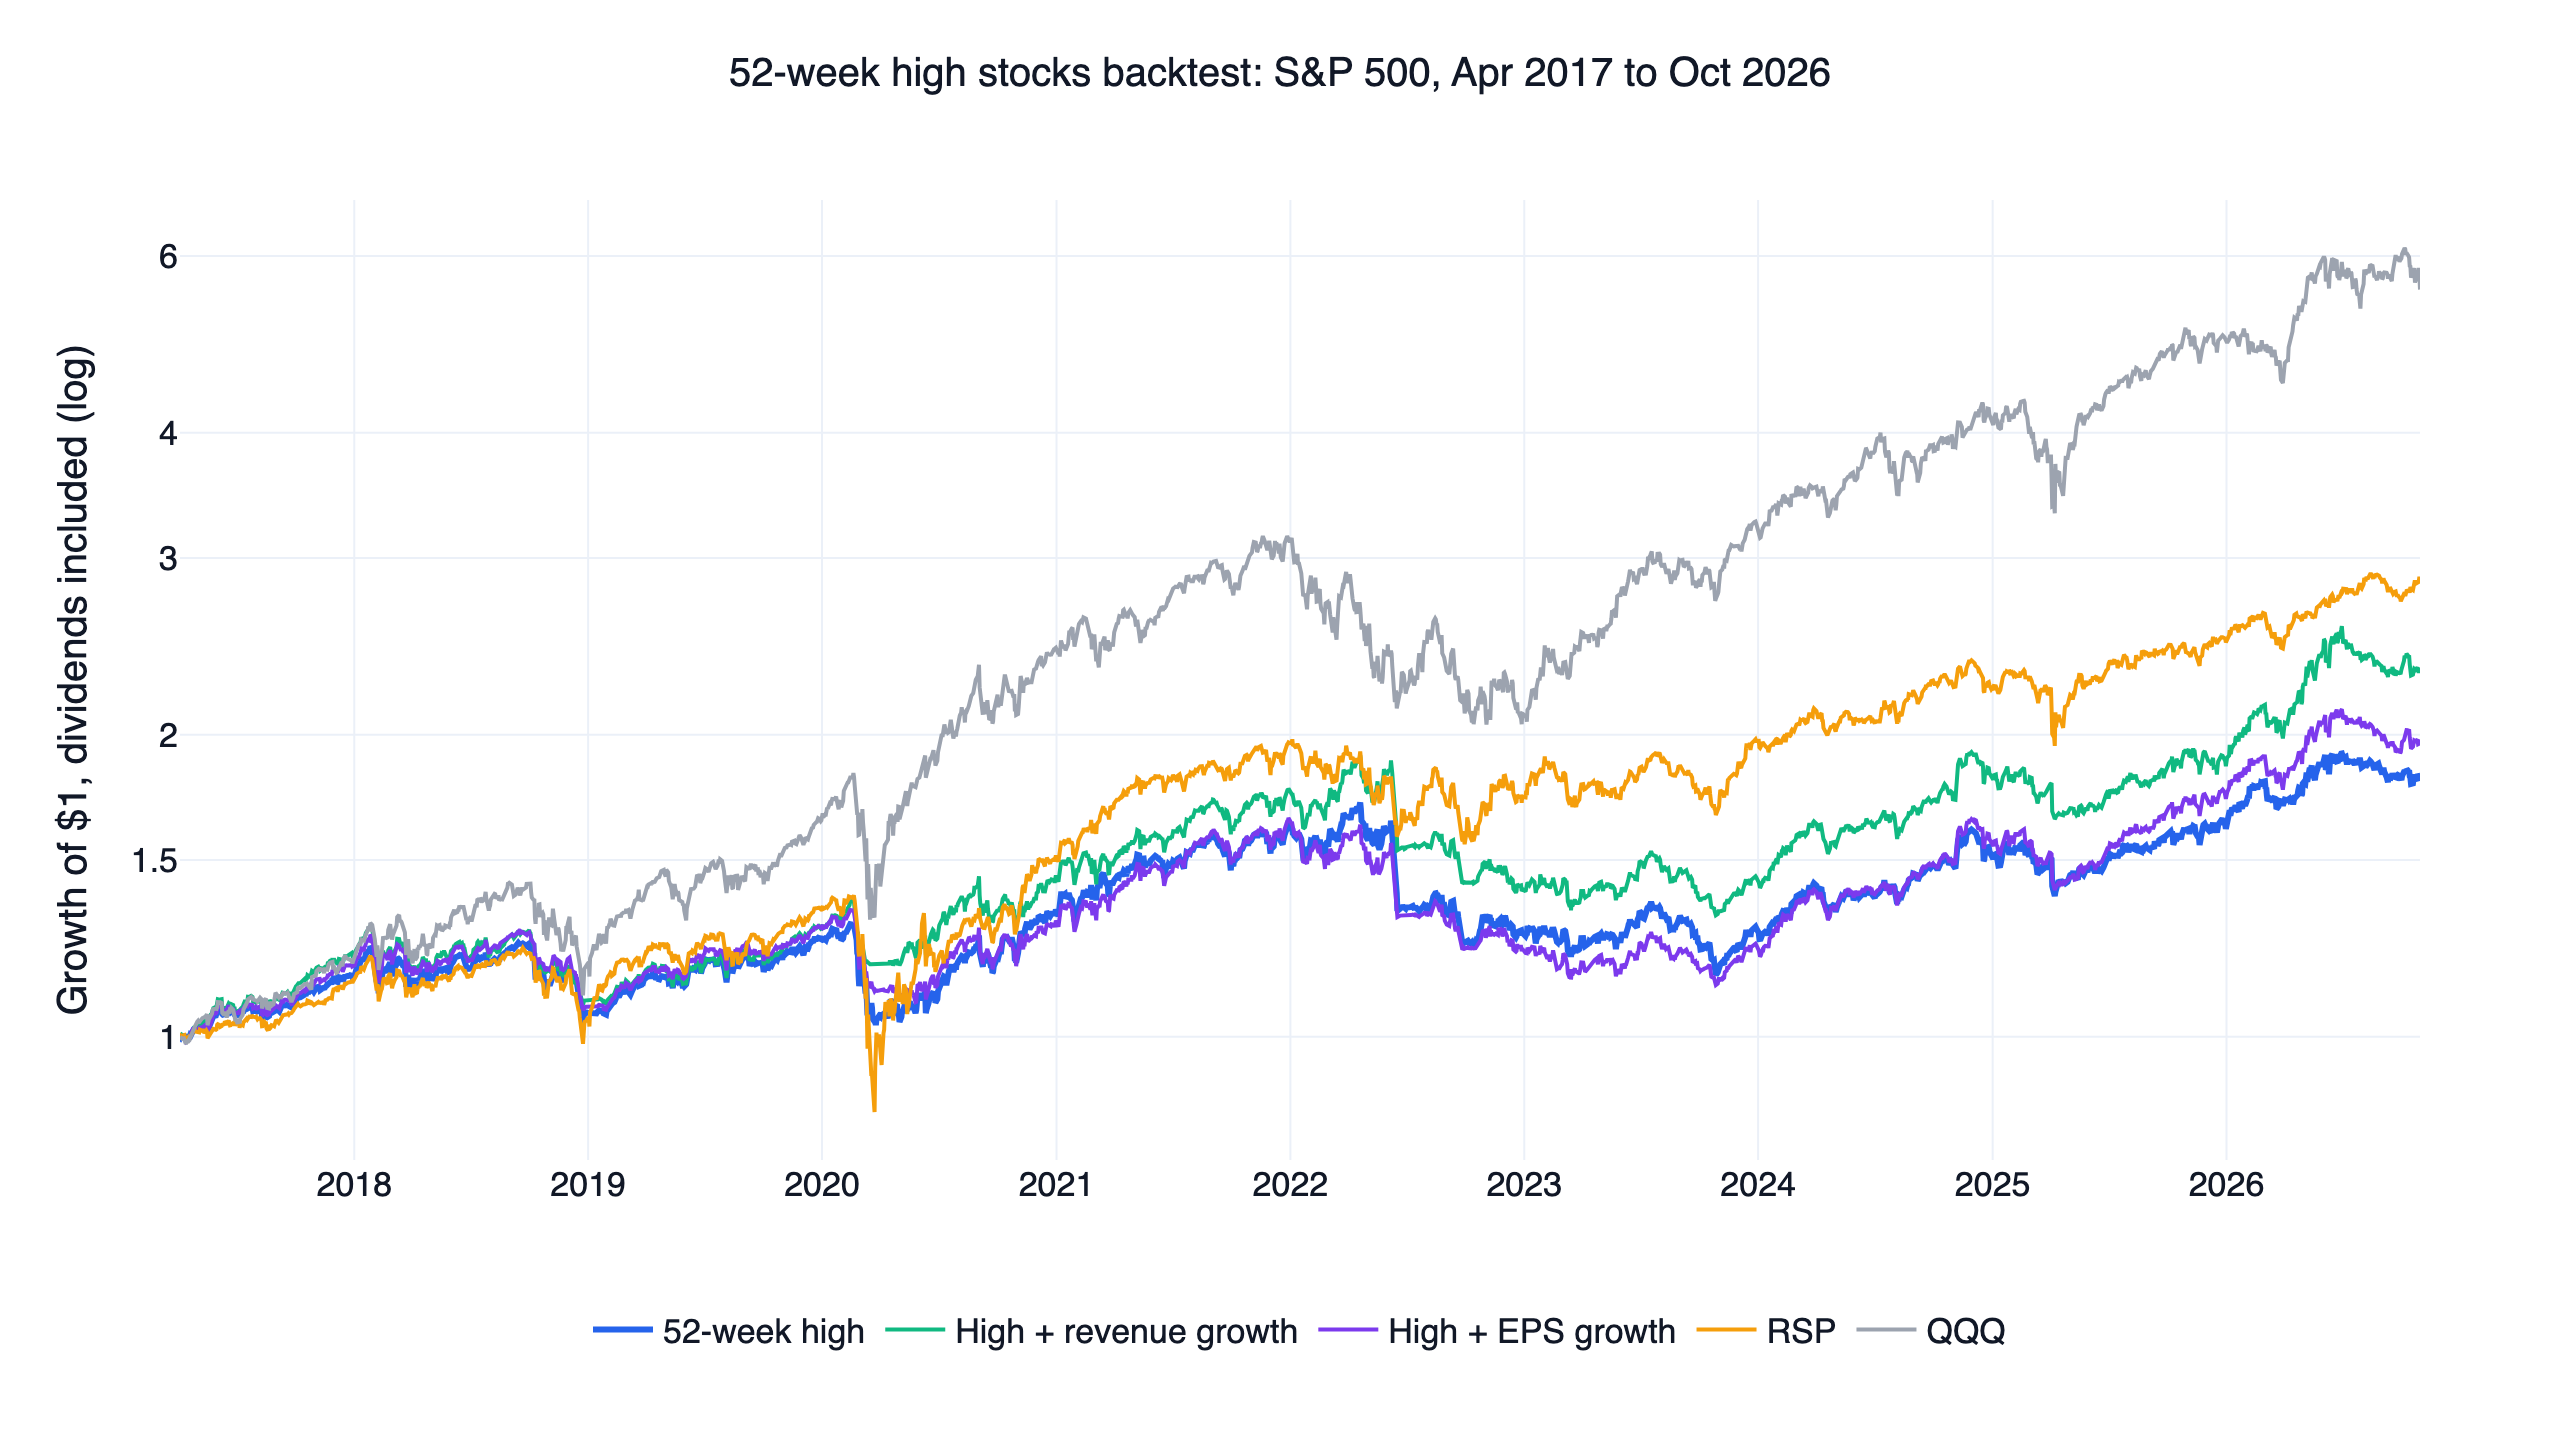
Buying S&P 500 stocks when they close at a 52-week high and selling when they drop below their 50-day average returned 6.4% a year from April 2017 to October 2026, with a daily Sharpe ratio of 0.51. QQQ with dividends returned 19.6% at 0.89, and RSP, the equal-weight S&P 500 ETF, returned 11.6% at 0.68. A revenue growth filter lifted the rule to 9.2% and 0.66, and an EPS filter to 7.3% and 0.57. None of the 63 settings beat QQQ, and at 0.1% cost per side the plain rule falls to 3.7% a year.
A stock at a 52-week high has real strength behind it, and the research on that is solid. This rule still lost to simply owning every S&P 500 stock at equal weight.
The 52-week high rules at a glance
| Design | Daily Sharpe | CAGR | Max drawdown | Beat QQQ | Beat RSP | First / second half Sharpe | Sharpe at 0.1% per side |
|---|---|---|---|---|---|---|---|
| 52-week high | 0.51 | 6.4% | -32.7% | 0 / 9 | 0 / 9 | 0.74 / 0.27 | 0.33 |
| High + revenue growth | 0.66 | 9.2% | -30.8% | 0 / 27 | 3 / 27 | 0.86 / 0.48 | 0.50 |
| High + EPS growth | 0.57 | 7.3% | -31.9% | 0 / 27 | 0 / 27 | 0.78 / 0.38 | 0.40 |
| RSP, total return | 0.68 | 11.6% | -39.0% | reference | 0.78 / 0.57 | ||
| SPY, total return | 0.84 | 14.7% | -33.7% | reference | 0.93 / 0.75 | ||
| QQQ, total return | 0.89 | 19.6% | -35.1% | benchmark | 1.11 / 0.69 |
All lines run from 2017-04-04 to 2026-10-30, with dividends reinvested. The halves split at 2022-01-13.
How a rule had to pass
"Beat" means a higher daily Sharpe ratio than QQQ with dividends reinvested, over exactly the same trading days. Sharpe here is the mean daily return over its standard deviation, annualised with √252, with no risk-free rate subtracted. All conditions were fixed before any result was seen.
- Neighbouring settings. Every main parameter took its original value and one value either side, and at least 70% of the settings had to beat QQQ.
- Both halves. The window was cut at its midpoint, and the original setting had to win in each half.
- Costs. The original setting had to win at finlab's default US cost of zero and at 0.1% per side.
- No single year. It had to stay ahead after removing the calendar year of its largest lead.
- Cash. These rules can sit in cash, so they also had to beat QQQ on returns above T-bills (BIL).
- Filters must add. The two growth versions had to beat the plain rule at their original settings.
The growth filters cleared the last test. Everything else failed, and by a wide margin.
The three designs
The idea traces to George and Hwang (2004), who found that closeness to the 52-week high explains a large part of momentum profits, and that those gains do not reverse in the long run. Their explanation is anchoring: investors hesitate to bid a stock past a level they remember, so good news gets priced in slowly. Bhootra and Hur (2013) refined this: among stocks near their high, those that set it more recently did better. Jegadeesh and Titman (1993) is the starting point for the wider momentum literature. Both papers rank stocks and hold portfolios for fixed periods. We test the version retail traders usually mean: a stock breaks out, and you ride it until the trend ends.
- 52-week high. Buy an S&P 500 member when its adjusted close is the highest of the last L trading days. Sell when it closes below its M-day average or leaves the index. L is 200, 252 or 300, and M is 20, 50 or 100.
- High + revenue growth. As above, but entries also need the latest filed quarter's revenue up at least g on a year earlier. g is 5%, 10% or 20%.
- High + EPS growth. Entries instead need quarterly EPS up at least g on a year earlier, positive in both quarters. g is 10%, 20% or 30%.
Holdings are equal weight with a 5% cap on any stock, so the portfolio keeps cash when fewer than 20 stocks qualify. With three parameters each, the growth versions have 27 settings, which makes 63 in total.
Result 1: the rule lost to equal weight as well as QQQ
The plain rule beat neither QQQ nor RSP nor SPY in any setting. RSP is the fairer yardstick, since 100-plus equal-weight stocks look far more like RSP than like a cap-weighted technology fund. Against RSP it gave up 5.1 points of return a year.
Its maximum drawdown was smaller than RSP's, -32.7% against -39.0%, but that figure flatters it. The drawdown ran from 2022-04-20 to 2023-10-27, a stretch when RSP fell 13.6% and QQQ rose 2.3%, and at 0.1% per side it deepens to -35.9%, past QQQ's -35.1%. The rule trailed RSP by more than 10 points in 2019, 2022 and 2023, and its Sharpe fell from 0.74 in the first half to 0.27 in the second.
| Year | 52-week high | RSP | QQQ |
|---|---|---|---|
| 2017 (from April) | 14.9% | 13.2% | 18.4% |
| 2018 | -8.0% | -7.8% | -0.1% |
| 2019 | 18.3% | 28.9% | 39.0% |
| 2020 | 7.1% | 12.7% | 48.6% |
| 2021 | 21.4% | 29.4% | 27.4% |
| 2022 | -22.0% | -11.6% | -32.6% |
| 2023 | 1.2% | 13.7% | 54.9% |
| 2024 | 17.5% | 12.8% | 25.6% |
| 2025 | 6.9% | 11.2% | 20.8% |
| 2026 (to October) | 12.8% | 15.3% | 12.8% |
Result 2: what the trades look like
Across 7,702 closed trades, 39.0% made money. The average trade gained 0.86%, the median lost 1.78%, and the median holding time was 30 trading days. So the typical trade is a small loss, and the rule depends on a minority of long runs to pay for it. That shape is normal for trend following. Here the average gain was too small to carry the portfolio.
The largest single gap came after the March 2020 low. A stock has to reach a 52-week high to be bought, and few can right after a crash. From 2020-03-23 to 2020-06-30 the rule gained 7.1% while RSP gained 42.6%, holding 39 stocks on average.
Exit length shows no simple pattern. Across the three lookbacks in the plain rule, a 20-day exit scored 0.52 to 0.59, a 50-day exit 0.49 to 0.56 and a 100-day exit 0.62 to 0.66, so the original 50-day choice happened to be the weakest.
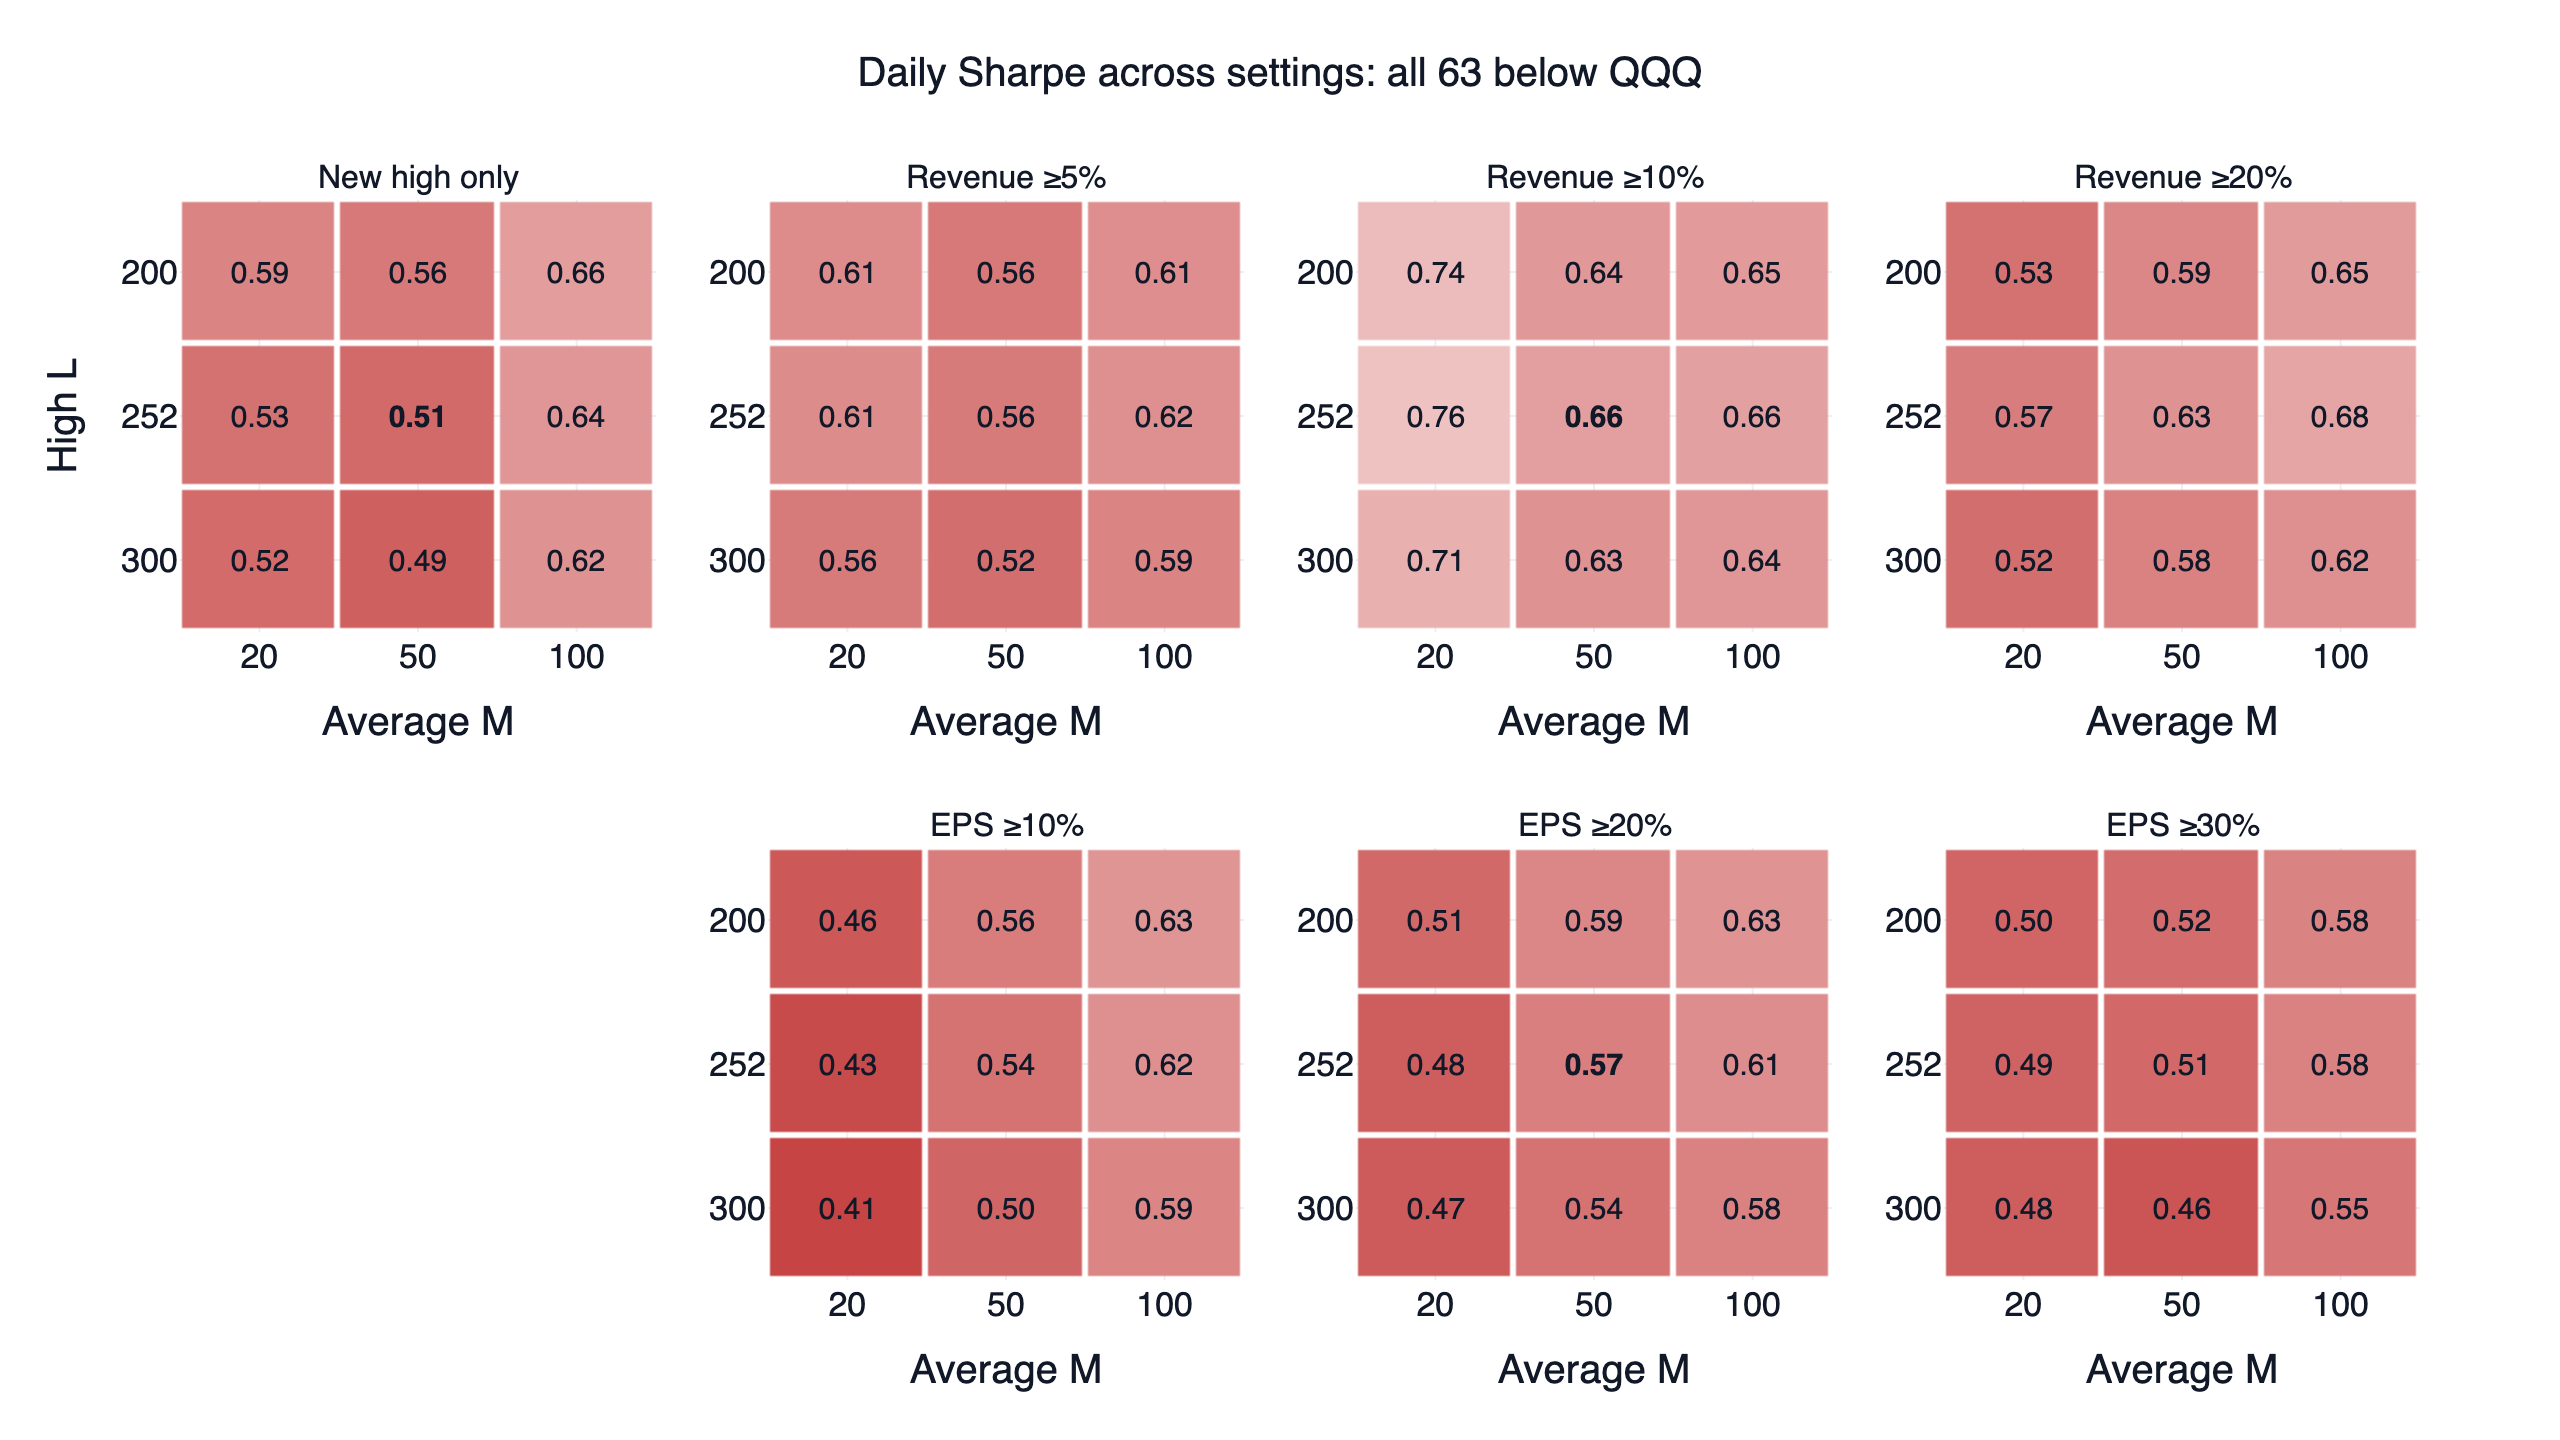
Bold marks the original settings. Every cell is below QQQ, and the closest was 0.76 against 0.89. The three cells that beat RSP are the revenue filter at 10% with a 20-day exit. That cluster is three of 63, it was found by looking, and the 5% and 20% filters next to it do not share the result, so it is a weak basis for a new rule.
Result 3: revenue growth helped more than EPS, and costs took much of it back
At the original settings both filters raised the Sharpe. Across all settings the picture differs. Compared with the plain rule at the same lookback and exit, the revenue filter was ahead in 19 of 27 settings and the EPS filter in 6 of 27, all six with the 50-day exit. The revenue version held about 47 stocks instead of 116. With the 20-day exit the EPS filter scored lowest of all, 0.41 to 0.51 across its nine settings.
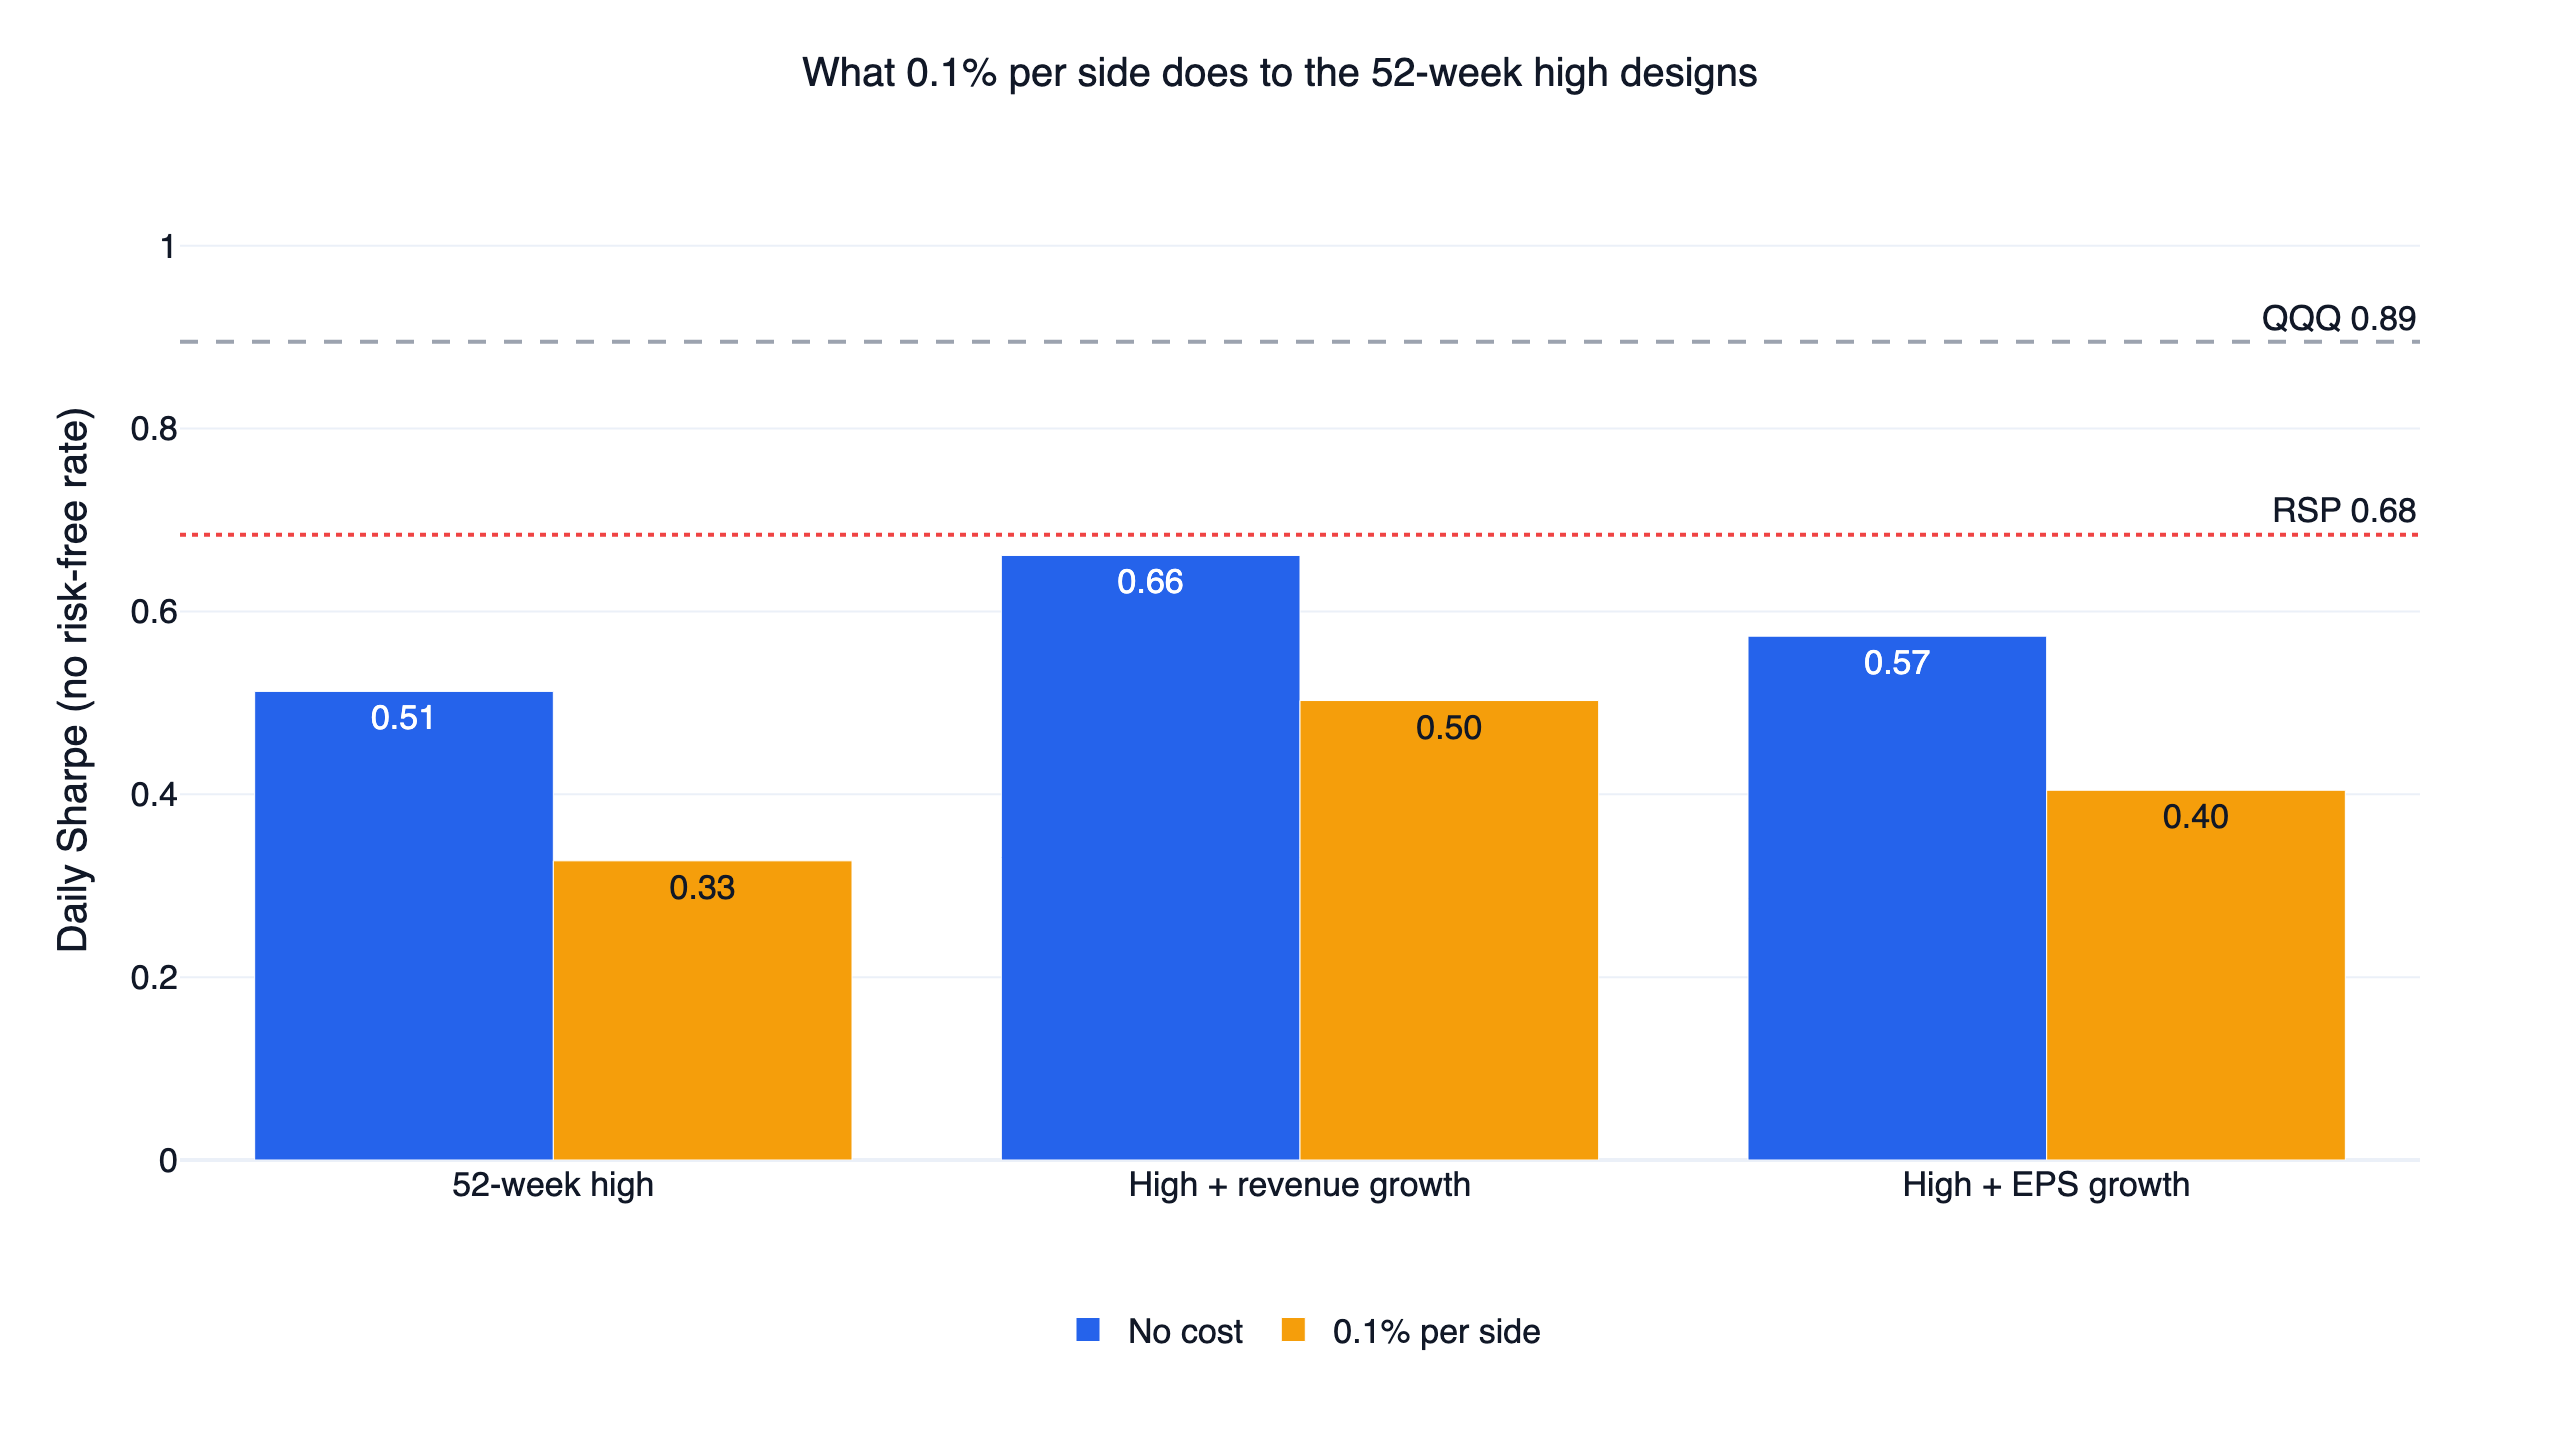
Cost is where these rules differ most from a buy-and-hold fund. The portfolio holds around 116 stocks, each for about 30 trading days, and rebalances to equal weight as names come and go, so its target weights turn over about 13 times a year. At 0.1% per side the plain rule falls from 6.4% to 3.7% a year, nearly 3 points lost, and its Sharpe from 0.51 to 0.33. The revenue version falls from 9.2% to 6.6%. The 0.1% stands in for the spread and slippage that high turnover pays even at a commission-free broker; we did not estimate them separately.
How many S&P 500 stocks hit a 52-week high each day
On a typical day the answer is small. The median was 24 stocks and the mean 30, out of about 500. The record in this window was 177, on 2018-01-26. The monthly average fell to 2.0 in March 2020 and 2.1 in September 2022, and fewer than five stocks made a new high on 13.8% of days.
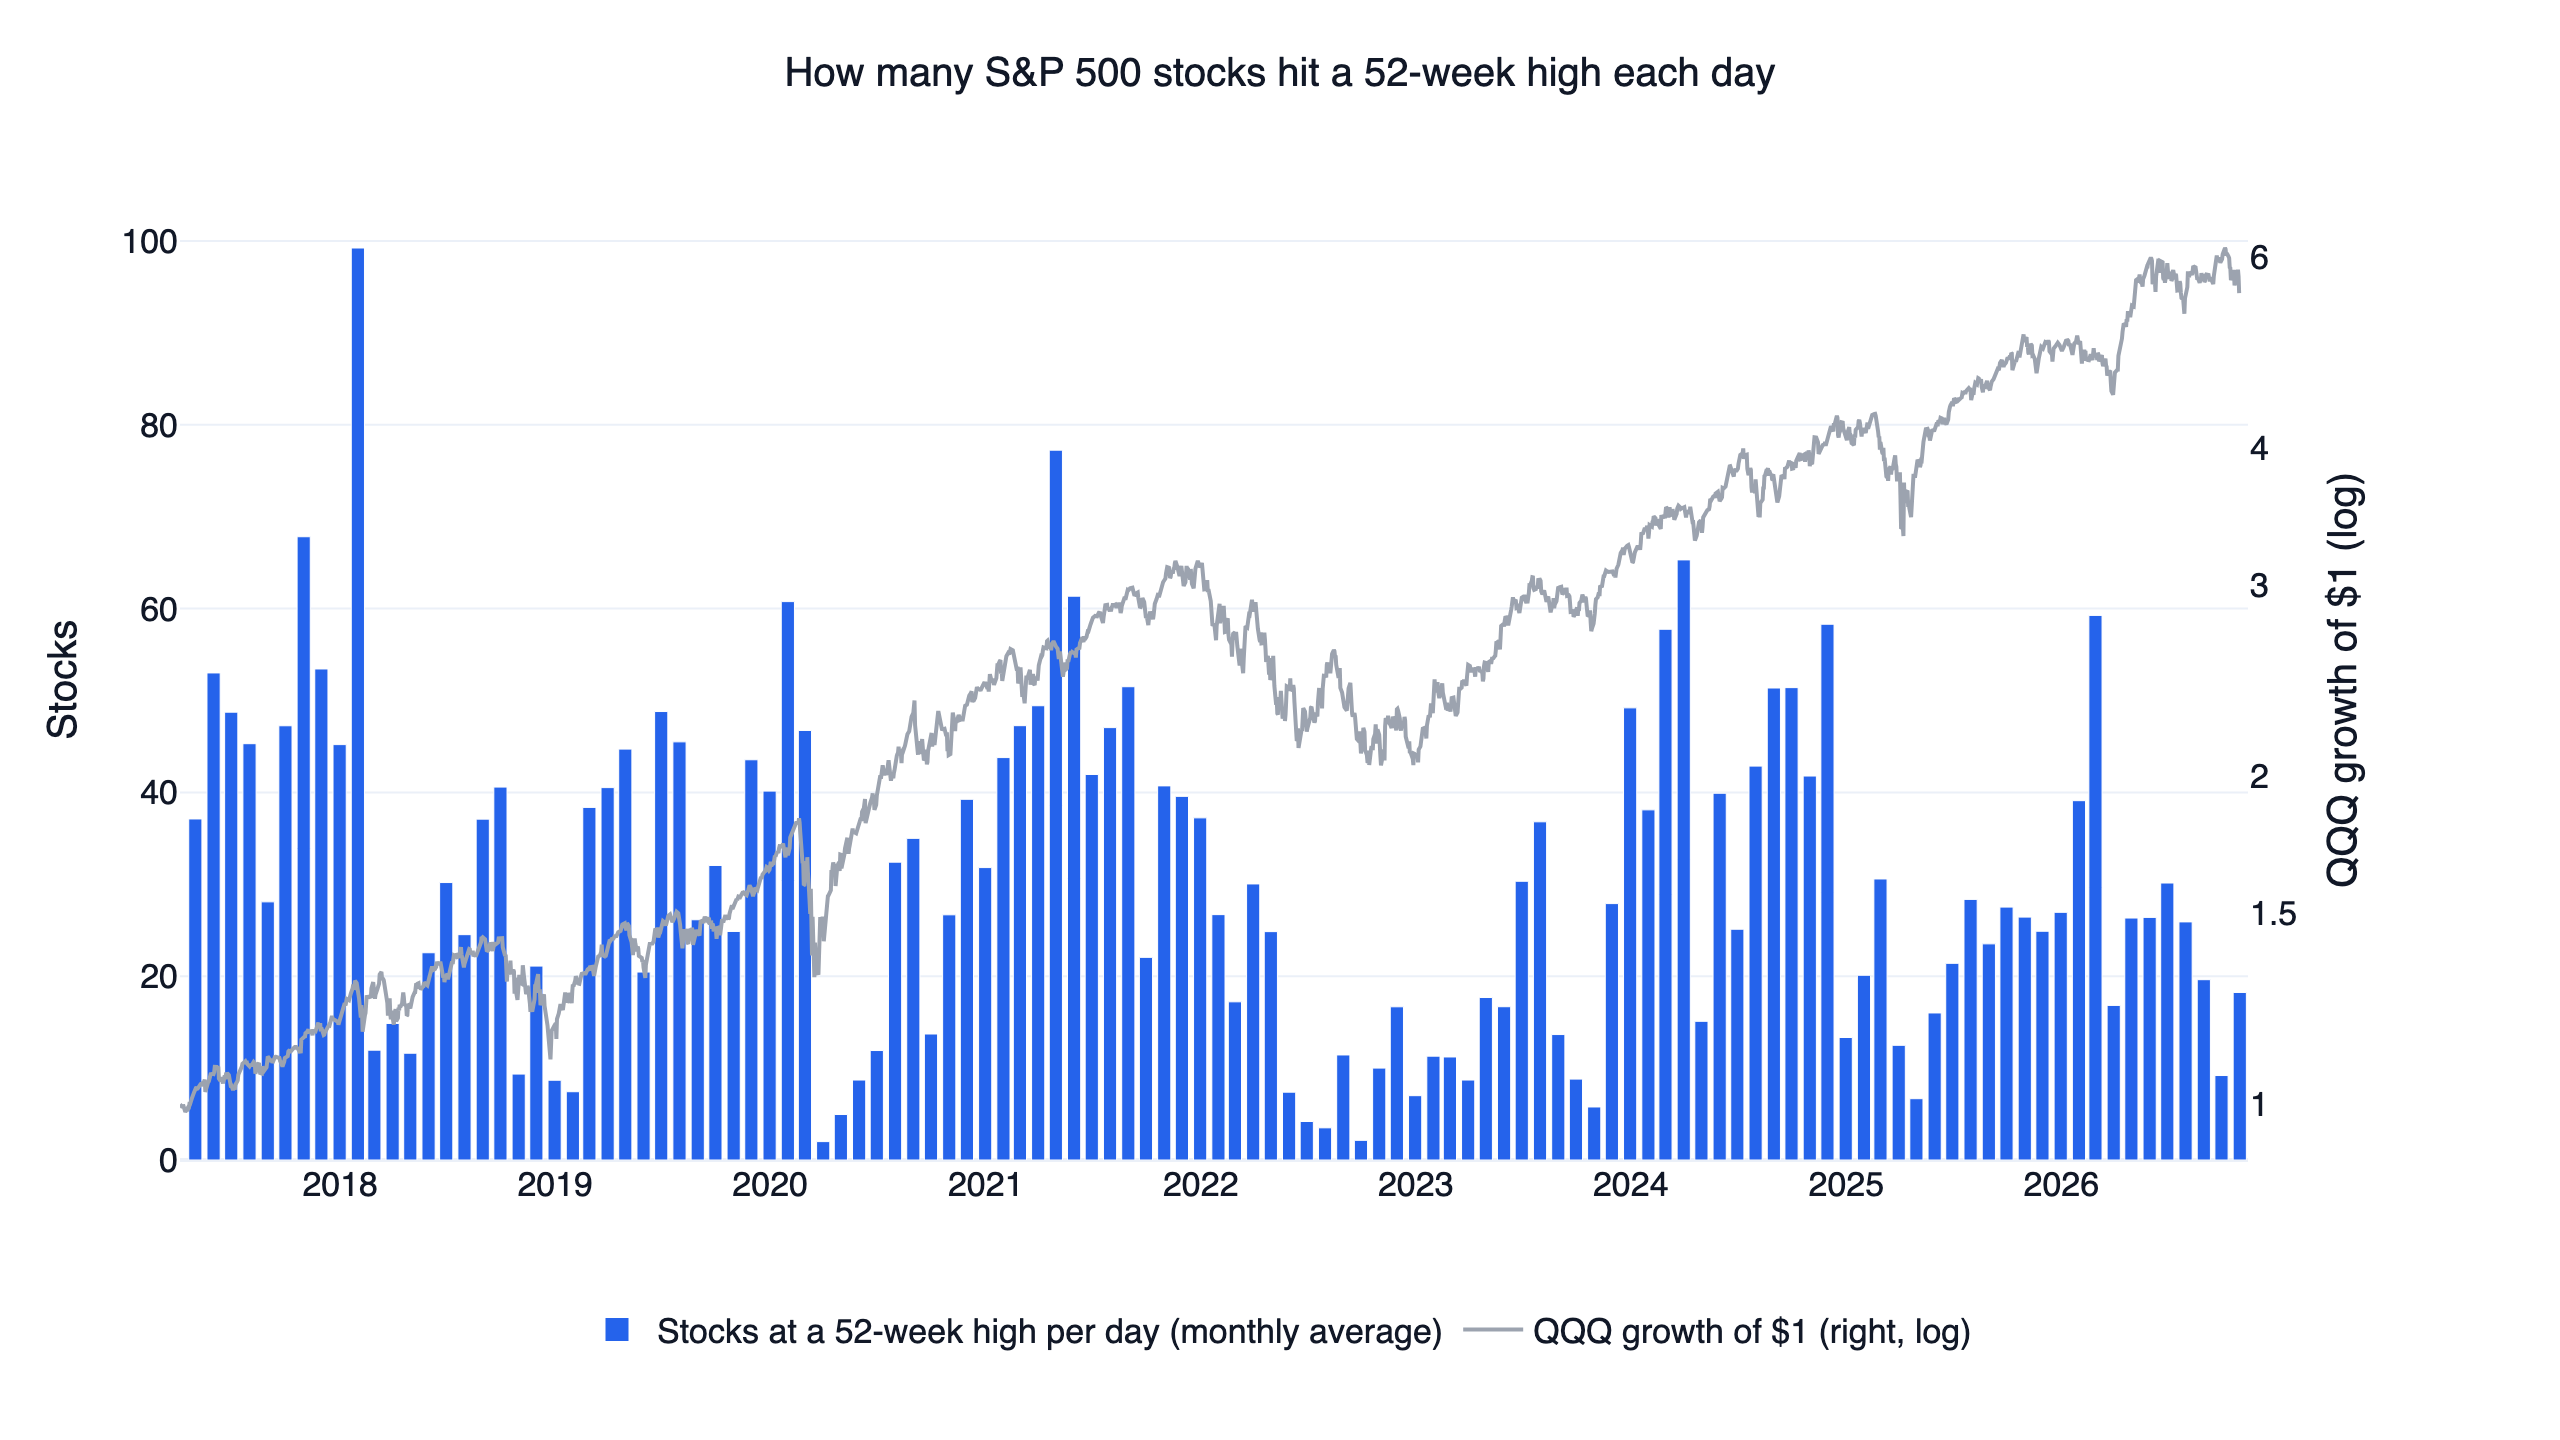
The count is high in advances and near zero in sell-offs. The highest monthly average of the window, 99 stocks a day, came in January 2018. Holdings ranged from 1 stock to 299, averaging 116. The 5% cap kept the portfolio about 97% invested on average, and the rest went to cash in the thin stretches.
How this differs from the 52-week high factor
Our US academic factors backtest tested the George and Hwang measure directly: each month, hold the 30 liquid stocks closest to their high. Over a similar window that scored a Sharpe of 0.64 and 10.8% a year, also 0 of 9 against QQQ. The event rule here scored 0.51 with the 50-day exit and 0.64 with the 100-day exit, so the two approaches land in a similar range. Both fall short of QQQ. The universes and windows differ, so treat this as a rough comparison.
We also tested breakouts on a single index. The QQQ breakout strategy uses 21-day highs to time leveraged ETFs, which is a different design with its own risks.
The code
This is the plain rule. On data through October 2026 it printed the headline 0.51. research.py also keeps one share class per company and adds both growth filters.
Show Code
import finlab
from finlab import data
from finlab.backtest import sim

finlab.login()
data.set_market("us")

close = data.get("us_price:adj_close")
members = data.get("us_index_constituents:sp500").astype(bool)

# Keep tickers in both tables and line the members up with trading days
tickers = members.columns.intersection(close.columns)
close = close[tickers]
members = members[tickers].reindex(close.index, method="ffill").fillna(False).astype(bool)

# Buy a new 252-day closing high, sell below the 50-day average or on leaving the index
entries = (close >= close.rolling(252).max()) & members
exits = (close < close.rolling(50).mean()) | ~members
position = entries.hold_until(exits).loc["2017-04-03":]

# Equal weight, at most 5% in a stock, traded at the next close
report = sim(position.loc[:, position.any()], position_limit=0.05, trade_at_price="close",
             market="us", upload=False)

returns = report.creturn.pct_change().dropna()
print("Daily Sharpe:", round(returns.mean() / returns.std() * 252 ** 0.5, 2))
Install the FinLab skill for your AI agent
You do not need to write this yourself. Install the FinLab skill in Claude Code, Codex or Gemini CLI with one command:
Show Code
npx skills add koreal6803/finlab-ai --skill finlab -g -yThen ask your agent in plain language, for example "rerun the 52-week high rule with a 100-day exit" or "add a free cash flow filter to the new-high entries". The agent setup page has the details, and FinLab Studio runs the same research in a browser.
Backtest method and limits
| Item | How it was handled |
|---|---|
| Window | 2017-04-03 to 2026-10-30, the first month start with 300 days of prices. The plain rule holds 160 stocks on day one; the growth versions start with 12 and 13 and hold cash until more qualify |
| Universe | Each day's S&P 500 members, one share class per company. 13 of the 505 members on 2017-04-03 have no price that day in FinLab and are skipped. Some of those later failed, which leans results slightly upward |
| Liquidity | No filter beyond index membership. Capacity is not estimated |
| Turnover | About 13 times a year for the plain rule and 12 for the growth versions, on target weights |
| Prices | Adjusted closes, so a "high" counts dividends. A raw-price high can fall on a slightly different day |
| Fundamentals | Dated by filing date, with quarters that have no growth figure failing the filter (look-ahead bias control) |
| Weights | Equal, capped at 5% a stock, re-equalised on days the list changes; cash earns nothing |
| Execution | Signal at a close, traded at the next close |
| Cost | finlab sim() default US cost of zero, plus a rerun at 0.1% per side. Slippage is not estimated |
| Taxes | None |
| Sample | Whole window in-sample. The halves only check stability; no out-of-sample test was run |
What this result does and does not say
The conclusion is limited to this rule in this window. It does not contradict the academic finding, which is about ranking stocks by distance to the high over a much longer history. It says that the common retail version, buying the breakout and exiting on a moving average, did not pay on large US stocks from 2017 to 2026.
The window also favoured concentration. QQQ is weighted by company size, and an equal-weight portfolio with a 5% cap cannot match that by design. The comparison with RSP removes that advantage, and the rule still fell short. For other momentum work, see the 12-1 momentum backtest, and for filters applied to the same stocks, the six famous stock screens, including CANSLIM, which also uses new highs and EPS growth.
FAQ
What is a 52-week high?
The highest price of a stock over the past year, about 252 trading days. This study uses closing prices adjusted for dividends and splits, not intraday highs.
Are 52-week high stocks a good buy?
Not with this rule. Buying each new high in the S&P 500 and selling below the 50-day average returned 6.4% a year, behind RSP at 11.6% and QQQ at 19.6%. The win rate was 39.0%.
How many S&P 500 stocks hit a 52-week high on a typical day?
About 24, the median from 2017 to 2026, or roughly 5% of the index. The highest single day here was 177.
Does adding revenue or earnings growth help?
Revenue growth helped in most settings: 19 of 27 beat the plain rule, and a 10% filter raised the Sharpe from 0.51 to 0.66. EPS growth helped in 6 of 27. Both remain below RSP at 0.68 on their original settings.
Which moving average works best for the exit?
Among the three tested in the plain rule, the 100-day average scored highest and the 50-day lowest, 0.62 to 0.66 against 0.49 to 0.56. None of them got close to QQQ.
Does buying near the high work better than buying the breakout?
Not clearly. The monthly ranking in the factor backtest scored 0.64, and the breakout rule scored 0.51 with a 50-day exit and 0.64 with a 100-day exit. Different windows and universes apply.
Is this rule safer than holding QQQ?
Its maximum drawdown of -32.7% was smaller than QQQ's -35.1%, but with 0.1% cost per side it was deeper, at -35.9%, and it earned far less. On returns above T-bills it scored 0.34 against 0.79 for QQQ.
Can I rerun this?
Yes. Install the FinLab skill through the AI-assisted setup, download research.py below and run python research.py.
Reproduce it yourself
- research.py: all three designs, the 63 settings, both halves, the cost runs and trade statistics.
- data.csv: daily equity curves of the three rules, plus QQQ, SPY and RSP.
- metrics.json: the statistics behind this article, including the monthly count of new highs.
The US strategy comparison collects the rest of the US research. New research is on the FinLab blog, the team is on the about page, and examples are on use cases. For other fixed rules, see the Dogs of the Dow backtest and the golden cross stocks backtest.
Disclaimer: this article is for education only and does not constitute investment advice. Past performance does not guarantee future results, and investing involves risk. All results are in-sample, and the two halves were not validated out of sample.
Last updated: 2026-11 | Backtest window: 2017-04 to 2026-10 | Data through 2026-10-30, rerun 2026-11-01 | Benchmark: QQQ total return | Author: FinLab Quant Research (reviewed by a quantitative researcher)
FinLab AI
Want to build your own strategy?
Describe your stock-picking ideas in natural language. AI automatically validates, backtests, and gives you answers
Start Free