Run this strategy
Copy the prompt to reproduce the evidence above with the article’s data, assumptions, and risk checks.
Tell your AI:
Set up FinLab and rerun the S&P 500 golden cross backtest and event study. Please read: https://finlab.finance/en/setup?relatedUrl=/en/blog/golden-cross-stocks-backtest
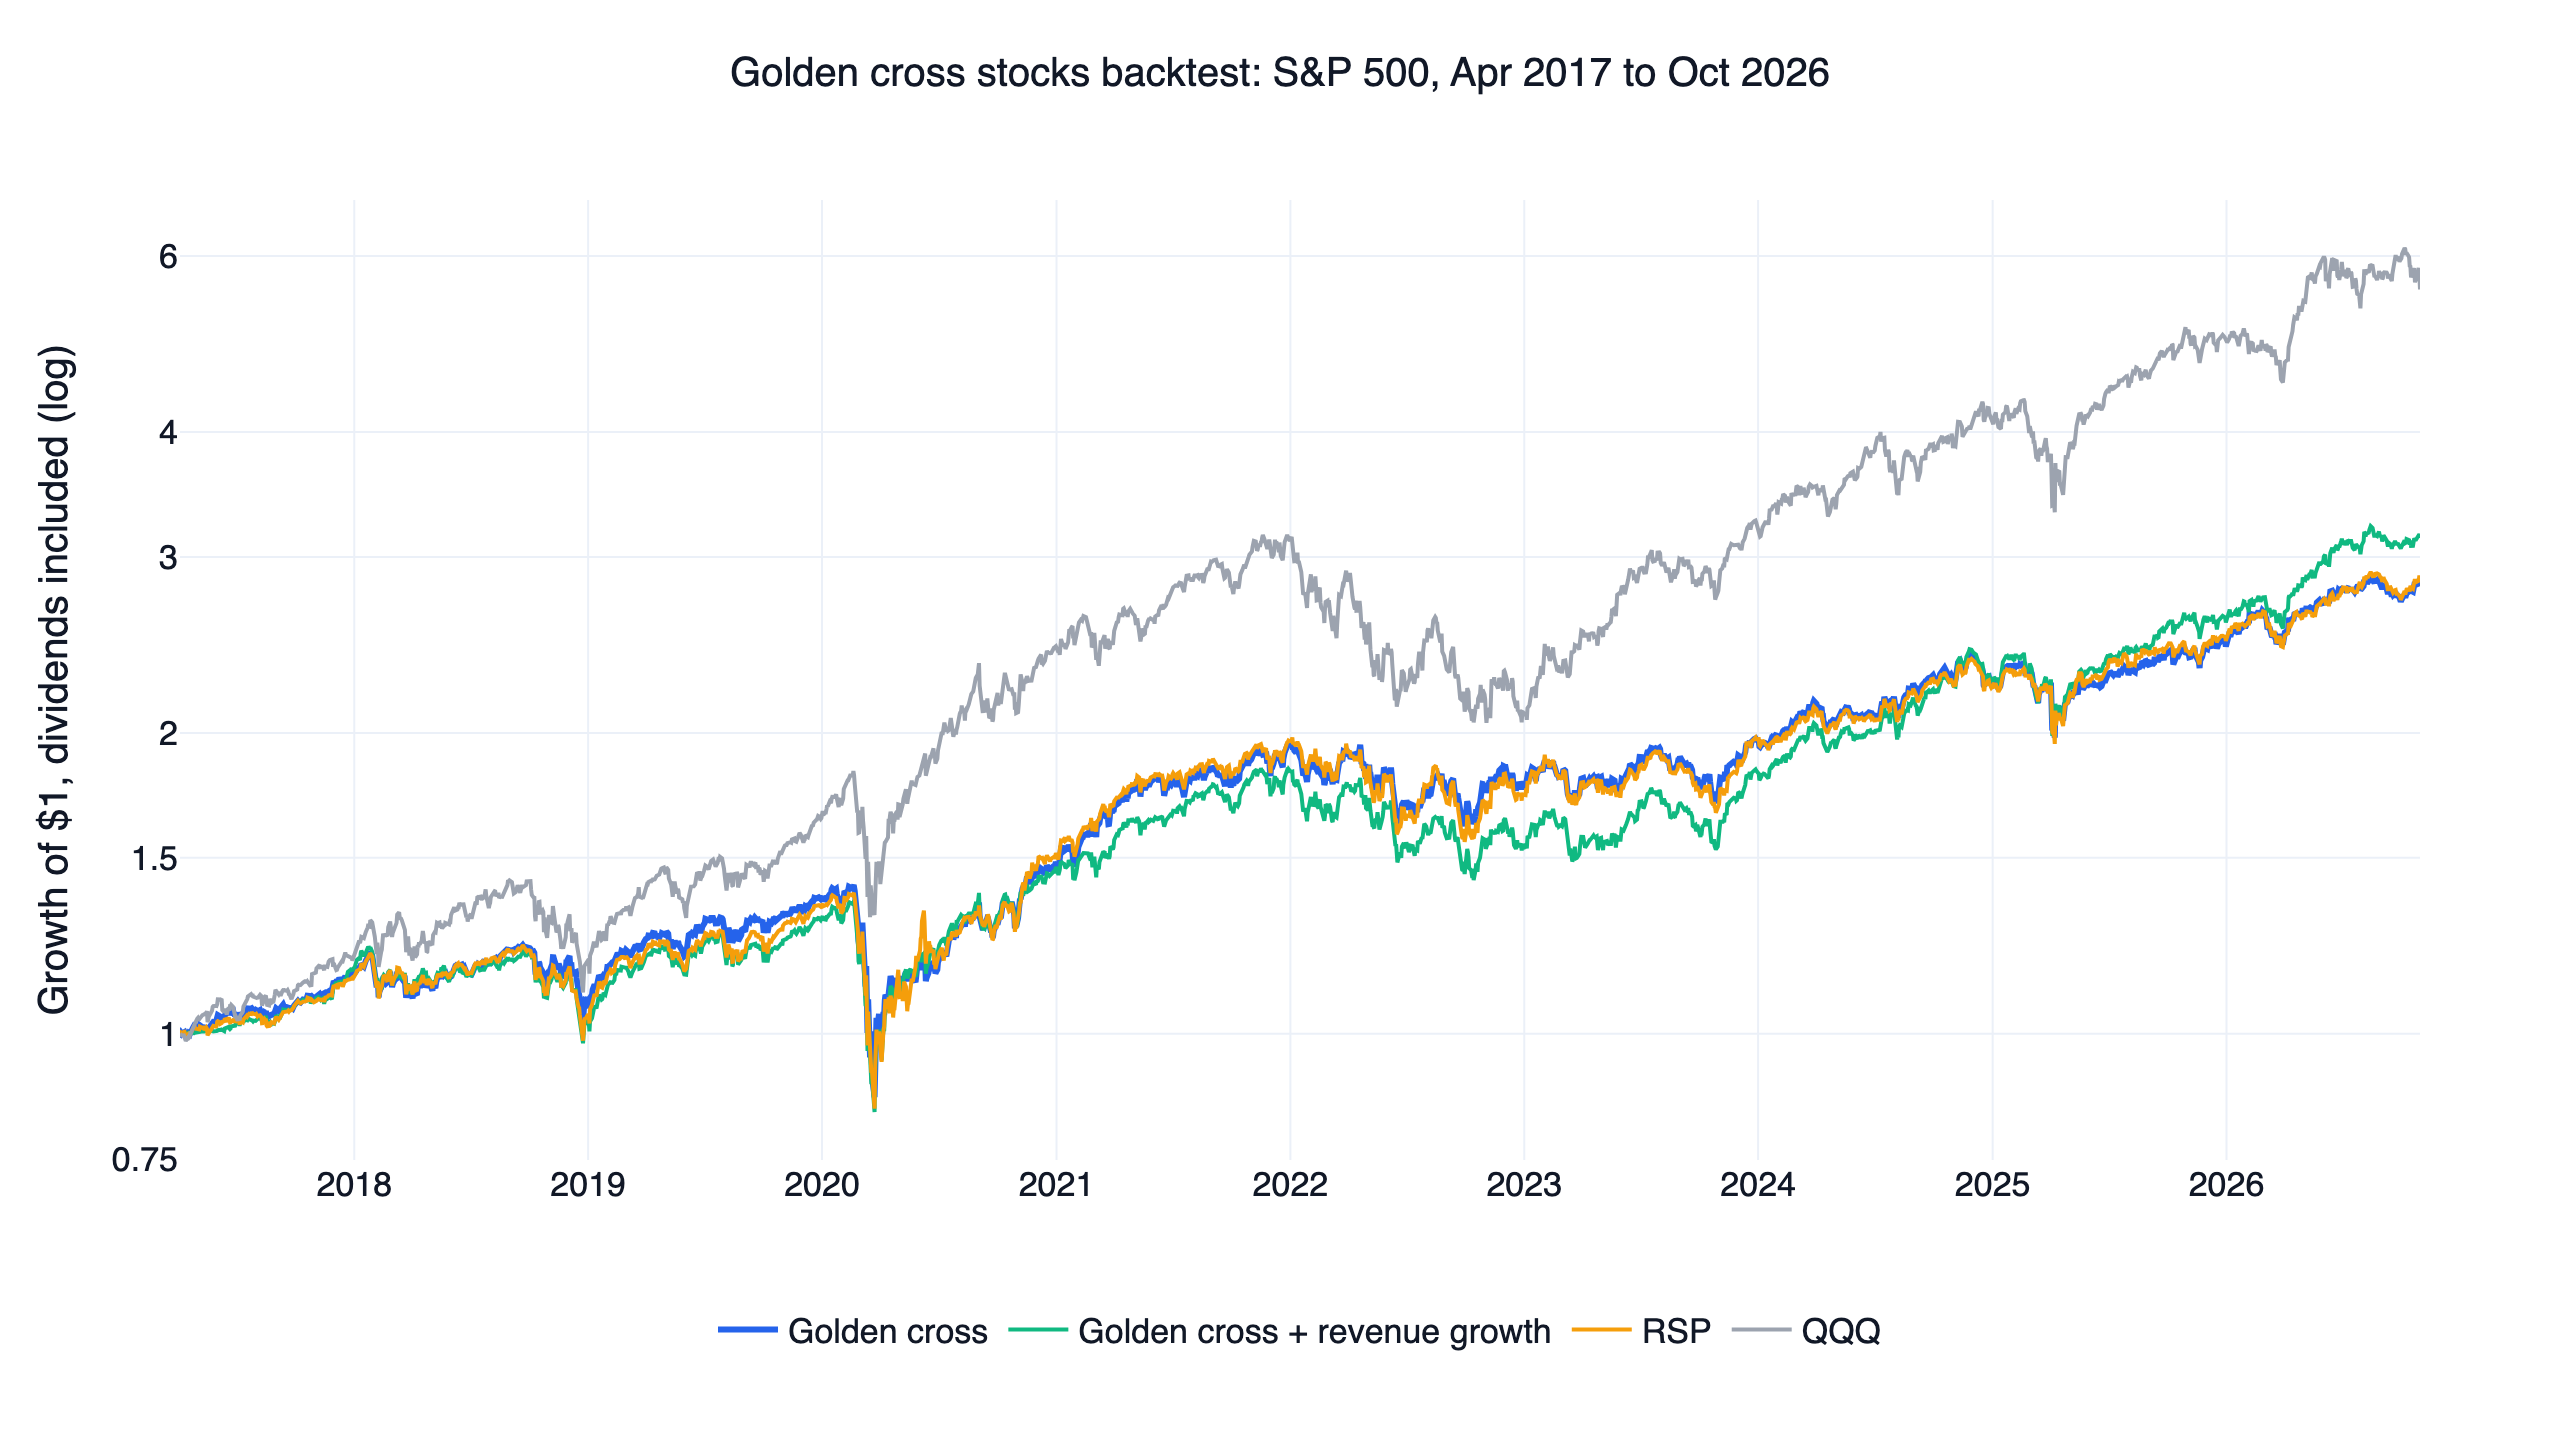
A golden cross on an S&P 500 stock told us almost nothing about what came next. We tracked 3,529 golden crosses and 3,713 death crosses from April 2017 to October 2026. Over the next 126 trading days, stocks rose 6.6% on average after a golden cross and 7.6% after a death cross, and against the average index member both results were within 0.2 of a point of zero. Holding every stock from its golden cross to its death cross returned 11.5% a year with a daily Sharpe ratio of 0.72, against 19.6% and 0.89 for QQQ with dividends. It edged RSP's 0.68, and none of 36 settings beat QQQ.
The 50/200 moving average cross is one of the most quoted signals in investing, and it is usually tested on an index. Here it is tested on individual stocks, with each day's actual S&P 500 members.
Golden cross results at a glance
| Design | Daily Sharpe | CAGR | Max drawdown | Beat QQQ | Beat RSP | First / second half Sharpe | Sharpe at 0.1% per side |
|---|---|---|---|---|---|---|---|
| Golden cross | 0.72 | 11.5% | -38.4% | 0 / 9 | 7 / 9 | 0.80 / 0.63 | 0.68 |
| Golden cross + revenue growth | 0.73 | 12.7% | -38.4% | 0 / 27 | 27 / 27 | 0.69 / 0.80 | 0.70 |
| RSP, total return | 0.68 | 11.6% | -39.0% | reference | 0.78 / 0.57 | ||
| SPY, total return | 0.84 | 14.7% | -33.7% | reference | 0.93 / 0.75 | ||
| QQQ, total return | 0.89 | 19.6% | -35.1% | benchmark | 1.11 / 0.69 |
All lines run from 2017-04-04 to 2026-10-30, with dividends reinvested. The halves split at 2022-01-13.
What happens after a golden cross or a death cross
A golden cross is the day a stock's 50-day average moves above its 200-day average. A death cross is the reverse. Each return below starts at the next close, the same fill the backtest uses.
| After | Trading days | Events | Average return | Median return | Rose | Above average member (mean) | Beat average member |
|---|---|---|---|---|---|---|---|
| Golden cross | 21 | 3,504 | 0.82% | 0.99% | 56.1% | 0.05% | 50.2% |
| Golden cross | 63 | 3,416 | 2.42% | 1.94% | 56.0% | 0.02% | 48.2% |
| Golden cross | 126 | 3,293 | 6.56% | 4.68% | 60.0% | 0.15% | 46.2% |
| Golden cross | 252 | 3,113 | 12.99% | 8.93% | 62.9% | 0.13% | 45.5% |
| Death cross | 21 | 3,638 | 2.19% | 1.95% | 59.6% | 0.18% | 49.9% |
| Death cross | 63 | 3,568 | 5.27% | 4.41% | 61.9% | 0.18% | 48.3% |
| Death cross | 126 | 3,493 | 7.64% | 5.60% | 61.0% | 0.05% | 46.8% |
| Death cross | 252 | 3,235 | 16.55% | 10.90% | 65.5% | -1.04% | 45.7% |
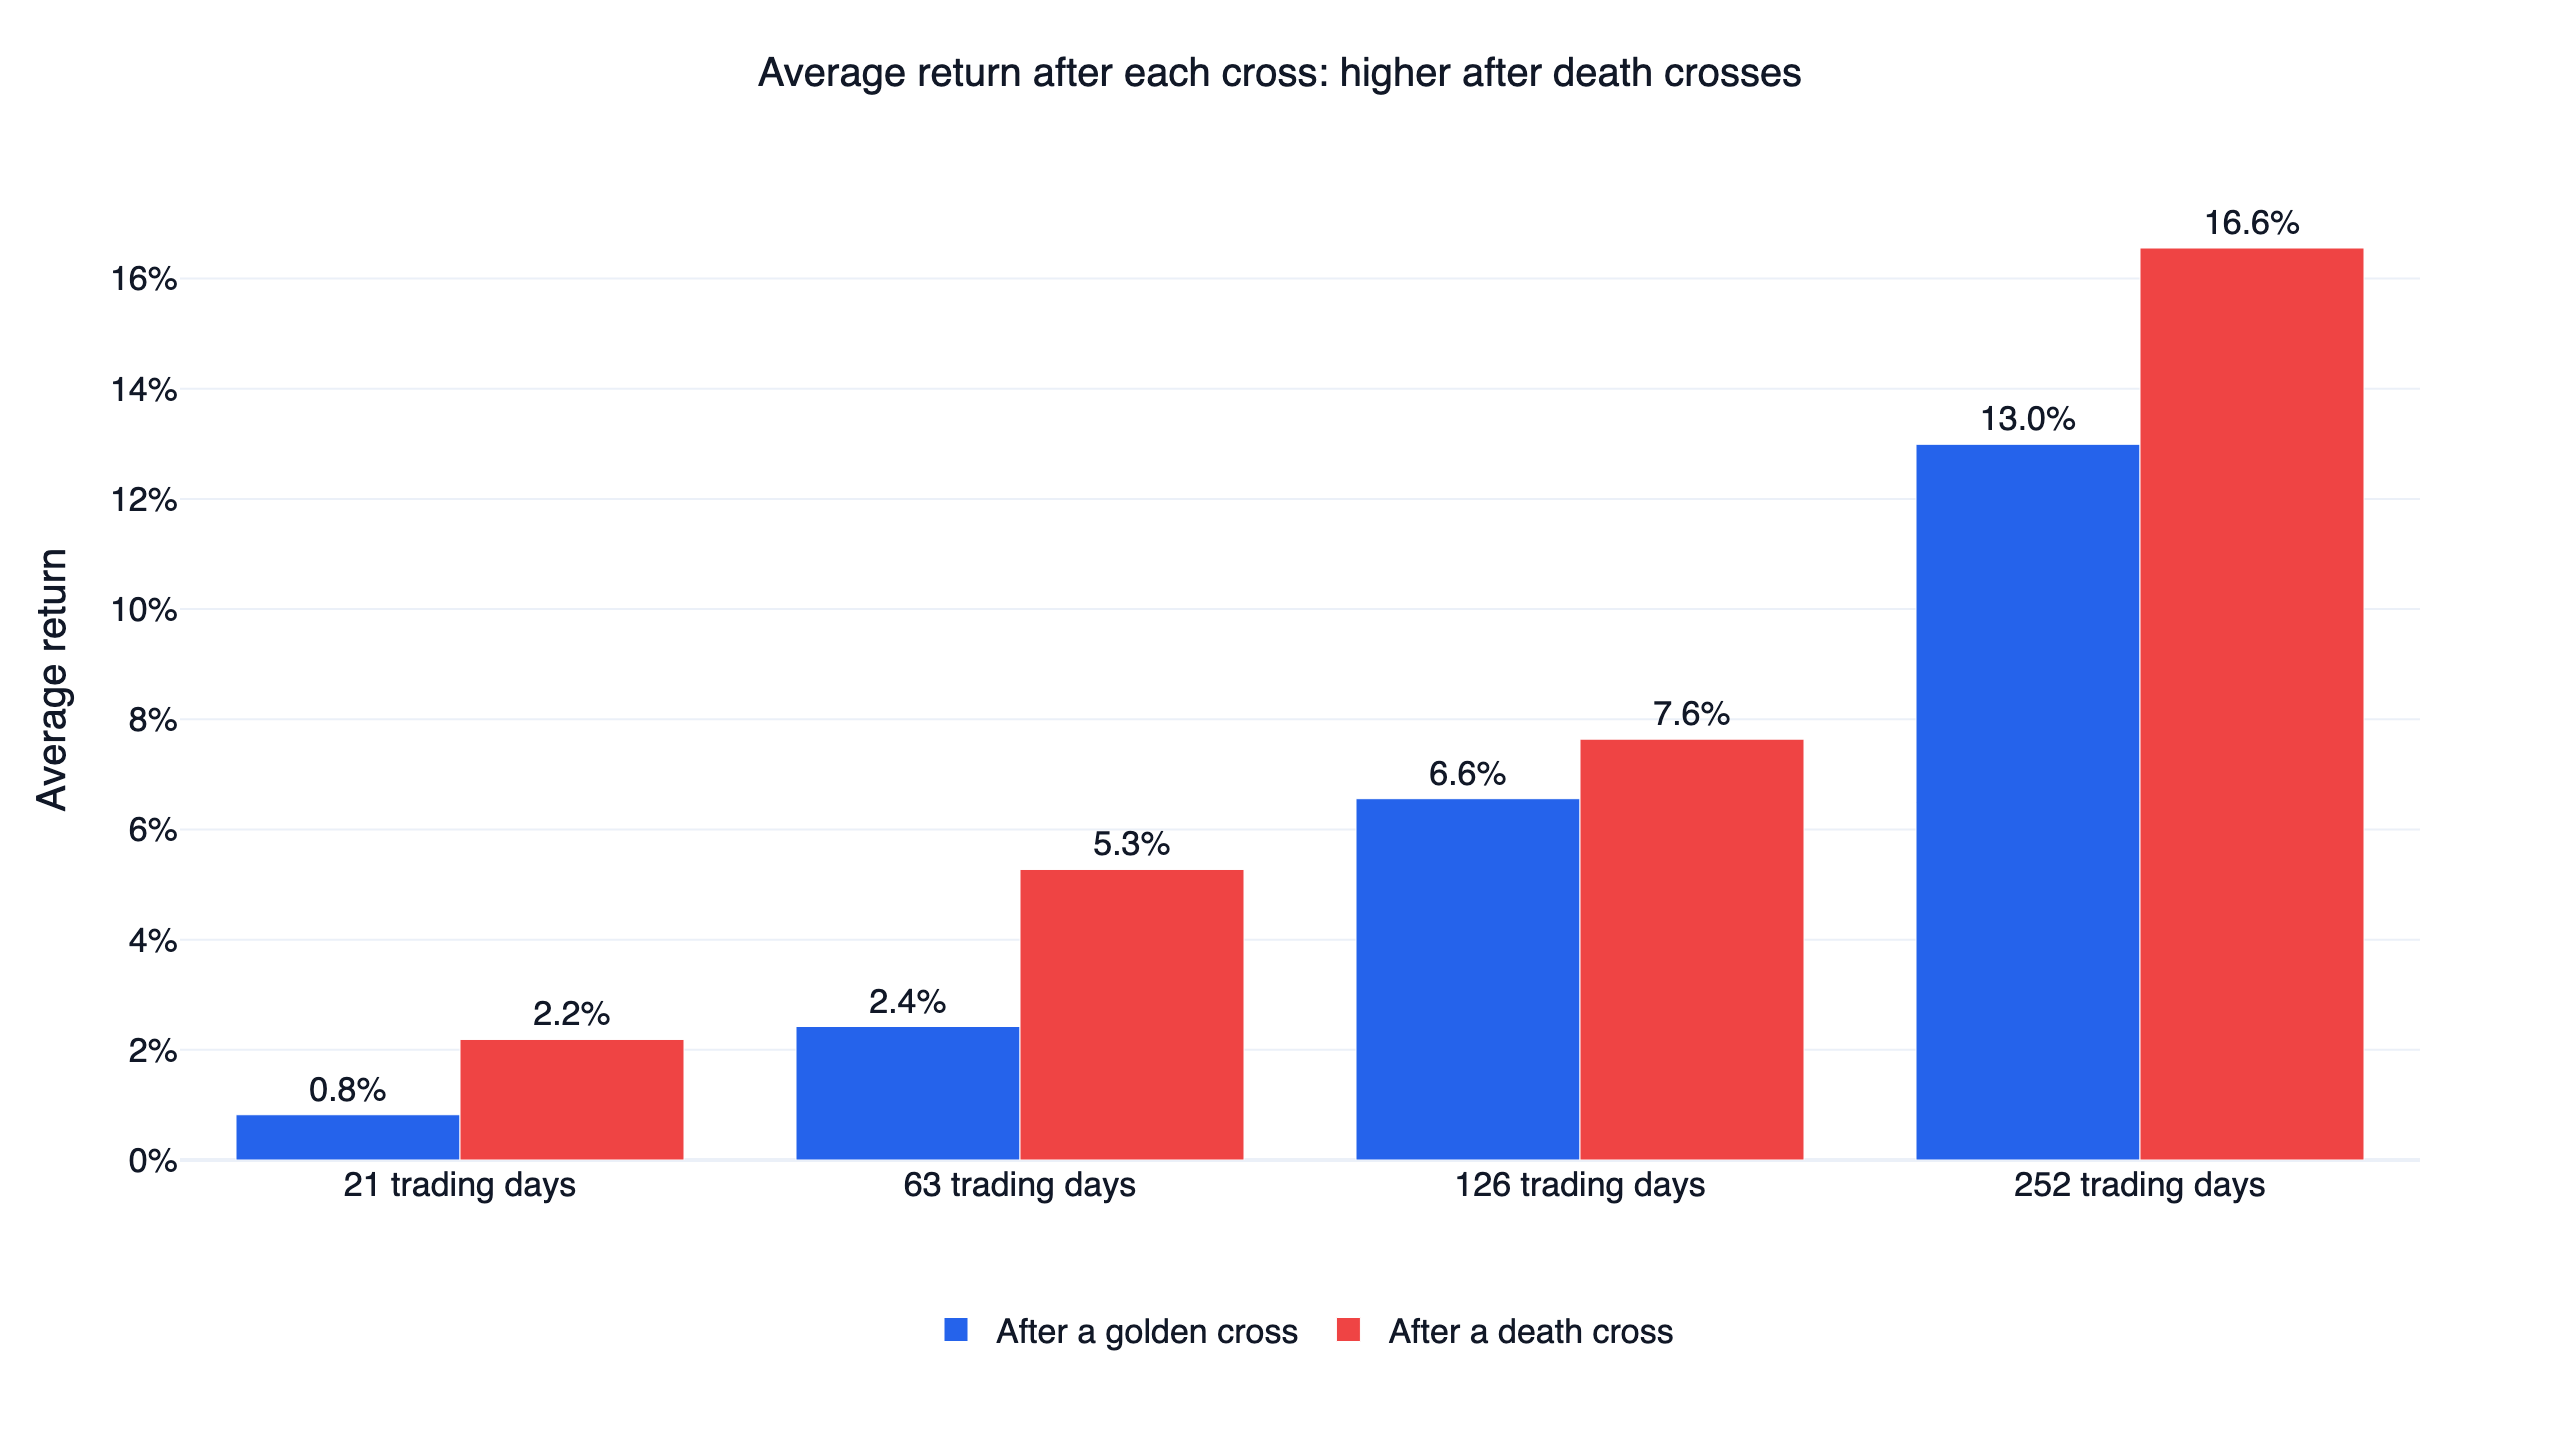
Stocks rose more after death crosses at every horizon. The right-hand columns show why that is no reason to buy on the bearish signal. Relative to the average member over the same days, both events sit close to zero, and most of the raw gap comes from the market itself: the average member rose 5.10% in the 63 days after death crosses and 2.40% after golden crosses. Death crosses lean toward weak markets. 26.4% of them came with RSP at least 10% below its high, against 14.8% of all days and 11.9% of golden crosses, though half still came with RSP within 5% of its high. The higher raw return reflects when the signal appeared and says little about the stock itself.
The last column is close to a base rate too. On any day, a member beat the average member 49.2%, 48.6%, 47.5% and 46.0% of the time at these four horizons.
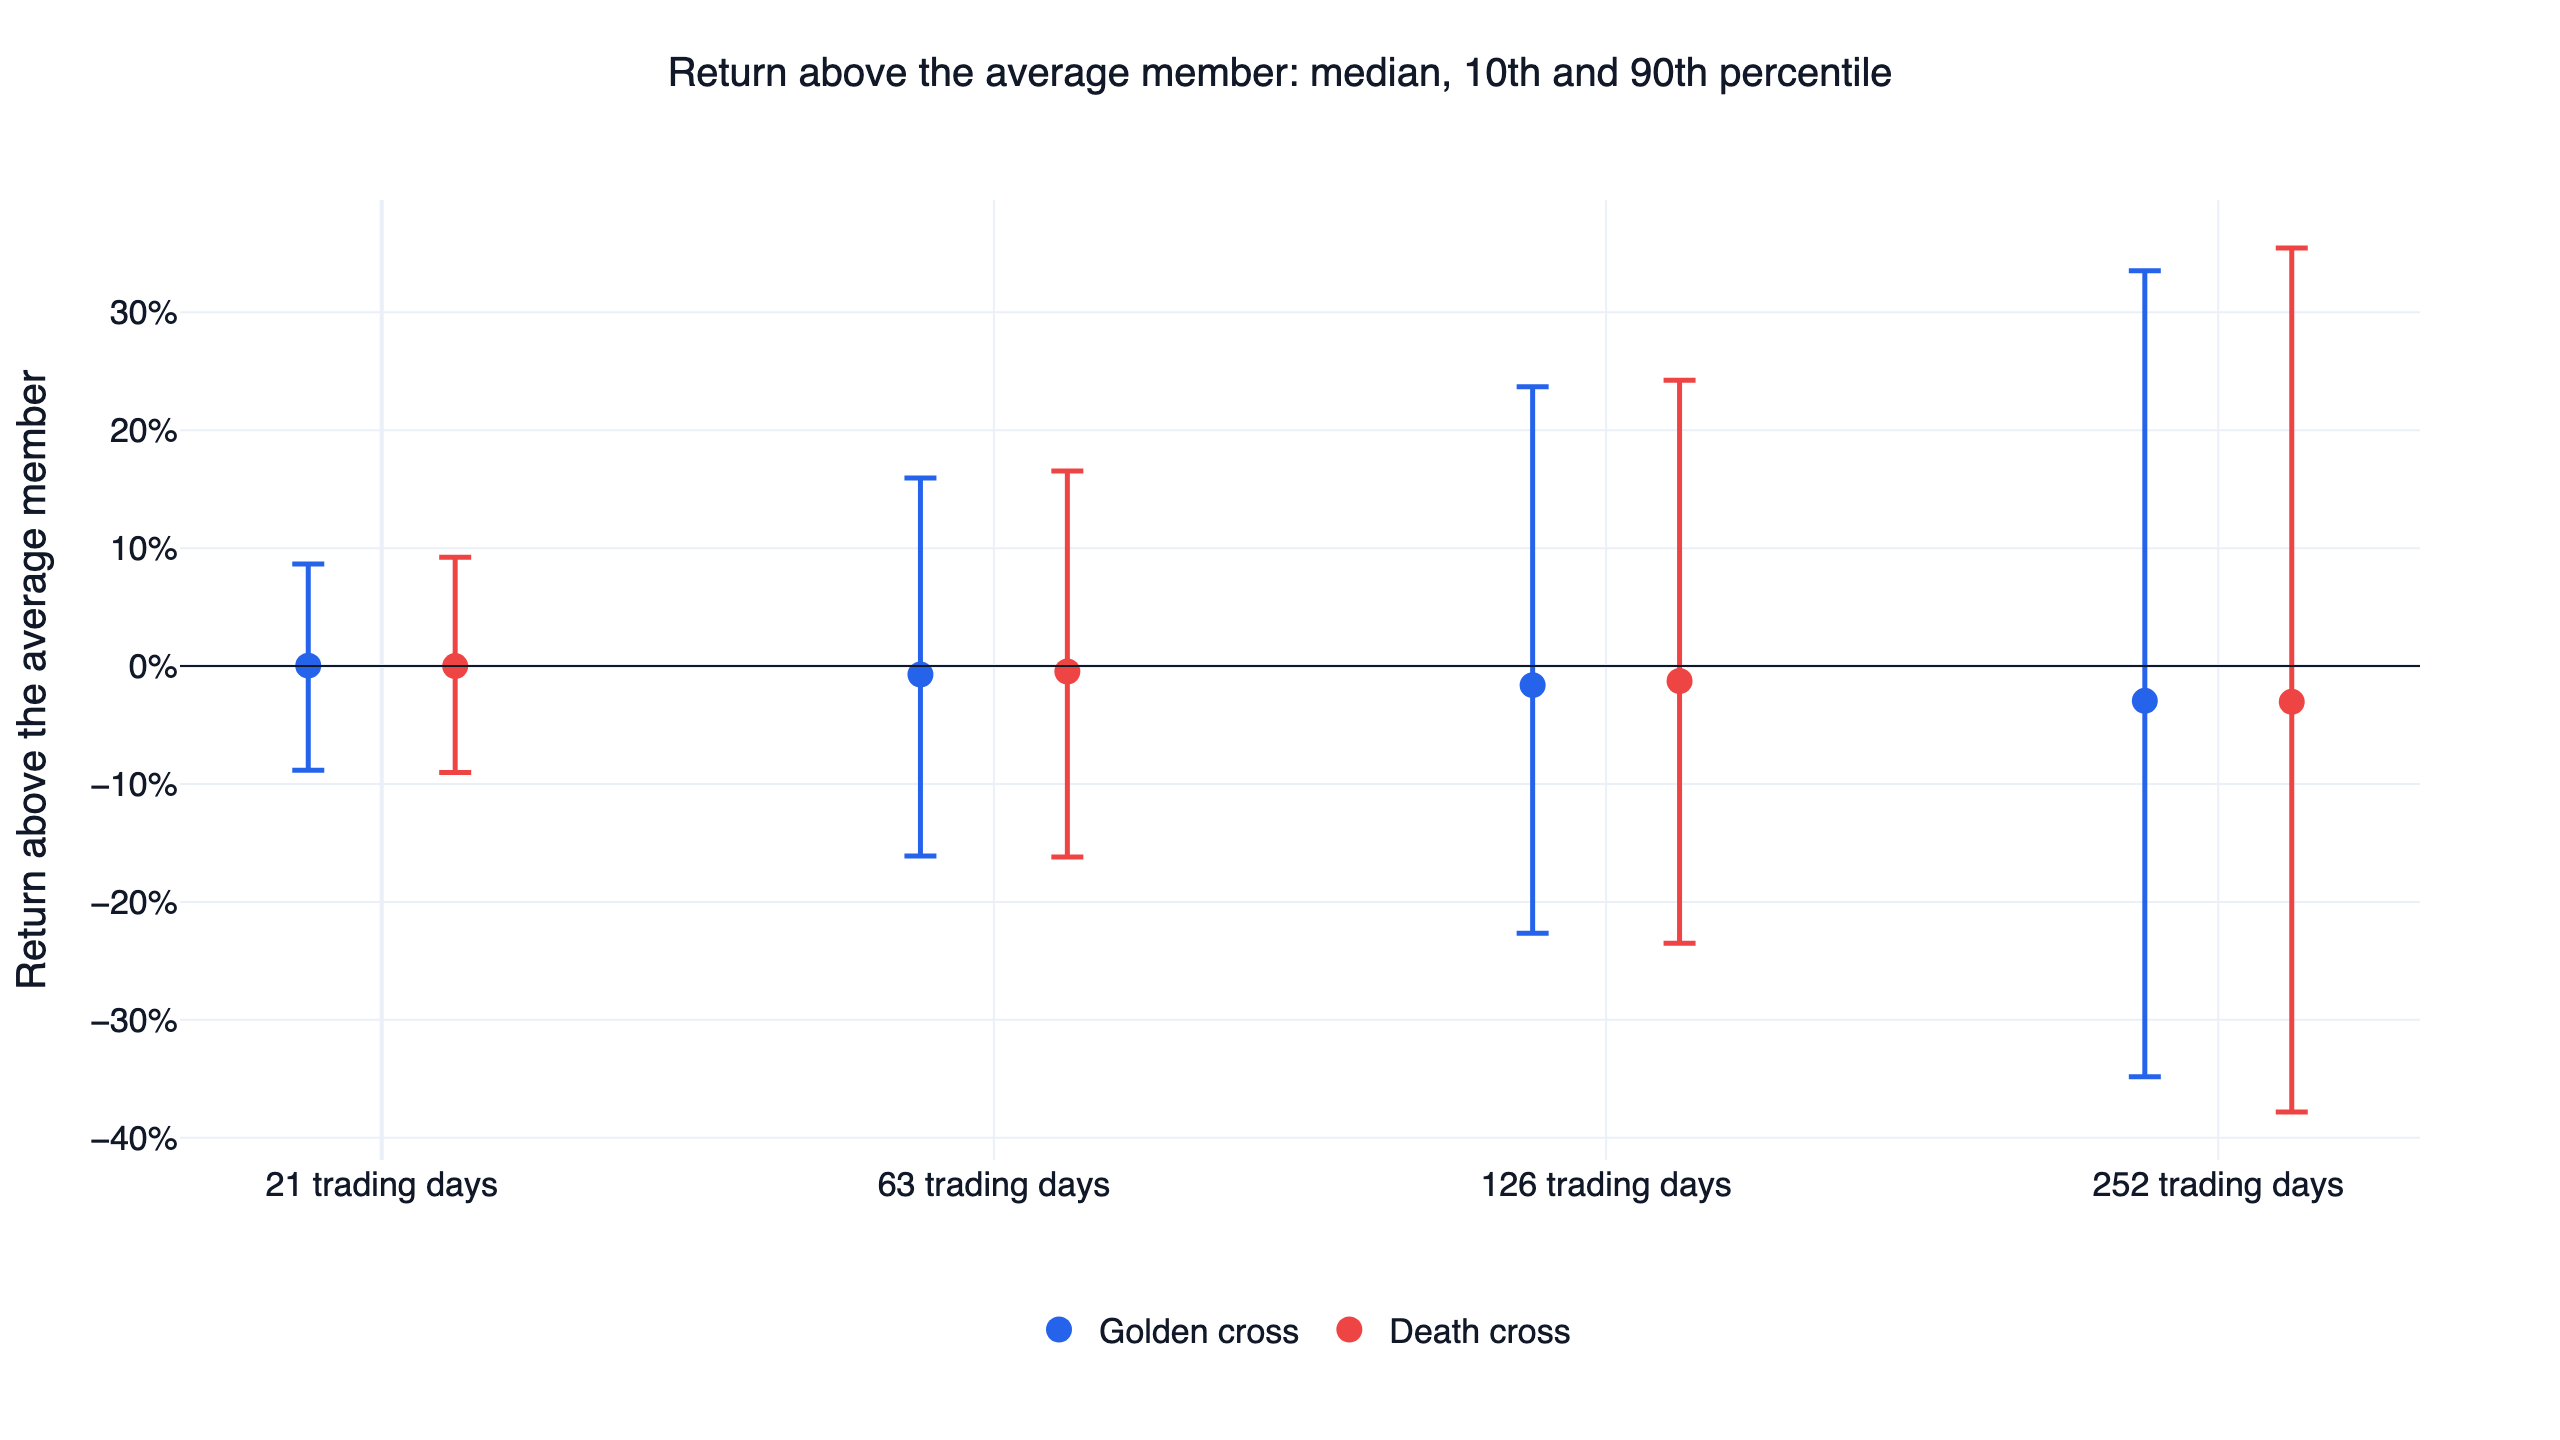
The spread around that zero is wide. A year after a golden cross, the 10th percentile stock lagged the average member by 34.8% and the 90th percentile led it by 33.5%. The death cross range is almost the same. The median excess return is slightly negative at longer horizons for both, as a few big winners pull the mean above the median.
Failures are common too: 23.2% of golden crosses were undone by a death cross within 63 trading days.
These events overlap in time and are not independent, so the table is a description, and no significance test is claimed.
How the strategy had to pass
"Beat" means a higher daily Sharpe ratio than QQQ with dividends reinvested, over exactly the same trading days. Sharpe here is the mean daily return over its standard deviation, annualised with √252, with no risk-free rate subtracted. All conditions were fixed before any result was seen.
- Neighbouring settings. Every main parameter took its original value and one value either side, and at least 70% of settings had to beat QQQ.
- Both halves. The window was cut at its midpoint, and the original setting had to win in each half.
- Costs. The original setting had to win at finlab's default US cost of zero and at 0.1% per side.
- No single year. It had to stay ahead after removing the calendar year of its largest lead.
- Cash. These rules can hold cash, so they also had to beat QQQ on returns above T-bills (BIL).
- Filter must add. The revenue version had to beat the plain rule at its original setting.
The two designs
Moving average rules have a long research record. Brock, Lakonishok and LeBaron (1992) tested them on the Dow from 1897 to 1986 and found the signals had predictive power. Sullivan, Timmermann and White (1999) then corrected for data snooping and reported that the best rule's edge did not carry into 1987 to 1996.
- Golden cross. Buy an S&P 500 member when its S-day average crosses above its L-day average. Sell when the S-day average falls below the L-day average or the stock leaves the index. S is 40, 50 or 60, and L is 150, 200 or 250.
- Golden cross + revenue growth. Entries also need the latest filed quarter's revenue up at least g on a year earlier. g is 5%, 10% or 20%.
A stock that joins the index with its fast average already above its slow average waits for the next cross. Holdings are equal weight with a 5% cap, and the portfolio keeps cash if fewer than 20 stocks qualify.
The strategy result: close to RSP and below QQQ
The plain strategy held 280 stocks on average, between 59 and 450, so at most times it owned more than half the index. Its daily returns had a 0.94 correlation with RSP, and it landed close to RSP on return and drawdown: 11.5% a year against 11.6%, and -38.4% against -39.0%. The Sharpe edge, 0.72 against 0.68, came from lower volatility, 17.2% against 18.6%. The strategy stays fully invested, so a death cross on one stock moves money into the others. It lost less than RSP in 2018 (-4.8% against -7.8%) and 2022 (-9.0% against -11.6%) and made less in 2020 (8.6% against 12.7%).
The edge over RSP was fragile. Two of the three settings using a 150-day slow average fell behind RSP, and at 0.1% per side the Sharpe slips from 0.72 to 0.68, level with RSP. Target weights turn over about 2.5 times a year.
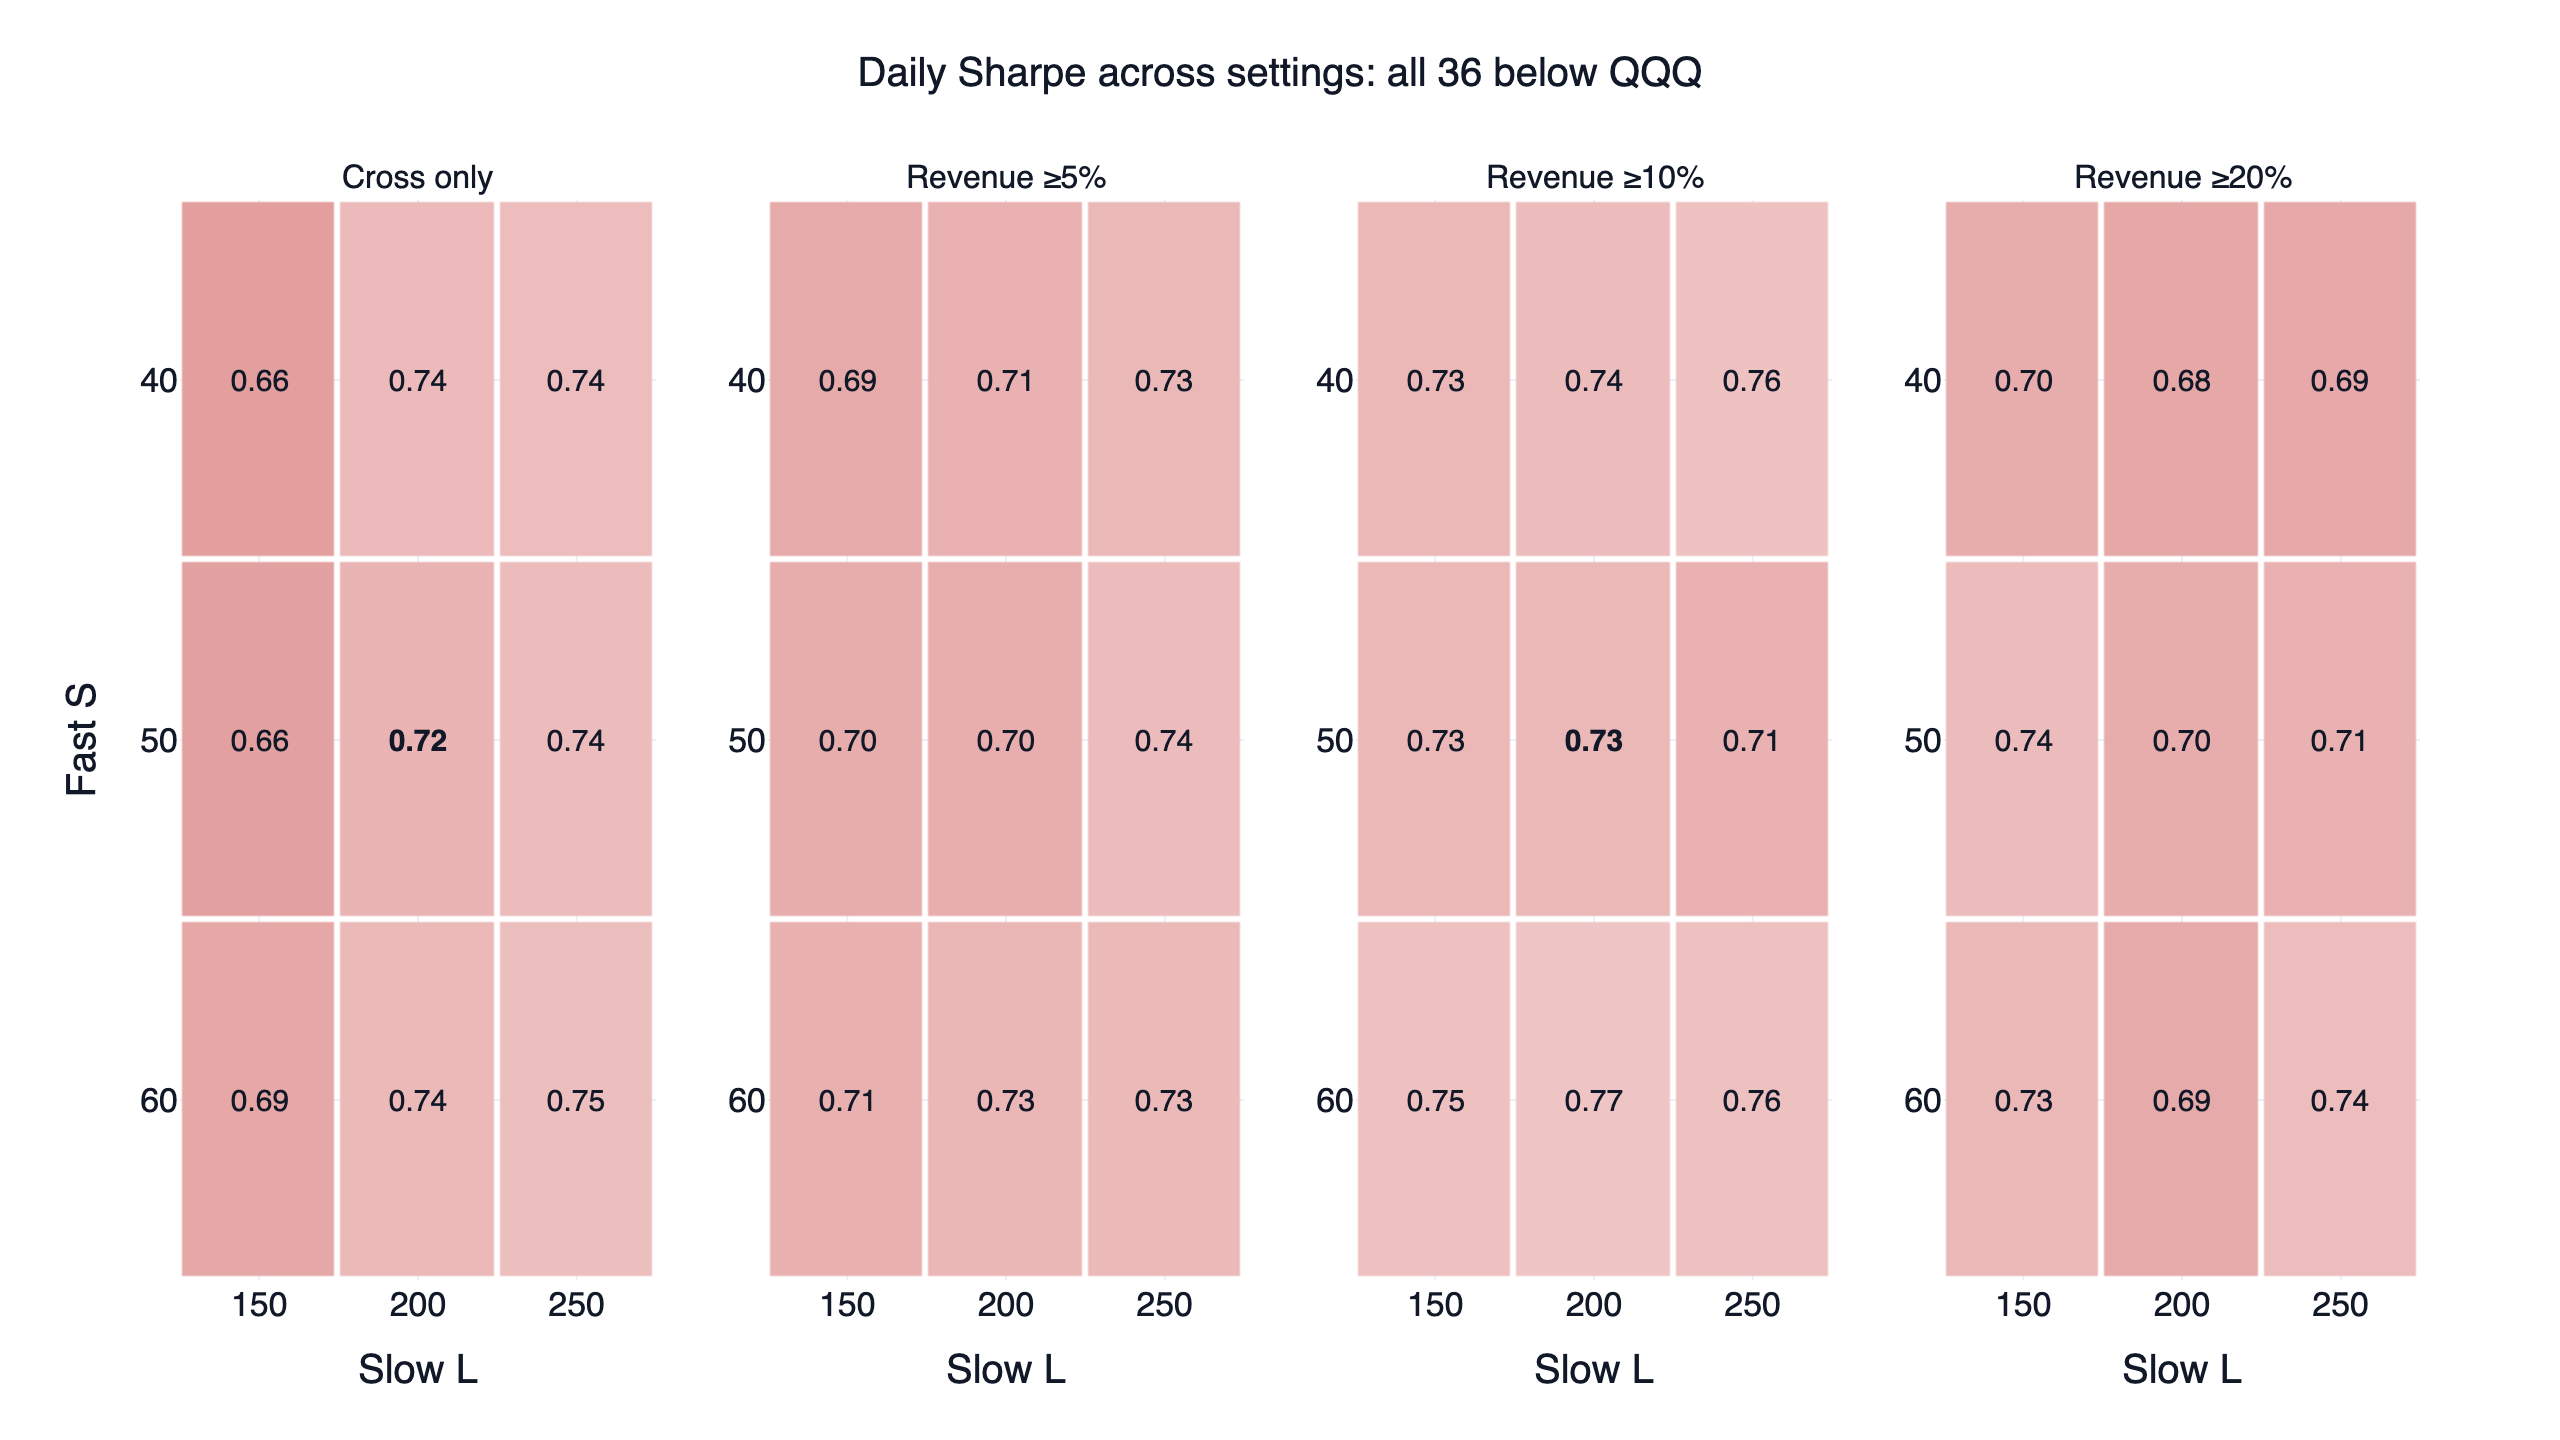
Bold marks the original settings. All 36 cells are below QQQ. The best was 0.77 against 0.89. The 50/200 pair is not special: nearby lengths score within a narrow band of 0.66 to 0.75, so there is no sharp peak to exploit, and no plateau above QQQ either.
The revenue filter is the more interesting version. It cut the portfolio to about 75 stocks and beat RSP's Sharpe in all 27 settings, some of them by a hair. Return rose to 12.7% a year, and the second half beat QQQ at 0.80 against 0.69. But the first half lost to RSP at 0.78 and to QQQ at 1.11 with a Sharpe of 0.69, and it lost on returns above T-bills, 0.60 to 0.79. Its 0.73 only just cleared the plain rule's 0.72. It also started slowly, with 2 stocks on the first day and fewer than 20 on 106 days of 2017, keeping the rest in cash. Its trades: 945 closed trades, 38.1% winners, a median loss of 4.4% and a mean gain of 5.1%, held a median of 127 trading days.
For the plain strategy the figures are 3,429 closed trades, a 41.3% win rate, a mean gain of 6.4%, a median loss of 3.3% and a median holding period of 138 trading days.
Golden crosses on stocks and on indexes
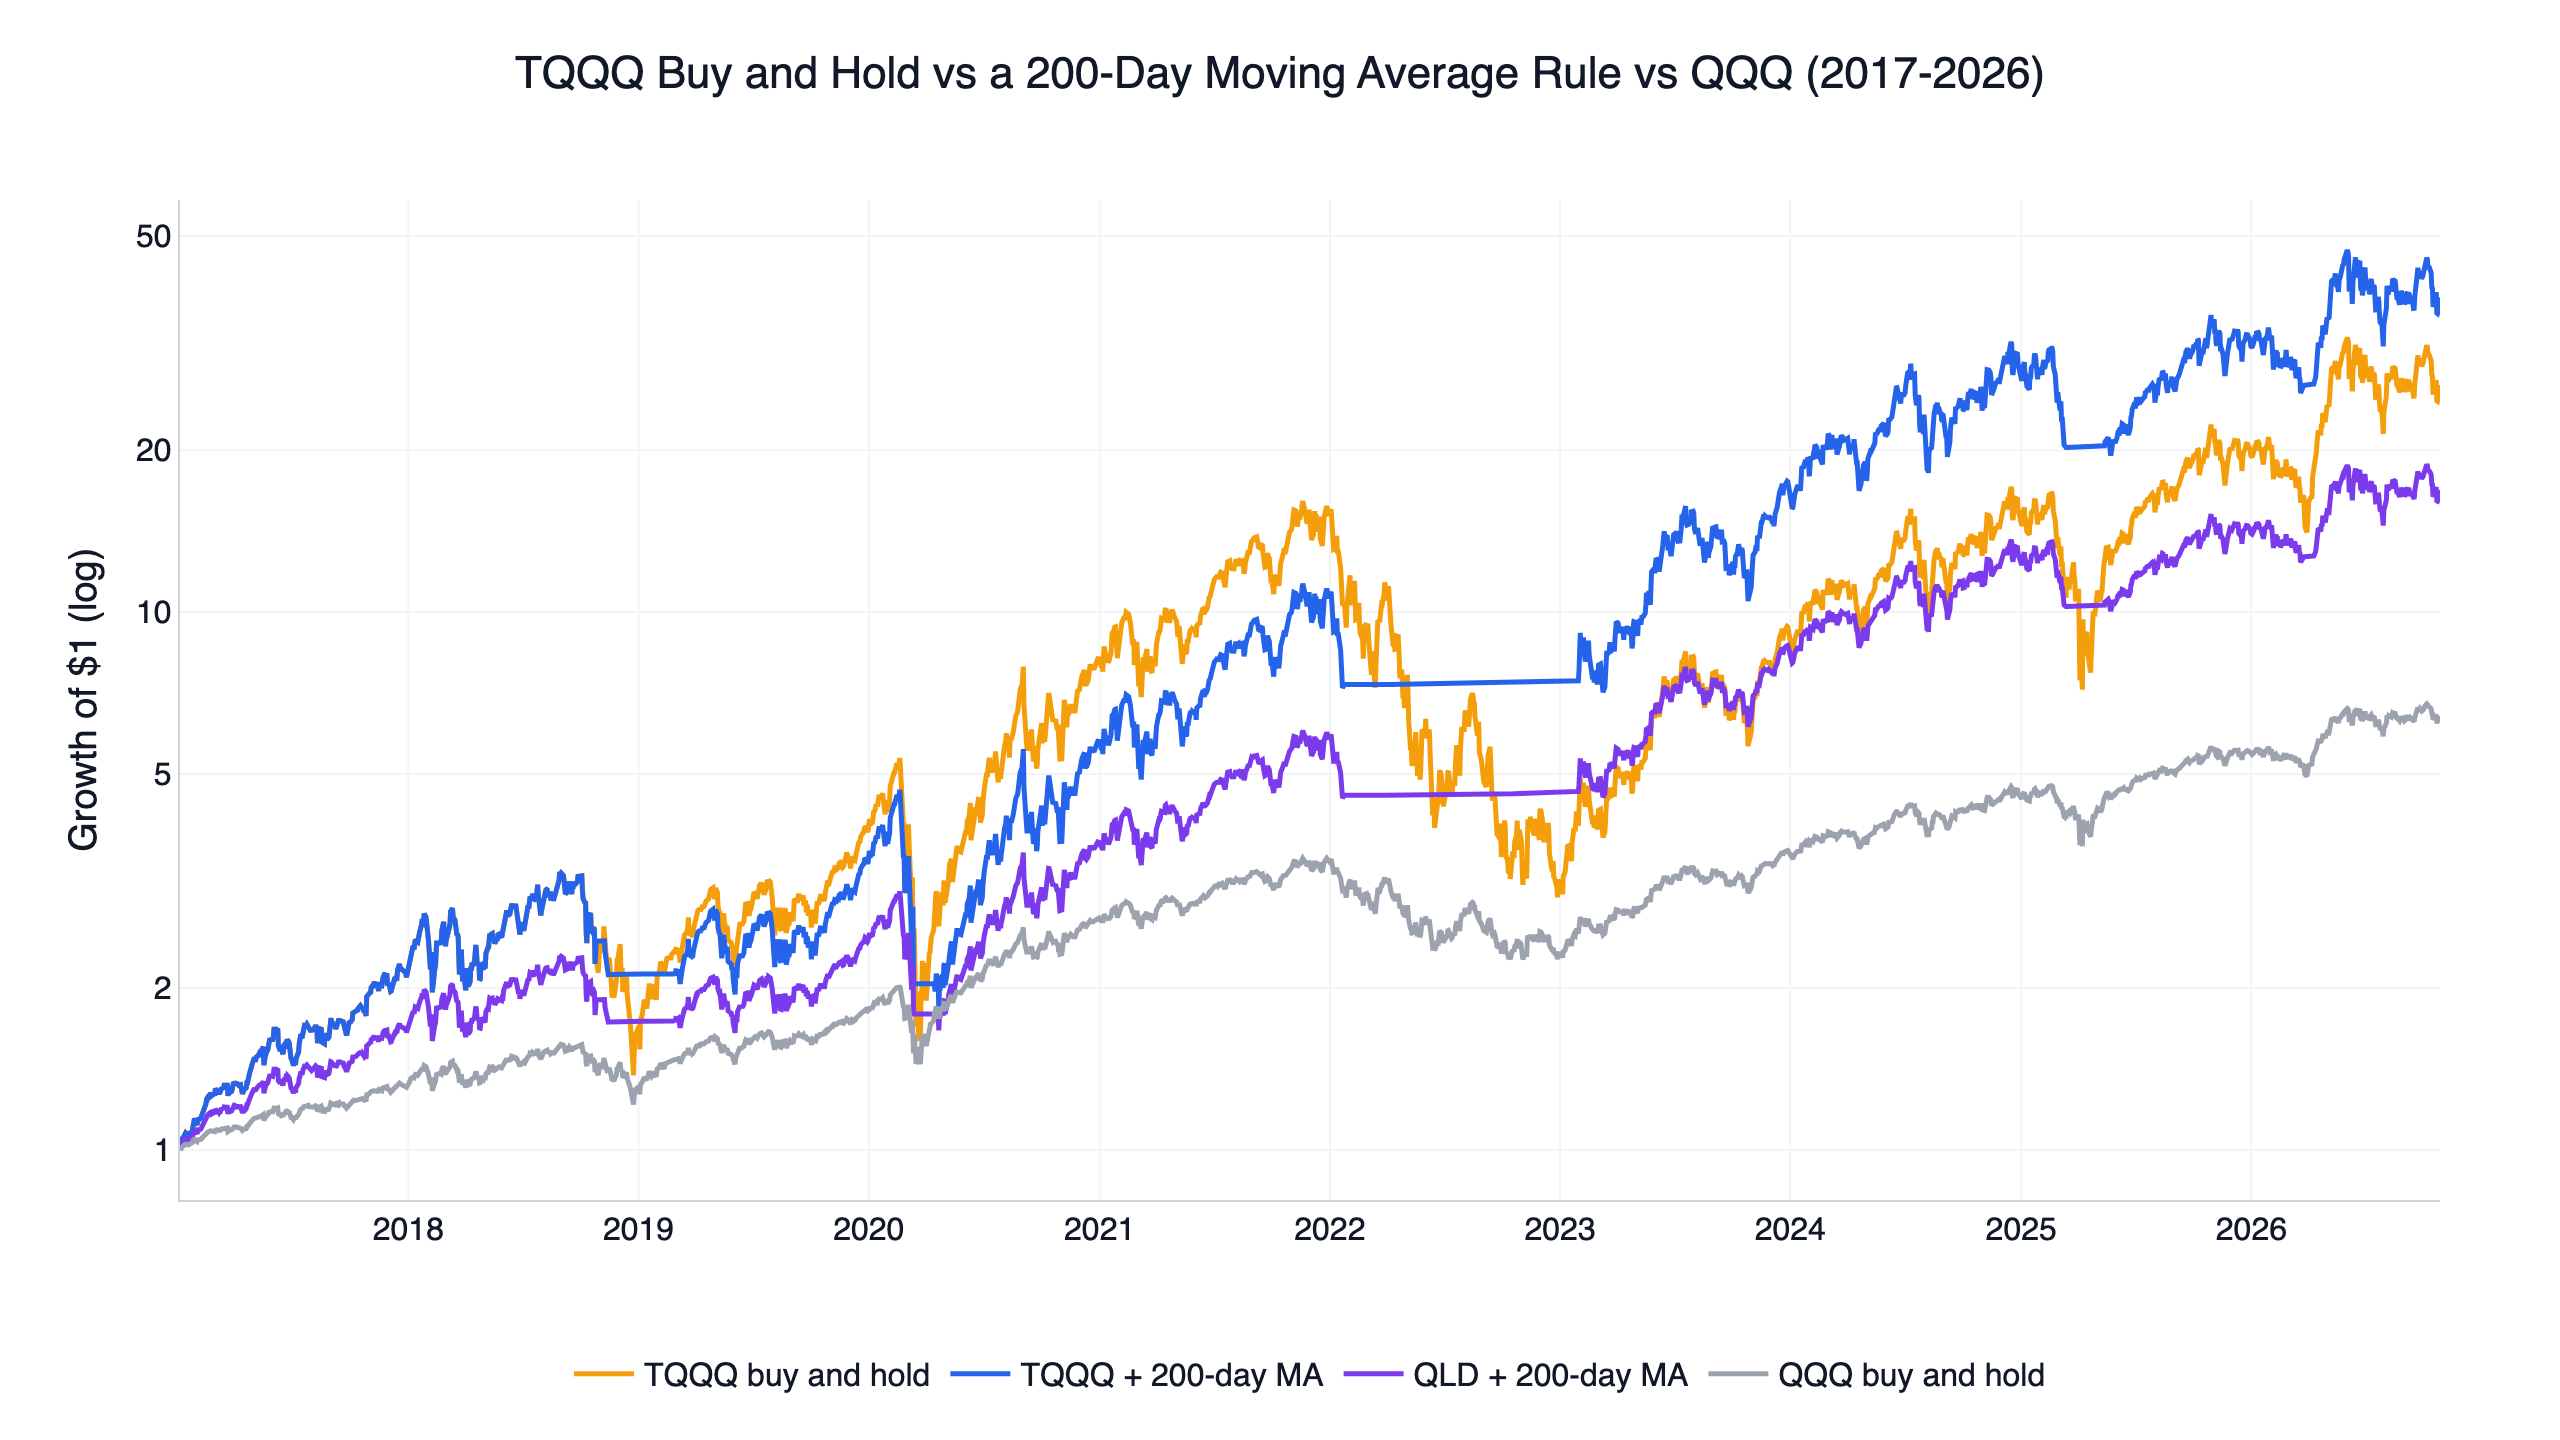
Our leveraged ETF timing study tested the same cross on the index itself, moving between the fund and T-bills. From January 2017, the QQQ version scored a Sharpe of 0.99 with 4 of 9 settings ahead and cut the maximum drawdown to -28.6%, and the SPY version scored 0.73 with none ahead and a drawdown of -33.7%, the same as SPY. Those rules step out of the market entirely. The stock-level portfolio here stayed invested, with a drawdown close to RSP's.
Part of the gap to QQQ may come from which stocks are held and how much of each. Bessembinder (2018) found that a small share of US stocks accounts for most of the market's long-run wealth creation. QQQ is weighted by company size, while this strategy splits its money evenly across about 280 stocks. We did not separate the two effects.
The code
This is the plain rule. On data through October 2026 it printed the headline 0.72. research.py also keeps one share class per company and adds the revenue filter and the event study.
Show Code
import finlab
from finlab import data
from finlab.backtest import sim

finlab.login()
data.set_market("us")

close = data.get("us_price:adj_close")
members = data.get("us_index_constituents:sp500").astype(bool)

# Keep tickers in both tables and line the members up with trading days
tickers = members.columns.intersection(close.columns)
close = close[tickers]
members = members[tickers].reindex(close.index, method="ffill").fillna(False).astype(bool)

fast = close.rolling(50).mean()
slow = close.rolling(200).mean()

# The golden cross is the day the 50-day average moves above the 200-day average
golden_cross = (fast > slow) & (fast.shift(1) <= slow.shift(1)) & members
sell = (fast < slow) | ~members
position = golden_cross.hold_until(sell).loc["2017-04-03":]

# Equal weight, at most 5% in a stock, traded at the next close
report = sim(position.loc[:, position.any()], position_limit=0.05, trade_at_price="close",
             market="us", upload=False)

returns = report.creturn.pct_change().dropna()
print("Daily Sharpe:", round(returns.mean() / returns.std() * 252 ** 0.5, 2))
Install the FinLab skill for your AI agent
You do not need to write this yourself. Install the FinLab skill in Claude Code, Codex or Gemini CLI with one command:
Show Code
npx skills add koreal6803/finlab-ai --skill finlab -g -yThen ask your agent in plain language, for example "rerun the golden cross study on Nasdaq 100 members" or "show returns after death crosses in years when SPY was above its 200-day average". The agent setup page has the details, and FinLab Studio runs the same research in a browser.
Backtest method and limits
| Item | How it was handled |
|---|---|
| Window | 2017-04-03 to 2026-10-30. Crosses before the start count for holdings, so the plain rule holds 176 stocks on day one. The revenue version starts with 2 and holds cash until more qualify |
| Universe | Each day's S&P 500 members, one share class per company. 13 of the 505 members on 2017-04-03 have no price that day in FinLab and are skipped. Some of those later failed, which leans results slightly upward |
| Liquidity | No filter beyond index membership. Capacity is not estimated |
| Turnover | About 2.5 times a year on target weights |
| Event study | 50/200 crosses of members. Events without enough days left are dropped, including stocks acquired or delisted within the horizon, so long horizons lean slightly toward survivors |
| Fundamentals | Dated by filing date, with quarters that have no growth figure failing the filter (look-ahead bias control) |
| Weights | Equal, capped at 5% a stock, re-equalised on days the list changes; cash earns nothing |
| Execution | Signal at a close, traded at the next close |
| Cost | finlab sim() default US cost of zero, plus a rerun at 0.1% per side. Slippage is not estimated |
| Taxes | None |
| Sample | Whole window in-sample. The halves only check stability; no out-of-sample test was run |
What this result does and does not say
Within this window and universe, the cross itself carried almost no stock-level information. That does not make moving averages useless, and the index-level results above differ. This study also covers only large, liquid US stocks in a strong decade, and small caps or other markets may behave differently.
For Python users, the US stock backtest tutorial walks through a first strategy, and the US strategy comparison collects the rest of our work. Sector-level timing with a similar signal is in the sector rotation backtest.
FAQ
What is a golden cross in stocks?
The day a stock's 50-day moving average rises above its 200-day moving average. Other lengths are used too; this study tested 40 to 60 days against 150 to 250 days.
Is a golden cross a buy signal?
Not on the evidence here. After 3,293 golden crosses, stocks beat the average S&P 500 member over the next 126 trading days 46.2% of the time, close to the 47.5% for any member on any day, and the mean difference was 0.15%.
Is a death cross bearish for a stock?
Not on average in this window. Stocks rose 7.64% on average in the 126 trading days after a death cross and matched the average member, so on average a sale neither helped nor hurt.
How often does a golden cross fail?
23.2% of golden crosses were reversed by a death cross within 63 trading days. Over the following year 45.5% of all golden crosses beat the average member, close to the 46.0% for any member on any day.
What is the best moving average pair?
No pair stood out. The nine pairs tested scored between 0.66 and 0.75, and all trailed QQQ.
Why did stocks rise more after death crosses?
Death crosses lean toward weak markets, and the average member also rose more after them. Against that average, the difference almost disappears.
Does a golden cross work on SPY or QQQ?
QQQ's version won in 4 of 9 settings and SPY's in none, as the leveraged ETF timing study shows. Neither passed the full validation.
Can I rerun this?
Yes. Install the FinLab skill through the AI-assisted setup, download research.py below and run python research.py.
Reproduce it yourself
- research.py: both designs, the 36 settings, both halves, the cost runs and the event study.
- data.csv: daily equity curves of both designs, plus QQQ, SPY and RSP.
- metrics.json: the statistics behind this article, including events by year.
New research is on the FinLab blog, the team is on the about page, and examples are on use cases. For other fixed rules, see the Dogs of the Dow backtest and the 52-week high stocks backtest.
Disclaimer: this article is for education only and does not constitute investment advice. Past performance does not guarantee future results, and investing involves risk. All results are in-sample, and the two halves were not validated out of sample.
Last updated: 2026-11 | Backtest window: 2017-04 to 2026-10 | Data through 2026-10-30, rerun 2026-11-01 | Benchmark: QQQ total return | Author: FinLab Quant Research (reviewed by a quantitative researcher)
FinLab AI
Want to build your own strategy?
Describe your stock-picking ideas in natural language. AI automatically validates, backtests, and gives you answers
Start Free