Run this strategy
Copy the prompt to reproduce the evidence above with the article’s data, assumptions, and risk checks.
Tell your AI:
Set up FinLab and rerun the Dogs of the Dow backtest against QQQ and DIA. Please read: https://finlab.finance/en/setup?relatedUrl=/en/blog/dogs-of-the-dow-backtest
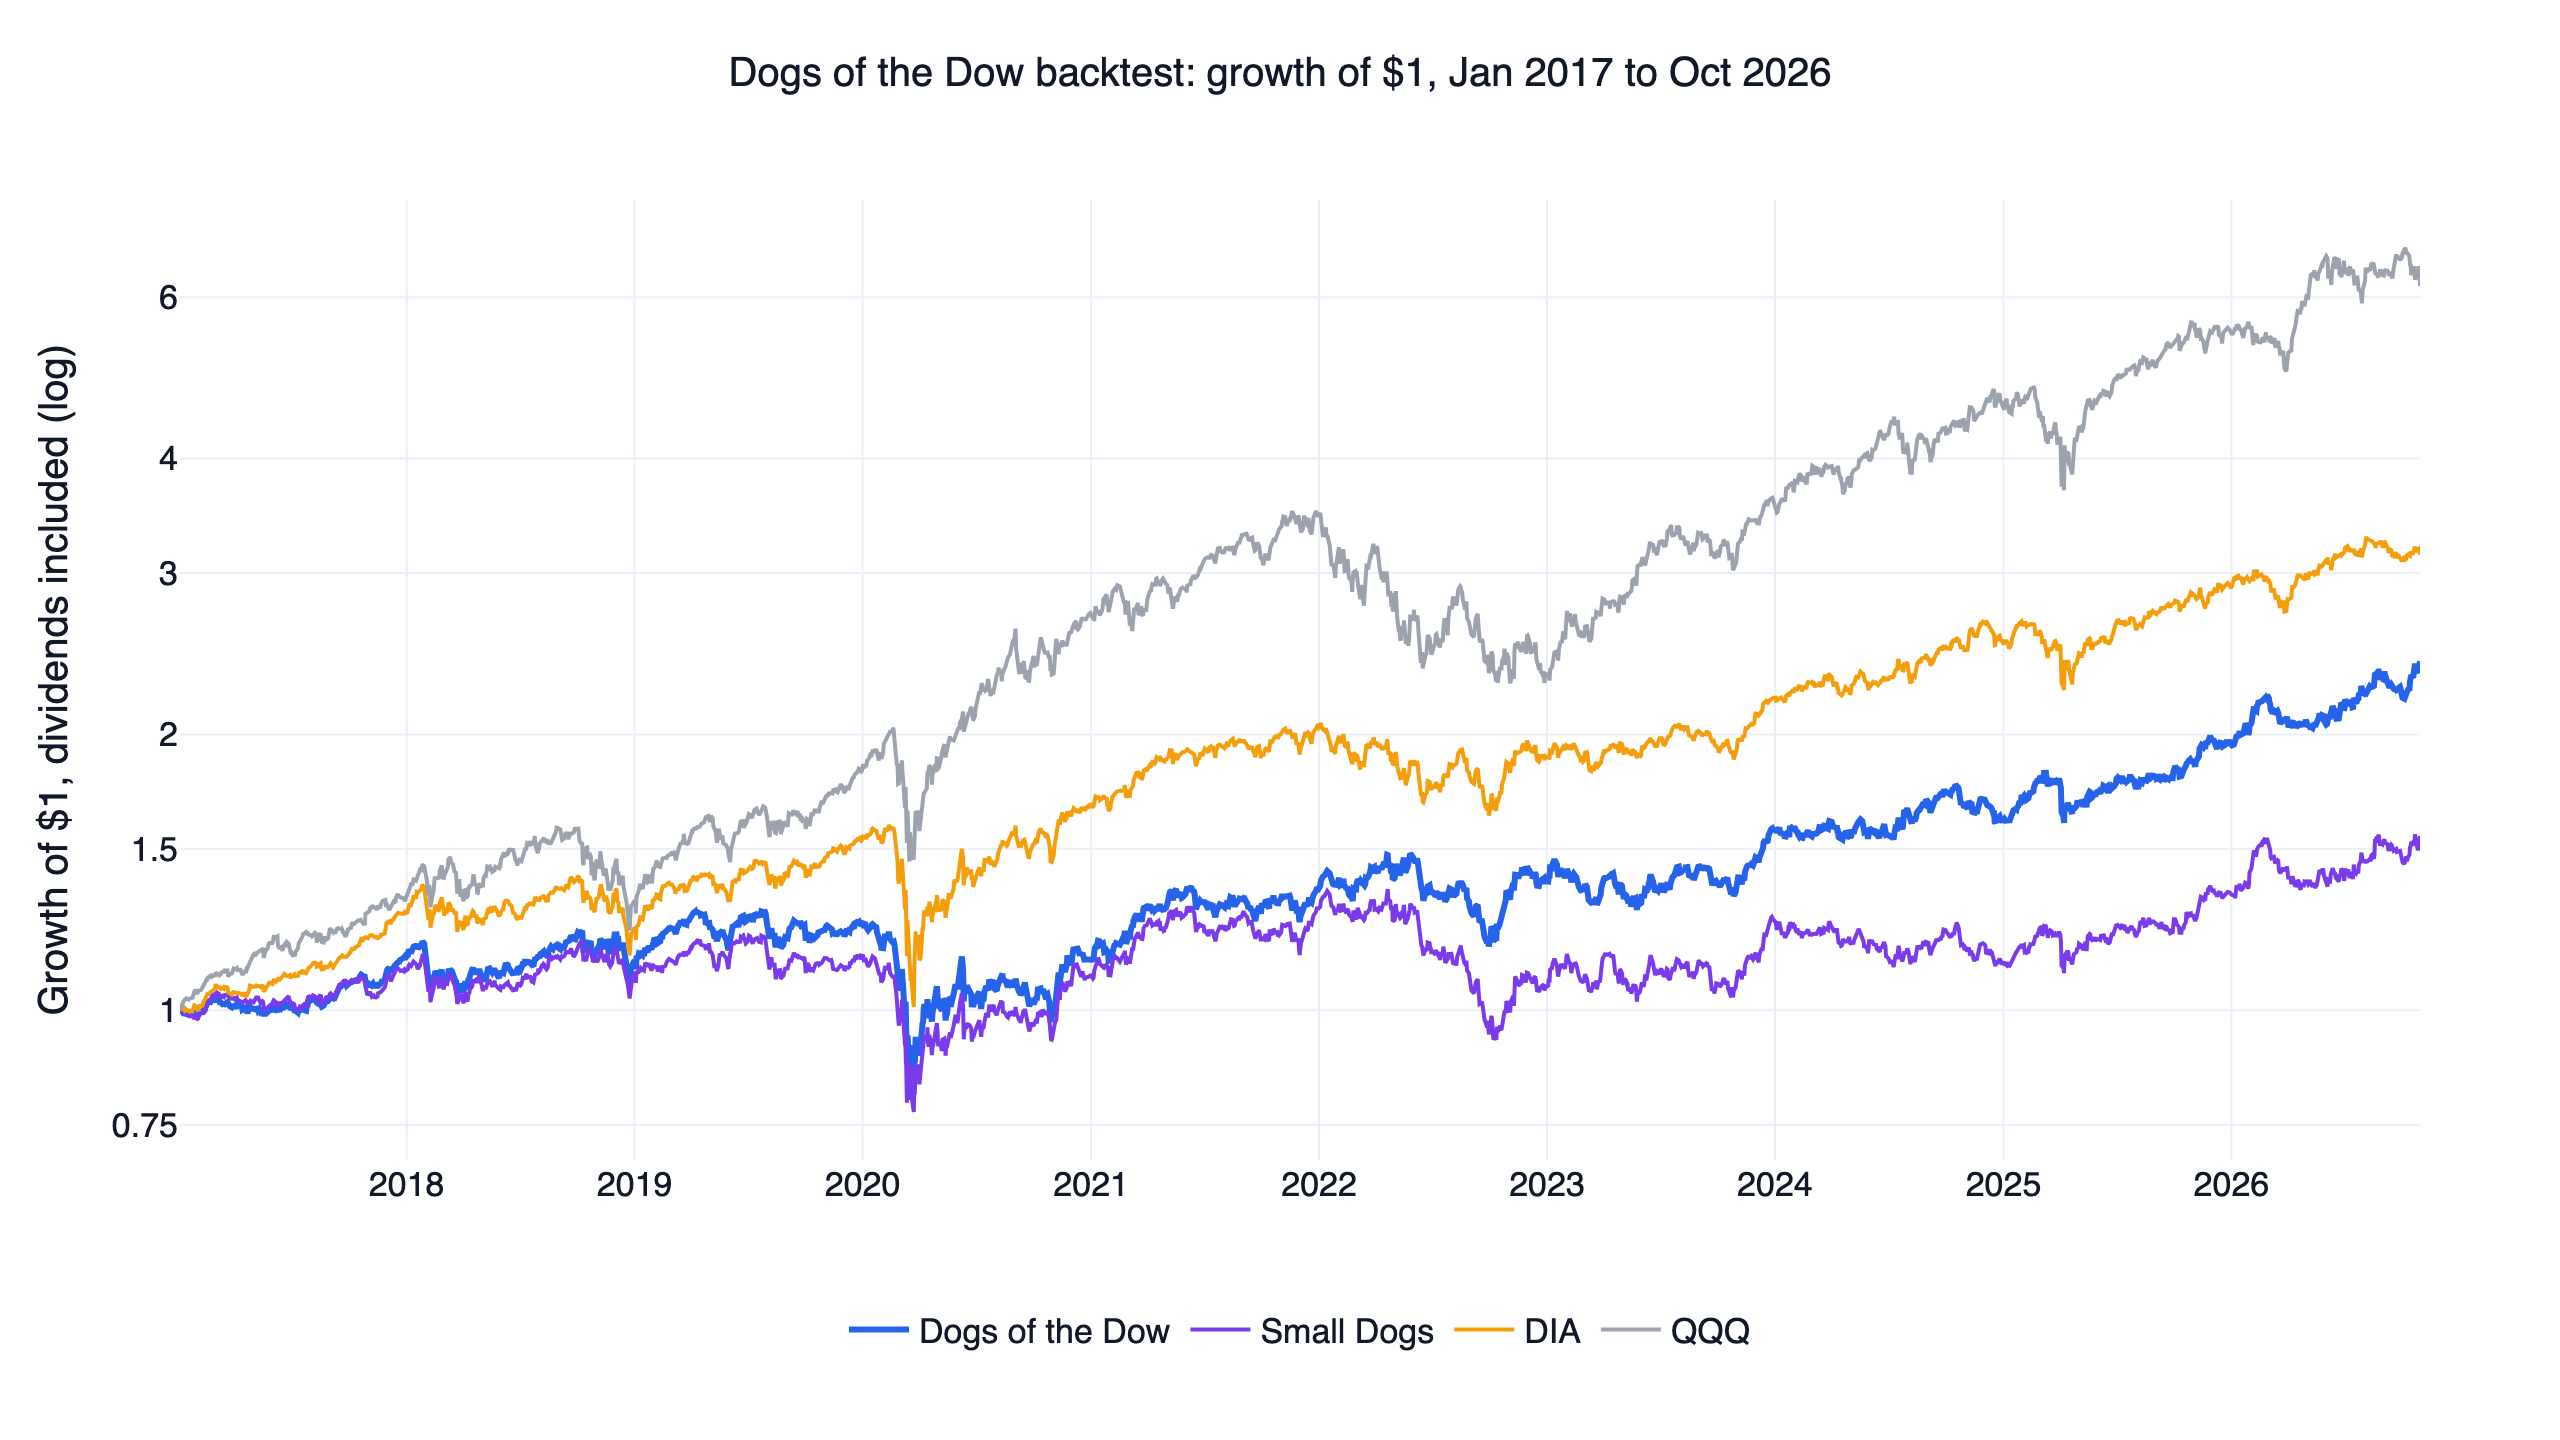
The Dogs of the Dow strategy buys the 10 highest-yielding stocks in the Dow Jones Industrial Average each year and holds them for 12 months. From January 2017 to October 2026 it compounded at 9.3% a year with a daily Sharpe ratio of 0.61, against 20.4% and 0.93 for QQQ with dividends reinvested and 12.4% and 0.75 for DIA, the ETF that tracks the Dow itself. The five-stock Small Dogs did worse, at 4.6% and 0.34. None of the 18 settings we tested beat QQQ.
The strategy had a strong second half. Since late 2021 it beat QQQ on both Sharpe and return, helped by a 2.1% gain in 2022 while QQQ lost 32.6%, and by strong results in 2025 and 2026 so far. The first half was weak enough that the full window still fails.
The Dogs of the Dow at a glance
| Portfolio | Daily Sharpe | CAGR | Max drawdown | Settings beating QQQ | First / second half Sharpe |
|---|---|---|---|---|---|
| Dogs of the Dow (10 stocks) | 0.61 | 9.3% | -36.8% | 0 / 9 | 0.37 / 0.96 |
| Small Dogs (5 stocks) | 0.34 | 4.6% | -35.8% | 0 / 9 | 0.28 / 0.40 |
| The other 20 Dow stocks | 0.77 | 13.0% | -34.8% | 0.89 / 0.62 | |
| DIA, total return | 0.75 | 12.4% | -36.7% | reference | 0.79 / 0.72 |
| SPY, total return | 0.86 | 14.9% | -33.7% | reference | 0.97 / 0.74 |
| QQQ, total return | 0.93 | 20.4% | -35.1% | benchmark | 1.25 / 0.62 |
Every line runs from 2017-01-03 to 2026-10-30, with dividends reinvested. The halves split at 2021-11-29. The other group held 19 stocks until DowDuPont arrived in September 2017.
How the Dogs had to pass
"Beat" means a higher daily Sharpe ratio than QQQ with dividends reinvested, over exactly the same trading days. Sharpe here is the mean daily return over its standard deviation, annualised with √252, with no risk-free rate subtracted. The conditions were written down before any result was seen, and they did not change afterwards.
- Neighbouring settings. The number of stocks and the rebalance month each took the original value and one value either side, nine settings per design. At least 70% had to beat QQQ.
- Both halves. The window was cut at its midpoint, and the original setting had to win in each half.
- Costs. The original setting had to win at finlab's default US cost of zero and again at 0.1% per side.
- No single year. It had to stay ahead of QQQ after removing the calendar year of its largest lead.
QQQ is the benchmark for every US strategy on this site, so results stay comparable. For a Dow strategy, DIA is the fairer comparison, and it appears throughout.
The two designs
O'Higgins and Downes (1991) popularised the rule in Beating the Dow. High yield in a blue-chip company often means the price has fallen, so the rule buys unpopular large companies and waits for them to recover.
- Dogs of the Dow. On the last trading day of December, rank the Dow stocks by dividend yield, buy the top 10 at equal weight at the next close, and hold for a year. Grid: 8, 10 or 12 stocks, rebalanced in November, December or January.
- Small Dogs. Take those top 10 yields and keep the five with the lowest share price. Grid: 4, 5 or 6 stocks across the same three months.
Yield is dividends with an ex-date in the past 12 months, restated for later splits and for the spin-offs FinLab records as split factors, over that day's close. FinLab's dividend records start in January 2016, so December 2016 is the first complete window. January 2017 works too, while the November column starts a year later, in November 2017.
FinLab has no table of Dow members, so research.py carries one, built from S&P Dow Jones Indices announcements:
| Effective | Joined | Left | Source |
|---|---|---|---|
| 2017-09-01 | DowDuPont | E. I. du Pont | S&P DJI |
| 2018-06-26 | Walgreens Boots Alliance | General Electric | S&P DJI |
| 2019-04-02 | Dow Inc. | DowDuPont | S&P DJI |
| 2020-08-31 | Amgen, Honeywell, Salesforce | Exxon Mobil, Pfizer, Raytheon Technologies | S&P DJI |
| 2024-02-26 | Amazon | Walgreens Boots Alliance | S&P DJI |
| 2024-11-08 | Nvidia, Sherwin-Williams | Intel, Dow Inc. | S&P DJI |
| 2026-06-29 | Alphabet | Verizon | S&P DJI |
United Technologies became Raytheon Technologies in April 2020, and FinLab keeps both under the ticker RTX, so that change needs no entry. FinLab's DD series before September 2017 is not E. I. du Pont's traded price, so DuPont is left out of the rankings before the merger, which leaves 29 names for the December 2016 and January 2017 signals. Its roughly 2.1% yield sat well below the 3.15% needed for the top 10.
Result 1: the Dogs trailed QQQ, DIA and SPY
The chart at the top shows the gap opening early. It narrowed after 2021 but stayed wide. By October 2026 the Dogs had grown about 2.4 times, DIA about 3.1 times and QQQ about 6.2 times. Volatility was the lowest of the group at 16.9%, against 17.7% for DIA and 22.8% for QQQ, but the worst drawdown was no shallower: -36.8% in March 2020, against -36.7% for DIA and -35.1% for QQQ.
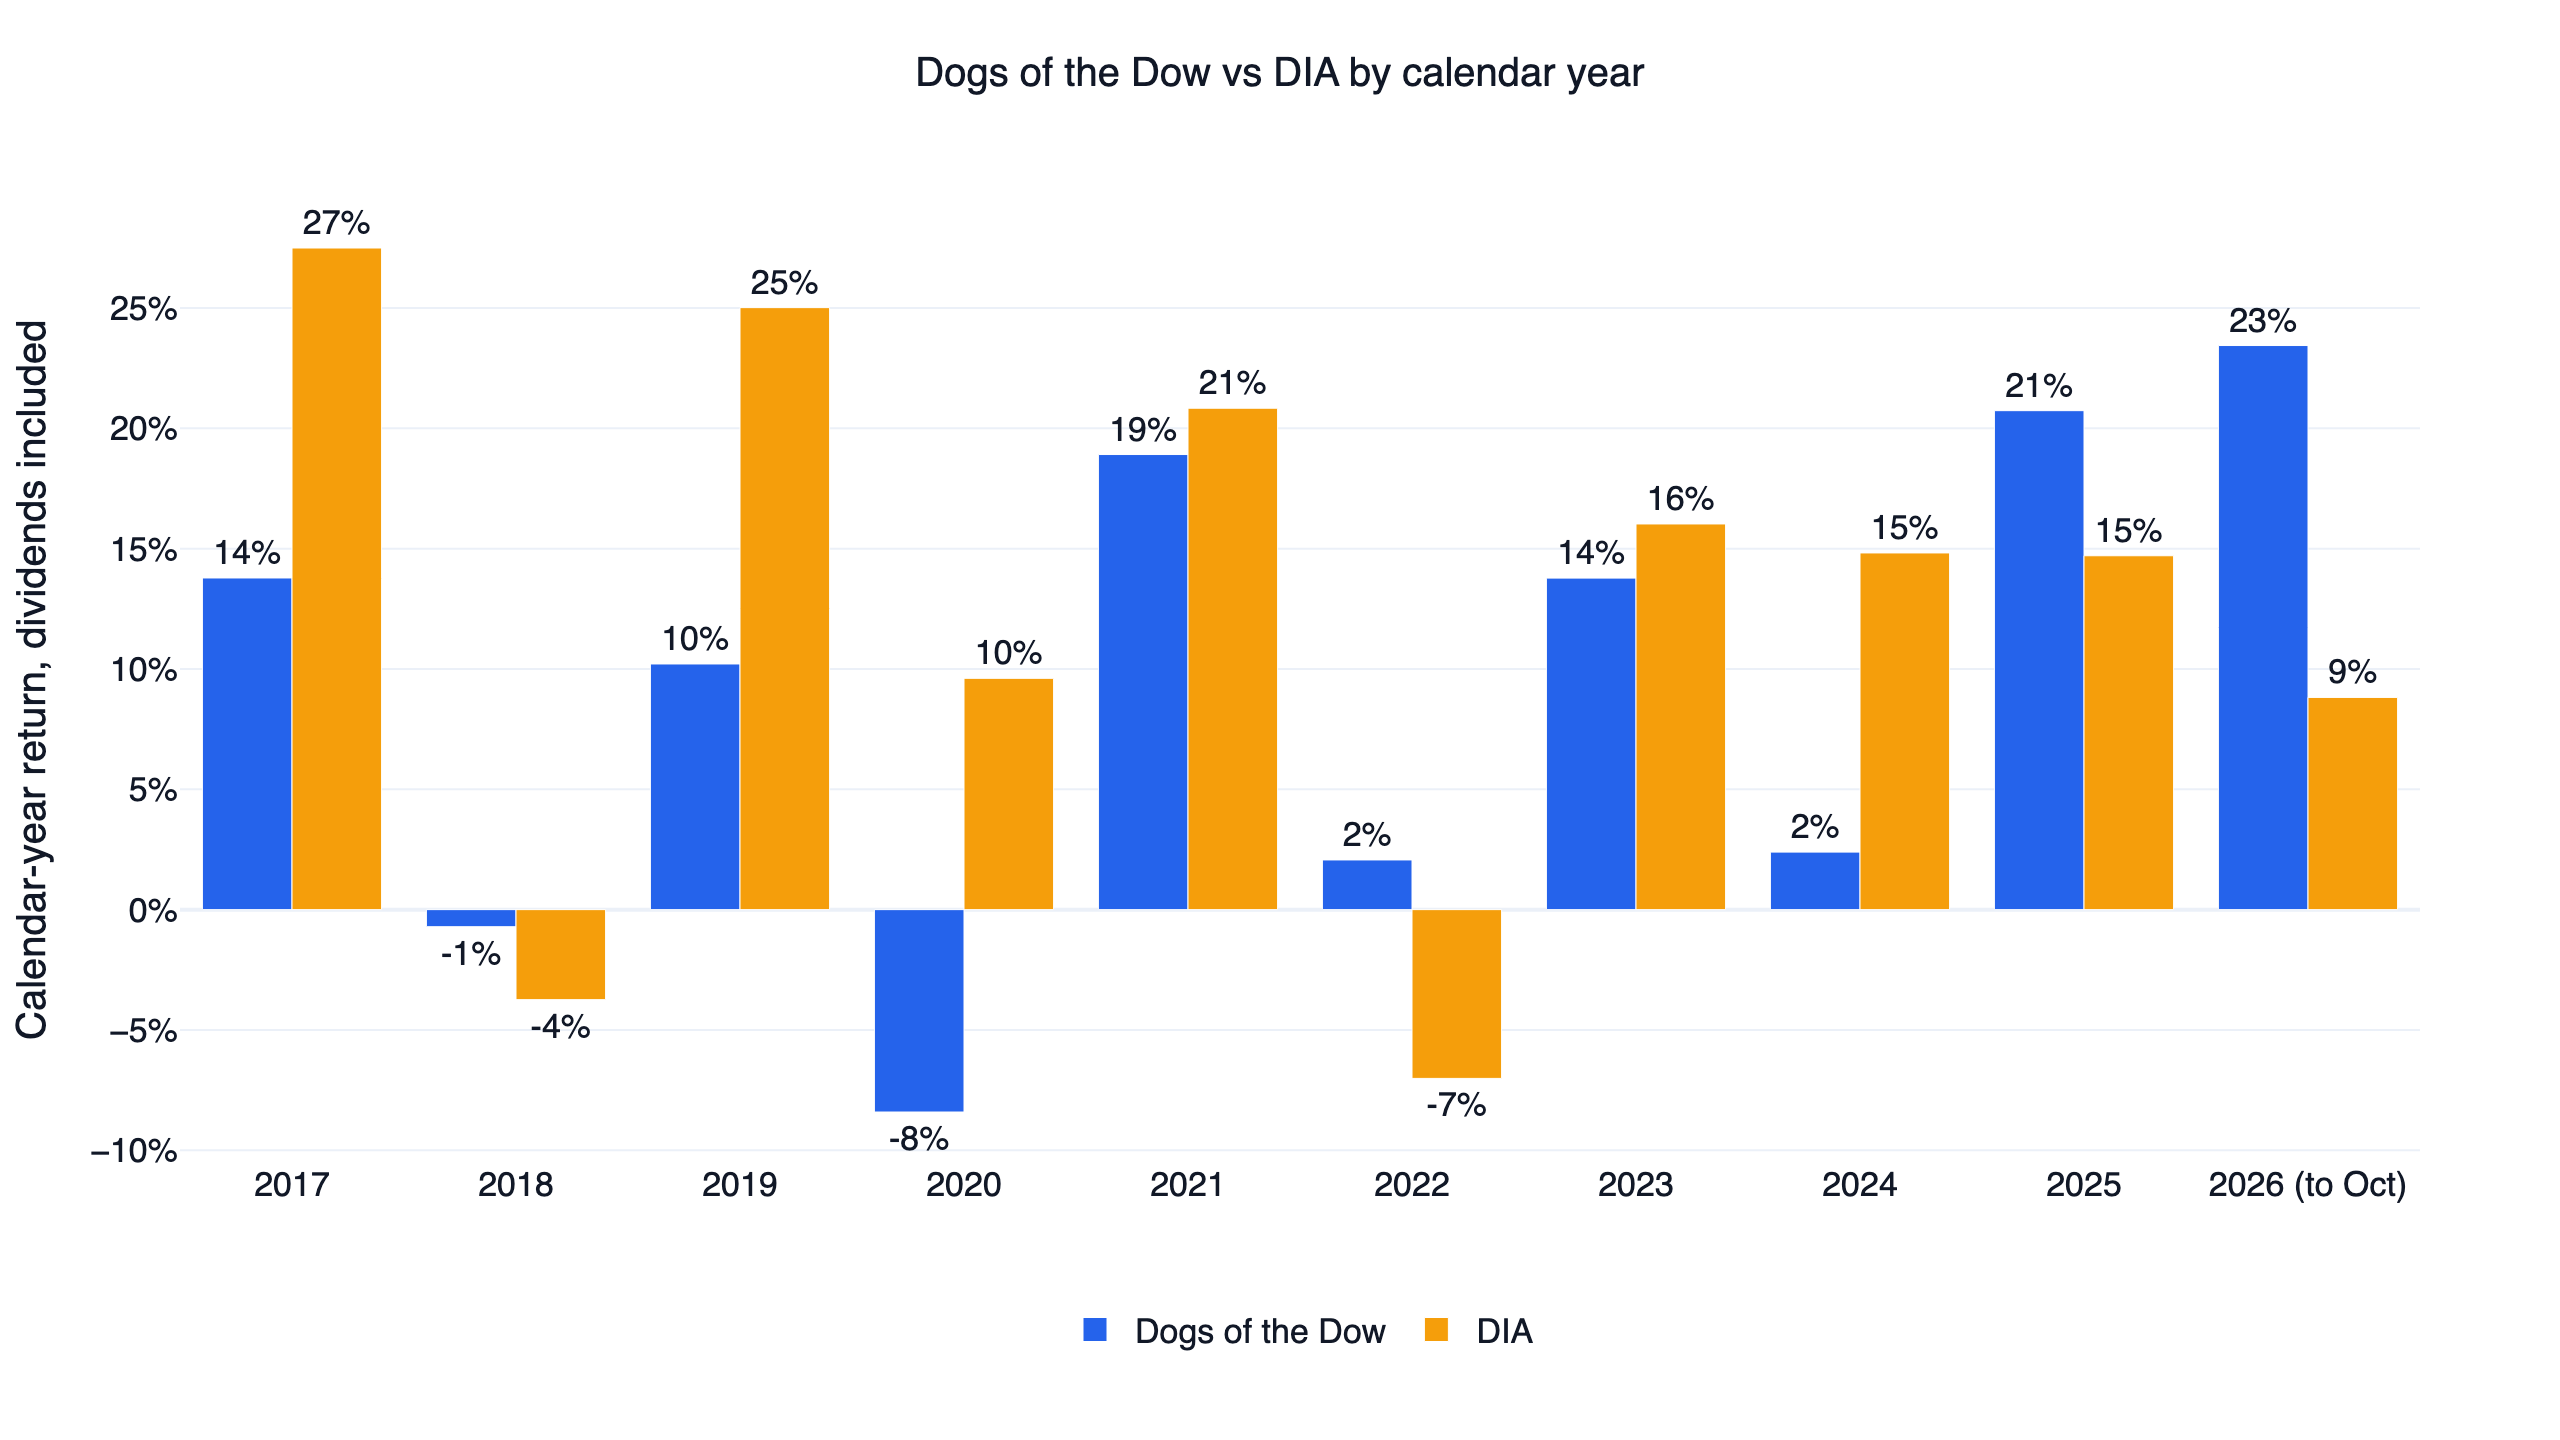
Year by year, the Dogs beat DIA in four of ten: 2018, 2022, 2025 and 2026 so far. They beat QQQ in two, 2022 and 2026 so far. The worst stretch was 2019 to 2020, when DIA gained 25.0% and 9.6% and the Dogs made 10.2% and lost 8.4%.
Result 2: the stocks the rule rejected did better, until 2021
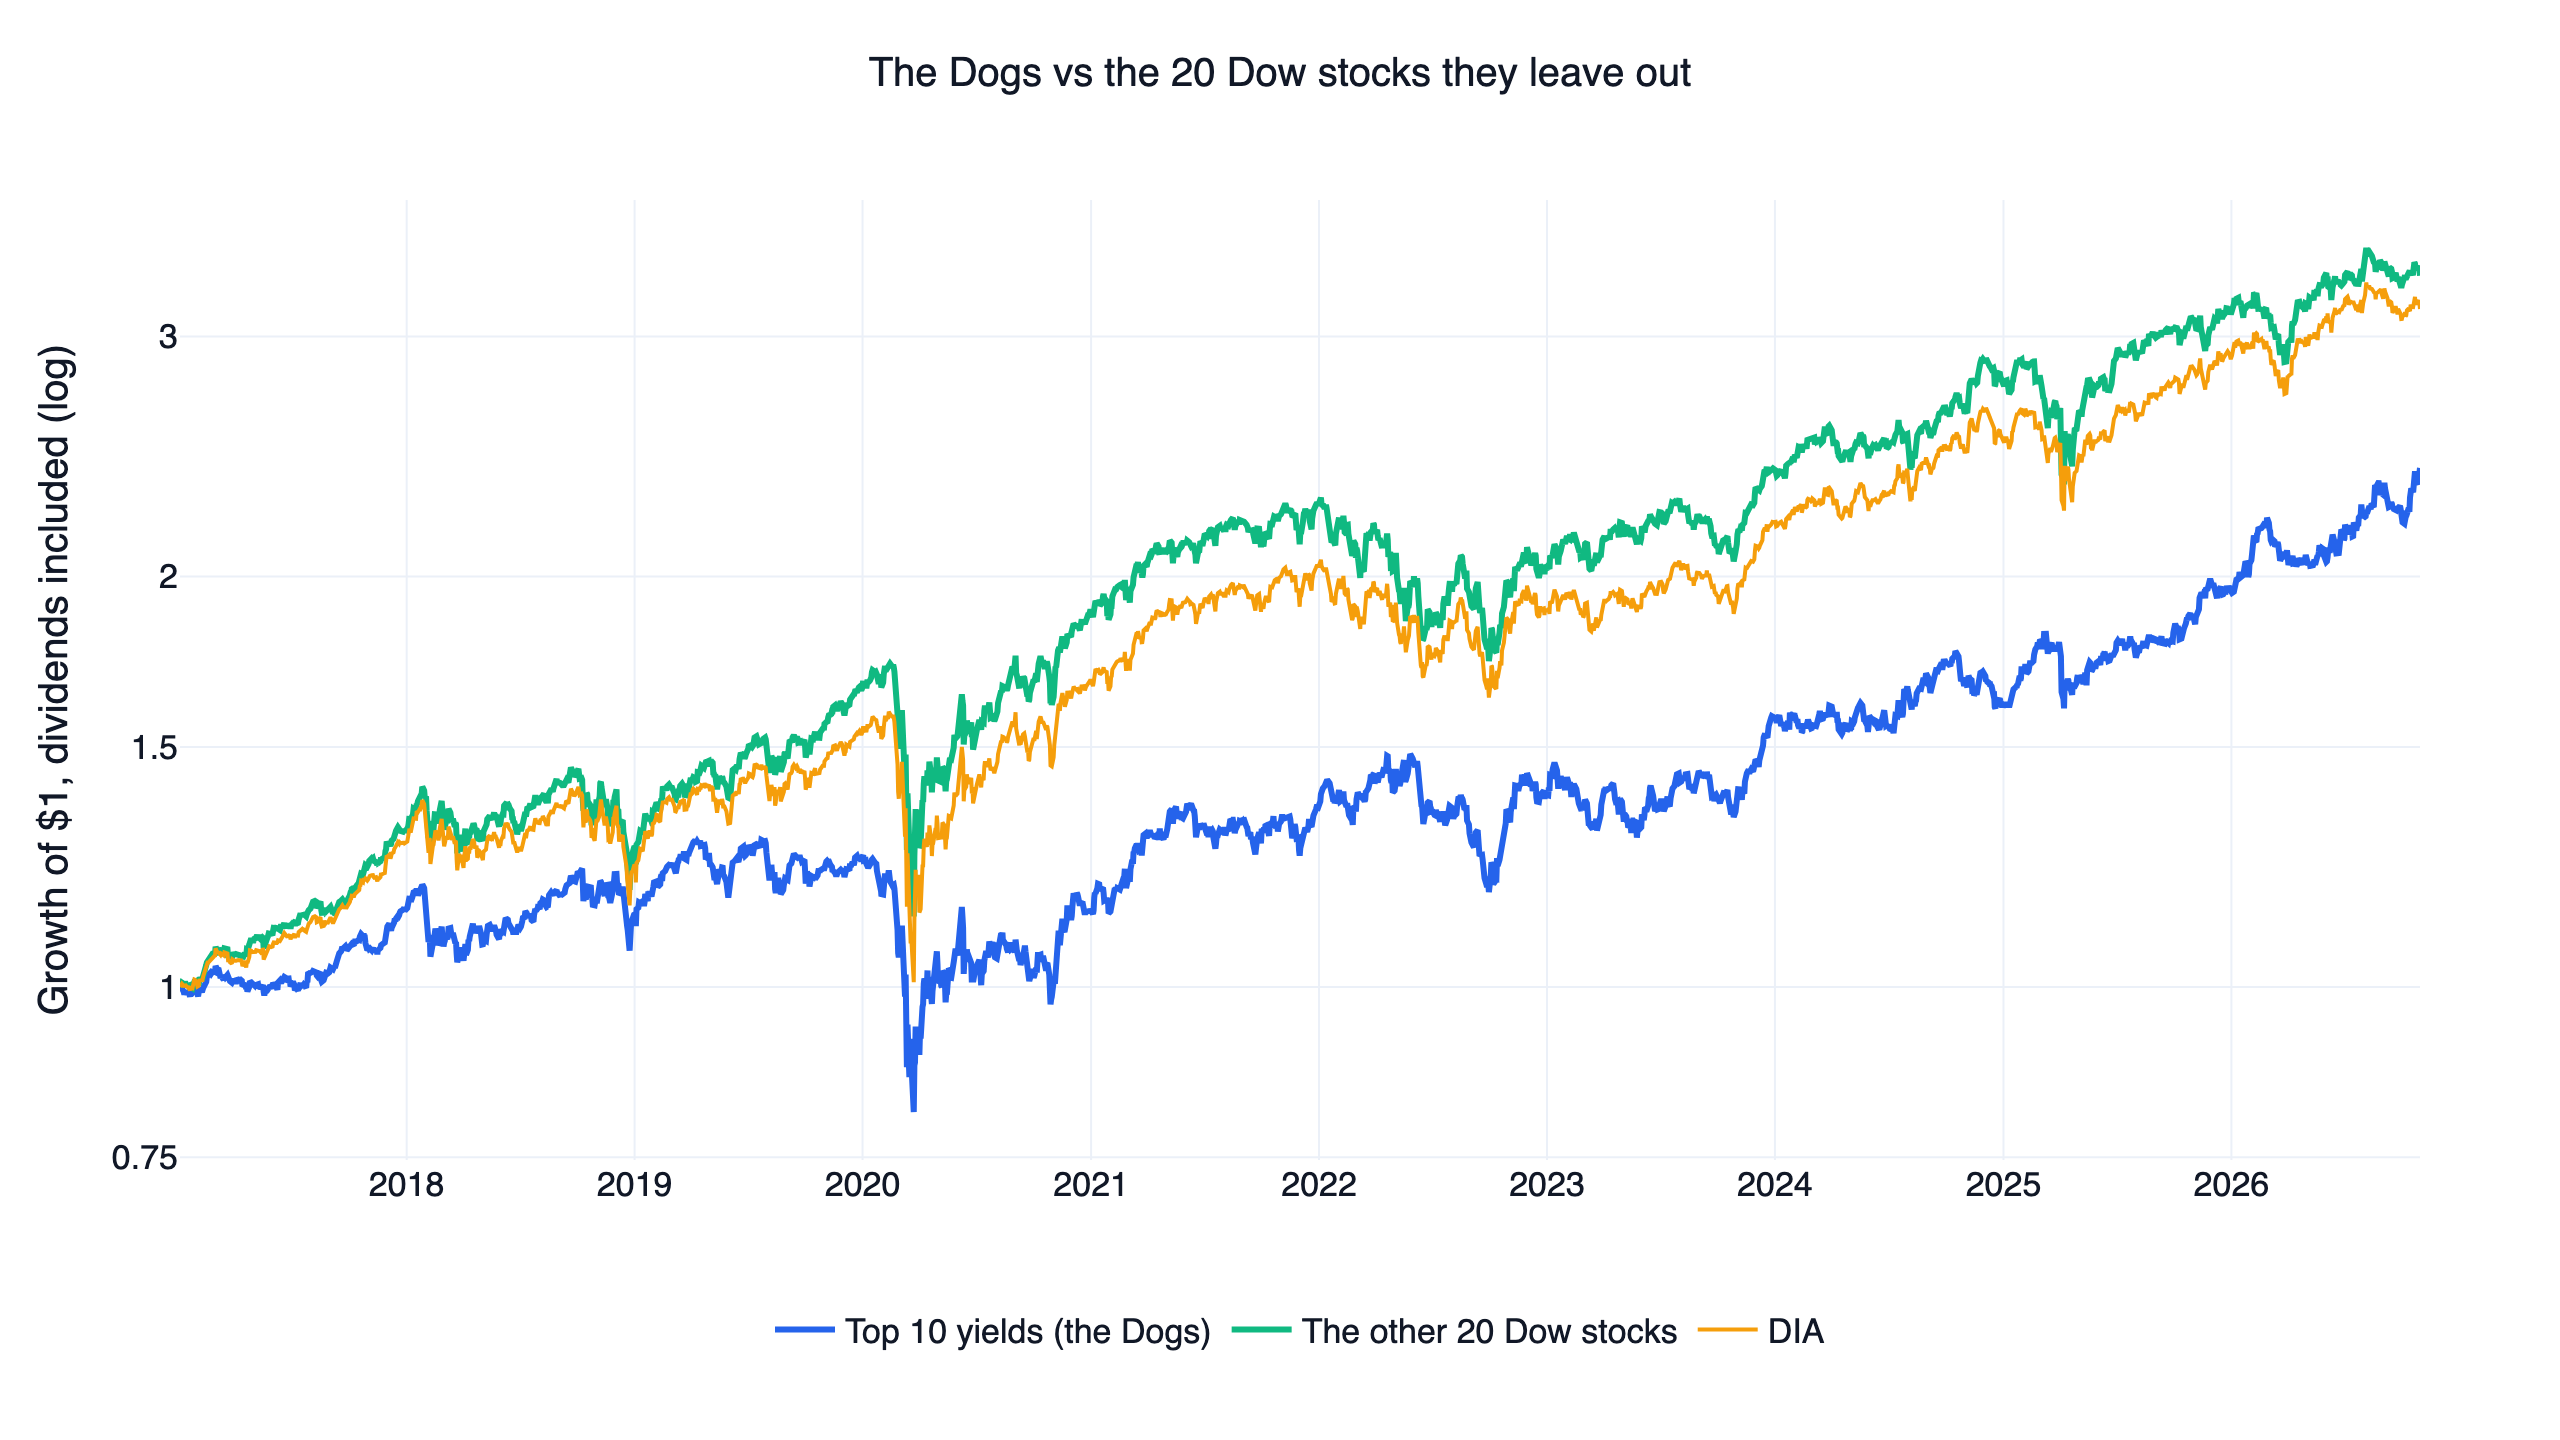
Each year the rule splits the Dow in two: the high yielders it buys and the rest it ignores. Holding the rest at equal weight tests the idea directly, because both groups come from the same 30 companies. We added this comparison after seeing the results, so treat it as a check.
| Period | Dogs Sharpe | Other 20 Sharpe | Dogs CAGR | Other 20 CAGR |
|---|---|---|---|---|
| Full window | 0.61 | 0.77 | 9.3% | 13.0% |
| 2017-01 to 2021-11 | 0.37 | 0.89 | 5.3% | 17.2% |
| 2021-11 to 2026-10 | 0.96 | 0.62 | 13.5% | 9.0% |
Over the full window the other 20 stocks were ahead and slightly beat DIA, and they won six calendar years out of ten. The whole lead came from the first half; the Dogs won the second. Bessembinder (2018) found that a small minority of US stocks produce most of the market's long-run wealth. If those winners pay low dividends, a yield rule will tend to miss them, which would fit the first half, though we did not test that directly.
The losses inside the list were large. These are the returns of single picks over the year after they were chosen:
- General Electric, 2018: -55%. Its trailing yield of 4.82% was the highest in the Dow, and the dividend had already been cut.
- Walgreens, 2020 to 2024: on the list five years running, down in four of them and -80% compounded, with -63% in 2024 alone.
- Intel, 2022: -48%, followed by +83% in 2023.
- Nike, 2026 so far: -37%.
Result 3: no setting beat QQQ
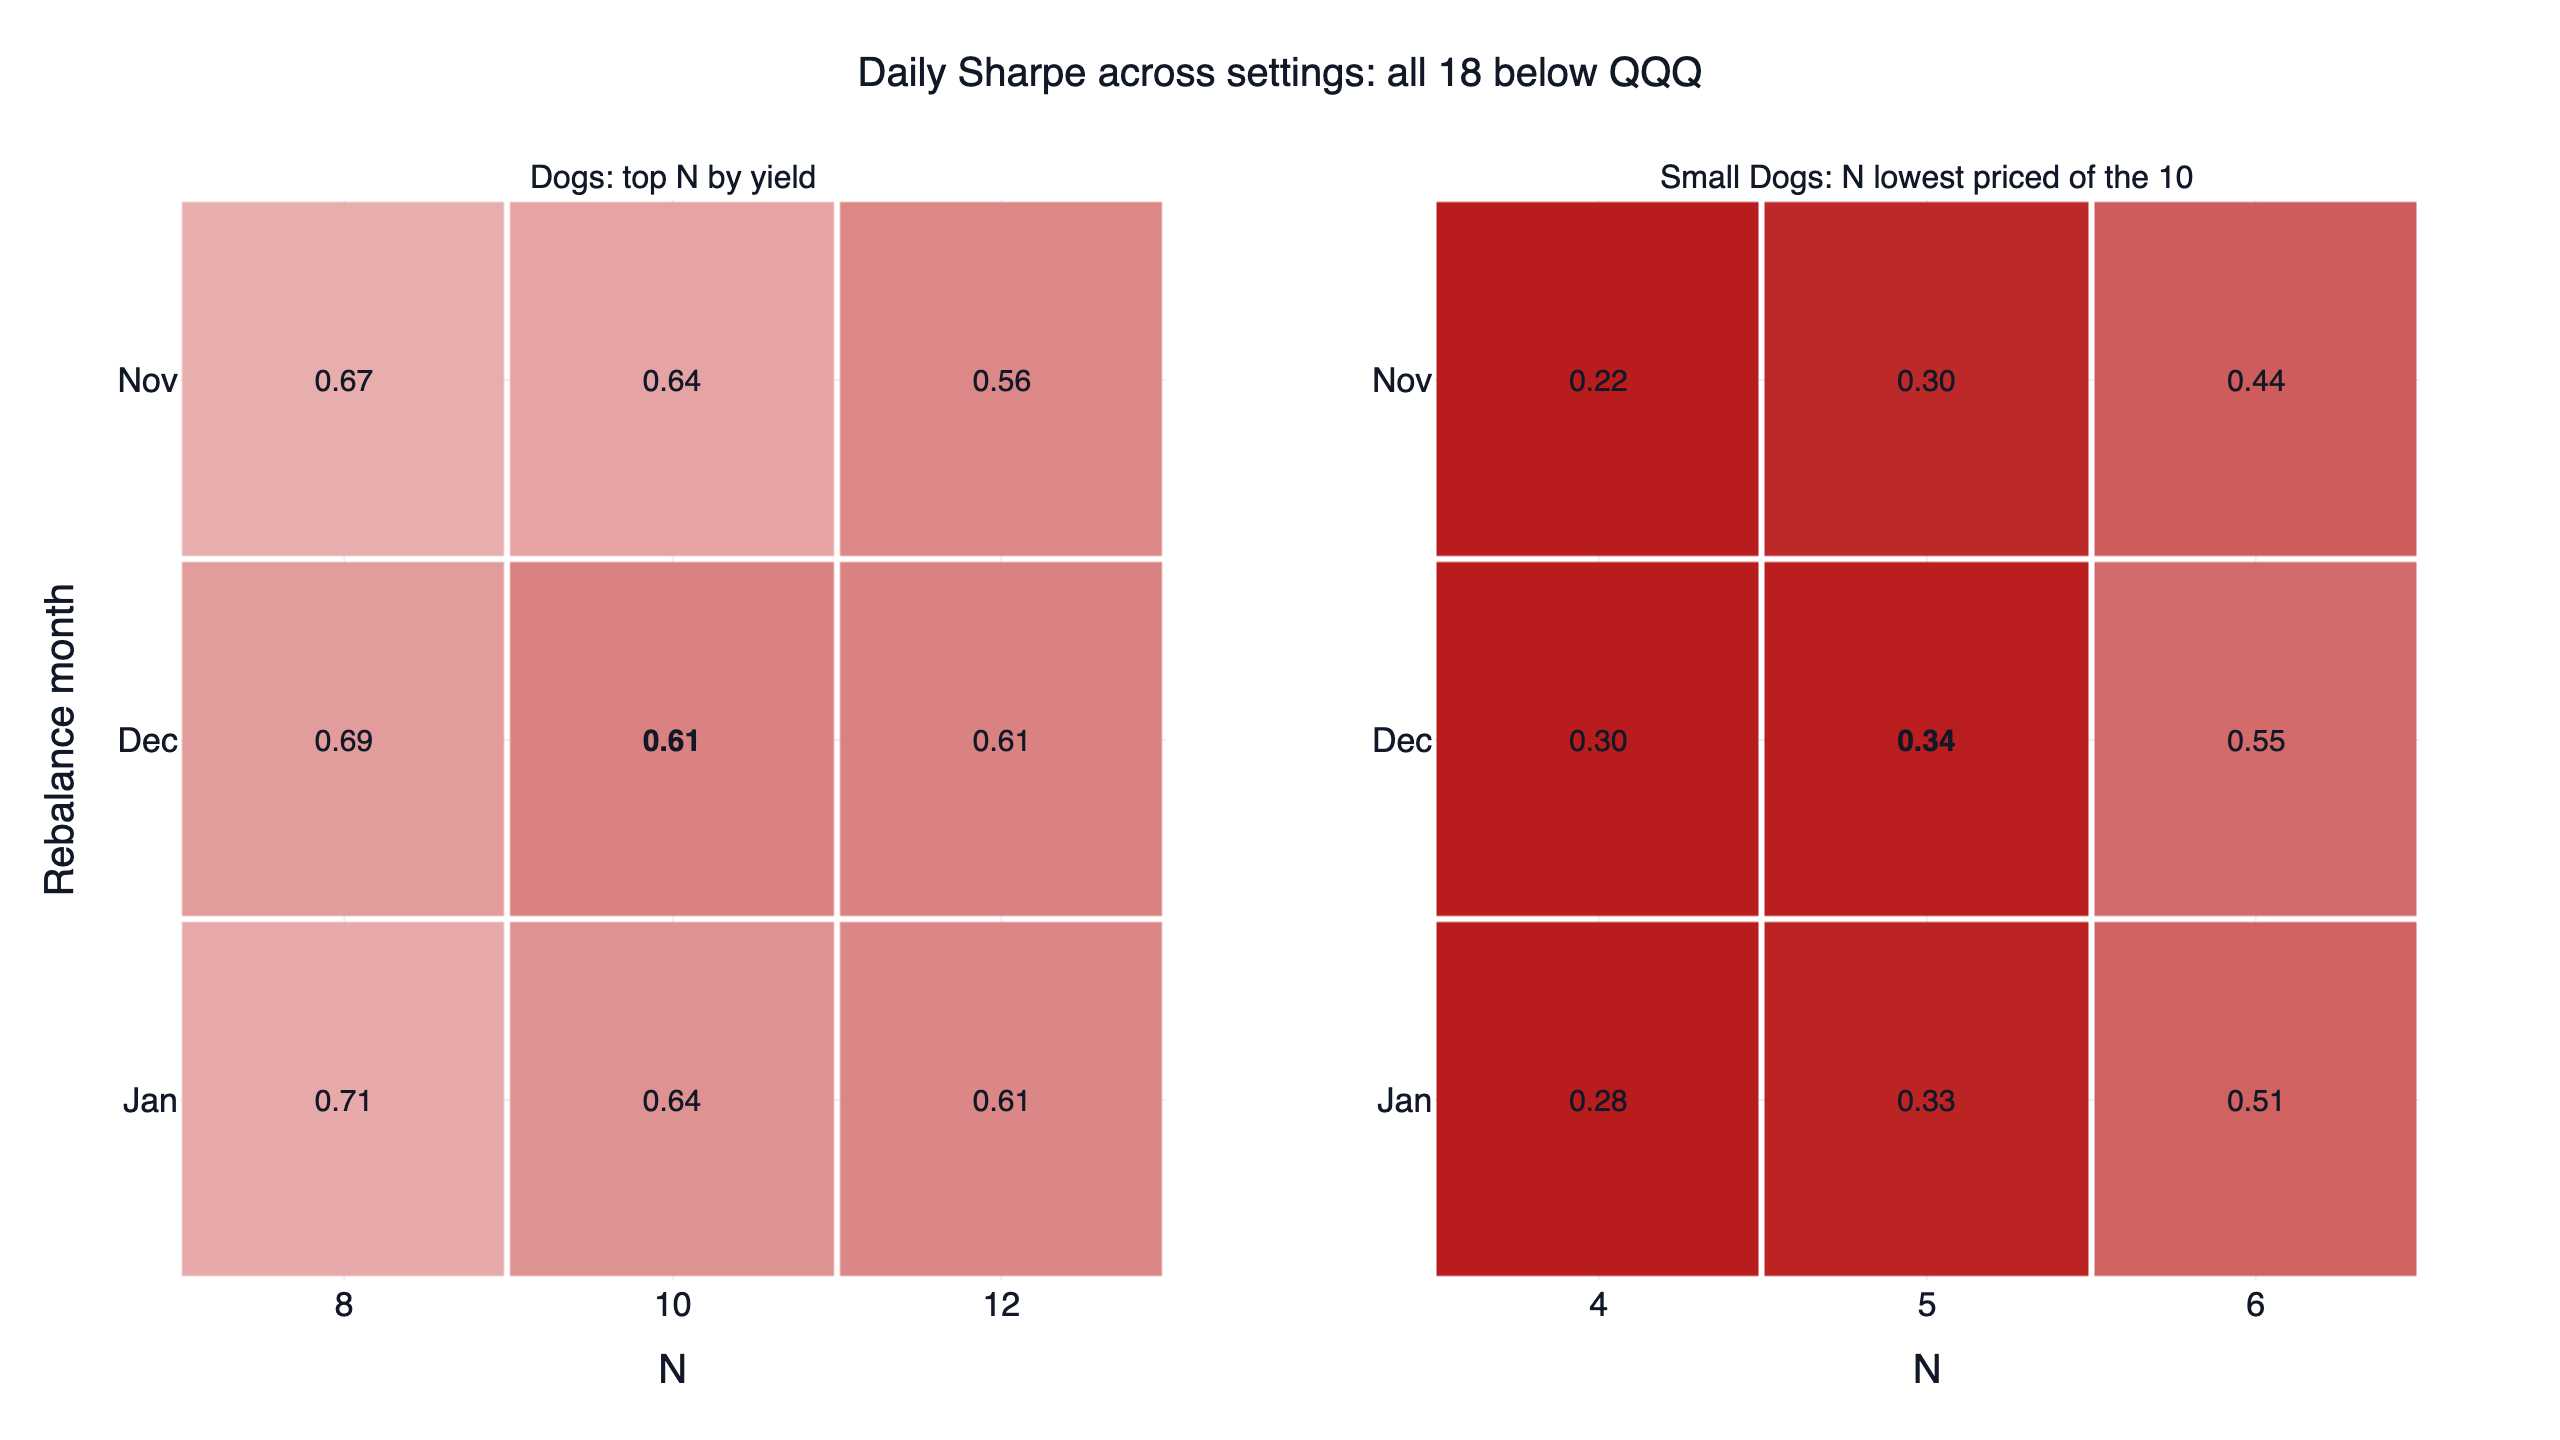
Bold marks the original setting. All 18 cells are below QQQ on the same dates. The best Dogs setting, eight stocks rebalanced in January, reached 0.71 against 0.91 for QQQ. Against DIA one setting of the 18 won: eight stocks rebalanced in November, 0.67 to 0.66, over a window that starts in December 2017.
The month barely matters for the Dogs: at 10 stocks, November, December and January score 0.64, 0.61 and 0.64. The number of stocks matters more. For the Small Dogs, moving from five stocks to six lifted the Sharpe from 0.34 to 0.55. A swing that large from adding one stock suggests the result depends on a few names, so the five-stock figures say as much about individual companies as about the rule.
Result 4: the second half does not rescue the full window
| Period | Dogs Sharpe | DIA Sharpe | QQQ Sharpe | Dogs CAGR | DIA CAGR | QQQ CAGR |
|---|---|---|---|---|---|---|
| 2017-01 to 2021-11 | 0.37 | 0.79 | 1.25 | 5.3% | 14.7% | 28.9% |
| 2021-11 to 2026-10 | 0.96 | 0.72 | 0.62 | 13.5% | 10.1% | 12.4% |
The recent half is a clear win against both DIA and QQQ. It also holds 2022, the year of the largest lead over QQQ at 34.6 points. Take 2022 out of that half and the Dogs score 1.21 and 16.7% a year, against 1.33 and 28.2% for QQQ. Take it out of the full window and they score 0.66 against 1.28. So the Dogs behaved like a defensive value holding: well behind in growth markets and ahead when growth stocks fell. That may suit a reader who wants a diversifier. It did not replace QQQ here.
Costs are a small part of the story. At 0.1% per side the Sharpe stays at 0.61 and the CAGR at 9.3%, because the portfolio trades once a year and replaces about 2 of its 10 names each time.
Every list since 2016
The table uses the rule in this study, trailing 12-month yield at the year-end close. The return is the portfolio's calendar-year result, with 2026 running to October 30.
| Signal | Ten highest yields | Next year | DIA |
|---|---|---|---|
| 2016-12-30 | VZ, PFE, CVX, KO, CAT, IBM, XOM, CSCO, PG, MRK | 13.8% | 27.5% |
| 2017-12-29 | GE, VZ, IBM, XOM, PFE, CVX, MRK, KO, PG, CSCO | -0.7% | -3.7% |
| 2018-12-31 | IBM, XOM, VZ, CVX, KO, PFE, PG, CSCO, MMM, DD | 10.2% | 25.0% |
| 2019-12-31 | XOM, IBM, CVX, VZ, DOW, PFE, MMM, WBA, KO, CSCO | -8.4% | 9.6% |
| 2020-12-31 | CVX, IBM, DOW, WBA, VZ, MMM, CSCO, MRK, KO, JPM | 18.9% | 20.8% |
| 2021-12-31 | DOW, VZ, IBM, CVX, WBA, MRK, MMM, AMGN, KO, INTC | 2.1% | -7.0% |
| 2022-12-30 | VZ, DOW, INTC, WBA, MMM, IBM, CSCO, CVX, JPM, AMGN | 13.8% | 16.0% |
| 2023-12-29 | WBA, VZ, MMM, DOW, IBM, CVX, KO, CSCO, JNJ, AMGN | 2.4% | 14.8% |
| 2024-12-31 | VZ, CVX, AMGN, JNJ, MRK, KO, IBM, MMM, CSCO, PG | 20.7% | 14.7% |
| 2025-12-31 | VZ, CVX, MRK, KO, PG, AMGN, HD, UNH, NKE, JNJ | 23.4% | 8.8% |
Treat these lists as research output. Verizon left the Dow in June 2026 but stays in the portfolio until the next rebalance, as the rule says.
Published Dogs lists usually rank on the latest dividend annualised, so they pick up raises faster. CNBC's 2019 report has JPMorgan joining that year's list, while trailing yield leaves it out because only one of its four dividends in 2018 reflected the raise. We reran the backtest with a close stand-in for that ranking, the latest dividend times the payments in the last 12 months, as a check added after seeing the results. The lists overlap on 97 of 100 picks, 2019 improves from 10.2% to 19.2%, and the full window moves to 10.0% a year at a Sharpe of 0.66. The verdict stands.
The code
This ranks today's 30 Dow stocks by trailing yield. research.py adds the membership history, split restatement and the backtest.
Show Code
import pandas as pd
import finlab
from finlab import data

finlab.login()
data.set_market("us")

DOW_30 = ["AAPL", "AMGN", "AMZN", "AXP", "BA", "CAT", "CRM", "CSCO", "CVX", "DIS",
          "GOOGL", "GS", "HD", "HON", "IBM", "JNJ", "JPM", "KO", "MCD", "MMM",
          "MRK", "MSFT", "NKE", "NVDA", "PG", "SHW", "TRV", "UNH", "V", "WMT"]
day = pd.Timestamp("2026-10-30")

# Dividends with an ex-date in the last 12 months
actions = pd.DataFrame(data.get("us_corporate_actions"))
recent = actions[(actions["date"] > day - pd.DateOffset(years=1)) & (actions["date"] <= day)]
dividends = recent.groupby("stock_id")["dividend"].sum()

# Yield is those dividends over the latest close
close = data.get("us_price:close").loc[day]
yields = (dividends / close).reindex(DOW_30).fillna(0).sort_values(ascending=False)
print(yields.head(10).round(4))
Install the FinLab skill for your AI agent
You do not need to write this yourself. Install the FinLab skill in Claude Code, Codex or Gemini CLI with one command:
Show Code
npx skills add koreal6803/finlab-ai --skill finlab -g -yThen ask your agent in plain language, for example "rerun the Dogs of the Dow with a June rebalance" or "compare the top 10 yields in the Dow with the other 20 stocks". The agent setup page has the details, and FinLab Studio runs the same research in a browser.
Backtest method and limits
| Item | How it was handled |
|---|---|
| Window | 2017-01-03 to 2026-10-30. November settings start 2017-12-01 and January settings 2017-02-01; each is compared with QQQ on its own dates |
| Universe | The Dow's stocks on each signal date, from the table above; 29 names before September 2017. No other class is excluded |
| Liquidity | No filter. These are among the most traded US stocks. Capacity is not estimated |
| Turnover | About 2 of 10 names replaced a year |
| Yield | 12 months of ex-date dividends, restated for later splits and for spin-offs recorded as split factors, over the raw close |
| Weights | Equal when the list changes, then left to drift. A repeated list is not reset; this happens once, at the January 2018 signal of the 4- and 5-stock January Small Dogs |
| Execution | Signal at a close, traded at the next close (look-ahead bias checks: ex-dates and closes are known on the signal day) |
| Cost | finlab sim() default US cost of zero, plus a rerun at 0.1% per side. Slippage is not modelled |
| Spin-offs | Adjusted prices treat a spin-off as reinvested in the parent. Holding the spun-off shares instead gives a different result, for example DowDuPont in 2019 |
| Taxes | None. The picks yielded 3.82% on average, so 30% withholding on a non-US investor costs roughly 1.1 points a year |
| Sample | Whole window in-sample. The halves only check stability; no out-of-sample test was run |
What this result does and does not say
This window was unusually good for growth stocks and QQQ, so one decade of underperformance cannot settle the question. McQueen, Shields and Thorley (1997) tested 1946 to 1995 and found the Dow-10 beat the Dow on raw returns, stronger in some subperiods, while risk, taxes and trading costs took away most of the edge, and they raised data mining as a concern. Hirschey (2000) found that after taxes and rebalancing costs the Dogs performed in line with the Dow from 1961 to 1998. Our result is weaker than theirs: here the Dogs lost to the Dow before any adjustment.
The evidence here says high yield among Dow stocks did not add return over the full window from 2017 to 2026, and that it held up better than the rest of the Dow from late 2021. For other ways of holding dividend payers, the covered call and dividend stock backtest tests income strategies against QQQ, and the six famous stock screens include dividend growth. The US factor backtest and the factor investing guide cover value more broadly.
FAQ
What are the Dogs of the Dow?
The 10 stocks in the Dow Jones Industrial Average with the highest dividend yield at the end of a year. The strategy buys them at equal weight, holds them for a year and repeats.
Do the Dogs of the Dow beat the market?
Not in this test. From January 2017 to October 2026 they returned 9.3% a year, behind DIA at 12.4%, SPY at 14.9% and QQQ at 20.4%. They did beat all three in the stretch from November 2021.
What are the Dogs of the Dow for 2026?
Under the rule in this study, the end-of-2025 list is VZ, CVX, MRK, KO, PG, AMGN, HD, UNH, NKE and JNJ. Ranking on the latest dividend annualised gives the same ten names this year. The list comes from the rule, and no recommendation is implied.
What are the Small Dogs of the Dow?
The five lowest-priced stocks among the 10 highest yielders. In this window they returned 4.6% a year at a Sharpe of 0.34, well behind the full list.
Does the rebalance month matter?
Little. Across November, December and January, the 10-stock version ranged from 0.61 to 0.64 on Sharpe. Moving the holding count had a larger effect.
Why compare with QQQ when the Dogs come from the Dow?
QQQ is the shared benchmark across the US research on this site. DIA is the like-for-like comparison, so it is in every table. The Dogs lost to both over the full window.
How much does trading cost matter?
Almost nothing, because the portfolio trades once a year. The CAGR stays at 9.3% with 0.1% cost per side. Taxes on dividends matter more for a high-yield portfolio.
Can I rerun this?
Yes. Install the FinLab skill through the AI-assisted setup, download research.py below and run python research.py.
Reproduce it yourself
- research.py: both designs, the Dow membership table, the grids, both halves, the cost runs and the published-list check.
- data.csv: daily equity curves of the Dogs, the Small Dogs and the other Dow stocks, plus QQQ, SPY and DIA.
- metrics.json: the statistics behind this article, including all 18 settings and each pick's return.
The US strategy comparison collects the rest of the US research. New research is on the FinLab blog, the team is on the about page, and examples are on use cases. For other fixed rules, see the 52-week high stocks backtest and the golden cross stocks backtest.
Disclaimer: this article is for education only and does not constitute investment advice. Past performance does not guarantee future results, and investing involves risk. All results are in-sample, and the two halves were not validated out of sample. Stocks named here come from a rule, and no recommendation is implied.
Last updated: 2026-11 | Backtest window: 2017-01 to 2026-10 | Data through 2026-10-30, rerun 2026-11-01 | Benchmark: QQQ total return | Author: FinLab Quant Research (reviewed by a quantitative researcher)
FinLab AI
Want to build your own strategy?
Describe your stock-picking ideas in natural language. AI automatically validates, backtests, and gives you answers
Start Free