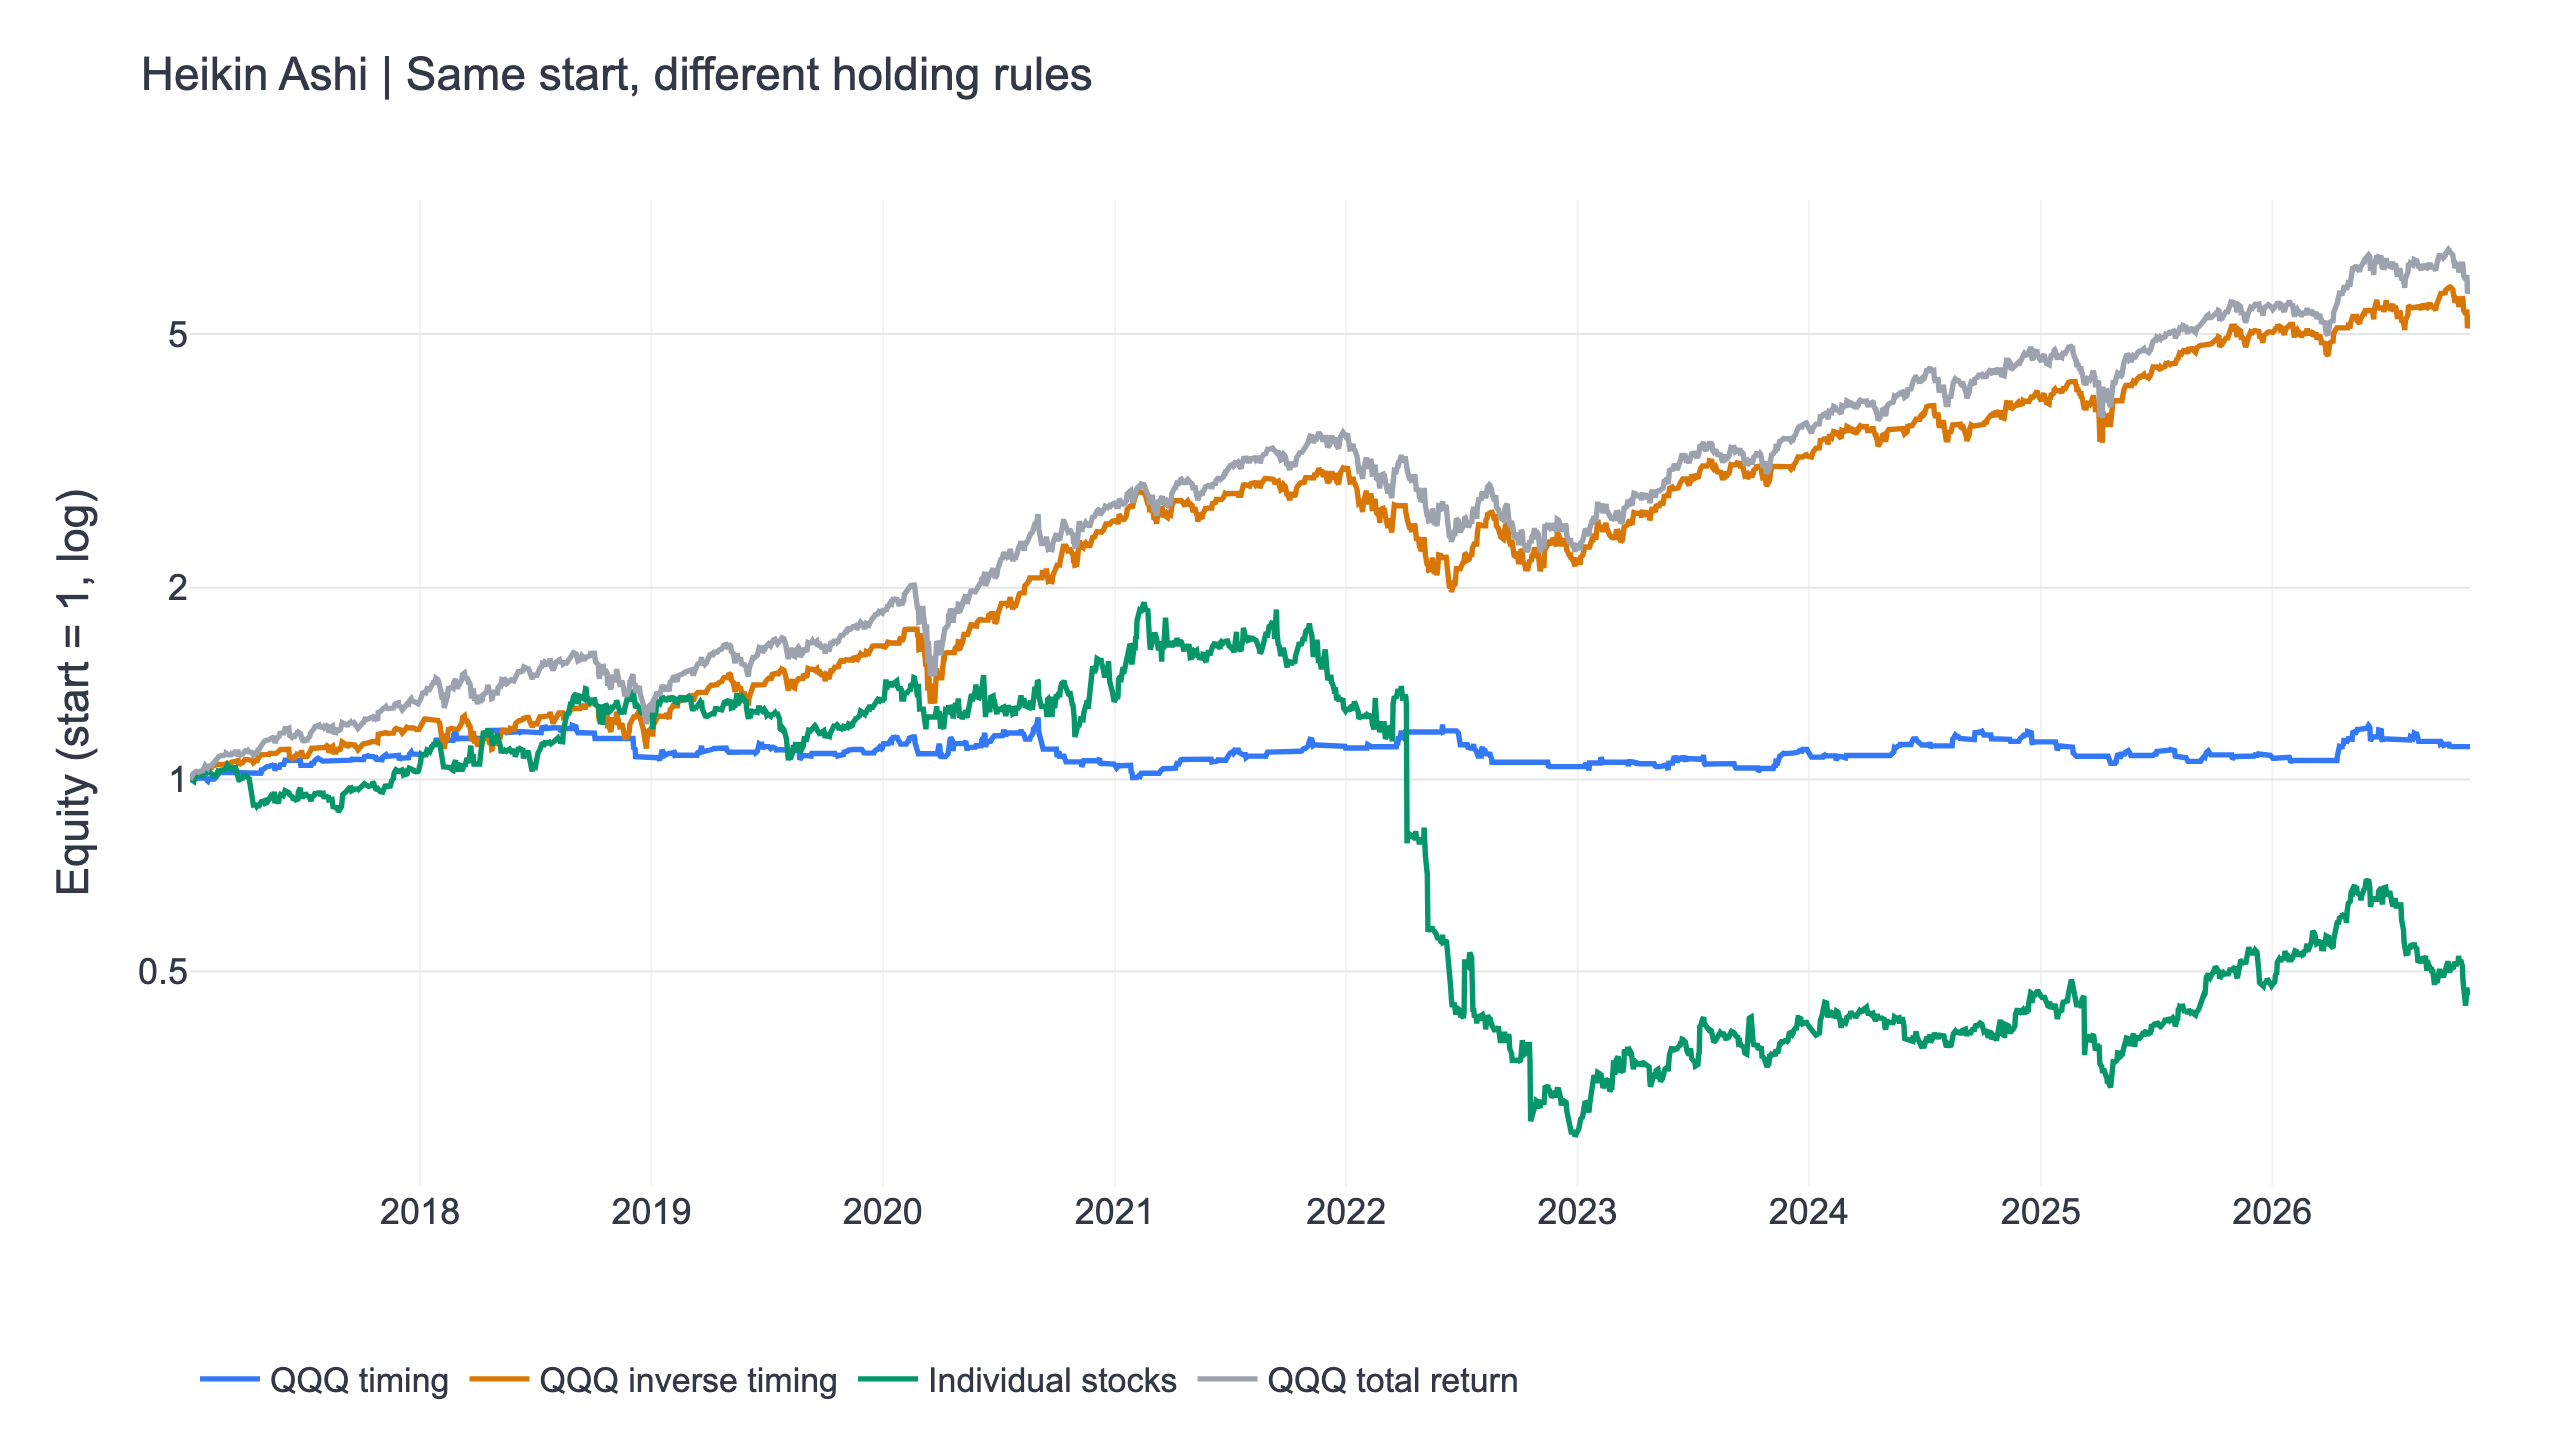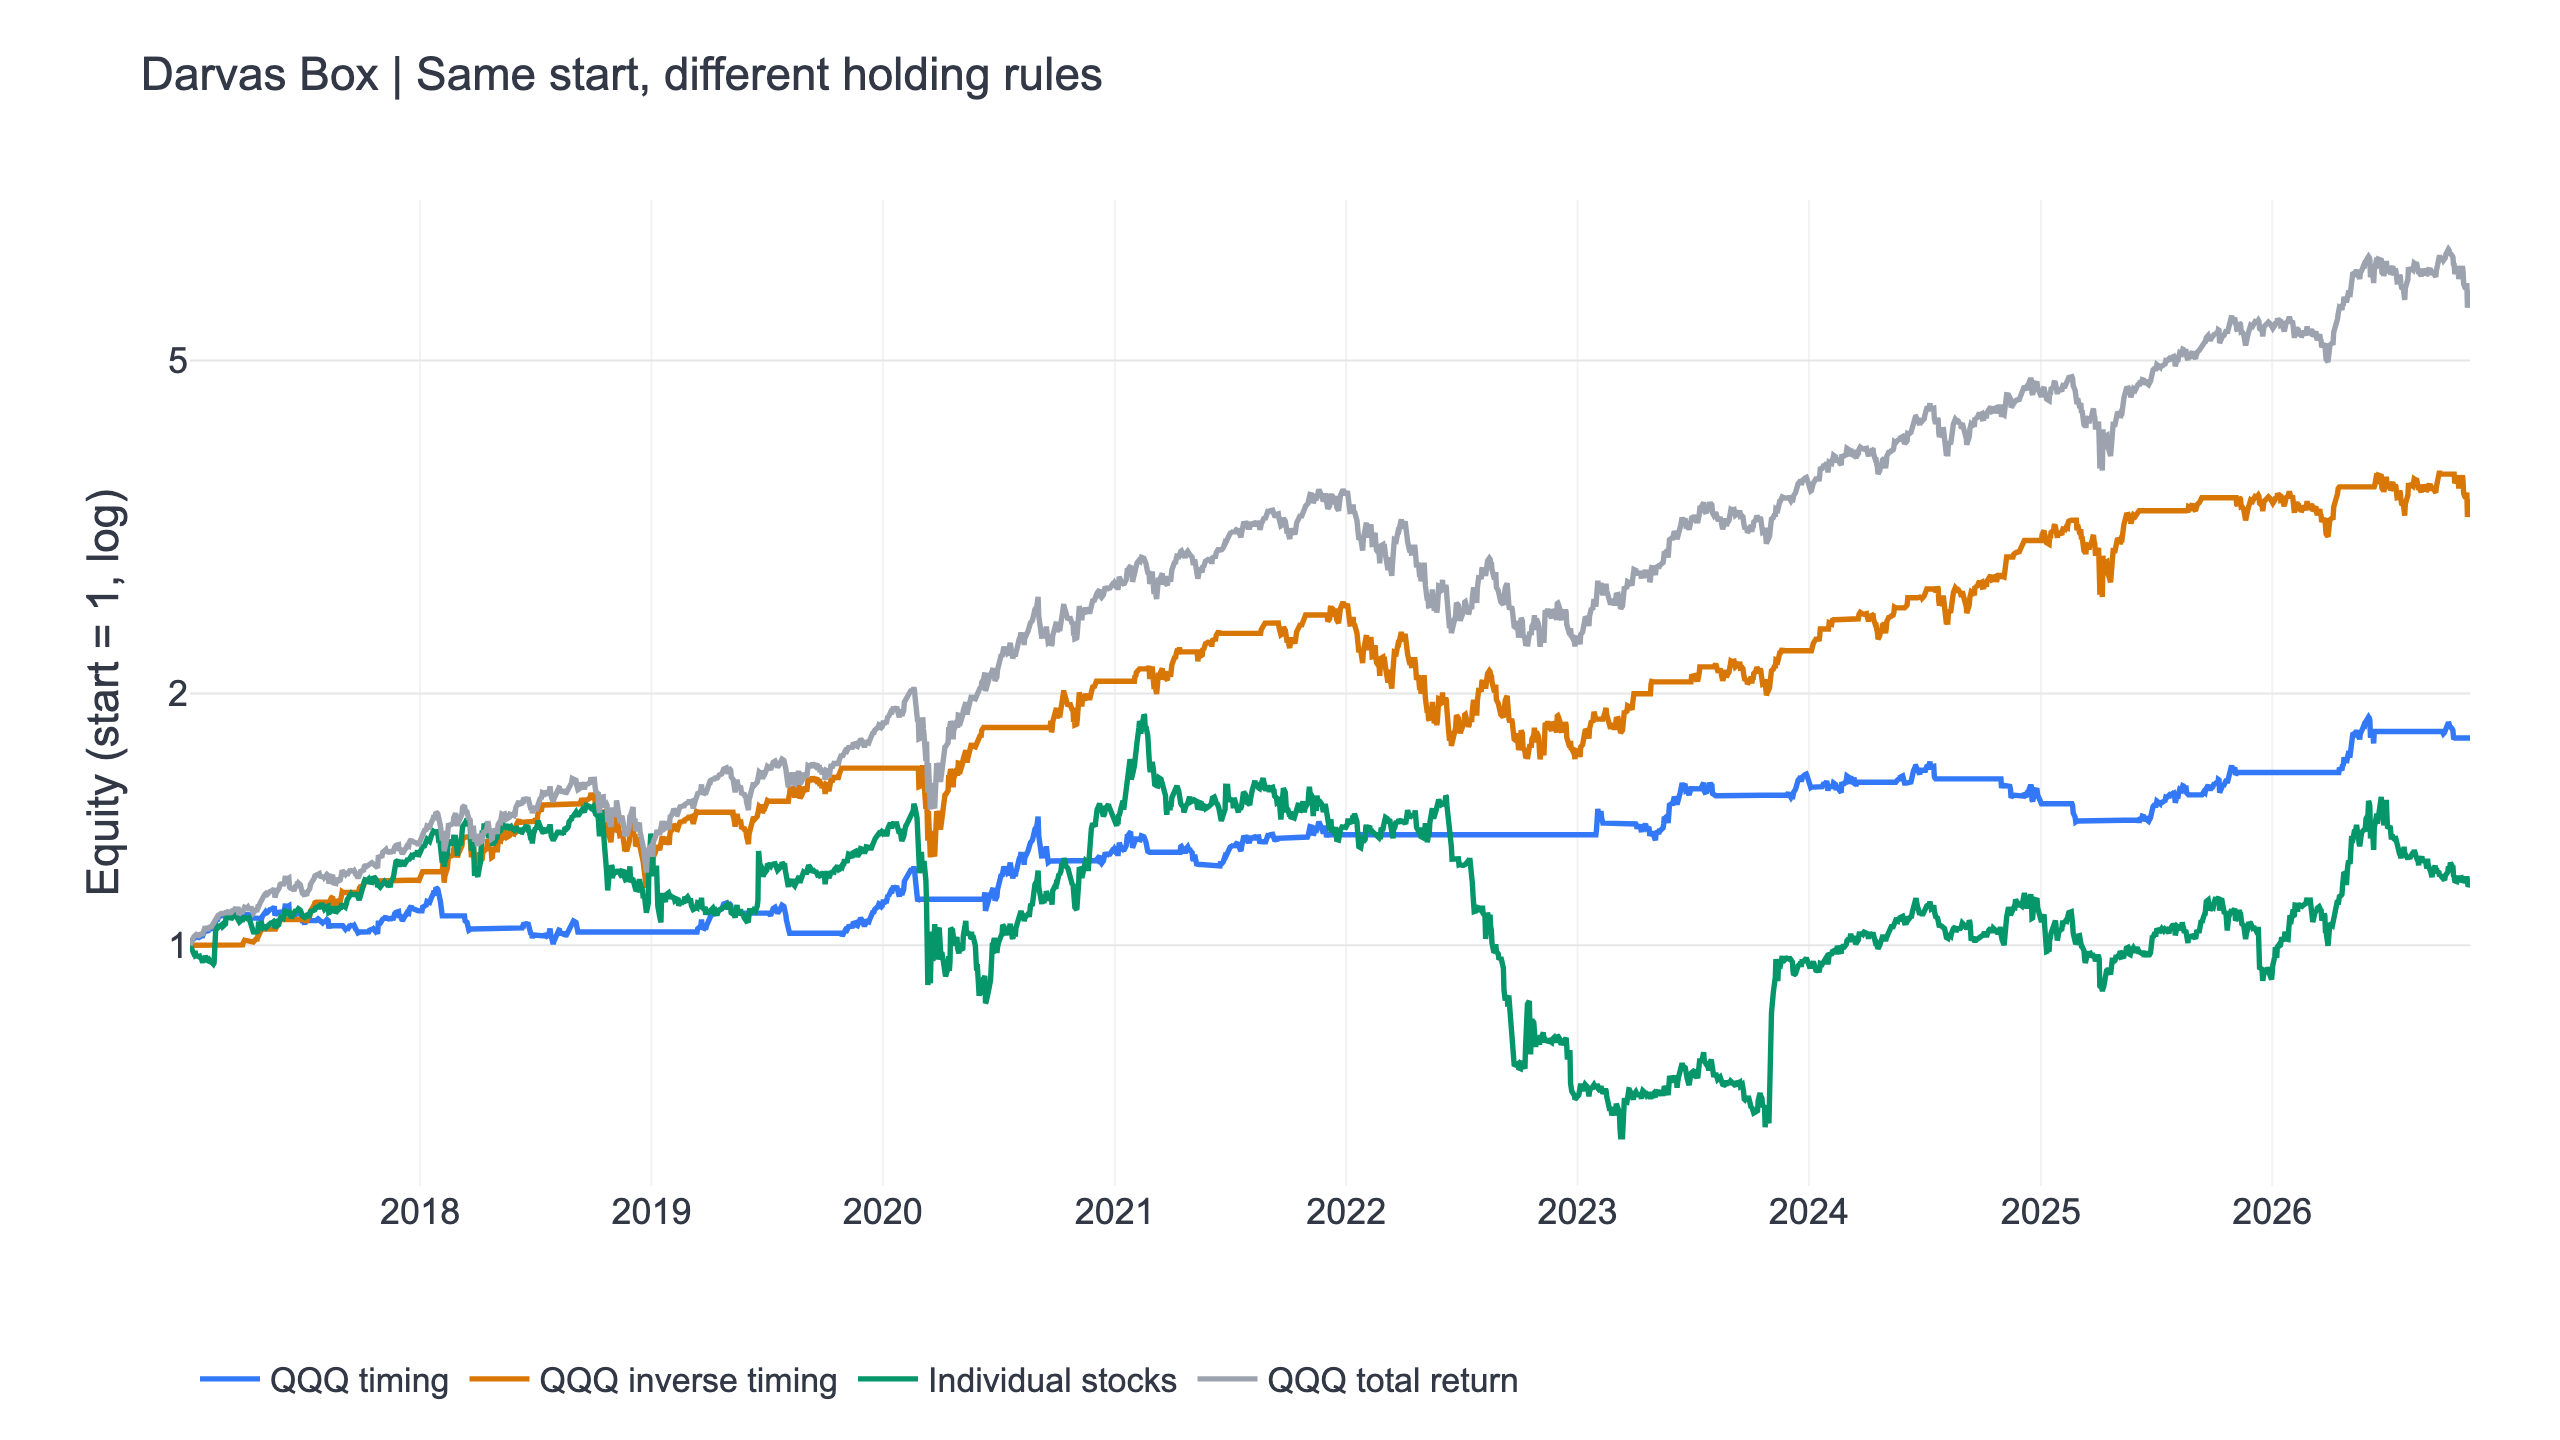
None of the three Darvas Box holding designs passes all robustness checks in this experiment. From 2017-01-03 to 2026-11-09, the central QQQ timing rule returned 6.0% a year with daily Sharpe 0.63, versus 20.1% and 0.92 for QQQ total return. This is a study of a failed trading hypothesis, rather than a validated strategy to deploy.
The stock version returned 1.8% a year and won 0 of nine parameter comparisons. Applying the indicator to individual companies did not reproduce a robust advantage over QQQ. The figure compares all three central rules with the benchmark from the same starting value; click it for the full-size chart.
These trading rules are research results. To rerun the experiment, set up FinLab and download the research program (.py). Other files are in the research downloads.
Darvas Box strategy: confirmation must happen before a breakout trade
Darvas Box turns a price consolidation into an upper boundary for a possible breakout and a lower boundary for exit. The appealing chart is a sequence of boxes beneath a rising stock. A backtest must additionally decide when each boundary first became knowable. Drawing a box retrospectively is easy; using it in real time requires waiting.
In this experiment, a new high relative to the preceding lookback window creates a candidate top. The algorithm then waits for the specified number of later sessions without a higher high. The lowest low from the candidate day through confirmation becomes the box bottom. Only after that confirmation can the box govern a trade. Equal highs do not reset the wait, while a genuinely higher rolling high starts a new candidate.
| Event | What the algorithm does | What it cannot do |
|---|---|---|
| New rolling high | Starts a candidate and its low-price range | Trade using a fully formed box immediately |
| Confirmation wait | Updates the candidate's lowest low | Use tomorrow's low today |
| Confirmation complete | Freezes the usable box boundaries | Backdate the box to the candidate day |
| Close above confirmed top | Enters or maintains a long state | Assume a fill at an earlier breakout price |
| Close below confirmed bottom | Exits the long state | Sell at a boundary skipped by an overnight gap |
A newer confirmed box can replace the active boundaries. Until it is confirmed, the earlier box remains the usable reference. The position persists between entry and exit conditions; it is not sold merely because price is inside a box. No volume confirmation, earnings-growth filter or market-index condition is added.
How Darvas differs from a rolling channel breakout
A Donchian-style channel can compare today's close with the highest price over a recent window. Its boundary updates as that window rolls. The Darvas implementation here waits for a candidate high to survive a confirmation period, then preserves a specific box. That makes the confirmation delay and the frozen lower boundary part of the economic exposure.
The distinction has a cost. A strong stock can move away before a new box confirms, while a stale box can leave a wide distance to the exit. A shorter confirmation period can react sooner but may create more unstable boxes. A longer lookback demands a more prominent high, yet it can also reduce the number of eligible breakouts. The nine settings test these trade-offs together.
The comparison with Turtle trading rules is therefore about different definitions of a breakout, not two interchangeable names. Both can follow trends, but their entry dates, holding periods and exit distances can differ substantially. A favorable result for one does not validate the other.
The book's story and the present stock universe answer different questions
A historical account of successful stock trades does not identify the expected return of every mechanical box rule. This study applies one fixed definition to the liquid common-stock universe available through FinLab, rather than selecting celebrated examples from charts. It also applies the same state to QQQ to distinguish a stock-selection effect from market timing.
The equal-weight stock portfolio changes as both eligibility and box states change. That can create many more transactions than a single-fund timing rule. It does not buy every stock that ever looked successful, and it does not remove a company merely because its later full-history performance was poor. The rolling extreme-move exclusion uses only earlier observations when screening each day.
The inverse QQQ portfolio is a further control: it holds the fund while the original rule is out. Its role is to measure the opportunity cost of waiting for boxes. It is not a short Darvas strategy, and it is not allowed to inherit a passing label from a visually persuasive chart. Each direction faces the same validation requirements.
Darvas (1960), How I Made $2,000,000 in the Stock Market, is the source of the box approach. The numerical lookback and confirmation grid below are this experiment's explicit implementation, not a claim that every detail reproduces the book. Original source.
Results: all three holding designs
| Central design | Annualized return (CAGR) | Daily Sharpe | Max drawdown | First / second half Sharpe | Settings beating QQQ | Time invested |
|---|---|---|---|---|---|---|
| QQQ timing | 6.0% | 0.63 | -15.5% | 0.61 / 0.66 | 0 / 9 | 40.3% |
| QQQ inverse timing | 13.3% | 0.71 | -35.1% | 1.05 / 0.41 | 0 / 9 | 59.7% |
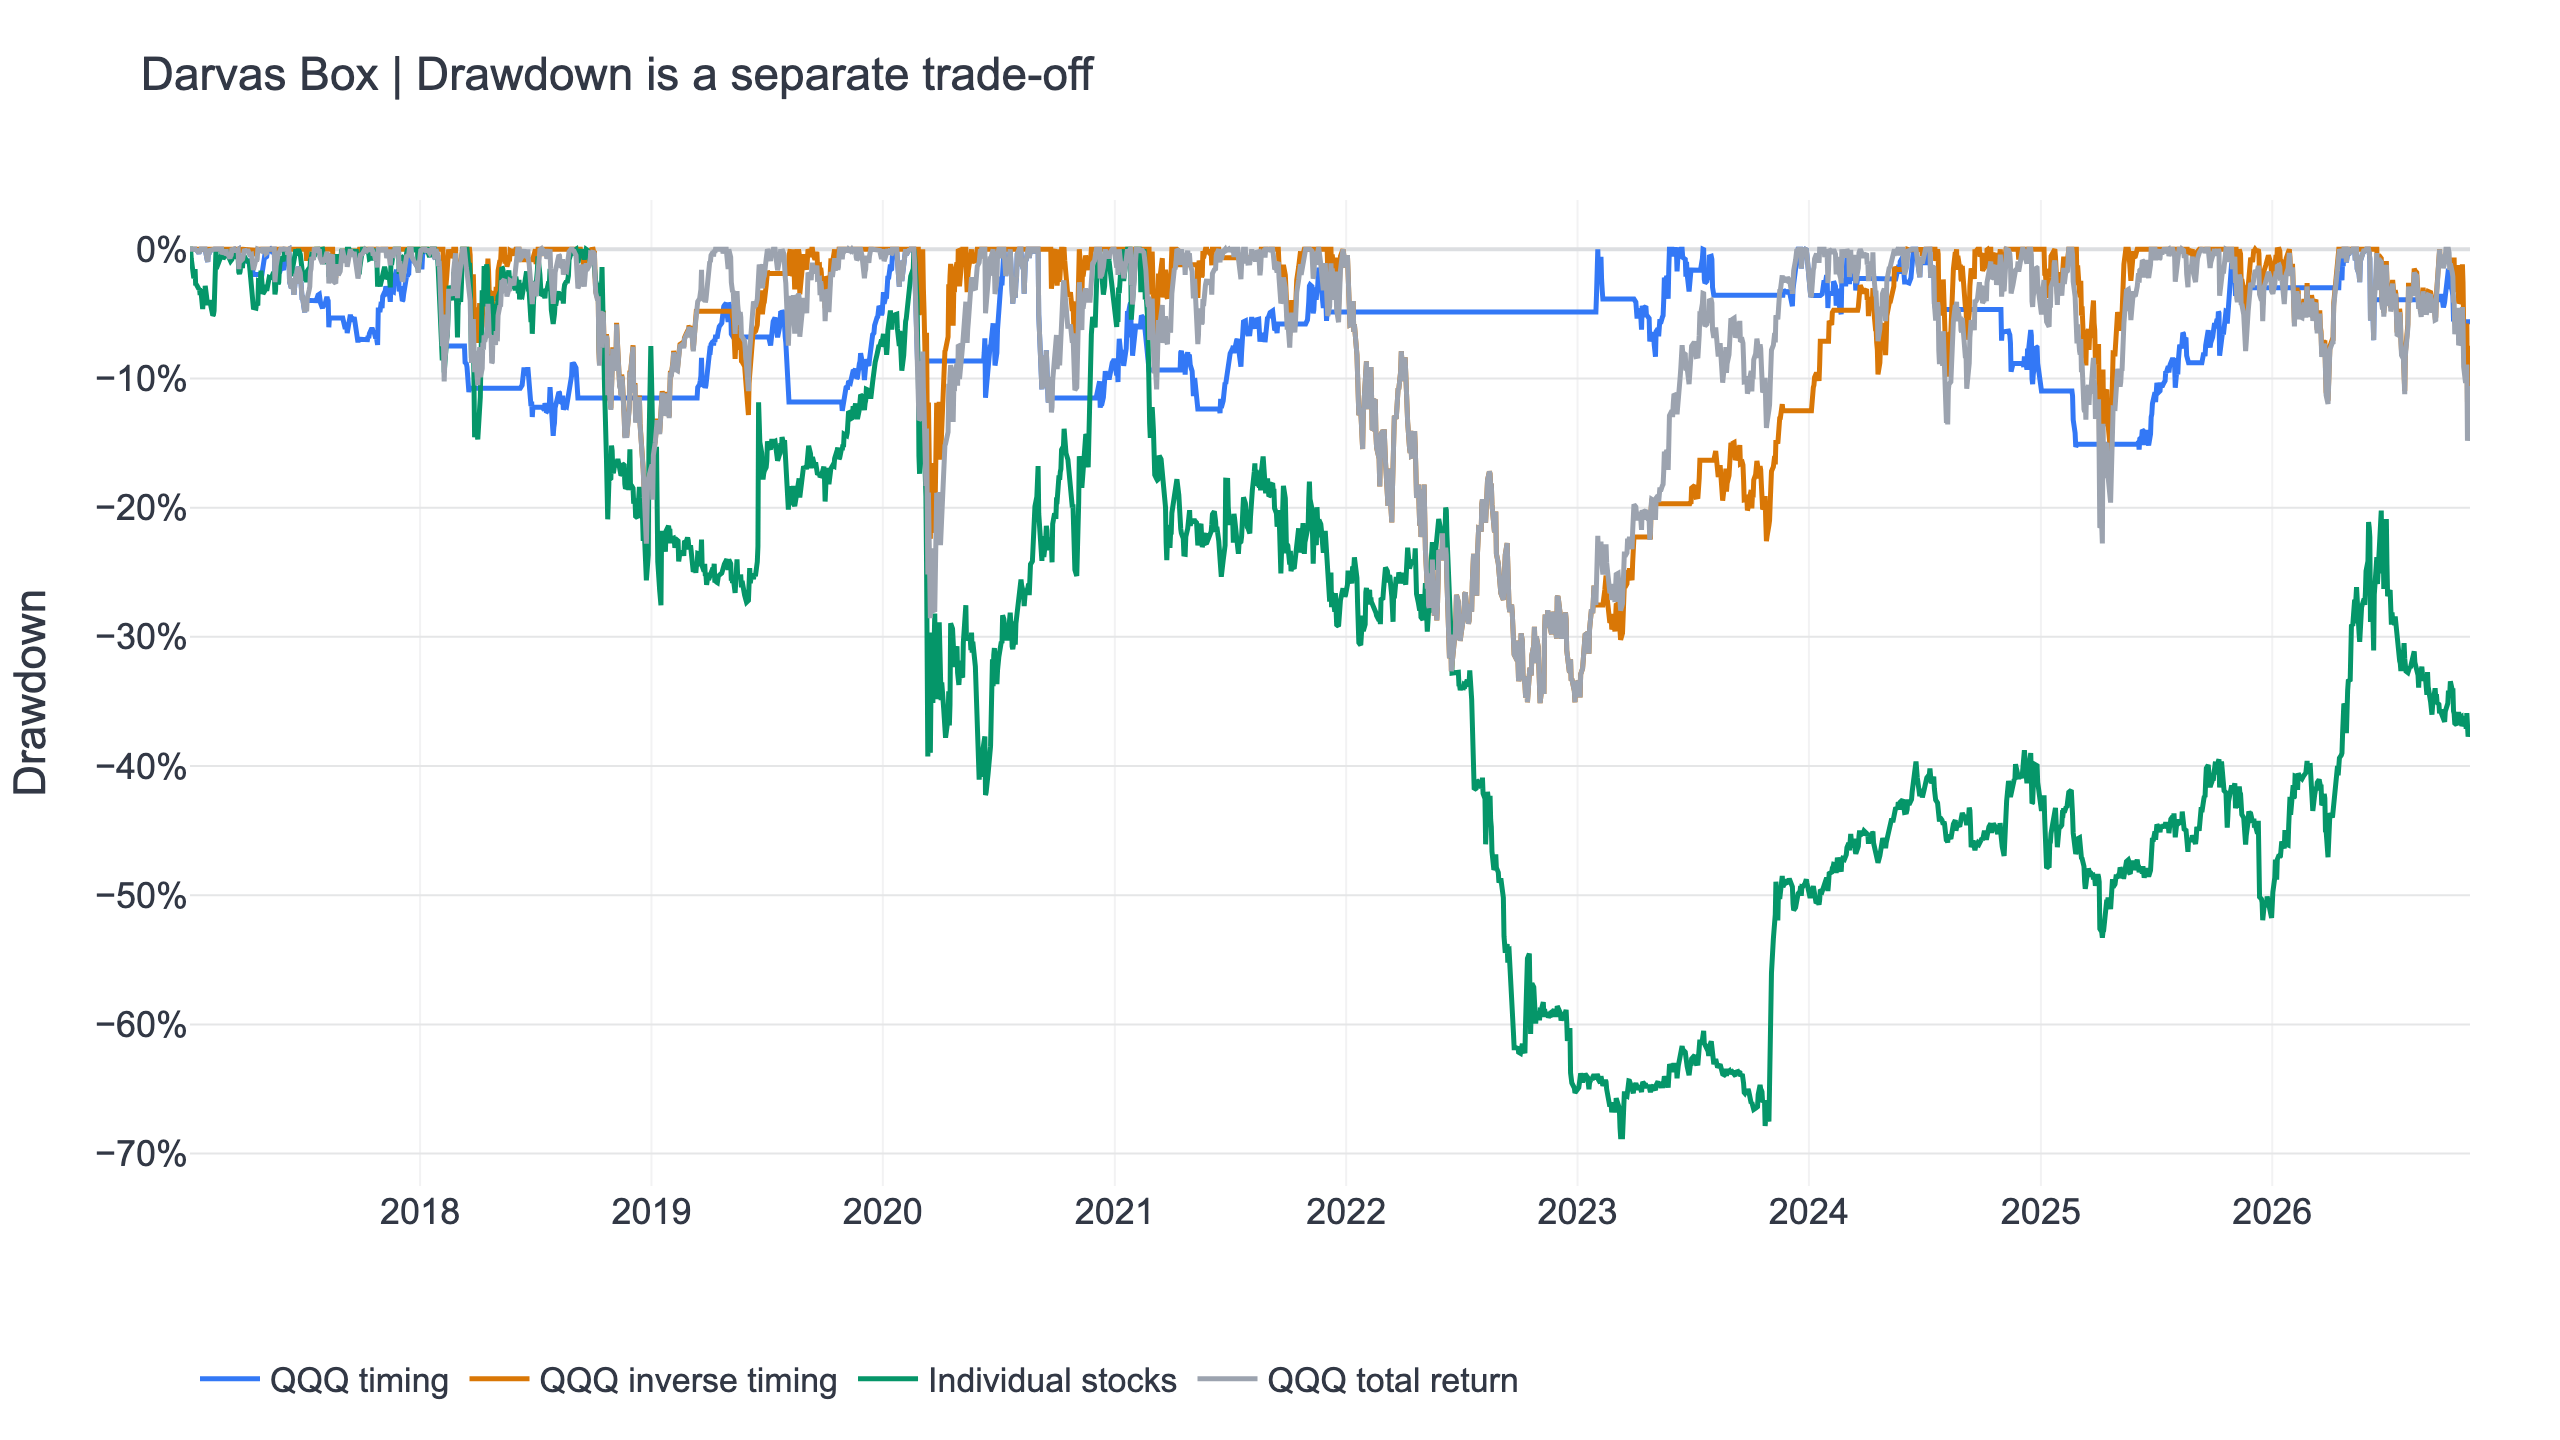
| Individual stocks | 1.8% | 0.20 | -68.7% | 0.39 / -0.01 | 0 / 9 | 99.9% |
| QQQ total return | 20.1% | 0.92 | -35.1% | 1.22 / 0.63 | — | 100% |
Daily Sharpe here means average daily return divided by its standard deviation, multiplied by the square root of 252, without subtracting a risk-free rate. CAGR uses elapsed calendar years. Maximum drawdown is the deepest fall from a previous equity peak. These are different questions, so a higher Sharpe does not imply a higher annual return. Sharpe (1994) defines the ratio using differential returns; the zero-rate convention here is explicit.
The embedded FinLab report is the central QQQ timing rule, not the best-performing grid cell. The second downloadable report is the central stock portfolio. The headline table keeps the full common window, including cash before the first trade; a report can begin at its first executed trade. Its built-in Sharpe also has its own risk-free-rate convention, while this study's comparisons consistently use zero.
Neighboring parameters and the two halves
New-high lookback 40, 60 or 80 sessions; confirmation 2, 3 or 5 later sessions without a higher high. The center is 60/3. The box bottom is the lowest low from candidate day through confirmation. Every combination was registered before reviewing results. At least seven of the nine settings must beat QQQ's same-window daily Sharpe. The central setting must also beat it in each half of the trading-day calendar. These are robustness screens on historical data, not untouched out-of-sample forecasts.
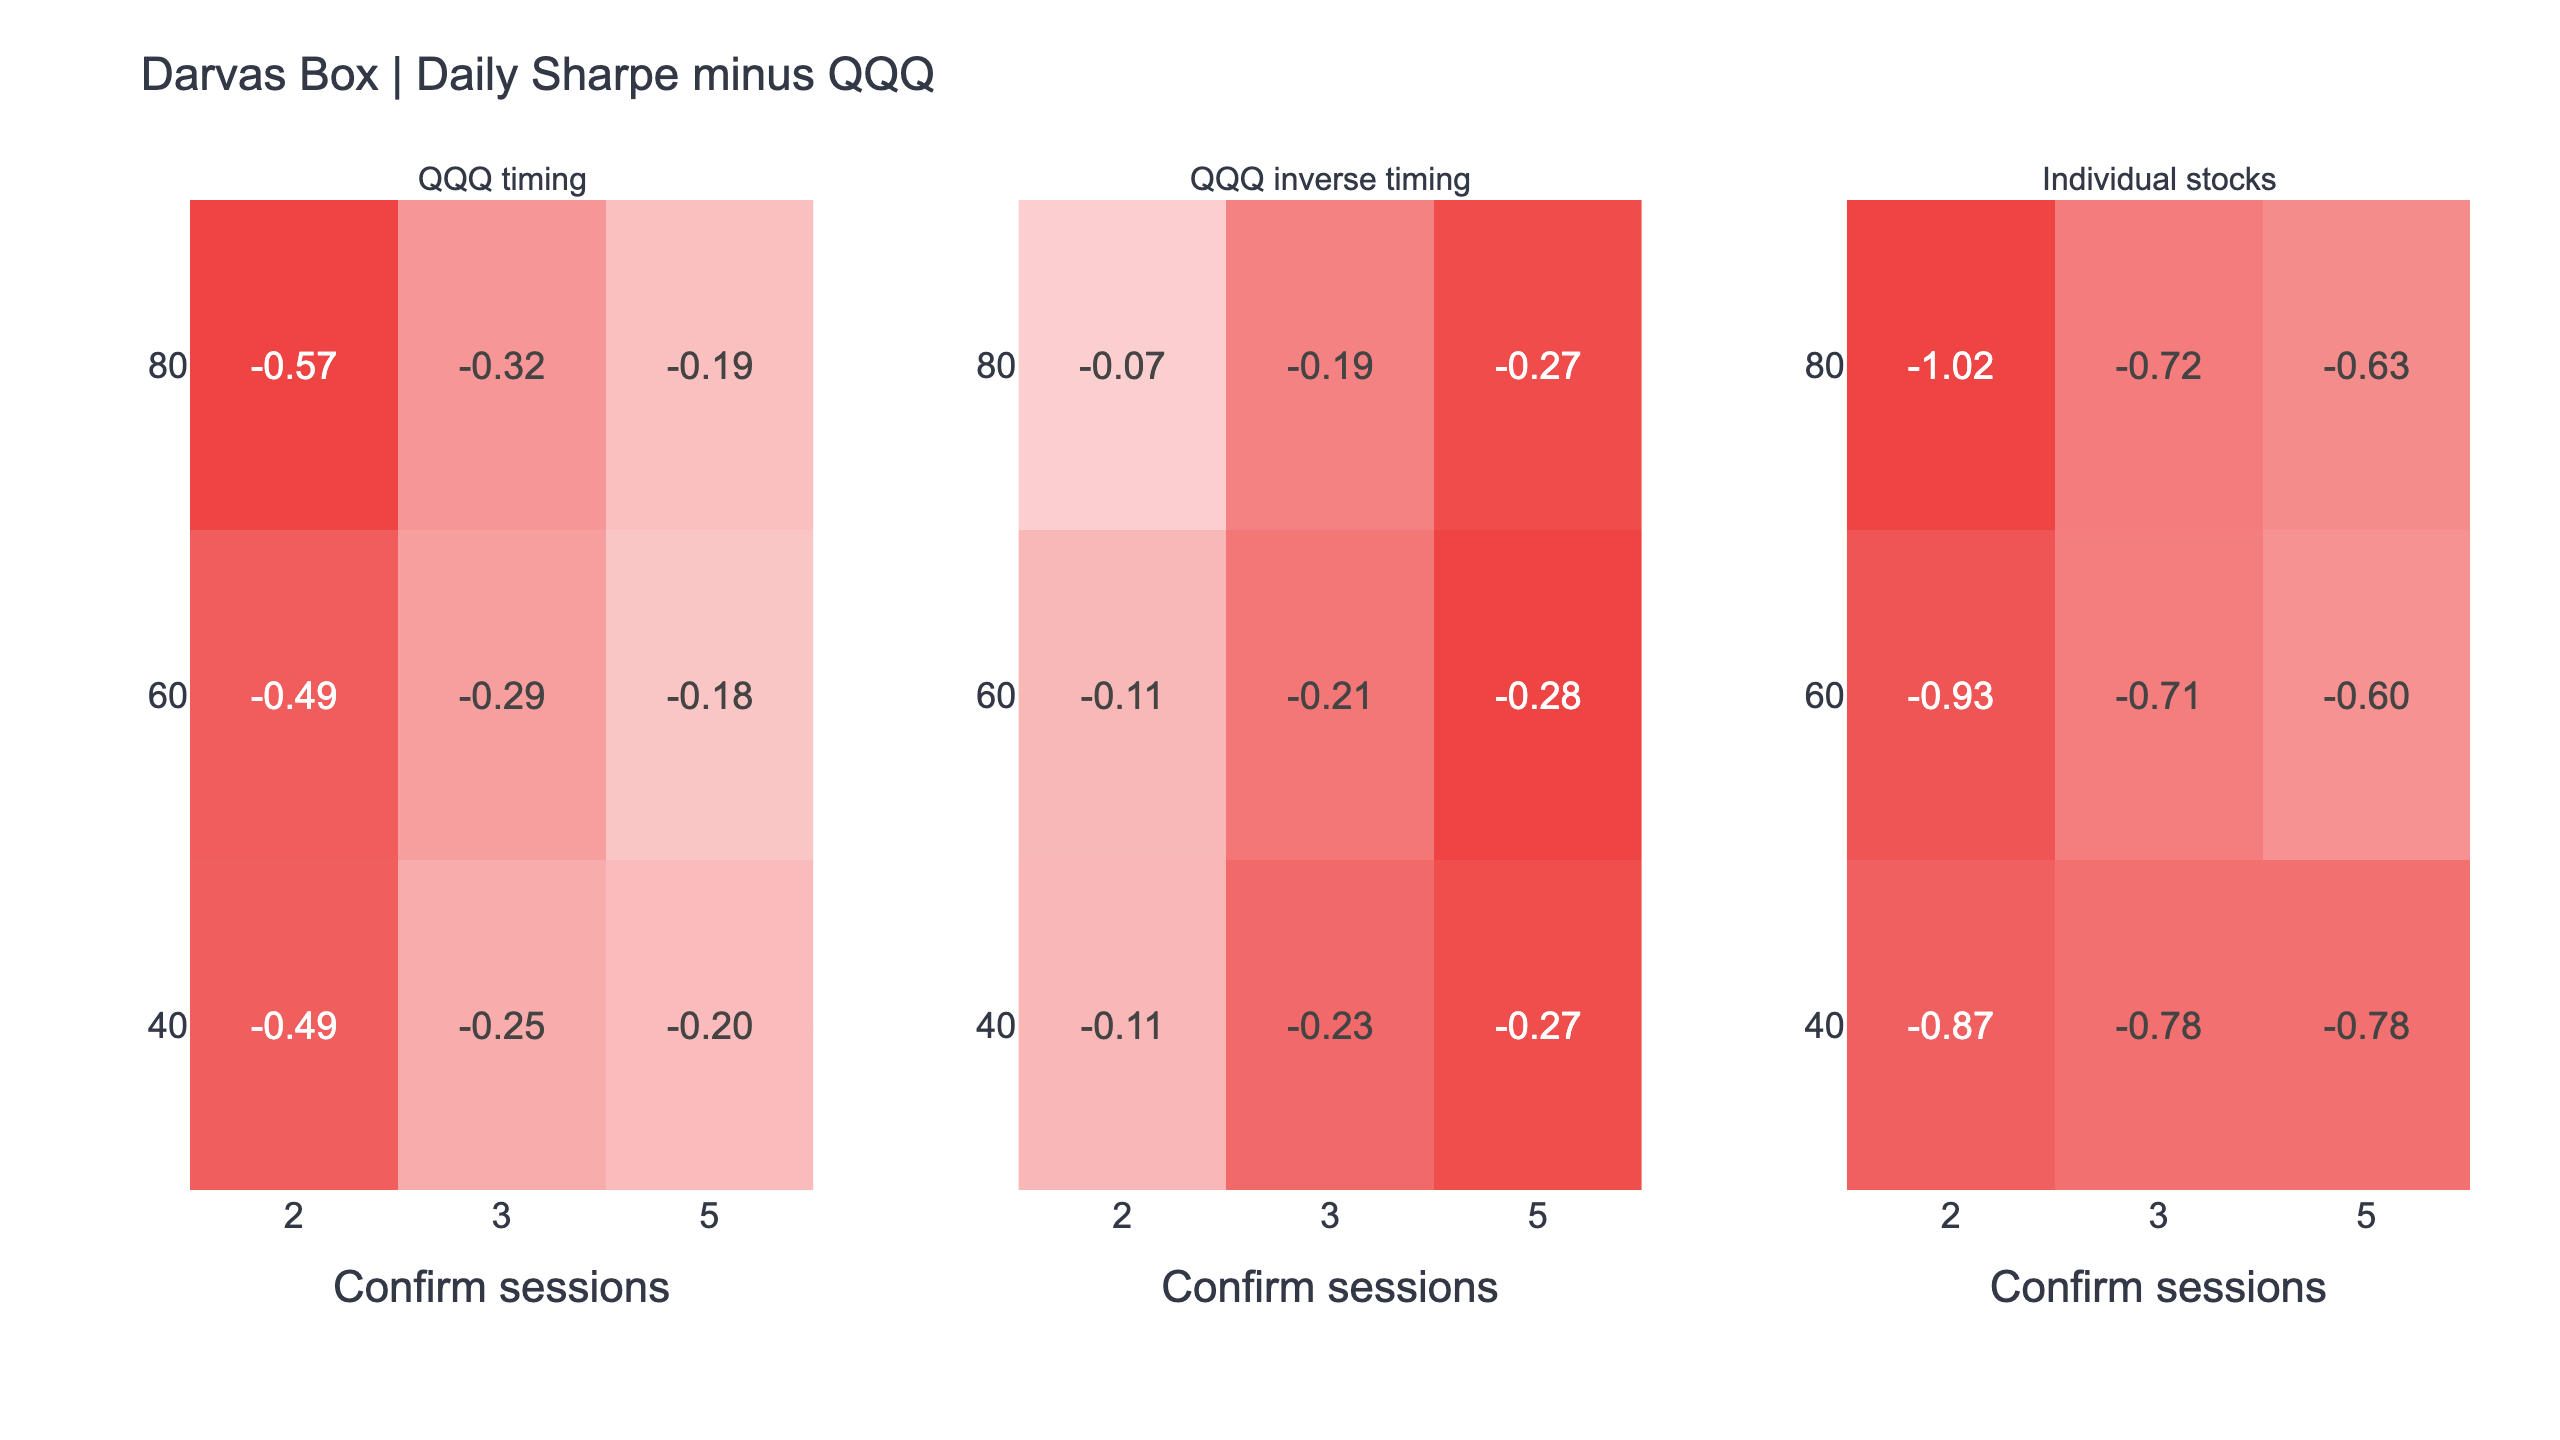
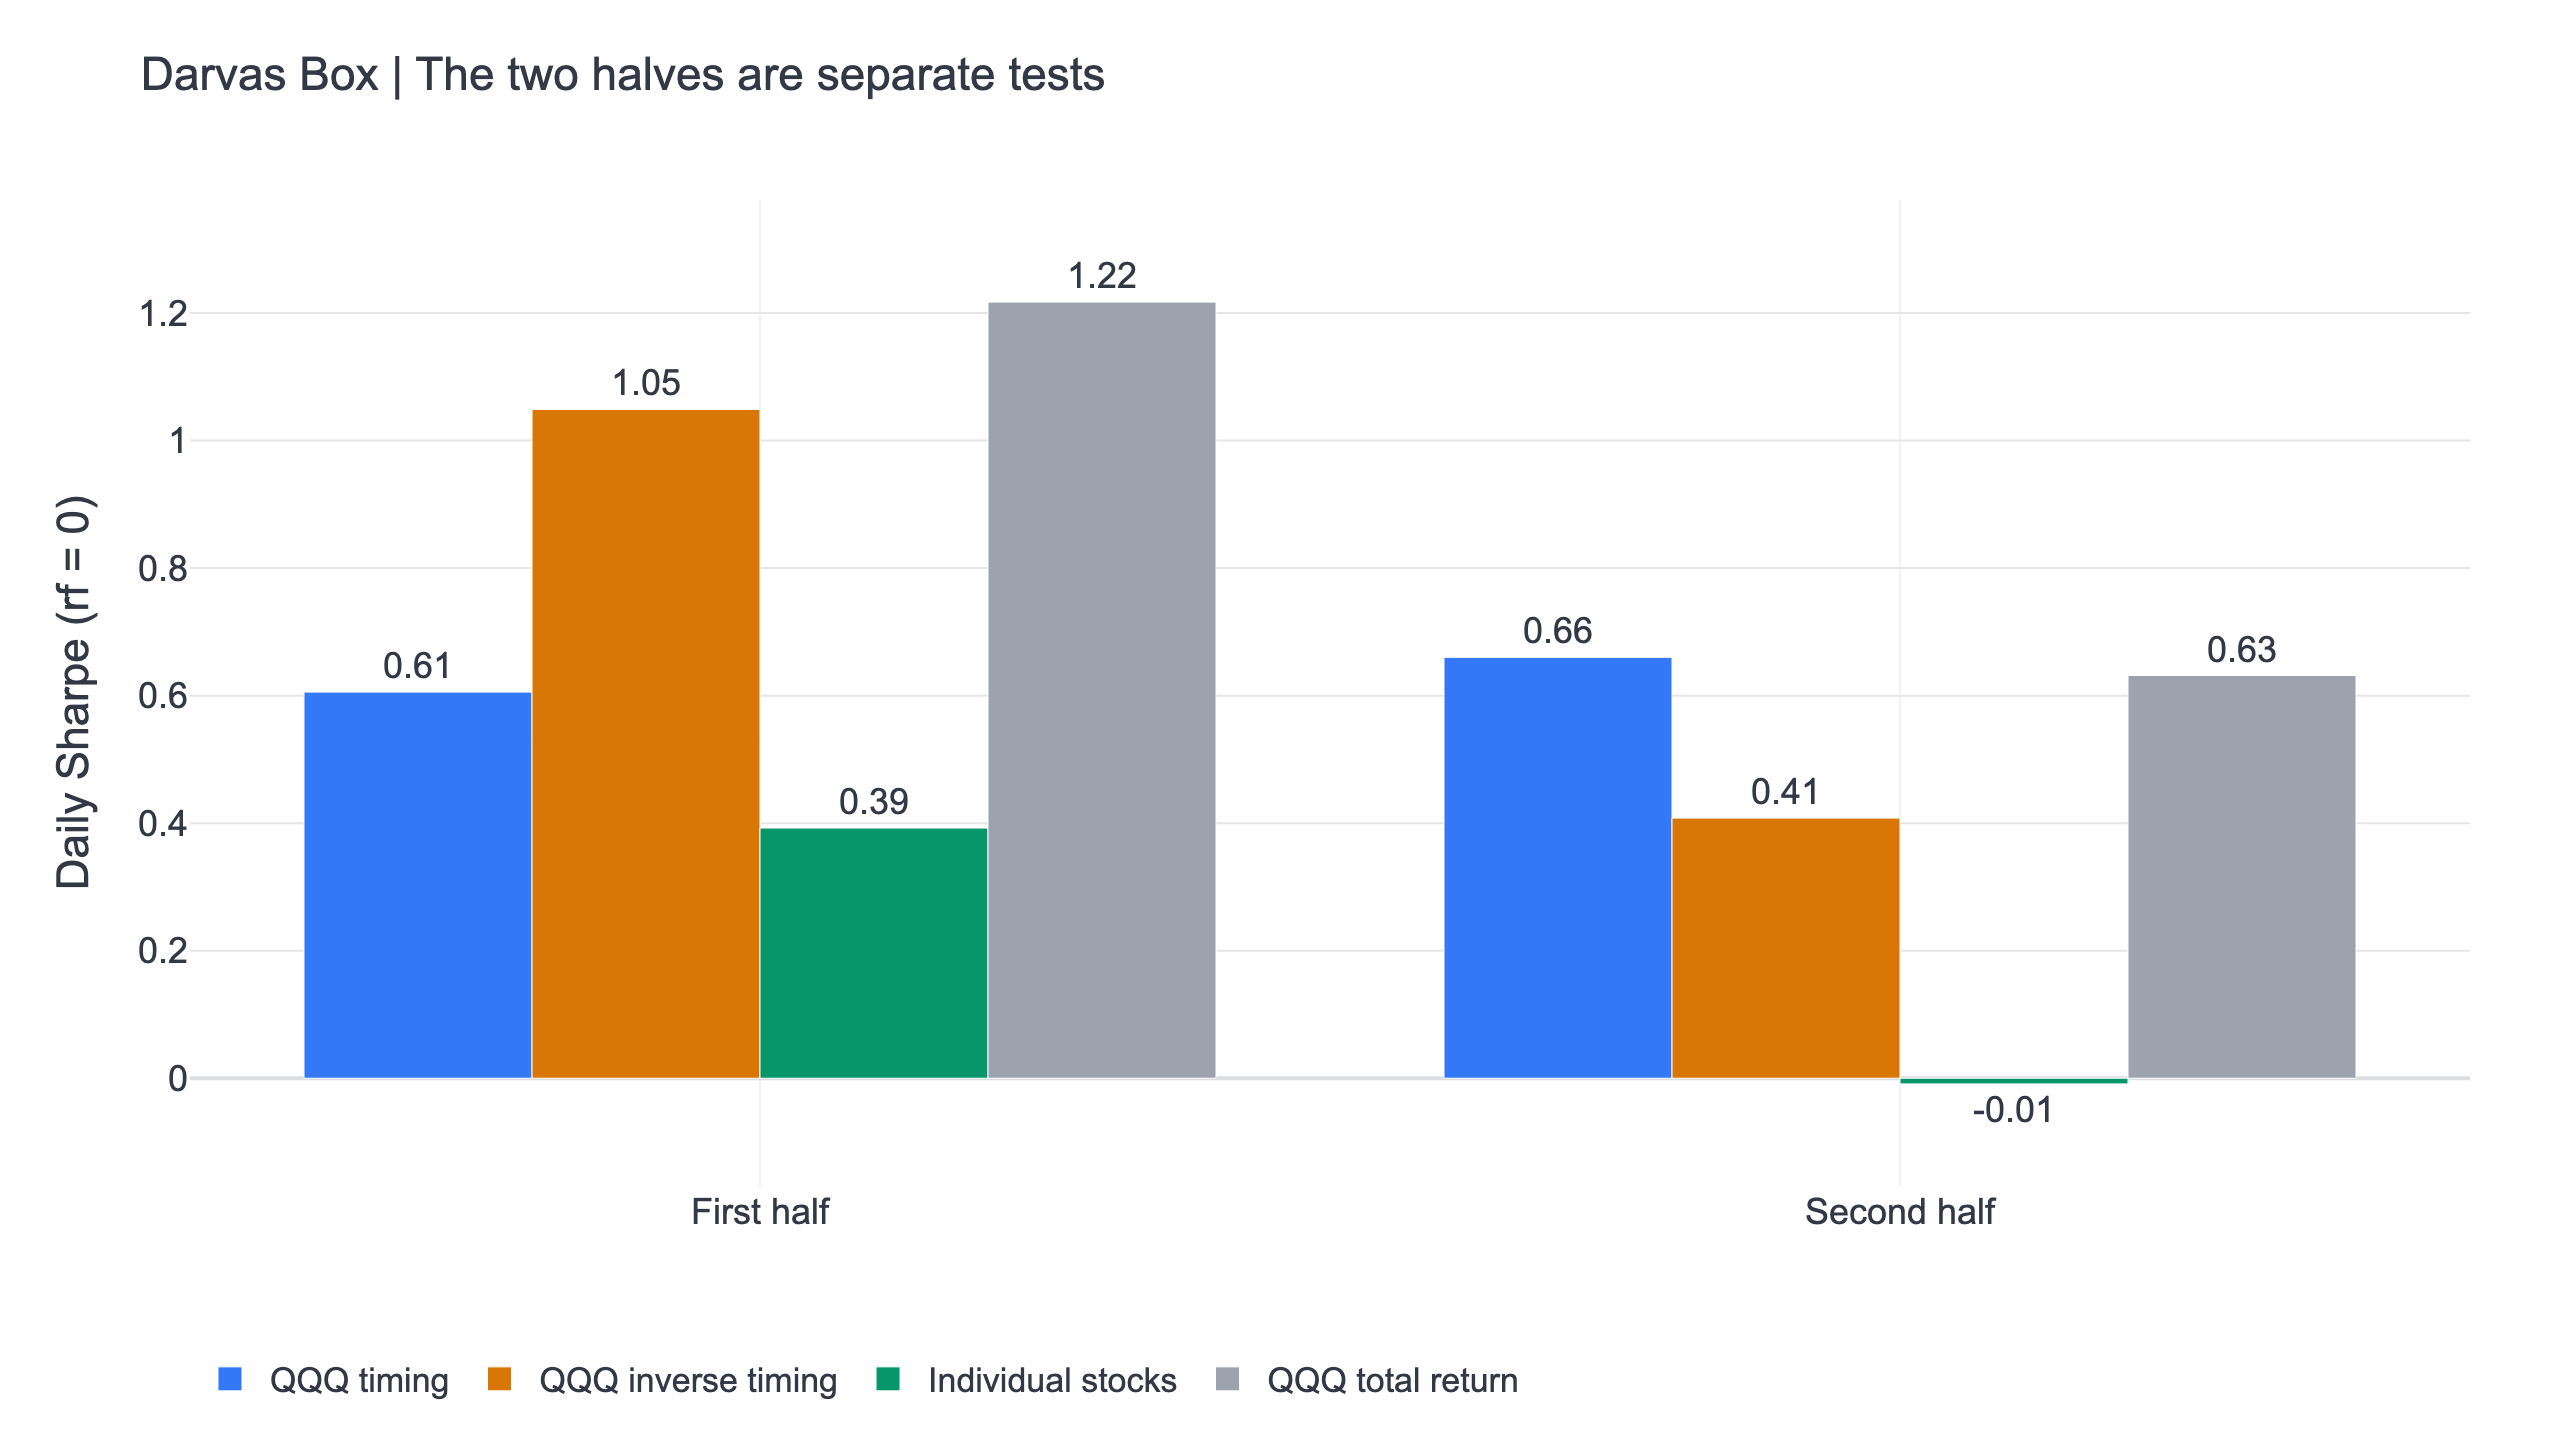
Blue positive cells beat the benchmark; negative cells do not. The three panels belong to timing, inverse timing and stock holding. The split-period chart compares those same central allocations with QQQ rather than changing parameters between periods. A full-window lead cannot compensate for a failed half or an unstable neighborhood.
Costs, cash and the best year
The US market default in sim() is zero commission and zero transaction tax. Each central rule is also rerun with 0.1% per side, a separate allowance for trading friction. No additional market-impact model, tax-on-capital-gains calculation or capacity estimate is supplied.
The equity curves, parameter grid, split-period chart and embedded report use zero commission. The table separates the 0.1% per-side cost results from the zero-commission BIL comparison.
| Central rule | CAGR at 0.1% per side | Daily Sharpe at 0.1% | Zero-fee Sharpe after BIL | Best calendar year removed | Sharpe without that year / QQQ |
|---|---|---|---|---|---|
| QQQ timing | 5.1% | 0.55 | 0.39 | 2023 | 0.51 / 0.78 |
| QQQ inverse timing | 12.4% | 0.67 | 0.60 | 2024 | 0.60 / 0.88 |
| Individual stocks | -3.5% | 0.01 | 0.12 | 2023 | 0.06 / 0.78 |
Subtracting BIL's daily total return gives QQQ an excess-return Sharpe of 0.81. Idle cash earns zero in the strategy; the experiment does not quietly pay Treasury returns to cash holdings. The fixed-exposure control holds the same average fraction of QQQ every day and keeps the remainder at zero-return cash. Its Sharpe for the timing allocation is 0.92, compared with 0.63 for the rule. The control excludes rebalancing costs.
Removing the central rule's best calendar year is an additional historical stress test. That year is selected from the rule's own annual returns, and the same dates are removed from the benchmark. The remaining daily returns are compounded without inserting a return across the removed interval. Passing this check cannot repair an earlier failure.
Universe, execution and limits of the evidence
Signals are formed after the close and executed at the following trading session’s market close in every grid and central rule.
The data end on 2026-11-09 and this run was completed on 2026-11-11, using finlab 2.3.8. US adjusted OHLC comes from us_price for stocks and us_fund_price for QQQ. QQQ's adjusted close is the total-return benchmark, computed directly from prices without transaction costs. Every comparison uses its available trading calendar.
The stock universe uses FinLab's common-stock classification, adjusted price above $5, a 60-session average adjusted-price-times-volume amount above $5 million, and the 100 largest such amounts each day. The amount requires at least 20 observations. A stock is excluded after a 50% absolute daily move, using a rolling 252-session record shifted by one session. This screens earlier extreme moves; it cannot prevent the first extreme event. The common-stock classification is a present security-type filter, so historical classification changes remain a limitation.
Eligible stocks with positive indicator states receive equal target weights, recalculated daily. The market, liquidity ranking and indicator use information available at that close. No present-day S&P 500 membership list, analyst snapshot, financial-statement factor or investor's private strategy is used. Available delisted price columns are retained when they pass classification, but completeness of delisting returns is not separately audited. Financial and other sectors are not individually excluded, and there is no market-cap forecast or sector-neutral constraint.
Each stock receives 1 divided by the number of current holdings; no additional per-stock cap is imposed, so a single remaining stock can receive 100%. The fund rules allocate either 100% to QQQ or 100% to cash. Target-weight turnover for each central allocation is:
| Central allocation | Recorded trades | Average monthly target turnover | Highest month |
|---|---|---|---|
| QQQ timing | 40 | 33.2% | 150.0% |
| QQQ inverse timing | 40 | 33.2% | 150.0% |
| Individual stocks | 2152 | 220.3% | 442.7% |
The central stock version averages 14.3 positions. Target-weight turnover is half the absolute daily target-weight changes, summed by month. This is not executed notional turnover: price drift and execution details can change the actual amount. A change in universe membership can require trading even without a fresh indicator reversal.
All tests are historical and in sample. Registering parameters before this run reduces within-batch cherry-picking, but the idea and market were selected with knowledge of financial history. The half-period split, grid and best-year check do not provide a statistical probability of future profit. Bailey and colleagues (2017) examine backtest overfitting; this study does not estimate their probability-of-overfitting statistic. Moskowitz, Ooi and Pedersen (2012) study futures trend following, which does not validate this indicator.
Reproduce the rule with an AI agent
Complete the FinLab setup flow with Claude Code, Codex or Gemini CLI. The agent guide explains how the skill gives your agent access to FinLab's data and backtests. The direct skill install command is:
Show Code
npx skills add koreal6803/finlab-ai --skill finlab -g -yThe browser version, FinLab Studio, also supports AI research. Ask the agent to reproduce the fixed experiment before proposing changes: “Use the downloaded Darvas Box research program, keep its registered dates and nine settings, and compare the three holding rules with QQQ including the cost test.” The point is to retain the definitions in the results table. A newly generated trading rule, even if it uses the same indicator name, does not reproduce this experiment.
Download the research program as research.py in the working directory. This excerpt runs the central individual-stock rule; the program's command-line options also run the complete grid. Its dependency command includes finlab, numba and TA-Lib. Login is handled by FinLab.
Show Code
import finlab
from research import load, signal, backtest

finlab.login()
prices, eligible = load("us")
state = signal(prices, "darvas", 60, 3)
position = (state & eligible).loc["2017-01-03":"2026-11-09"]
report = backtest(position)
report.to_html("darvas_stocks_report.html")
Questions about this Darvas Box test
What is the best setting? The middle values were fixed in advance. The heatmap supplies every neighboring outcome; no winning cell is substituted for the original rule.
Does a smaller drawdown prove the signal works? Cash can reduce both drawdown and return. The fixed-exposure and BIL comparisons ask whether the timing adds more than that reduction in participation.
Does the inverse rule mean short selling? No. It holds QQQ in the original rule's cash sessions and holds cash otherwise. Borrow fees and short-position losses are outside this experiment.
Can these results be transferred to an individual stock? The separate stock portfolio already tests a liquid universe, and its failure does not support selecting a few attractive charts afterward. Company-specific concentration adds another risk.
Does the report's Sharpe equal the table's? Not necessarily. This table consistently uses daily returns with a zero risk-free rate and a common full window. Report conventions and a first-trade start can differ.
Can I change the timeframe to intraday? That requires another dataset and new execution assumptions. Daily highs and lows cannot identify the order of intraday fills or guarantee fills at indicator boundaries.
For broader context, the US strategy studies distinguish validated rules from negative experiments. Backtesting methods explain execution and bias; the quant glossary defines the result metrics. The Bollinger Bands study tests a different volatility envelope, and Turtle trading tests channel breakouts. FinLab's research workflow and team information provide product and author context.
Research downloads
| File | Contents |
|---|---|
| Download research program (Python) | Give this to your AI agent after setting up FinLab |
| Download daily balances (CSV) | Daily balances for the rules and benchmark; opens in a spreadsheet |
| Download complete test results (JSON) | Full test results for AI or coding tools |
| Open timing report (web) | Interactive webpage; no setup or installation needed |
| Open stock report (web) | Interactive webpage; no setup or installation needed |
Past performance does not guarantee future results. This material is for research and education and is not investment advice. It does not recommend any individual stock, guarantee a stop price or promise that a historical advantage will persist.
Last updated: 2026-11 | Backtest window: 2017-01-03 to 2026-11-09 | Author: FinLab Quant Research. The team maintains reproducible Taiwan and US market studies using FinLab data.
FinLab AI
Want to build your own strategy?
Describe your stock-picking ideas in natural language. AI automatically validates, backtests, and gives you answers
Start Free