Run this strategy
Copy the prompt to reproduce the evidence above with the article’s data, assumptions, and risk checks.
Tell your AI:
Set up FinLab and rerun the Turtle trading backtest on US ETFs. Please read: https://finlab.finance/en/setup?relatedUrl=/en/blog/turtle-trading-strategy-backtest
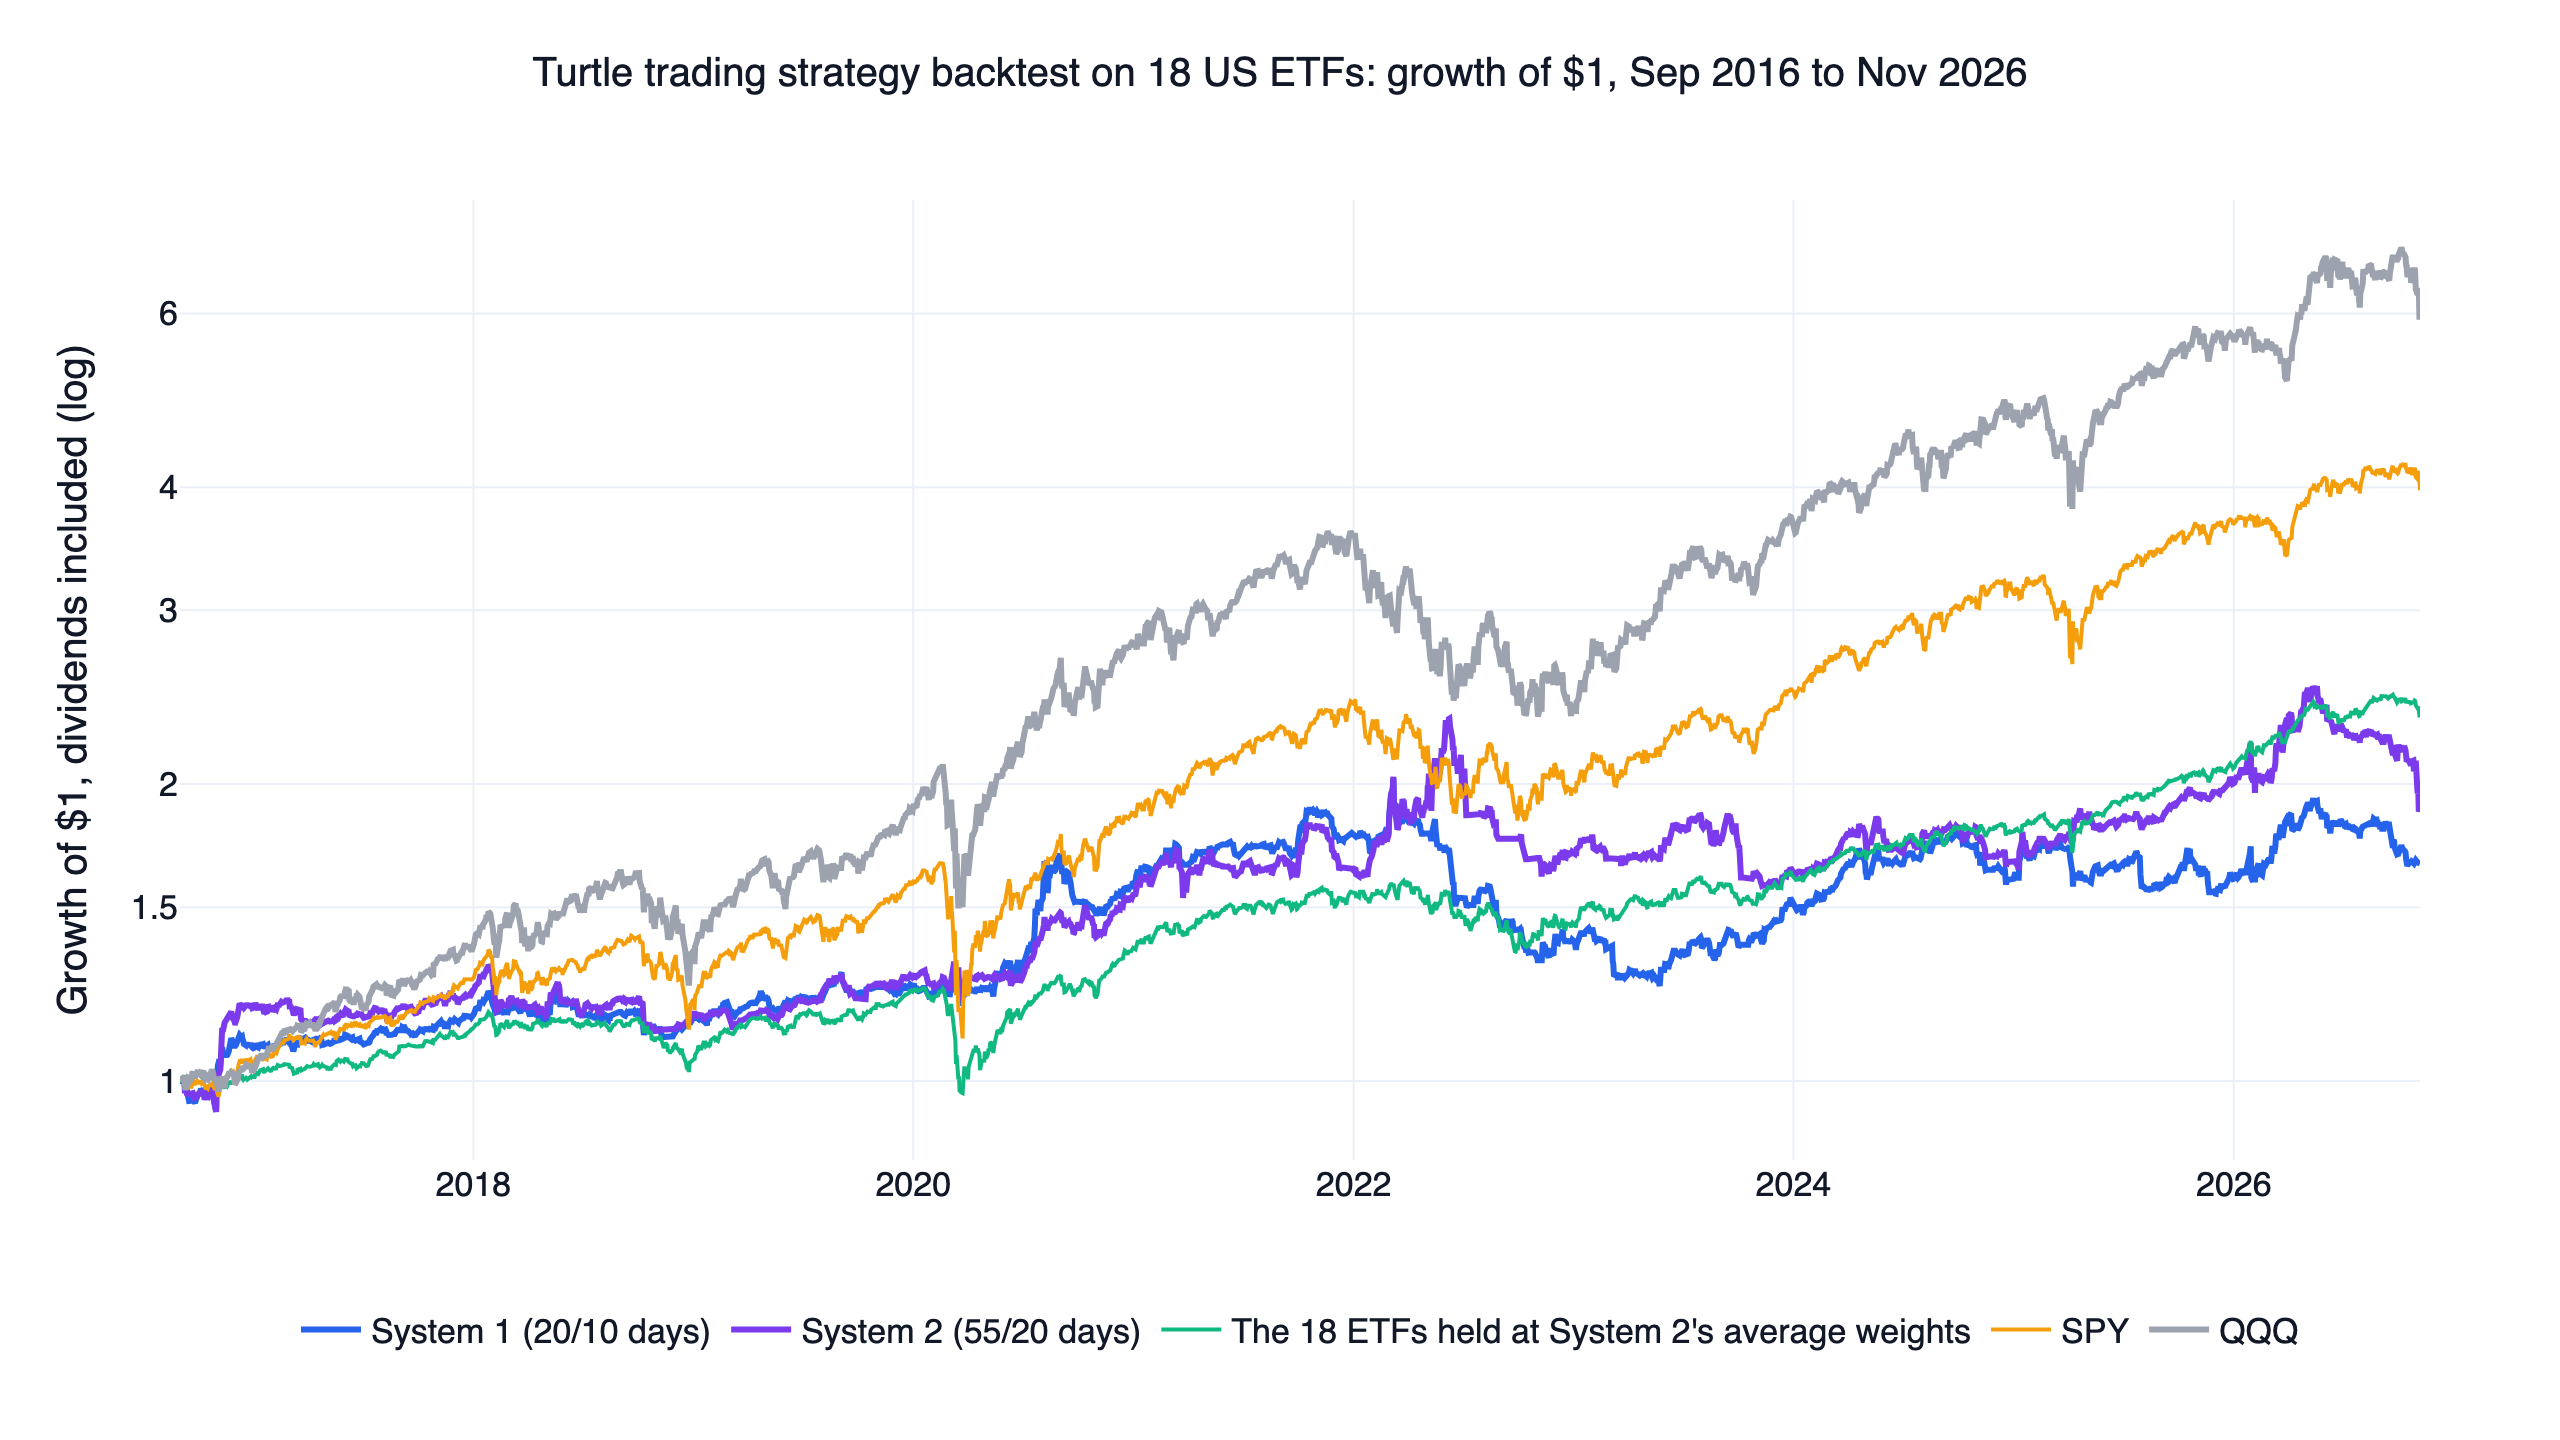
We ran the Turtle trading rules from Curtis Faith's Way of the Turtle (2007), checked on daily closes, on 18 US ETFs from September 2016 to November 2026. The ETFs cover stocks, bonds, metals, energy, agriculture and currencies. Neither system beat buying QQQ, and neither beat holding the same ETFs at fixed weights. System 2, the 55-day breakout, returned 6.5% a year with a daily Sharpe ratio of 0.49. System 1, the 20-day breakout, returned 5.1% with 0.44. QQQ with dividends returned 19.2% at 0.89, and the 18 ETFs held at System 2's average weights returned 8.7% at 0.92. At 0.1% per side, System 1 made 0.6% a year.
The Turtles traded futures, where a small margin controls a large position. On ETFs without leverage, the rules' 1% risk per unit asked for a median of almost nine times the account, so most of the time every position had to be cut down to fit.
Turtle trading strategy results at a glance
| Design | Daily Sharpe | CAGR | Max drawdown | Beat QQQ | First / second half Sharpe | Sharpe at 0.1% per side | Same ETFs held fixed |
|---|---|---|---|---|---|---|---|
| System 1 (20-day entry, 10-day exit) | 0.44 | 5.1% | -38.4% | 0 / 9 | 0.96 / -0.01 | 0.11 | 0.90 |
| System 2 (55-day entry, 20-day exit) | 0.49 | 6.5% | -32.4% | 0 / 9 | 0.87 / 0.23 | 0.29 | 0.92 |
| SPY, total return | 0.85 | 14.5% | -33.7% | reference | 0.93 / 0.76 | ||
| QQQ, total return | 0.89 | 19.2% | -35.1% | benchmark | 1.16 / 0.64 |
Every row runs from 2016-09-01 to 2026-11-05 with dividends reinvested. The halves split at 2021-10-01. The last column is each system's own average ETF weights held all the time, with the rest in cash and a monthly rebalance.
The Turtle trading rules we tested
Richard Dennis and William Eckhardt taught these rules to the Turtles in 1983. Faith, one of the Turtles, published them in full. We tested the long side only. The Turtles entered and stopped out during the day, as soon as the price crossed a level; here every rule is checked on the close and traded at the next day's open.
- N. The 20-day average true range with Wilder's smoothing. It measures how far the market moves on a typical day.
- Entry. Buy when the close rises above the highest high of the previous entry days (the Donchian channel). System 1 uses 20 days and System 2 uses 55.
- Exit. Sell when the close falls below the lowest low of the previous exit days, 10 for System 1 and 20 for System 2.
- Stop. Sell when the close falls more than 2N below the price of the last unit bought.
- Unit size. One unit risks 1% of the account per N, so its weight is 1% × price / N.
- Adding units. Add one unit each time the close rises another 0.5N above the last unit's price, at most one a day. The caps are 4 units in one market, 6 in a group of related markets and 12 in total.
- System 1's filter. Skip a 20-day breakout if the previous breakout in that market, taken or not, would have been a winning one-unit trade. A skipped market can still enter on a 55-day breakout.
We ran each system on a 3 × 3 grid of entry and exit lengths around the original: entries of 15, 20 or 25 days and exits of 8, 10 or 12 for System 1, and entries of 45, 55 or 65 with exits of 15, 20 or 25 for System 2.
The 18 ETFs stand in for the futures the Turtles traded, in six groups:
| Group | ETFs |
|---|---|
| Stocks | SPY, QQQ, IWM, EFA, EEM |
| Bonds | TLT, IEF |
| Metals | GLD, SLV, CPER |
| Energy | USO, UGA |
| Agriculture | DBA |
| Currencies | FXE, FXB, FXF, FXY, FXC |
Position sizing without leverage
N for IEF, a bond ETF, was a median 0.43% of its price, so one unit sized to lose 1% of the account over one N was 2.3 times the account. A unit of a currency ETF was about twice the account, and a unit of SPY 0.92 times. On the median day, the rules' target weights added up to 8.78 times the account for System 1 and 8.14 for System 2. finlab's sim scales any row above 100% back down to 100%, which it had to do on 93.7% and 90.9% of days. After scaling, each unit risked roughly 0.1% of the account; the rules intend 1%.
The systems were nearly always invested, 94.9% and 92.3% of the account on average, and held no position on only 4.1% and 6.8% of days. They held three to four markets and about eight units at a time.
How a system had to pass
"Beat" means a higher daily Sharpe ratio than QQQ with dividends reinvested over exactly the same days. Sharpe is the mean daily return over its standard deviation, annualised with √252, with no risk-free rate subtracted. All six conditions were written down before any result was seen.
- Neighbouring settings. At least 70% of the 9 settings had to beat QQQ.
- Both halves. The original rules had to win in each half of the window.
- Costs. They had to win at finlab's default US cost of zero and at 0.1% per side.
- No single year. They had to stay ahead after removing the calendar year of their largest lead.
- The same exposure held fixed. They had to beat their own 18 ETFs held at the system's average weights, rebalanced monthly.
- Cash. They also had to beat QQQ on returns above T-bills (BIL).
Both systems failed all six.
System 1 and System 2 on US ETFs
The first half went well for both. From September 2016 to September 2021, System 1 returned 11.7% a year with a Sharpe ratio of 0.96, close to SPY's 0.93, and 2020 was its best year at 27.2%. The second half undid it: System 1 returned -1.1% a year with a Sharpe ratio of -0.01, and System 2 returned 2.6% with 0.23, while QQQ scored 0.64.
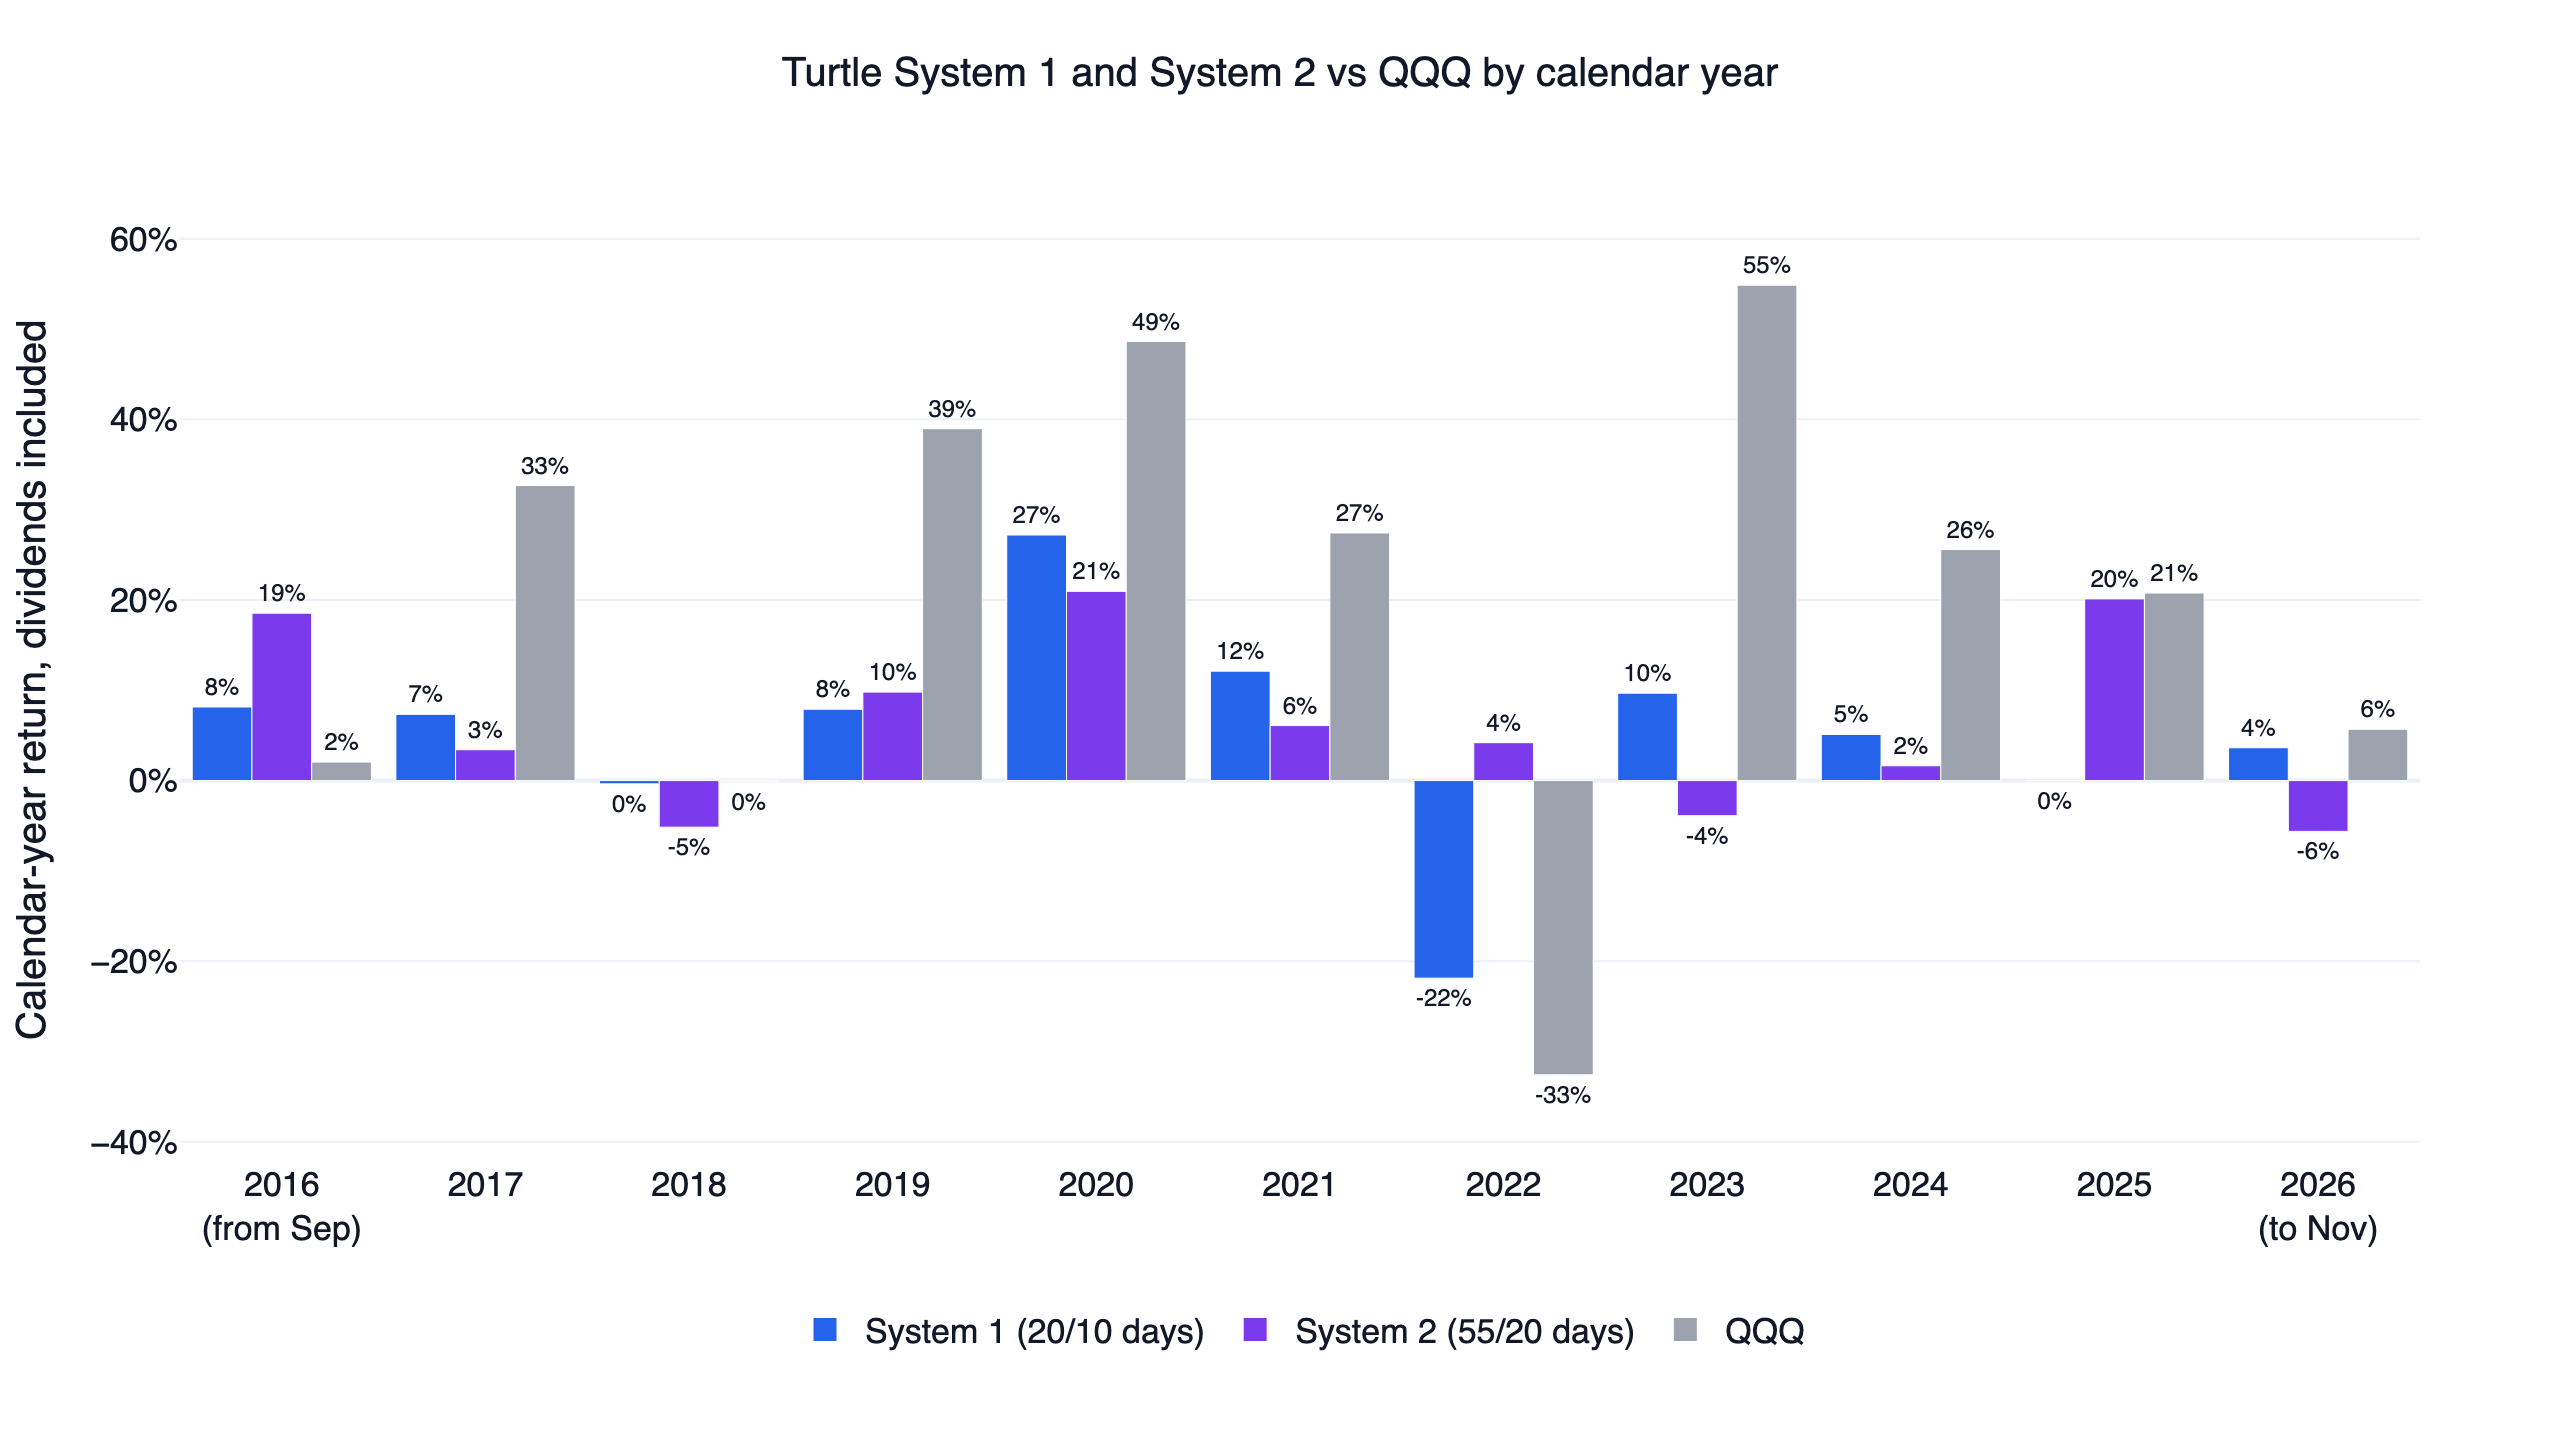
Trend following is often sold as protection in a bear market, and 2022 split the two systems. System 2 gained 4.2% while QQQ lost 32.6%, but System 1 lost 21.9%, its worst year. Without 2022, System 1's Sharpe ratio was 0.71 and System 2's was 0.54, against 1.23 for QQQ. System 2's best years were 2020 (21.0%) and 2025 (20.1%), and in 2023, when QQQ rose 54.9%, it lost 3.9%. On returns above T-bills, the systems scored 0.27 and 0.34 against QQQ's 0.79.
Which markets made money
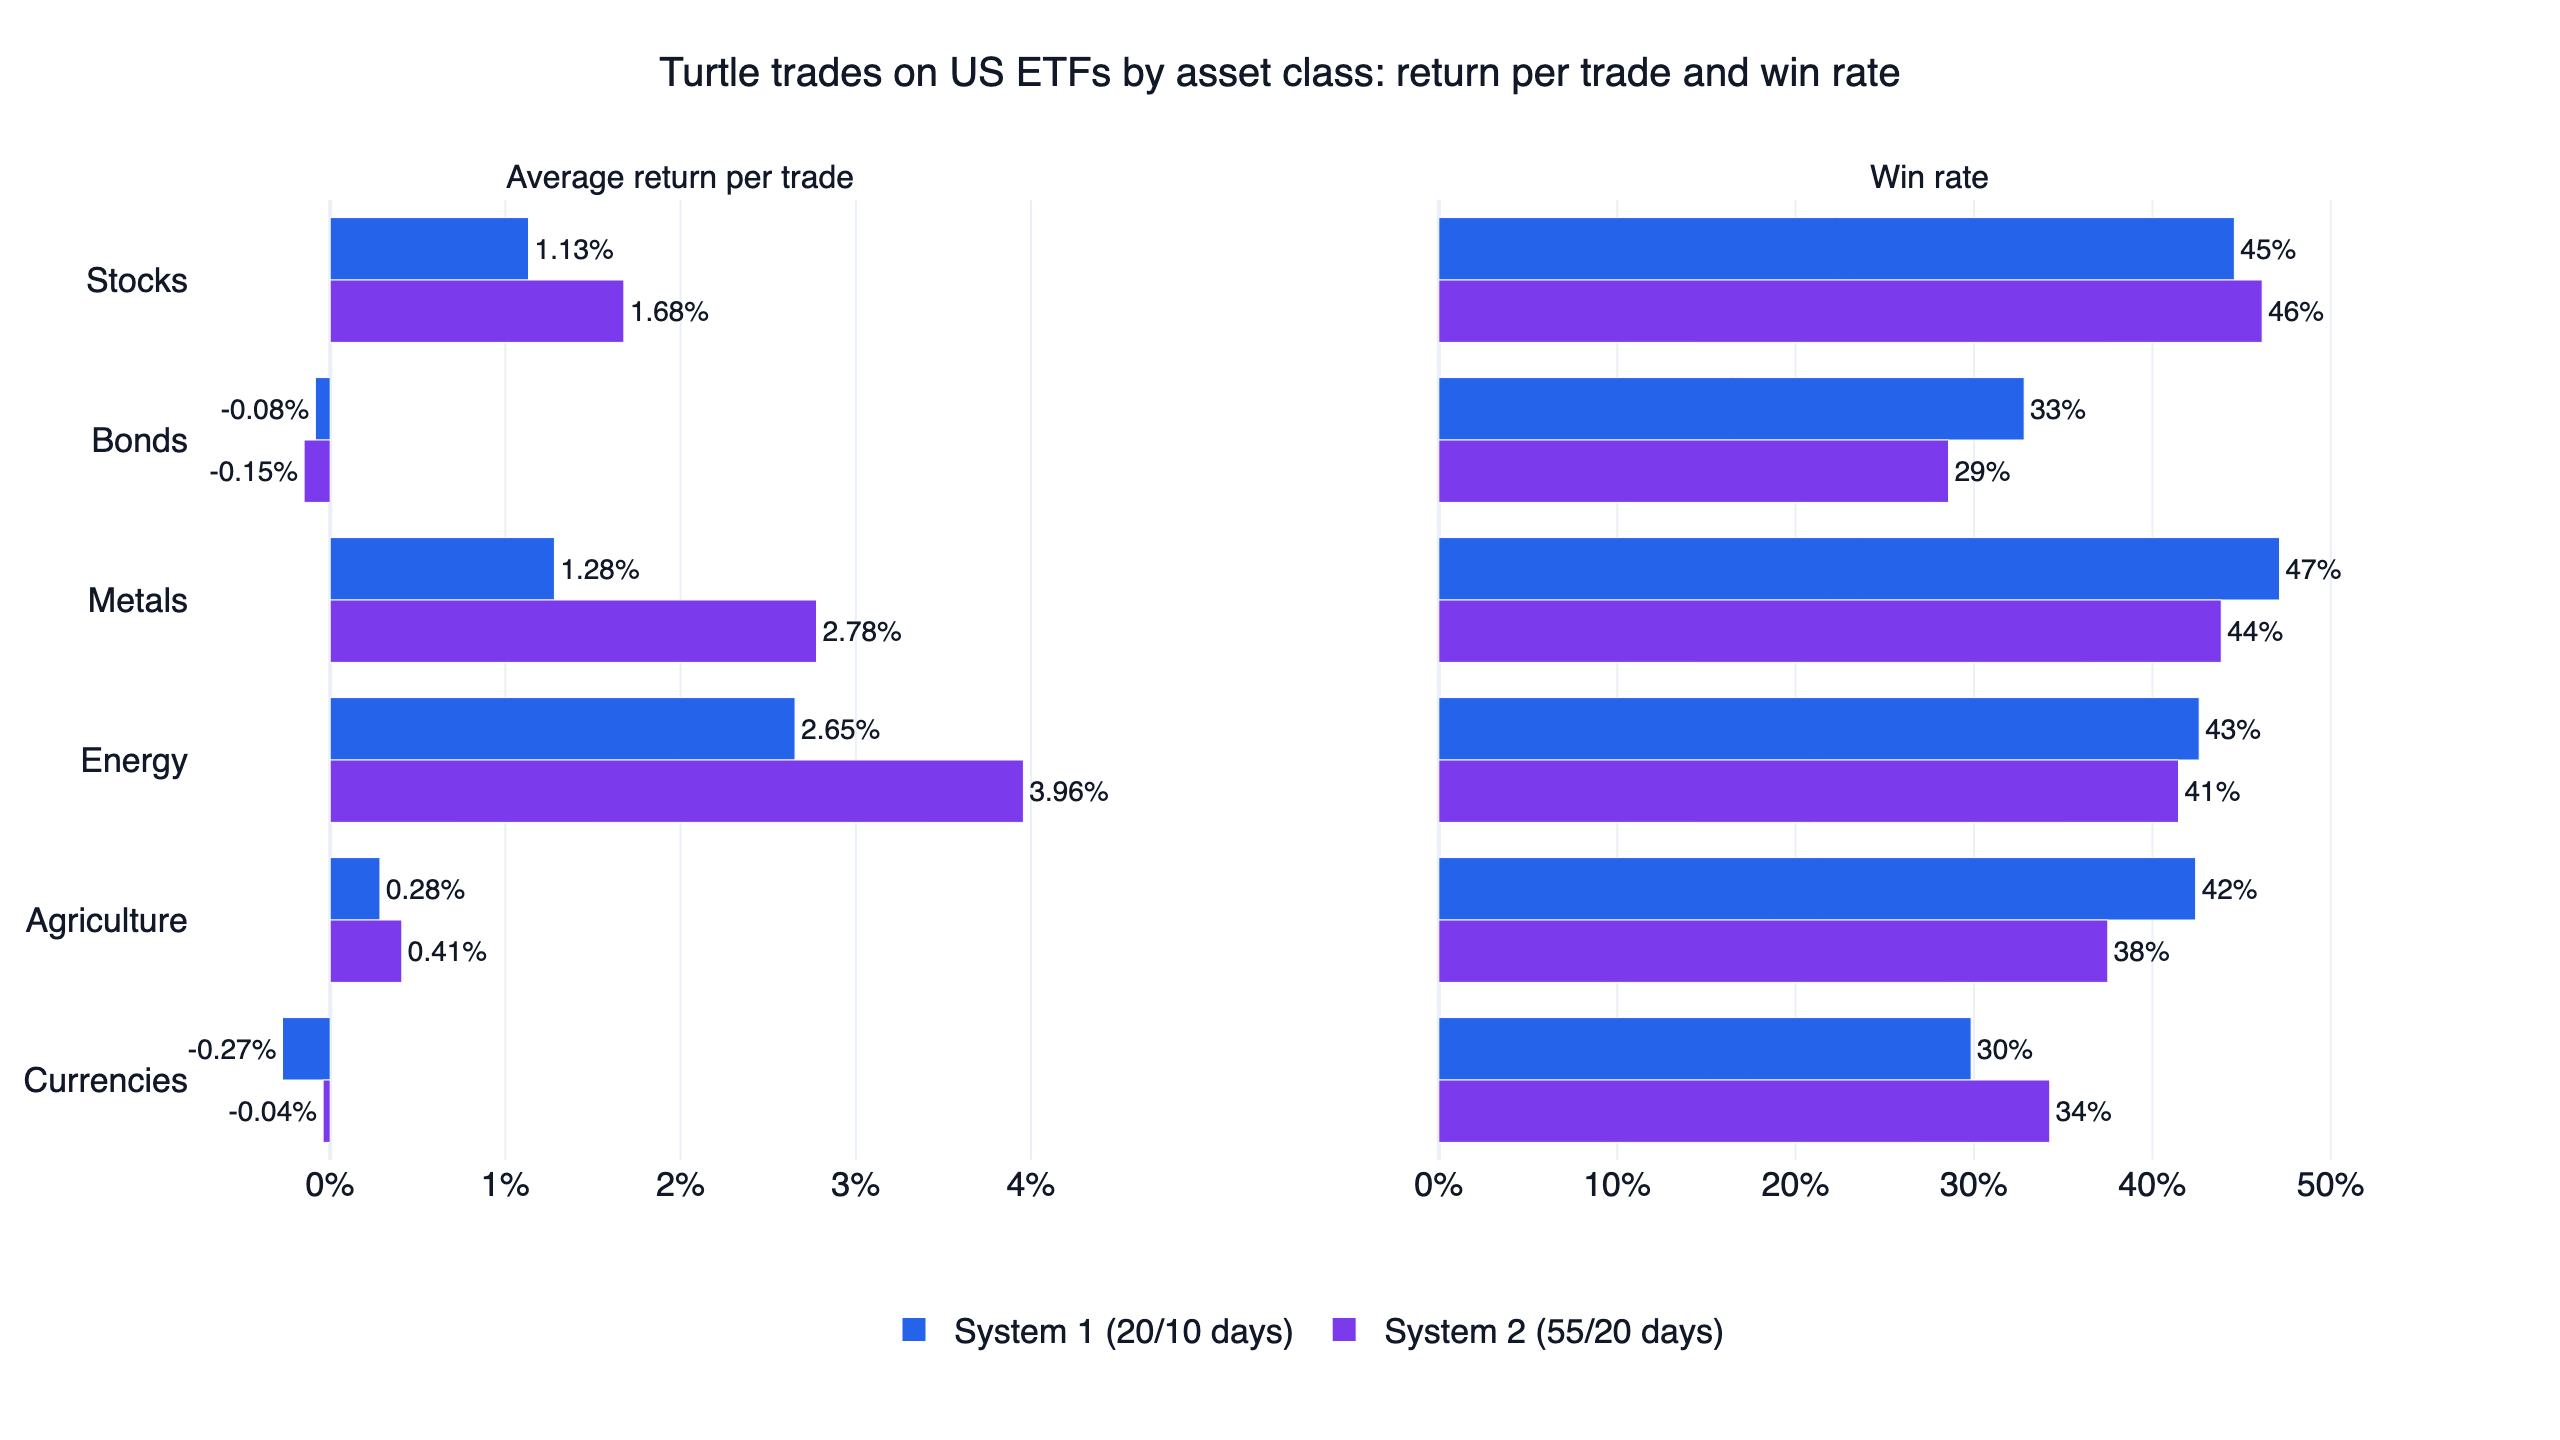
System 1 closed 517 trades and System 2 closed 321. Both had a win rate of about 40%, and the winners were much larger than the losers. System 1's winners averaged +5.4% against -2.2% for its losers, and System 2's +7.0% against -2.2%. The best single trades gained 60% and 81%, and the median trade lasted 14 and 15 trading days.
Energy and metals earned the most per trade, stocks earned a little, and bonds and currencies lost slightly in both systems. Currency ETFs made up 124 of System 1's 517 trades, second only to the five stock ETFs, and they won only 30% of the time for an average of -0.27%.
System 1's filter skipped 505 of the 2,288 breakouts in markets the system did not hold, or 22%. We did not test System 1 without it.
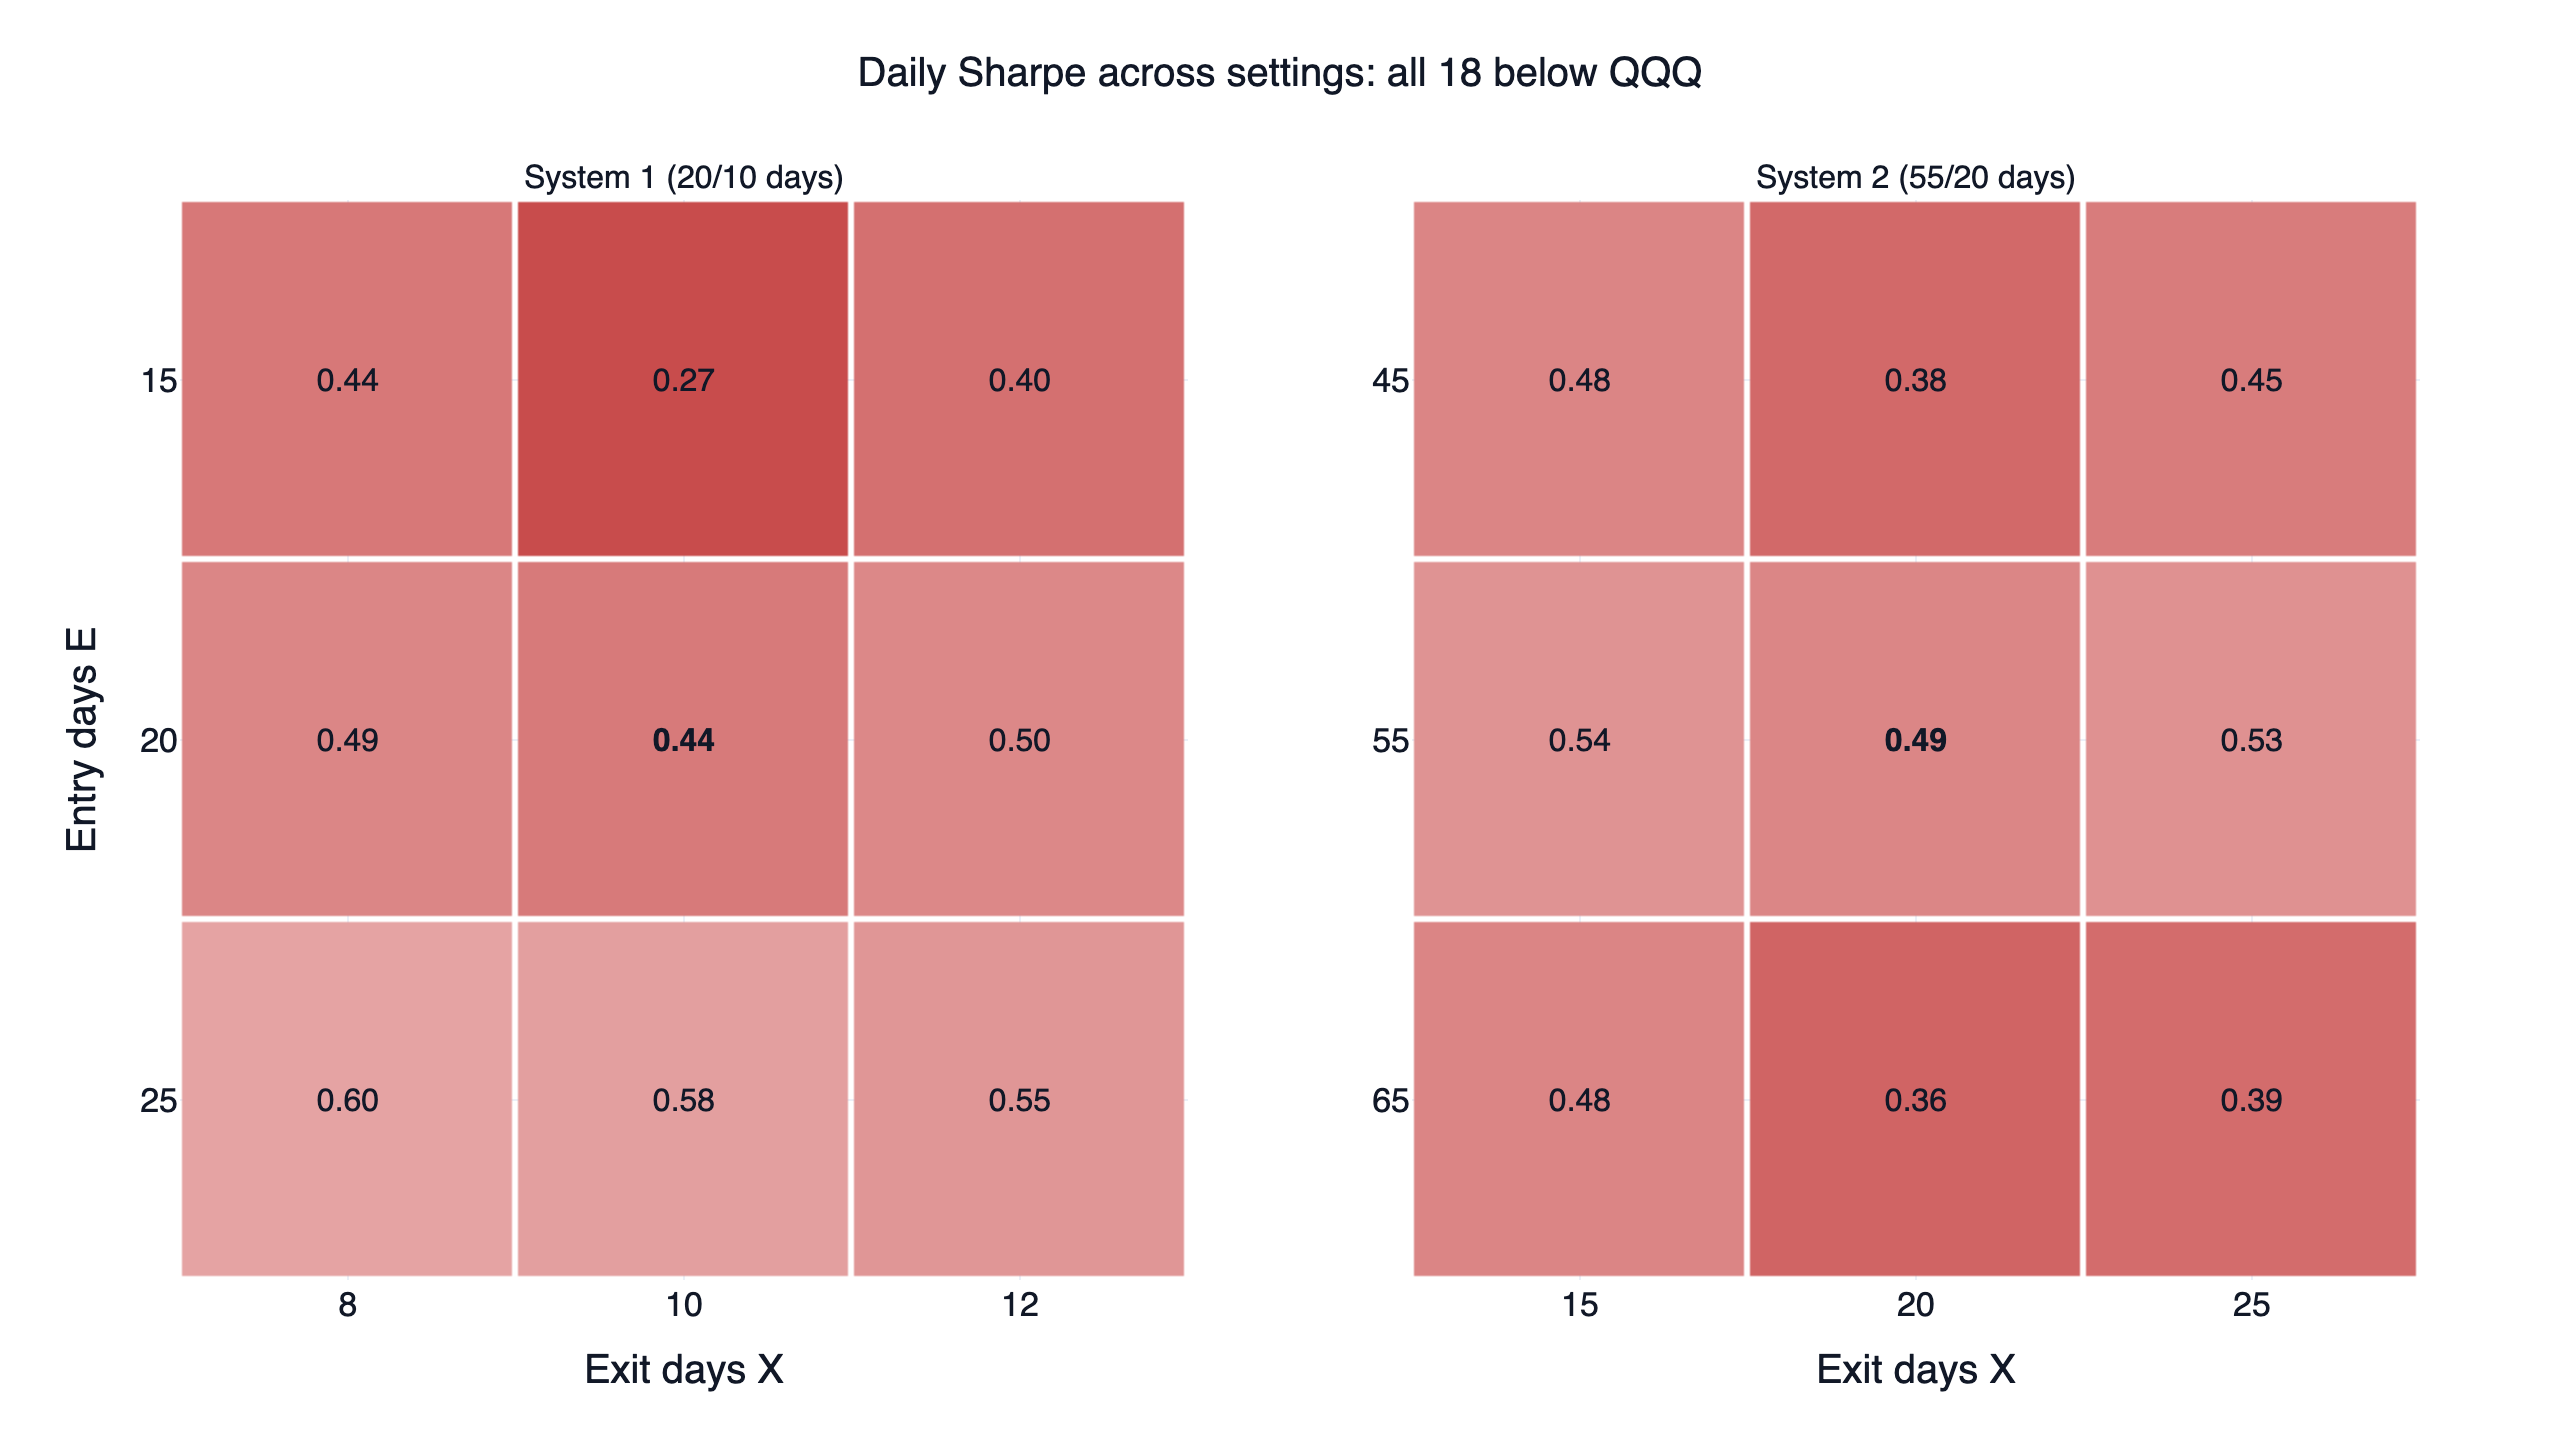
Bold marks the original rules. None of the 18 cells came within reach of QQQ. System 1 ranged from 0.27 to 0.60 and did best with a 25-day entry (0.55 to 0.60). System 2 ranged from 0.36 to 0.54.
Costs and the fixed mix
On days the weights were scaled down, which was most days, any buy or sell changed the size of every other position. System 1 rebalanced on 902 days and System 2 on 676, and their target weights turned over 21.8 and 15.0 times a year one way. At 0.1% per side, System 1's Sharpe ratio fell from 0.44 to 0.11 and its return to 0.6% a year, and System 2's fell from 0.49 to 0.29 and 3.3%. Real ETF spreads and slippage would add to that.
The strongest result against the rules is the fixed mix. Holding each system's average ETF weights all the time, with a monthly rebalance, scored 0.90 against System 1 and 0.92 against System 2. It returned 8.1% and 8.7% a year with maximum drawdowns of -19.8% and -21.7%. Timing the same ETFs with Donchian channels lost return and added drawdown. Our long-short equity backtest found the same with a simpler signal: cross-asset time-series momentum on QQQ, IEF, GLD and DBC scored 1.09 from 2017 to 2026, and its fixed mix scored 1.19.
How this fits other research
The case for trend following comes mostly from futures. Moskowitz, Ooi and Pedersen (2012) found that a market's past 12-month return predicted its next month's return in 58 liquid futures and forwards, and that a diversified portfolio of these trades earned substantial returns. Hurst, Ooi and Pedersen (2017) extended a similar strategy back to 1880 and reported it consistently profitable across more than a century. Channel breakouts are among the oldest of these rules: Brock, Lakonishok and LeBaron (1992) tested trading range breaks on the Dow Jones index from 1897 to 1986 and found that buy signals were followed by higher returns.
Three differences may explain why this test came out worse. The ETFs could not be leveraged, so each position was a fraction of its intended size. Eighteen ETFs are far fewer than the 58 futures and forwards in the first study. And ten years is a short sample for a strategy that earns most of its money in a few long trends.
The code
This is a simplified System 2: one unit per market, no added units, no stop and no caps. On data through 2026-11-05 it prints a daily Sharpe of about 0.67, higher than the full rules' 0.49. research.py runs the full rules, both systems, all 18 settings and the six checks.
Show Code
import finlab
import numpy as np
from finlab import data
from finlab.backtest import sim

finlab.login()
data.set_market("us_fund")

etfs = ["SPY", "QQQ", "IWM", "EFA", "EEM", "TLT", "IEF", "GLD", "SLV", "CPER",
        "USO", "UGA", "DBA", "FXE", "FXB", "FXF", "FXY", "FXC"]

# Adjusted high, low and close: scale the raw prices by the dividend adjustment.
# The fund table has empty rows on market holidays, so keep trading days only.
close = data.get("us_fund_price:adj_close")[etfs].dropna(how="all")
factor = close / data.get("us_fund_price:close")[etfs].loc[close.index]
high = data.get("us_fund_price:high")[etfs].loc[close.index] * factor
low = data.get("us_fund_price:low")[etfs].loc[close.index] * factor

# N: the 20-day average true range with Wilder's smoothing
previous = close.shift(1)
true_range = np.maximum(high, previous) - np.minimum(low, previous)
n = true_range.ewm(alpha=1 / 20, adjust=False, min_periods=20).mean()

# System 2 channels: enter above the 55-day high, leave below the 20-day low
enter = close > high.shift(1).rolling(55).max()
leave = close < low.shift(1).rolling(20).min()
held = enter.hold_until(leave)

# One unit risks 1% of the account per N, so its weight is 1% x price / N.
# The weight is fixed on the entry day; sim scales rows above 100% down to 100%.
unit = (0.01 * close / n).where(enter & ~held.shift(1, fill_value=False))
position = unit.ffill().where(held, 0).loc["2016-09-01":]

report = sim(position, trade_at_price="open", upload=False)
returns = report.creturn.pct_change().dropna()
print("Daily Sharpe:", round(returns.mean() / returns.std() * 252 ** 0.5, 2))
Why the simple version scored higher was a question we asked after seeing the results, so treat the answer as exploratory. Adding units hurt the most: one unit per market with the 2N stop scored 0.71, while added units and caps without the stop scored 0.31. Even 0.71 is below QQQ and below the fixed mix.
Install the FinLab skill for your AI agent
You do not need to write this yourself. Install the FinLab skill in Claude Code, Codex or Gemini CLI with one command:
Show Code
npx skills add koreal6803/finlab-ai --skill finlab -g -yThen ask your agent in plain language, for example "run the Turtle System 2 on SPY, TLT and GLD only" or "cap the Turtle portfolio at 2 units a market and charge 0.05% per side". The agent setup page has the details, and FinLab Studio runs the same research in a browser.
Backtest method and limits
| Item | How it was handled |
|---|---|
| Window | 2016-09-01 to 2026-11-05. FinLab's US fund prices start in January 2016, and the first months warm up the 55-day channel and N |
| Universe | 18 US ETFs in six groups, fixed in advance. Some, such as USO, changed how they hold futures during the window |
| Signals | Channels, N and stops use prices up to the signal day only (look-ahead bias control) |
| Sizing | 1% of the account per N per unit; rows above 100% scaled down to 100%; no leverage and no short sales; cash earns nothing |
| Execution | Signal at a close, traded at the next day's open, on adjusted prices. Faith's rules fill during the day at the breakout or stop price |
| Turnover | 21.8 times a year for System 1 and 15.0 for System 2, one way on target weights |
| Cost | finlab sim() default US cost of zero, plus a rerun at 0.1% per side. Spreads and slippage are not estimated separately |
| Taxes | None |
| Sample | Whole window in-sample. The halves only check stability; no out-of-sample test was run |
What this result does and does not say
Within this window and on these 18 ETFs, the Turtle trading rules earned less than holding the same ETFs, with deeper drawdowns, and far less than QQQ. The test does not cover futures, leverage, short sales or a longer history, which is where the research on trend following is strongest. A trend strategy built for ETFs, for example with fewer markets and volatility targeting, would be a different test. One such test is our QQQ volatility targeting strategy, and a QQQ breakout rule that times leveraged ETFs is in the breakout trading strategy.
For multi-asset portfolios that do not time the market, see the lazy portfolio backtest and the risk parity backtest. The US strategy comparison collects the rest of our work.
FAQ
Does the Turtle trading strategy still work?
Not on these ETFs in this decade. System 2 returned 6.5% a year with a Sharpe ratio of 0.49 and System 1 returned 5.1% with 0.44, against 19.2% and 0.89 for QQQ. Both lost to holding the same ETFs at fixed weights.
What are the Turtle trading rules?
Buy when the price breaks the highest high of the past 20 days (System 1) or 55 days (System 2); this test uses closes. Sell at the lowest low of the past 10 or 20 days, or 2N below the last purchase. Size each unit to risk 1% per N, and add a unit every 0.5N, up to 4 per market.
What is a Donchian channel?
The highest high and lowest low over a fixed number of past days. The Turtles bought when the price broke above the upper line and sold when it broke below a shorter lower line. This test checks both on daily closes.
Which is better, Turtle System 1 or System 2?
System 2 scored higher, 0.49 against 0.44, and it gained 4.2% in 2022 while System 1 lost 21.9%. System 1 also suffered more from costs: at 0.1% per side it returned 0.6% a year.
Which markets worked best for the Turtle rules?
Energy and metals ETFs earned the most per trade, up to 4.0% on average for System 2's energy trades. Bond and currency ETFs lost slightly in both systems.
Can the Turtle rules be used without leverage?
They can, but the sizing no longer works as designed. The rules asked for about 8 to 9 times the account on a typical day, so each unit ended up risking about 0.1% of the account.
Can I rerun this?
Yes. Install the FinLab skill through the AI-assisted setup, download research.py below and run python research.py.
Reproduce it yourself
- research.py: both systems with the full rules, the 18 settings, both halves, the cost runs and the six checks. It also runs a version on Taiwan large caps.
- data.csv: daily equity curves of both systems at their original settings, plus QQQ and SPY.
- metrics.json: the statistics behind this article, including trades by asset class, average weights and calendar-year returns.
New research is on the FinLab blog, and the team is on the about page. A mean reversion rule on S&P 500 stocks is in the Bollinger Bands strategy backtest.
Disclaimer: this article is for education only and does not constitute investment advice. Past performance does not guarantee future results, and investing involves risk. All results are in-sample, and the two halves were not validated out of sample.
Last updated: 2026-11 | Backtest window: 2016-09 to 2026-11 | Data through 2026-11-05, run 2026-11-07 | Benchmark: QQQ total return | Author: FinLab Quant Research (reviewed by a quantitative researcher)
FinLab AI
Want to build your own strategy?
Describe your stock-picking ideas in natural language. AI automatically validates, backtests, and gives you answers
Start Free