Run this strategy
Copy the prompt to reproduce the evidence above with the article’s data, assumptions, and risk checks.
Tell your AI:
Set up FinLab and rerun the dividend capture backtest on US stocks. Please read: https://finlab.finance/en/setup?relatedUrl=/en/blog/dividend-capture-strategy-backtest
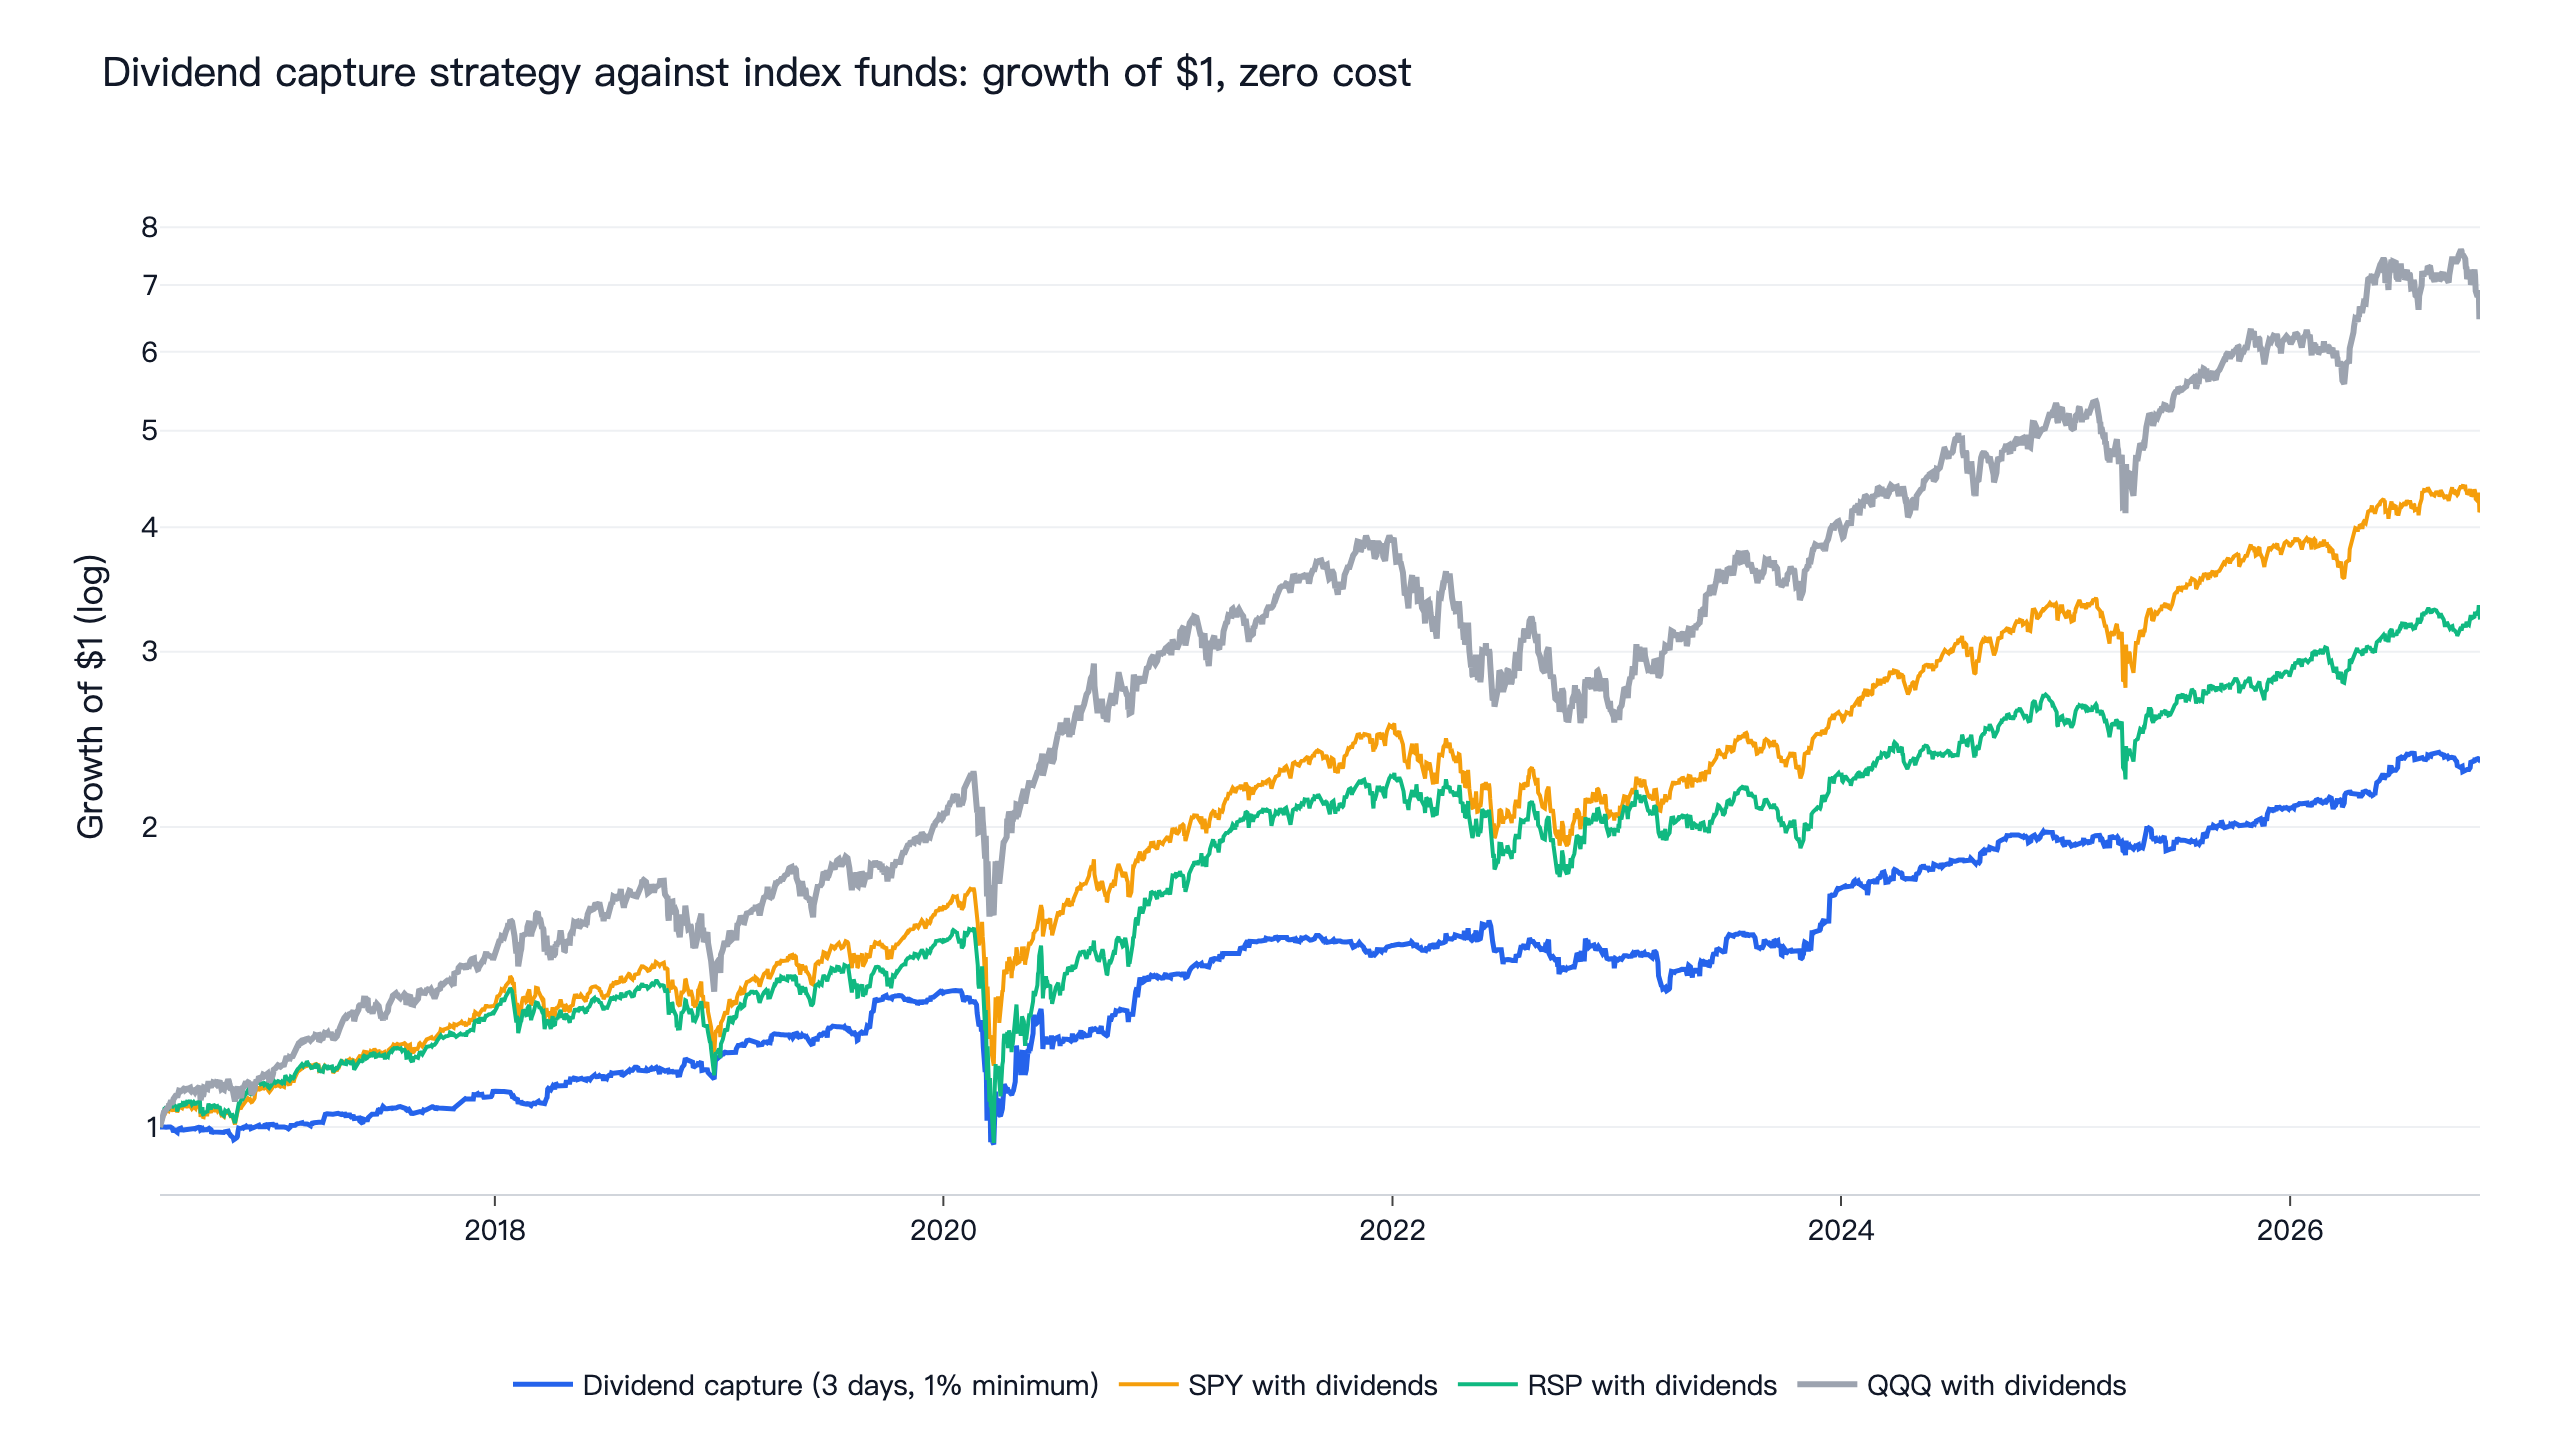
A dividend capture strategy buys a stock just before its ex-dividend date and sells it right after. We tested it on US common stocks from July 2016 to November 2026, across 9 settings and 31,843 ex-dividend days. On those days the price fell by less than the dividend, about 76% to 93% of it at the median, so the average one-day trade made 0.17% to 0.18% on mid-sized payments. That gain is smaller than a 0.2% round trip. Buying three days before the ex-date on payments of at least 1% returned 8.6% a year with a Sharpe ratio of 0.75 at zero cost, against QQQ's 20.0% and 0.93. At 0.1% per side it returned 2.7% a year, and that is before tax on the dividends.
The idea is simple and the arithmetic is easy to misread. A stock pays you a dividend, its price falls on the ex-date by about that amount, and you have swapped price for cash. Dividend capture only makes money if the price falls by less than the dividend. In this sample it did, on average, and the rest of this article is about whether that gap is big enough to keep.
Dividend capture results at a glance
| Bought before ex-date | Minimum yield | Sharpe, zero cost | CAGR, zero cost | Sharpe, 0.1% per side | CAGR, 0.1% per side | Trades | Win rate | Mean trade |
|---|---|---|---|---|---|---|---|---|
| 1 day | 0.5% | 1.11 | 10.7% | -0.51 | -5.1% | 17,527 | 54.6% | 0.16% |
| 1 day | 1% | 0.66 | 3.6% | -0.33 | -2.0% | 5,849 | 53.8% | 0.14% |
| 1 day | 2% | 0.08 | 0.1% | -0.44 | -0.9% | 1,097 | 53.5% | 0.03% |
| 3 days | 0.5% | 0.80 | 12.8% | -0.04 | -2.1% | 17,505 | 54.5% | 0.24% |
| 3 days | 1% | 0.75 | 8.6% | 0.29 | 2.7% | 5,830 | 55.0% | 0.37% |
| 3 days | 2% | 0.33 | 1.3% | 0.08 | 0.2% | 1,089 | 53.1% | 0.25% |
| 5 days | 0.5% | 0.78 | 14.0% | 0.18 | 1.7% | 17,023 | 55.2% | 0.37% |
| 5 days | 1% | 0.76 | 11.9% | 0.43 | 6.0% | 5,644 | 56.5% | 0.61% |
| 5 days | 2% | 0.54 | 3.7% | 0.40 | 2.7% | 1,032 | 57.1% | 0.78% |
QQQ with dividends scored 0.93 and returned 20.0% a year over the same window (0.91 to 0.92 over the three setting windows that start later). The bold row is the original setting. SPY scored 0.86 and RSP, the equal-weight S&P 500 fund, 0.72. Mean trade is the arithmetic mean of each trade's return.
What the dividend capture rule does
- Which dividends. Every cash dividend of a US common stock trading at least $20M a day on average, with a declaration date known by the day the signal is read. A payment with no declaration date cannot be planned for, so it is skipped.
- When to buy. The signal is read 1, 3 or 5 trading days plus one before the ex-date, and the trade happens at the next close, so the stock is bought 1, 3 or 5 trading days before the ex-date.
- When to sell. At the close of the ex-dividend date, once the dividend entitlement is locked in.
- How big a dividend. The payment must be at least 0.5%, 1% or 2% of the stock price on the signal day.
- Position size. Equal weight across current holdings, at most 5% of the account per stock, cash for the rest.
Prices are adjusted for dividends, so the holder receives the payment in the return. On 3,806 of 3,810 sampled payments in our data the dividend adjustment landed exactly on the ex-date, so the trade is credited with the dividend on the right day. That check matters: if the adjustment landed a day early or late, a backtest could capture the dividend it never held.
Do ex-dividend prices fall by the full dividend?
| Dividend against prior close | Events | Median price drop / dividend | Average one-day return | Average return minus QQQ | Break-even cost per side |
|---|---|---|---|---|---|
| Under 0.5% | 14,393 | 0.77 | +0.04% | -0.04% | 0.02% |
| 0.5% to 1% | 11,622 | 0.76 | +0.17% | +0.06% | 0.08% |
| 1% to 2% | 4,737 | 0.88 | +0.18% | +0.03% | 0.09% |
| 2% and up | 1,090 | 0.93 | +0.02% | -0.14% | 0.01% |
The column "Average one-day return" is buying at the close before the ex-date and selling at the ex-date close, using adjusted prices. Break-even cost per side divides that return by two, so it includes the market's return of that day; the column next to it removes QQQ's return for the day and is the more demanding figure.
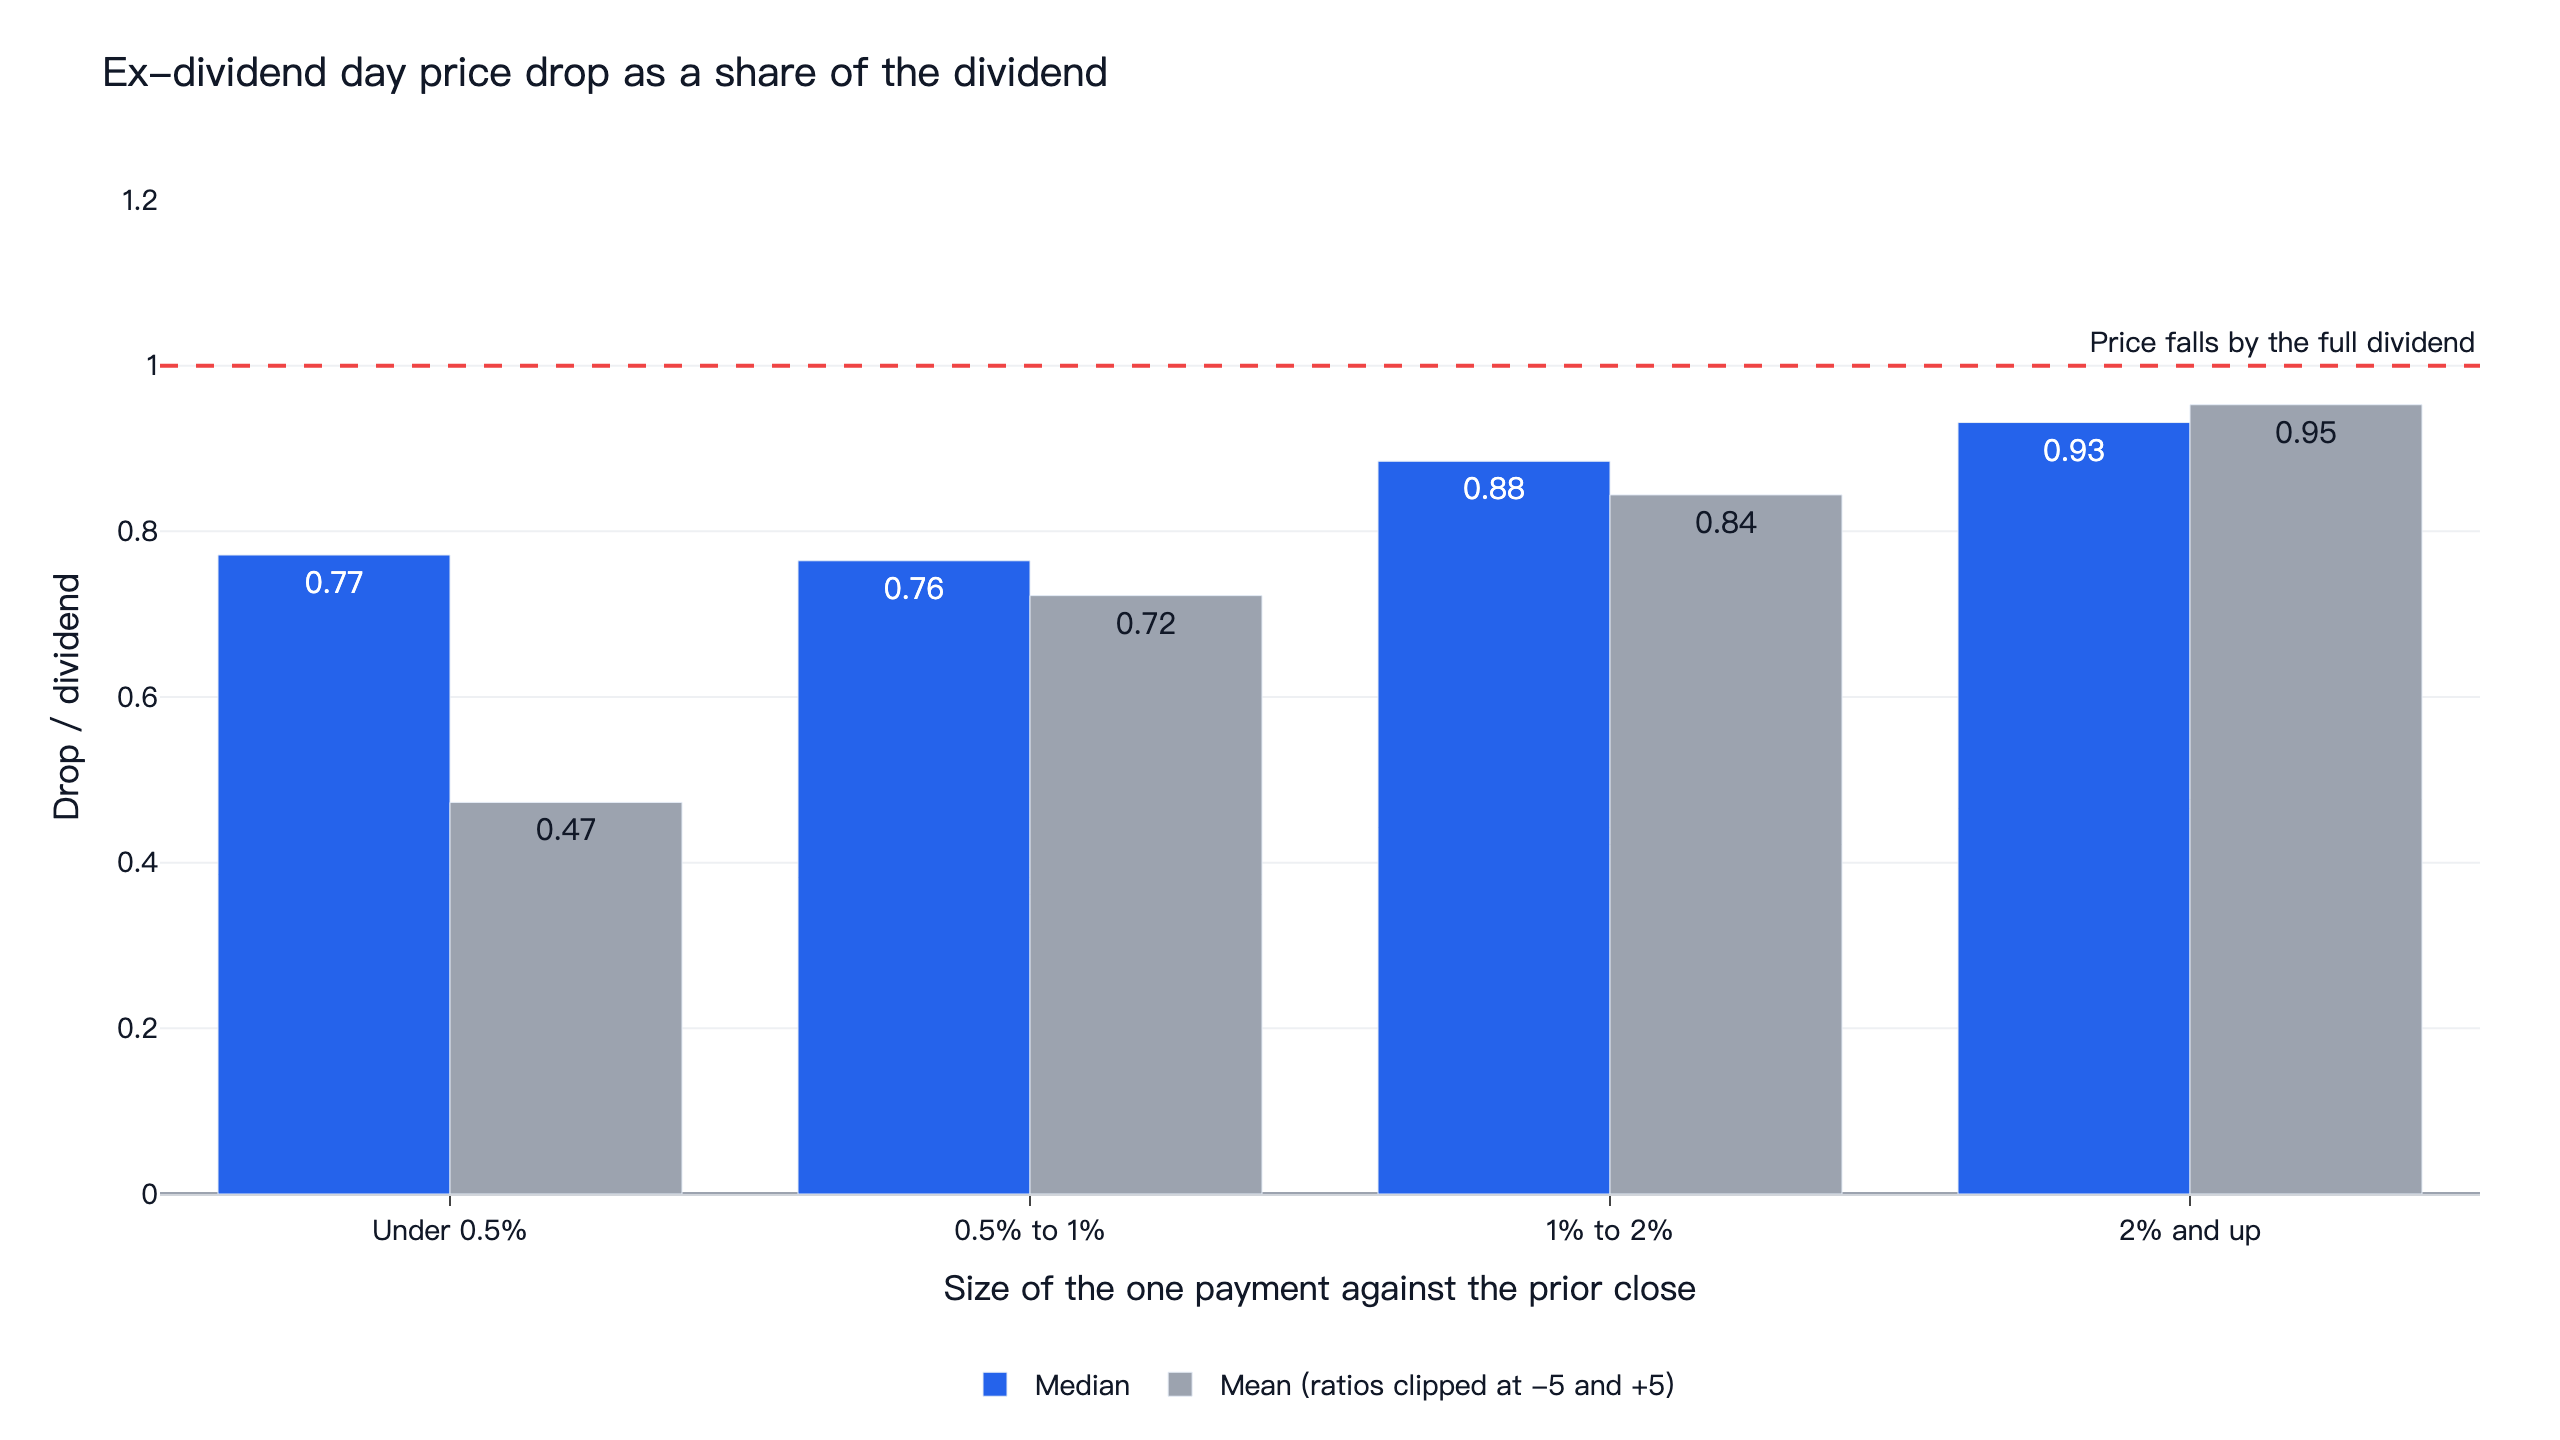
Prices fell by less than the dividend in every bucket. The median drop was 77% of the dividend for the smallest payments and 93% for the largest. The mean ratio, with extreme days clipped at -5 and +5, runs from 0.47 to 0.95; it is lowest for the smallest payments because an ordinary day's price move is large next to a tiny dividend. The closer the drop gets to the full dividend, the less is left to capture, and that is what the larger payments show: their average one-day trade was +0.02%, and it trailed QQQ's return that day by 0.14 points.
This is an old finding. Elton and Gruber (1970) reported ex-day price drops smaller than the dividend and attributed them to taxes: investors value a dollar of dividends at less than a dollar of capital gains. Frank and Jagannathan (1998) found the same in Hong Kong, where neither dividends nor capital gains were taxed, pointing to market microstructure rather than taxes. In both explanations the gap compensates for something.
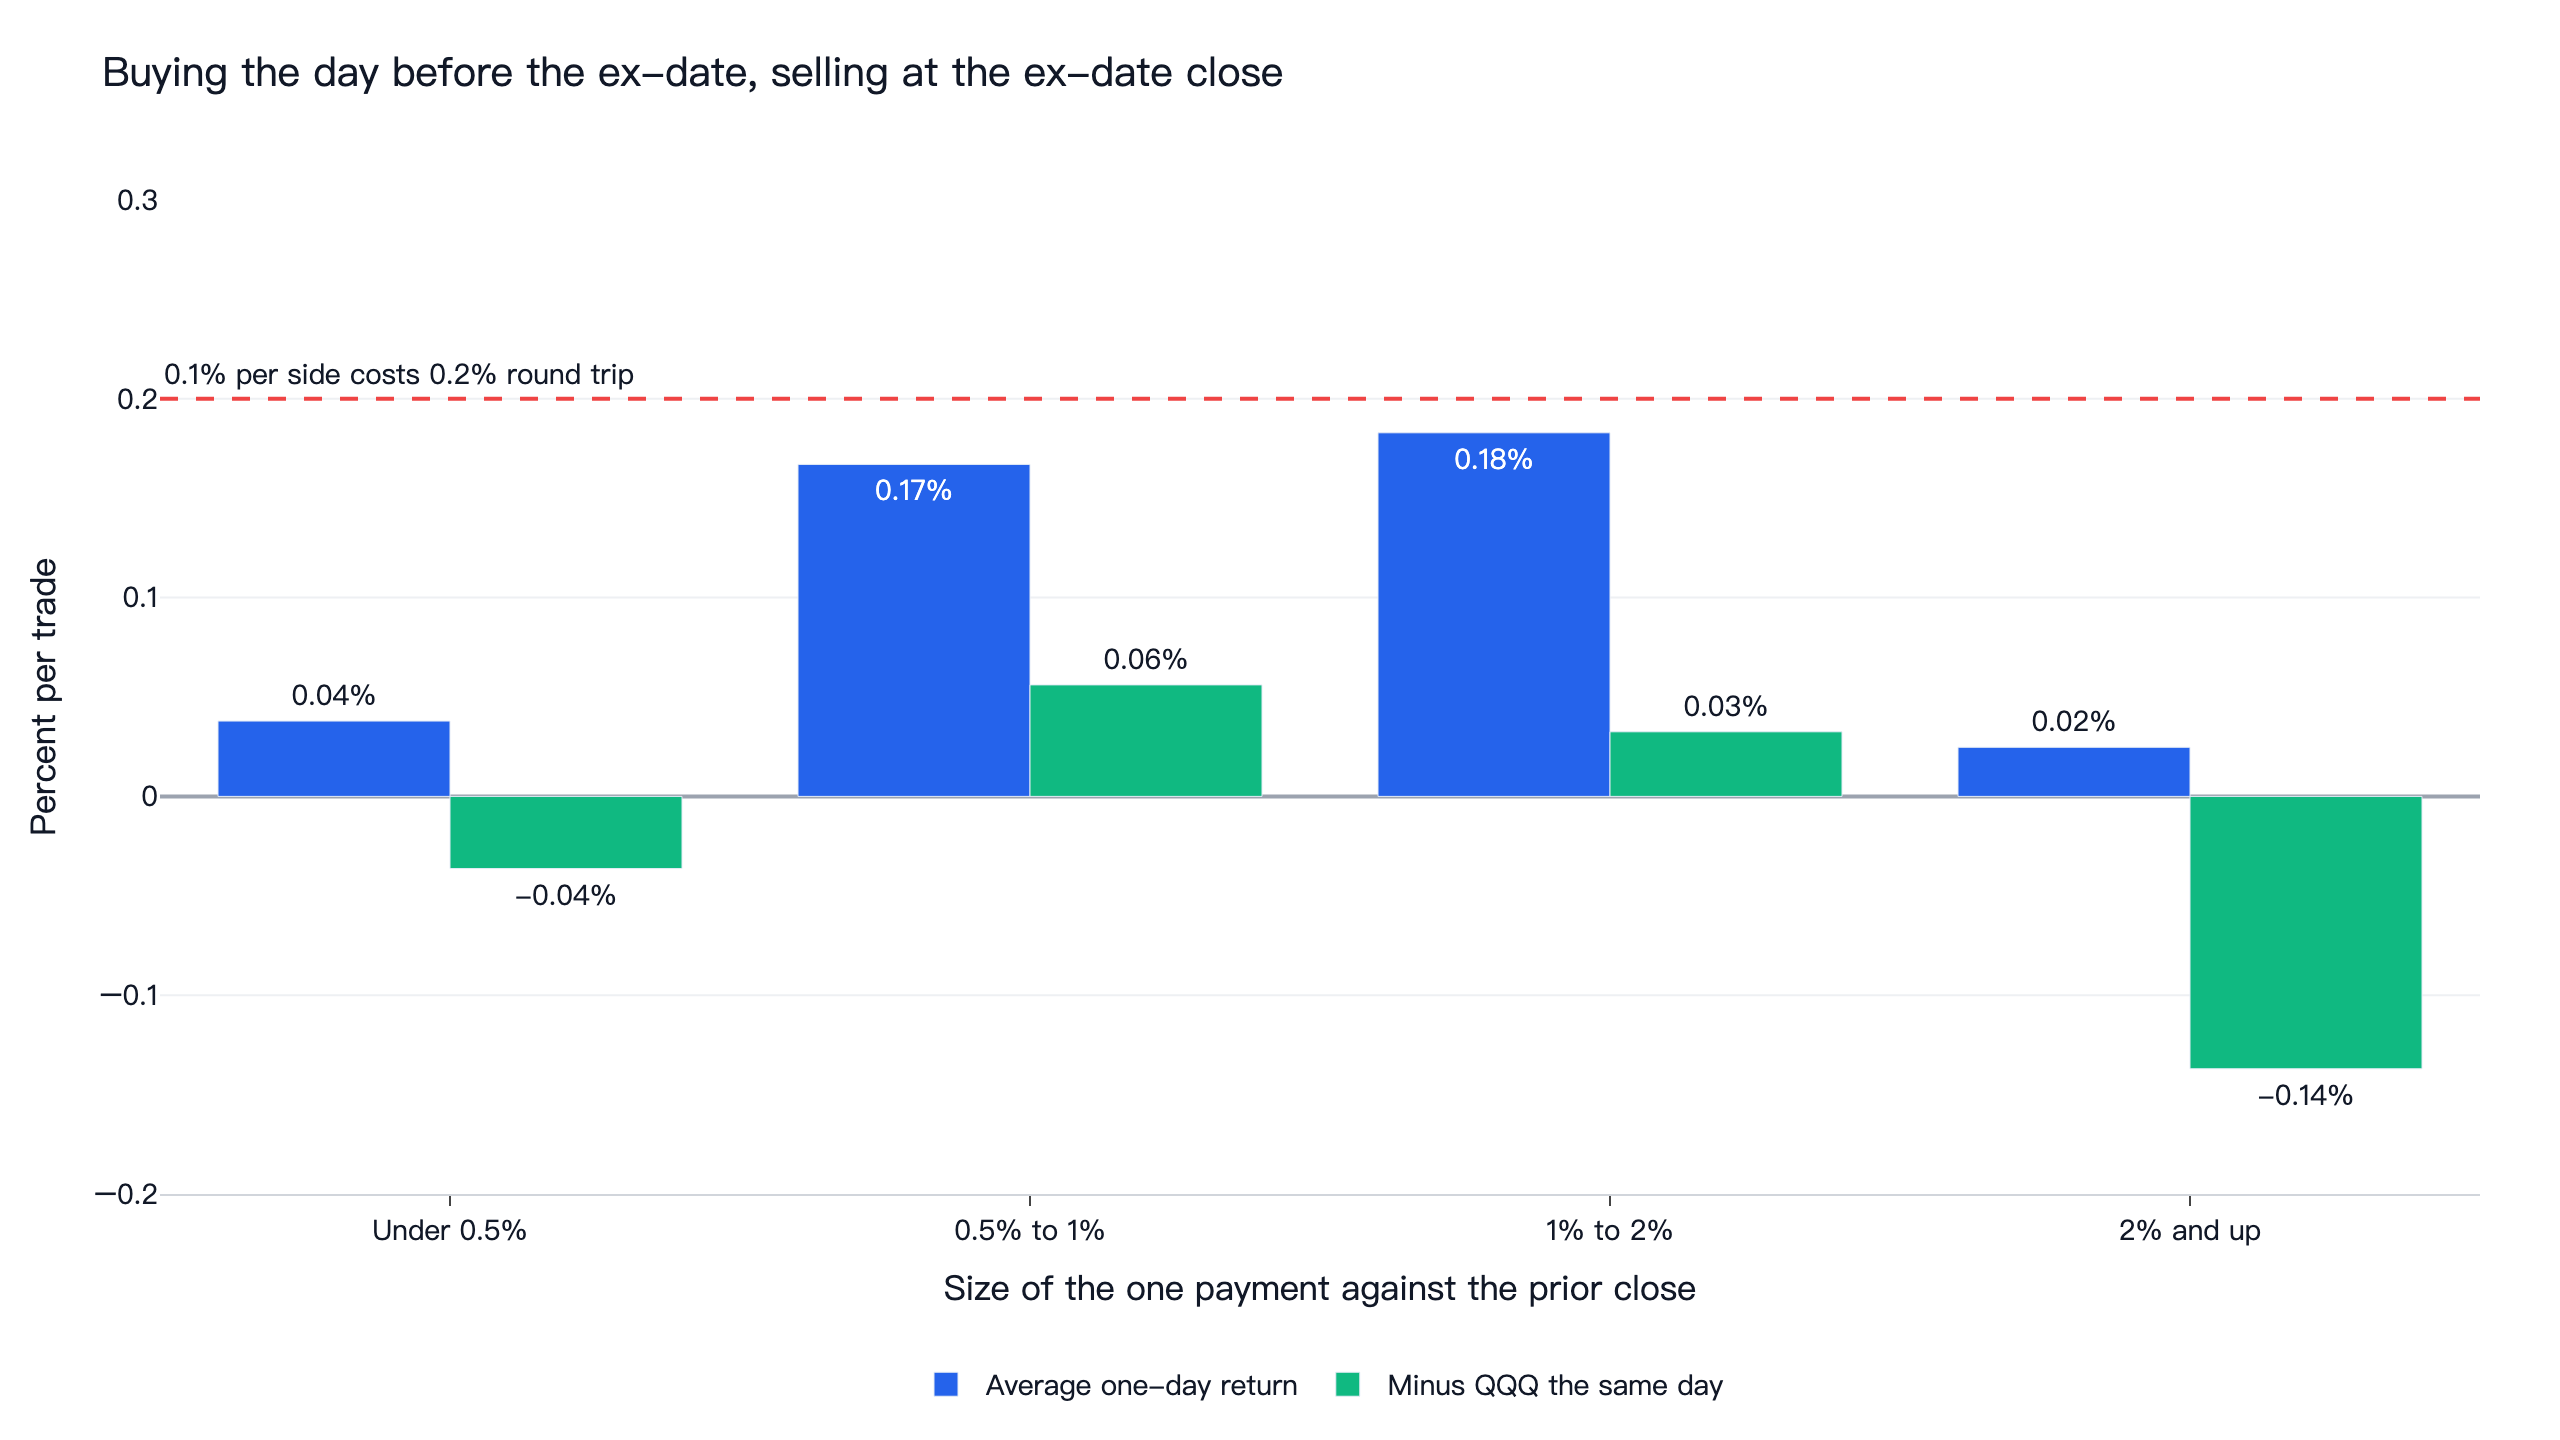
The red line is 0.2%, what a 0.1% per side commission costs on a round trip. No bucket clears it. Payments between 0.5% and 2% have an average one-day return of 0.17% and 0.18%, just under the line, and after subtracting QQQ's return that day only 0.03% to 0.06% is left. With events on the same date averaged first, only the 0.5% to 1% bucket's raw return is reliably above zero (t = 4.26; 1.60 for 1% to 2%). Against QQQ no bucket is: t = 1.56 for 0.5% to 1% and 0.02 for 1% to 2%.
The nine settings: one beat QQQ, and only before costs
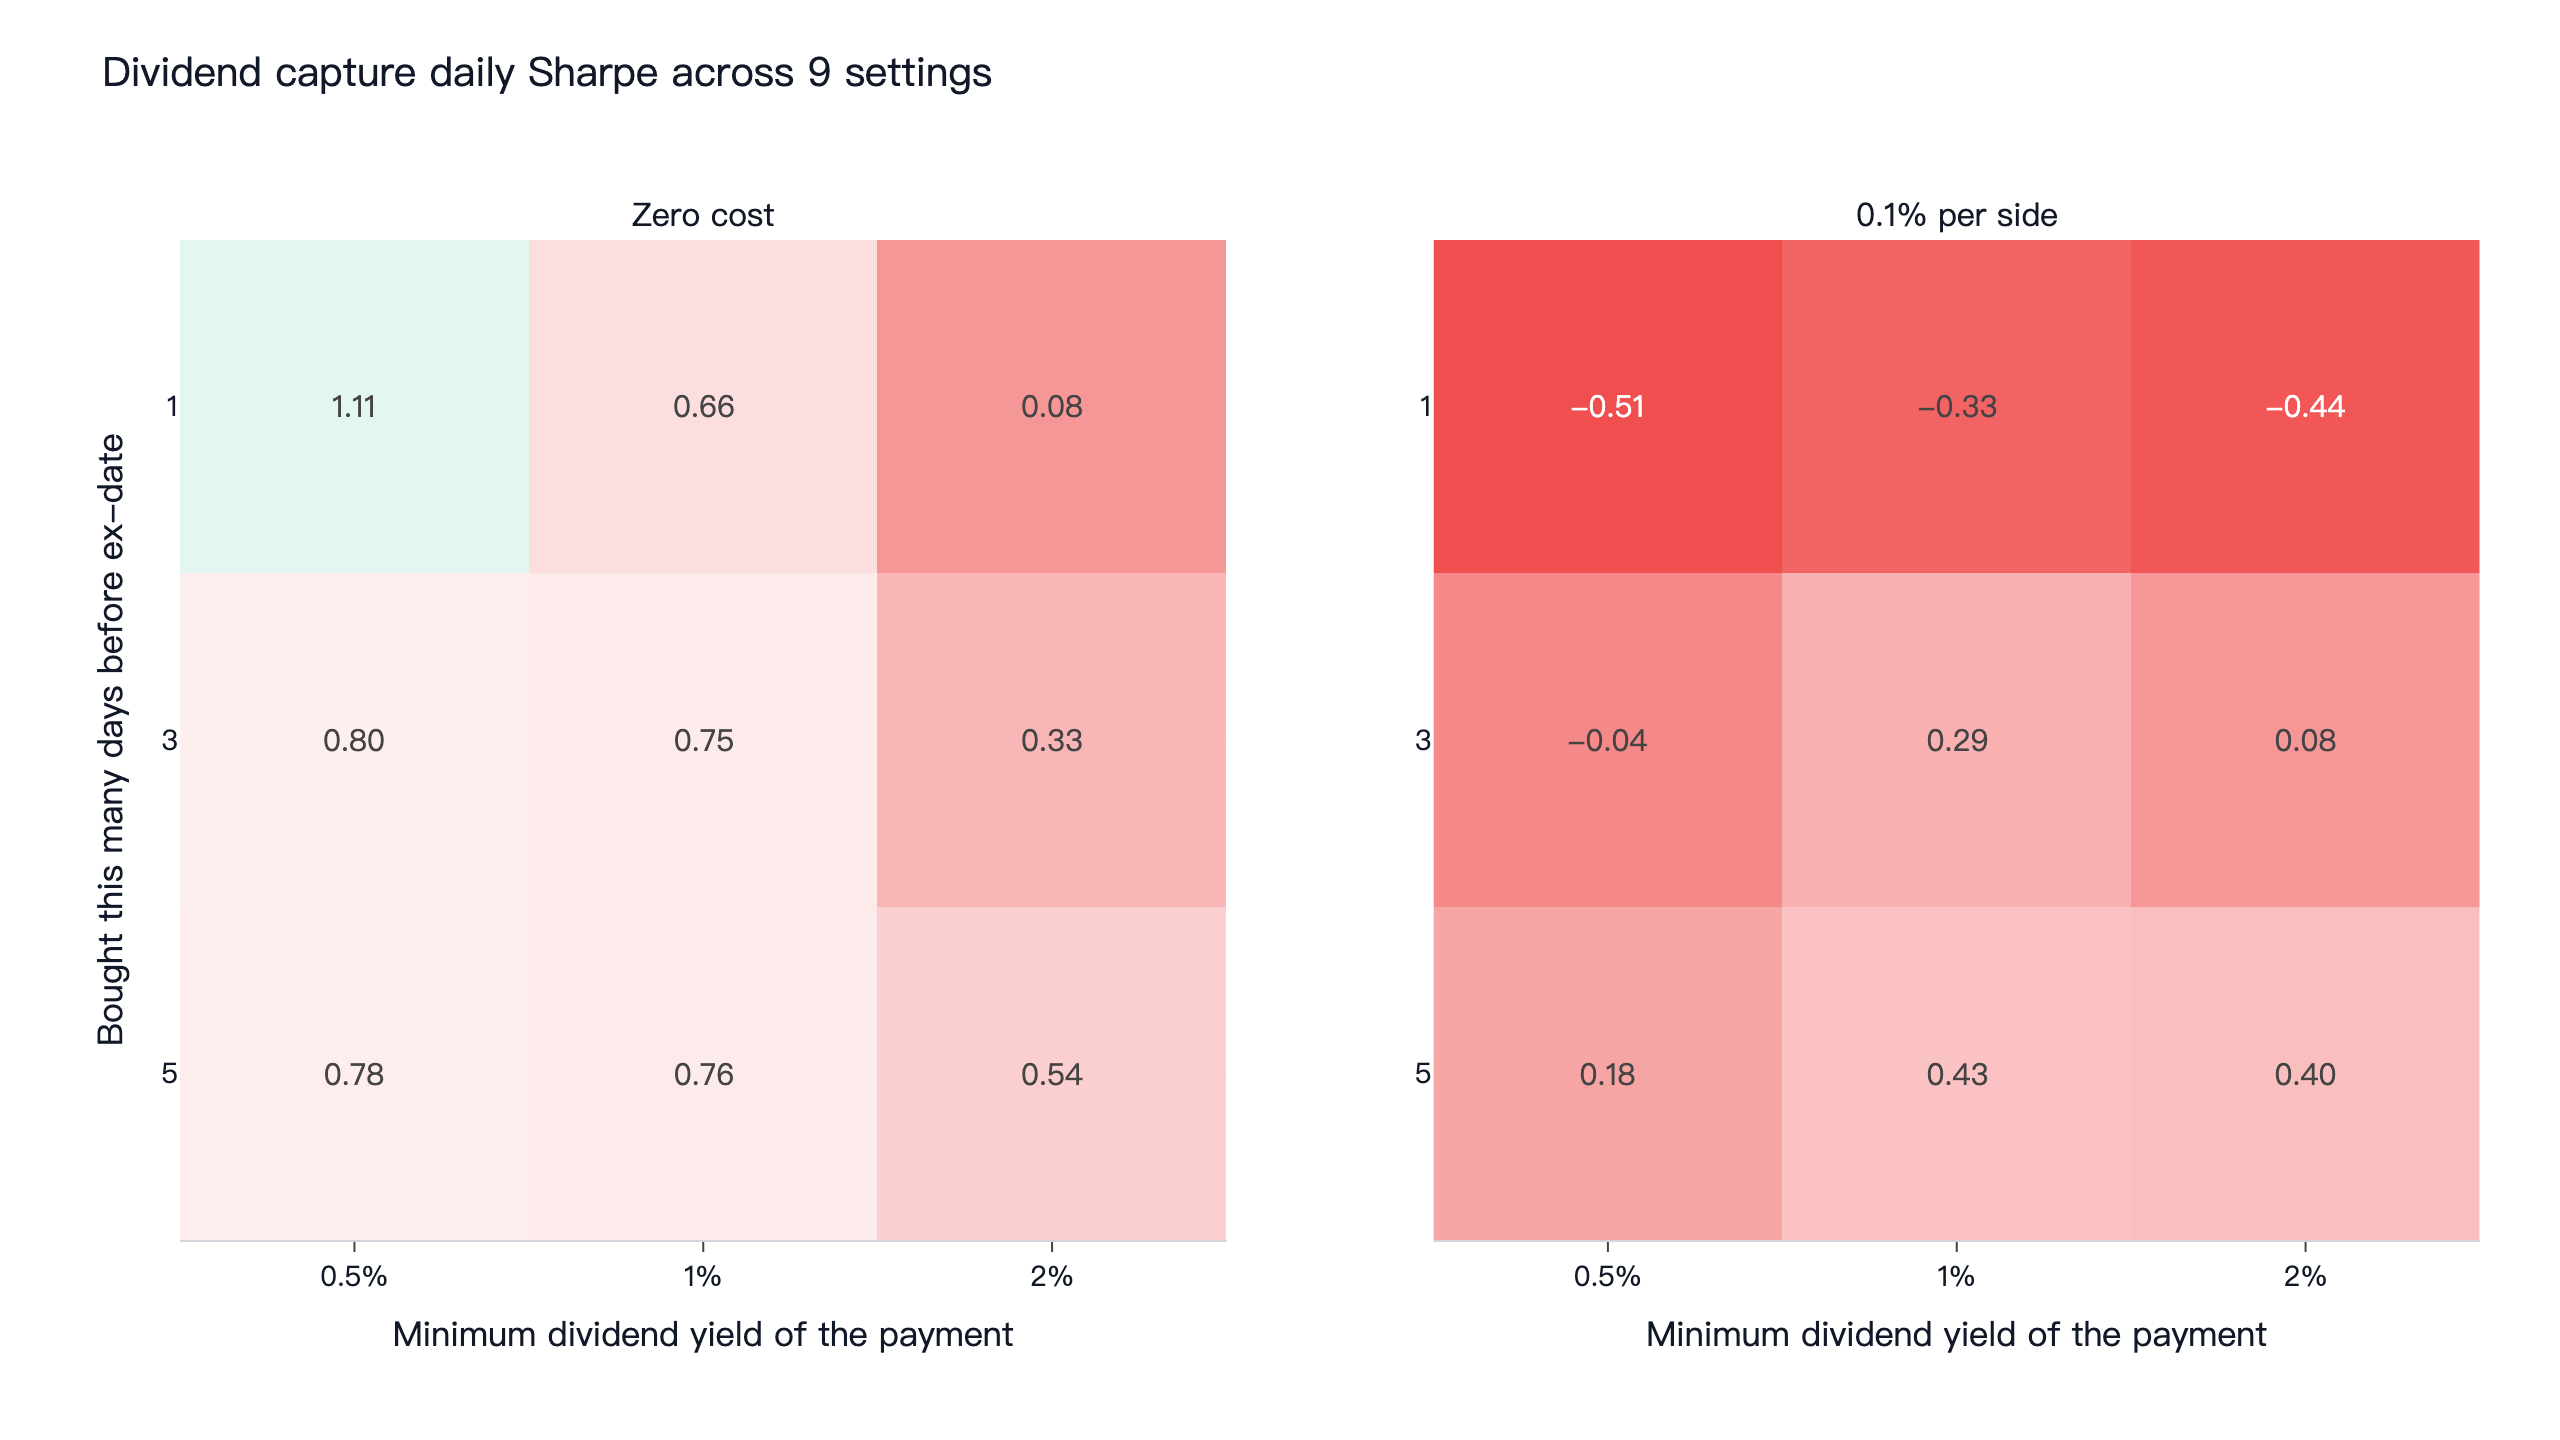
Only one of the nine settings beat QQQ, which scored 0.91 to 0.93 over these windows, at zero cost: buying one day before the ex-date on payments of at least 0.5%, at a Sharpe ratio of 1.11. It made 17,527 trades over the decade, about 1,700 a year, and with that many trades a 0.2% round trip wipes out the return: 10.7% a year falls to -5.1%. The other eight settings scored 0.08 to 0.80 at zero cost, and the 2% minimum, with the fewest trades, scored lowest at each lead.
The longer you hold, the more the trade becomes an ordinary long stock position with a dividend attached, and it picks up the market's return. Buying five days before the ex-date is more exposed to the market, and at 0.1% per side it held up better (0.43 for the 1% minimum), mainly because it trades less per unit of holding time. This is still far below QQQ's 0.93.
The original setting failed all five checks: 0.75 at zero cost against 0.93, and 0.29 at 0.1% per side; 0.57 against 0.83 on returns above T-bills; 0.70 and 0.86 in the two halves against QQQ's 1.27 and 0.60; 0.86 against 1.26 after removing 2022, the year it led QQQ the most.
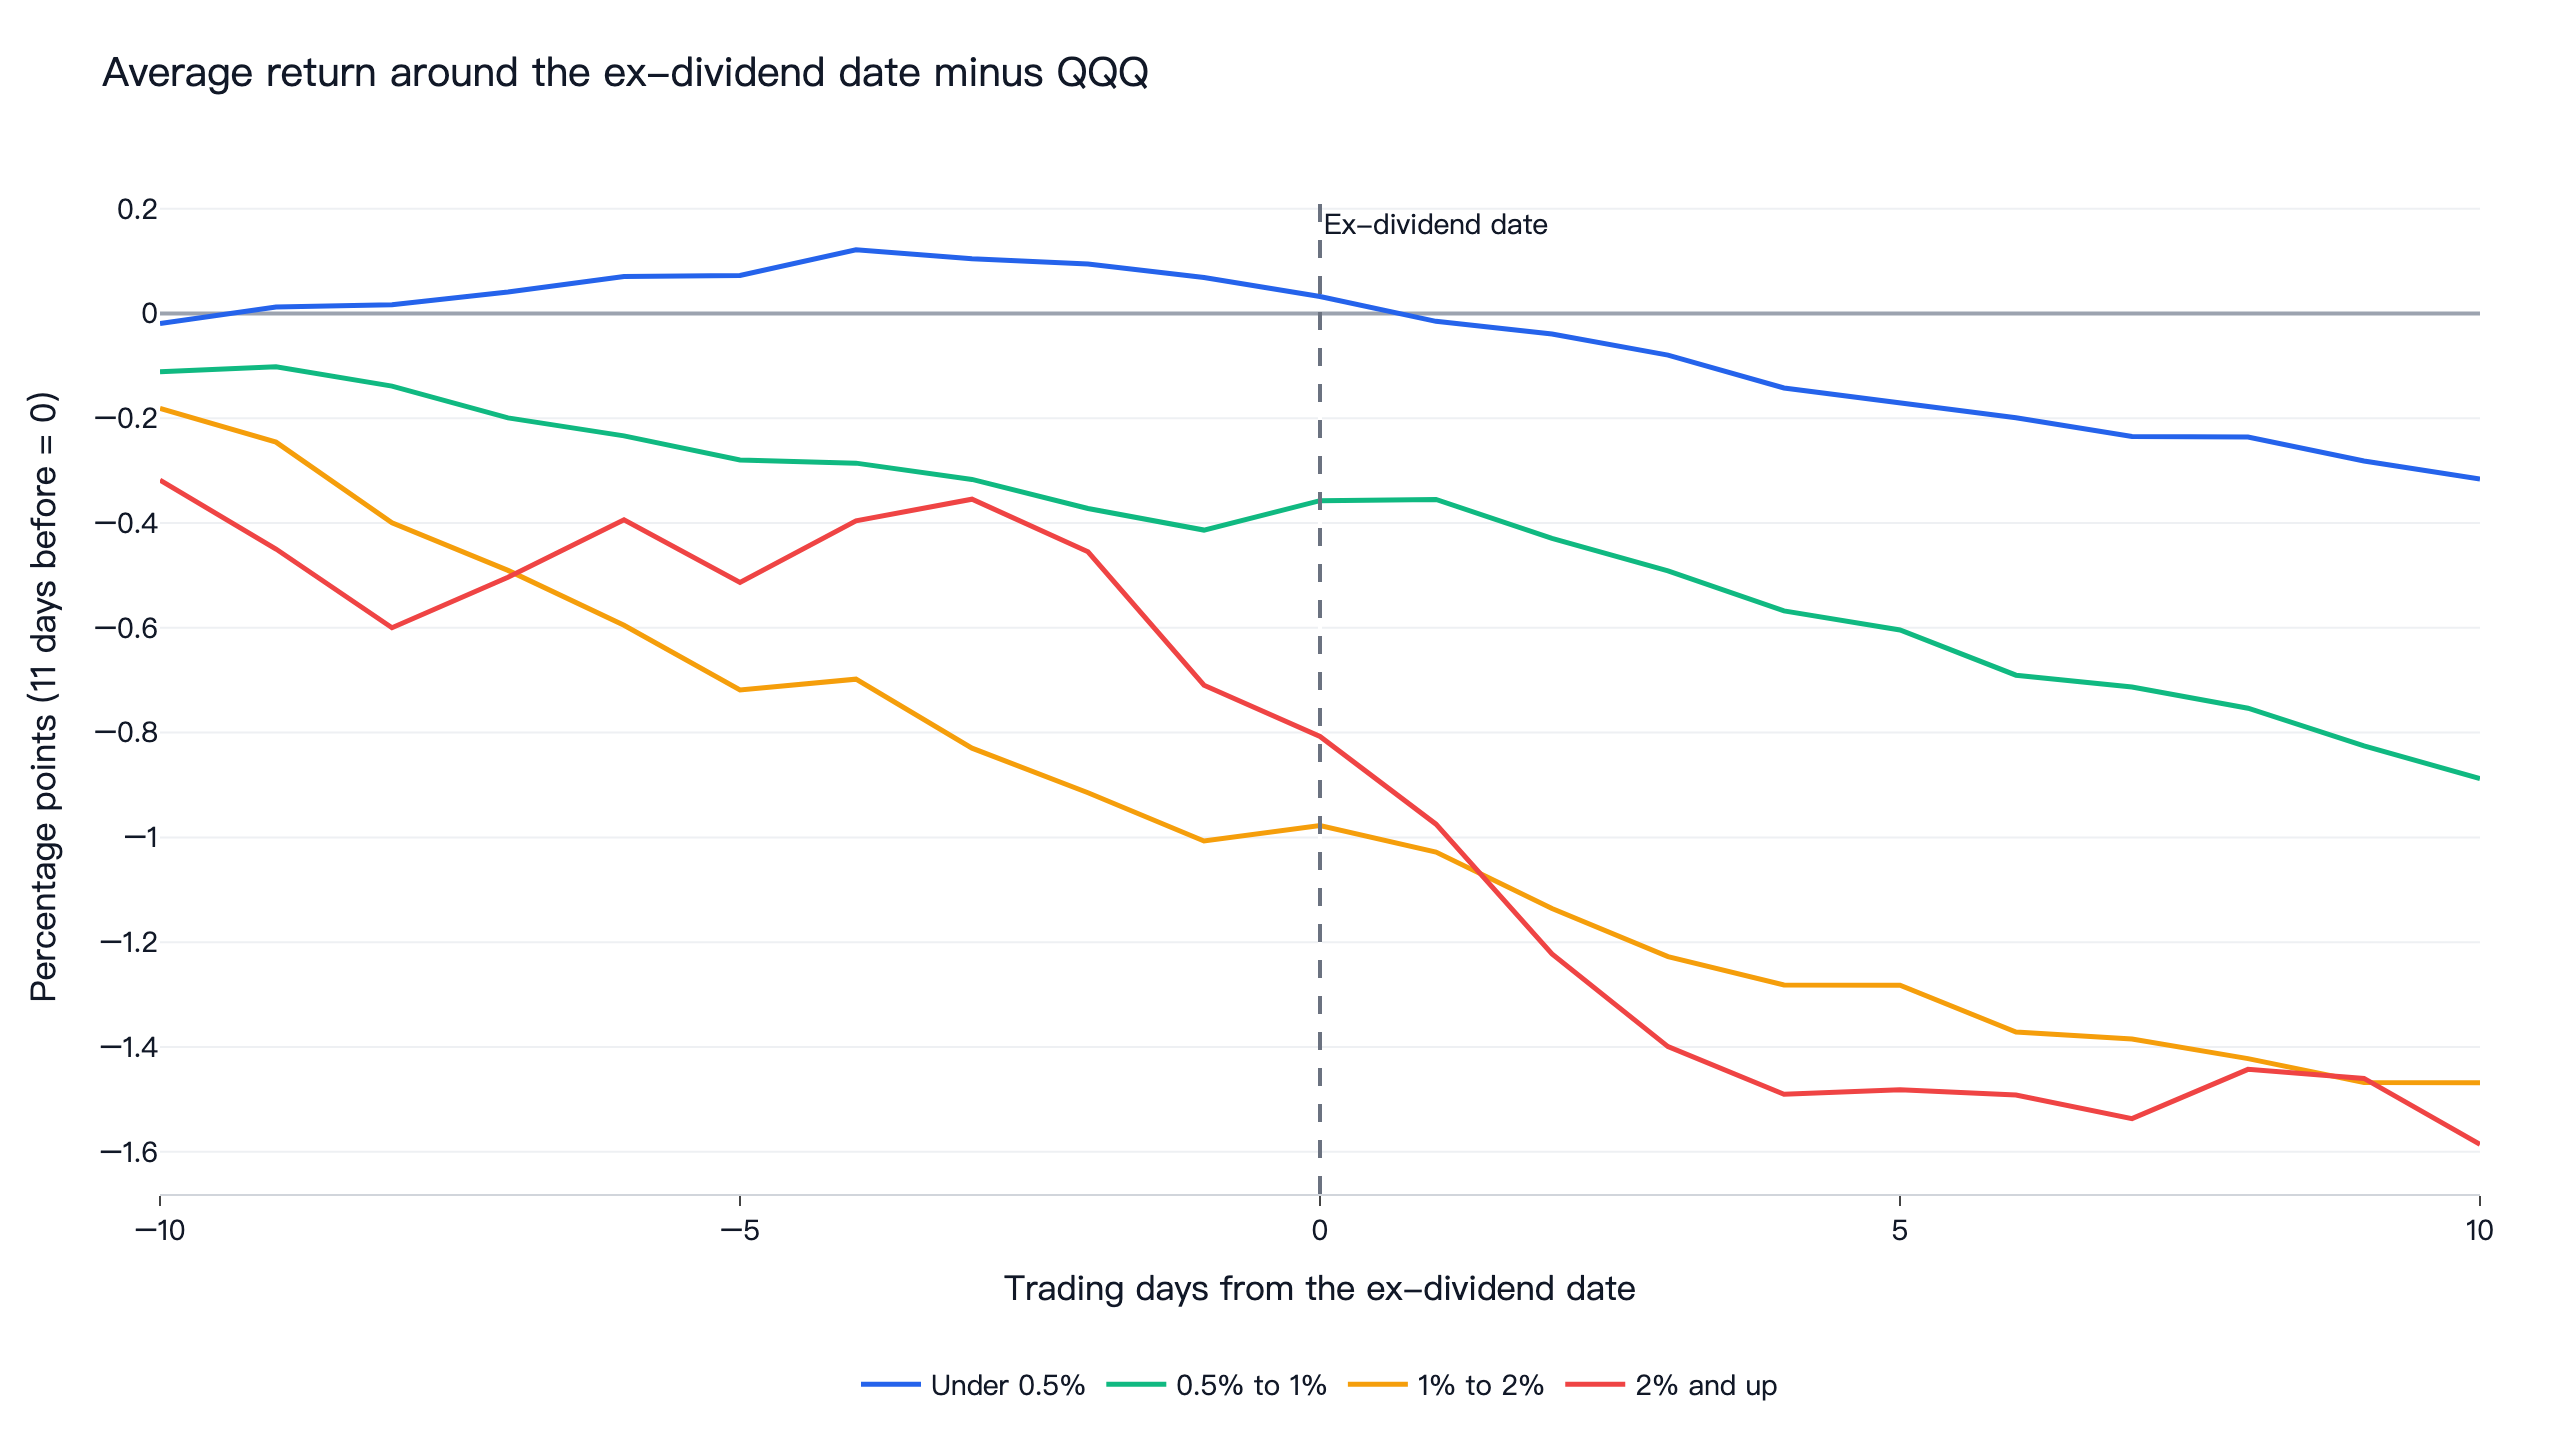
The path around the ex-date is flat to slightly falling for every bucket. Over the 20 trading days around the ex-date, stocks with payments above 1% end up behind QQQ by 1.5 to 1.6 percentage points, so there is no run-up to harvest and no rebound to wait for.
Taxes make it worse in the US
The backtest ignores tax, and for this trade the tax is large. In the US, ordinary dividends qualify for the lower long-term capital gains rate only if you hold the stock for more than 60 days within the 121-day period that begins 60 days before the ex-dividend date. A capture trade held for a few days never qualifies, so the dividend is taxed at ordinary income rates. For investors outside the US, the default withholding on US dividends is 30%, which a tax treaty may lower.
Take the average payments in two of the buckets. A 30% withholding on the 0.5%-to-1% bucket costs about 0.22% of the position per trade, and on the 1%-to-2% bucket about 0.39%. The average one-day returns before any cost or tax are 0.17% and 0.18%. Tax alone takes more than the whole edge, on the assumption that a real investor pays it. The equity curve at the top of this article is before tax, so the difference between it and a taxed version is the part the backtest cannot show you. An investor who pays no tax on dividends, in a tax-advantaged account for example, avoids this particular cost, but still pays the 0.2% round trip.
Why this is different from a dividend strategy
Holding dividend payers over the long run is a different trade. That is a bet on the companies that pay dividends. Capture is a bet on a one-day pricing gap and has almost none of the same return drivers. If you want the long-term version, see our dividend growth screen and the Dogs of the Dow backtest.
A related, slower effect exists. Hartzmark and Solomon (2013) document a dividend month premium: stocks tend to earn higher abnormal returns in months when a dividend is expected, and the effect fades after the ex-date. This test does not measure that premium over a whole month. In the path chart above, only the smallest payments rise against QQQ before the ex-date, by about 0.1 point.
The code
This is the original setting: buy three days before the ex-date, payments of at least 1%. On data through 2026-11-06 it prints a daily Sharpe of 0.75; the last digit can move as FinLab revises its data. The full research.py also runs the other eight settings, the cost runs and the ex-day study.
Show Code
import finlab
import numpy as np
import pandas as pd
from finlab import data
from finlab.backtest import sim

finlab.login()
data.set_market("us")
data.truncate_end = "2026-11-06"

LEAD_DAYS = 3
MIN_YIELD = 0.01

adj_close = data.get("us_price:adj_close")
raw_close = data.get("us_price:close")
volume = data.get("us_price:volume")
days = adj_close.index

# US common stocks, delisted ones included, one share class per company
profile = pd.DataFrame(data.get("us_company_profile")).astype({"stock_id": str}).drop_duplicates("stock_id")
keep = (
    (profile["security_type"] == "common_stock")
    & ~profile["is_etf"].fillna(False).astype(bool)
    & ~profile["is_fund"].fillna(False).astype(bool)
    & ~profile["is_adr"].fillna(False).astype(bool)
)
stocks = profile.loc[keep, ["stock_id", "company_name", "country"]].astype(str).sort_values("stock_id")
stocks = stocks.drop_duplicates("company_name")
stocks = stocks[stocks["stock_id"].isin(adj_close.columns)]
us_stocks = stocks.loc[stocks["country"].isin(["US", "nan"]), "stock_id"]
columns = sorted(stocks["stock_id"])

# Tradable on the day the signal is read: above $5, $20M a day, no +/-50% day in a year
dollar_volume = (raw_close * volume).rolling(60, min_periods=20).mean()
daily_return = adj_close.pct_change(fill_method=None)
wild = (daily_return.abs() >= 0.5).astype(float).rolling(252, min_periods=1).max().shift(1).fillna(0) > 0
tradable = (raw_close > 5) & (dollar_volume > 20e6) & ~wild
tradable = pd.DataFrame(tradable).reindex(index=days, columns=columns).fillna(False).astype(bool).values
close = pd.DataFrame(raw_close).reindex(index=days, columns=columns).values

# Every cash dividend with its ex-dividend date and declaration date
actions = pd.DataFrame(data.get("us_corporate_actions")).astype({"symbol": str})
dividends = actions[(actions["dividend"] > 0) & actions["symbol"].isin(us_stocks)]

holding = np.zeros((len(days), len(columns)), dtype=bool)
column_of = {symbol: i for i, symbol in enumerate(columns)}
ex_rows = np.searchsorted(days.values, pd.DatetimeIndex(dividends["date"]).values)

for symbol, ex, dividend, declared in zip(
    dividends["symbol"], ex_rows, dividends["dividend"], dividends["declaration_date"]
):
    col = column_of.get(symbol)
    signal = ex - LEAD_DAYS - 1          # read at this close, bought at the next close
    if col is None or signal < 0 or ex >= len(days):
        continue
    if pd.isna(declared) or declared > days[signal] or not tradable[signal, col]:
        continue                         # the dividend must be declared by the signal day
    if dividend / close[signal, col] >= MIN_YIELD:
        holding[signal:ex - 1, col] = True   # the last True day is ex - 2, so it is sold at the ex-date close

position = pd.DataFrame(holding, index=days, columns=columns).loc["2016-07-01":"2026-11-06"]
position = position.loc[:, position.any()]

report = sim(position, resample=None, position_limit=0.05, upload=False)
returns = report.creturn.pct_change().dropna()
print("Daily Sharpe:", round(returns.mean() / returns.std() * 252 ** 0.5, 2))
Install the FinLab skill for your AI agent
You do not need to write this yourself. Install the FinLab skill in Claude Code, Codex or Gemini CLI with one command:
Show Code
npx skills add koreal6803/finlab-ai --skill finlab -g -yThen ask your agent in plain language, for example "rerun dividend capture on S&P 500 members with 0.05% per side" or "test holding each dividend stock for one week after the ex-date". The agent setup page has the details, and FinLab Studio runs the same research in a browser.
Backtest method and limits
| Item | How it was handled |
|---|---|
| Window | 2016-07-01 to 2026-11-06. FinLab's US prices and dividend history start in January 2016, and the first months warm up the liquidity filter |
| Universe | US common stocks, delisted ones included, one share class per company, no ETFs, funds or ADRs, and no companies whose profile names a country other than the US |
| Liquidity | 60-day average of raw close times volume above $20M on the signal day, close above $5, no +/-50% day in the past year |
| Signals | The dividend must be declared on or before the signal day, so this rule uses only information available when you buy (look-ahead bias control). Payments with no declaration date in the source are excluded, about 16% of payments from 2016 to 2026 |
| Execution | Signal read at a close, traded at the next close; sold at the ex-dividend close |
| Weights | Equal weight, at most 5% per stock, rest in cash; the portfolio was 32% invested on average at the original setting. Turnover was 27.5 times a year one way on target weights |
| Cost | finlab sim() default US cost of zero, plus a rerun at 0.1% per side. Slippage is not estimated separately, and capacity is not estimated |
| Taxes | Not modelled. See the tax section |
| Sample | Whole window in-sample. The halves only check stability; no out-of-sample test was run |
What this result does and does not say
In this test, the ex-dividend day price drop is smaller than the dividend on average, so dividend capture trades had a positive gross return. It is small: the average one-day trade made 0.17% to 0.18% on payments between 0.5% and 2% of the price, before the market's return is removed and before costs or tax, and against QQQ's return that day no size group is reliably above zero. At a 0.1% per side commission, none of the nine settings beat QQQ, and the strategy's return fell well below that of holding SPY or RSP.
This is a test of liquid US stocks in one decade. A trader who can execute close to the midpoint at very low cost, for example with a broker that pays rebates, is closer to the zero-cost column. That column is still below QQQ in eight of nine settings. The table is the place to decide whether your own costs clear the hurdle.
For more results on US stocks, see the US corporate actions backtest, which covers dividend raises and initiations too, the covered call ETF comparison on income strategies, the low volatility stocks backtest and the US quant trading strategies overview. If you are new to rule-based investing, start with our quant trading guide.
FAQ
Does the dividend capture strategy work?
Before costs, on average, a little. Prices fell by less than the dividend on ex-dates in this sample, so a one-day trade around mid-sized payments made about 0.17% to 0.18%. At 0.1% per side, that gain is gone: the original setting returned 2.7% a year with a Sharpe ratio of 0.29.
How much does a stock price drop on the ex-dividend date?
In this sample the median drop was 76% to 93% of the dividend, depending on the size of the payment. Larger payments came closer to a full drop, and the very smallest ones (below 0.5% of the price) were 77% at the median.
Can you make money by buying the day before the ex-dividend date?
At zero cost, about 0.17% to 0.18% per trade on payments of 0.5% to 2%, only 0.03 to 0.06 points more than QQQ that day. With 0.1% per side, you lose money on average. The setting that bought one day before the ex-date with a 0.5% minimum yield scored 1.11 at zero cost and -0.51 at 0.1% per side.
Is dividend capture better than holding QQQ?
No. The zero-cost Sharpe ratio was 0.08 to 1.11 across the nine settings, with one setting above QQQ's 0.93. At 0.1% per side, every setting was below QQQ's 0.92, and the original setting returned 2.7% a year against QQQ's 20.0%.
What are the tax consequences of dividend capture?
The dividend from a trade held only a few days does not meet the holding period for qualified dividends in the US, so it is taxed as ordinary income. Non-US investors usually pay withholding tax on US dividends, 30% by default before treaty relief. This test does not include tax.
Does holding longer around the ex-date help?
Buying five days before the ex-date scored 0.54 to 0.78 at zero cost, and 0.18 to 0.43 at 0.1% per side, so it held up better after costs mainly because it trades less often for the same time in the market. It still stayed below QQQ.
Can I rerun this?
Yes. Install the FinLab skill through the AI-assisted setup, download research.py below and run python research.py.
Reproduce it yourself
- research.py: the full study, including all nine settings, both halves, the cost runs and the ex-dividend day measurements.
- data.csv: daily equity curves of the dividend capture rule at its original setting, plus QQQ, SPY and RSP.
- metrics.json: the statistics behind this article, including the yield buckets and the 9 settings.
Disclaimer: this article is for education only and does not constitute investment advice. Past performance does not guarantee future results, and investing involves risk. Nothing here recommends any individual stock, and this is not tax advice. All results are in-sample, and the two halves were not validated out of sample.
Last updated: 2026-11 | Backtest window: 2016-07 to 2026-11 | Data through 2026-11-06, run 2026-11-09 | Benchmark: QQQ total return | Author: FinLab Quant Research (reviewed by a quantitative researcher)
FinLab AI
Want to build your own strategy?
Describe your stock-picking ideas in natural language. AI automatically validates, backtests, and gives you answers
Start Free