Run this strategy
Copy the prompt to reproduce the evidence above with the article’s data, assumptions, and risk checks.
Tell your AI:
Set up FinLab and rerun the US corporate action event backtest. Please read: https://finlab.finance/en/setup?relatedUrl=/en/blog/us-corporate-actions-event-backtest
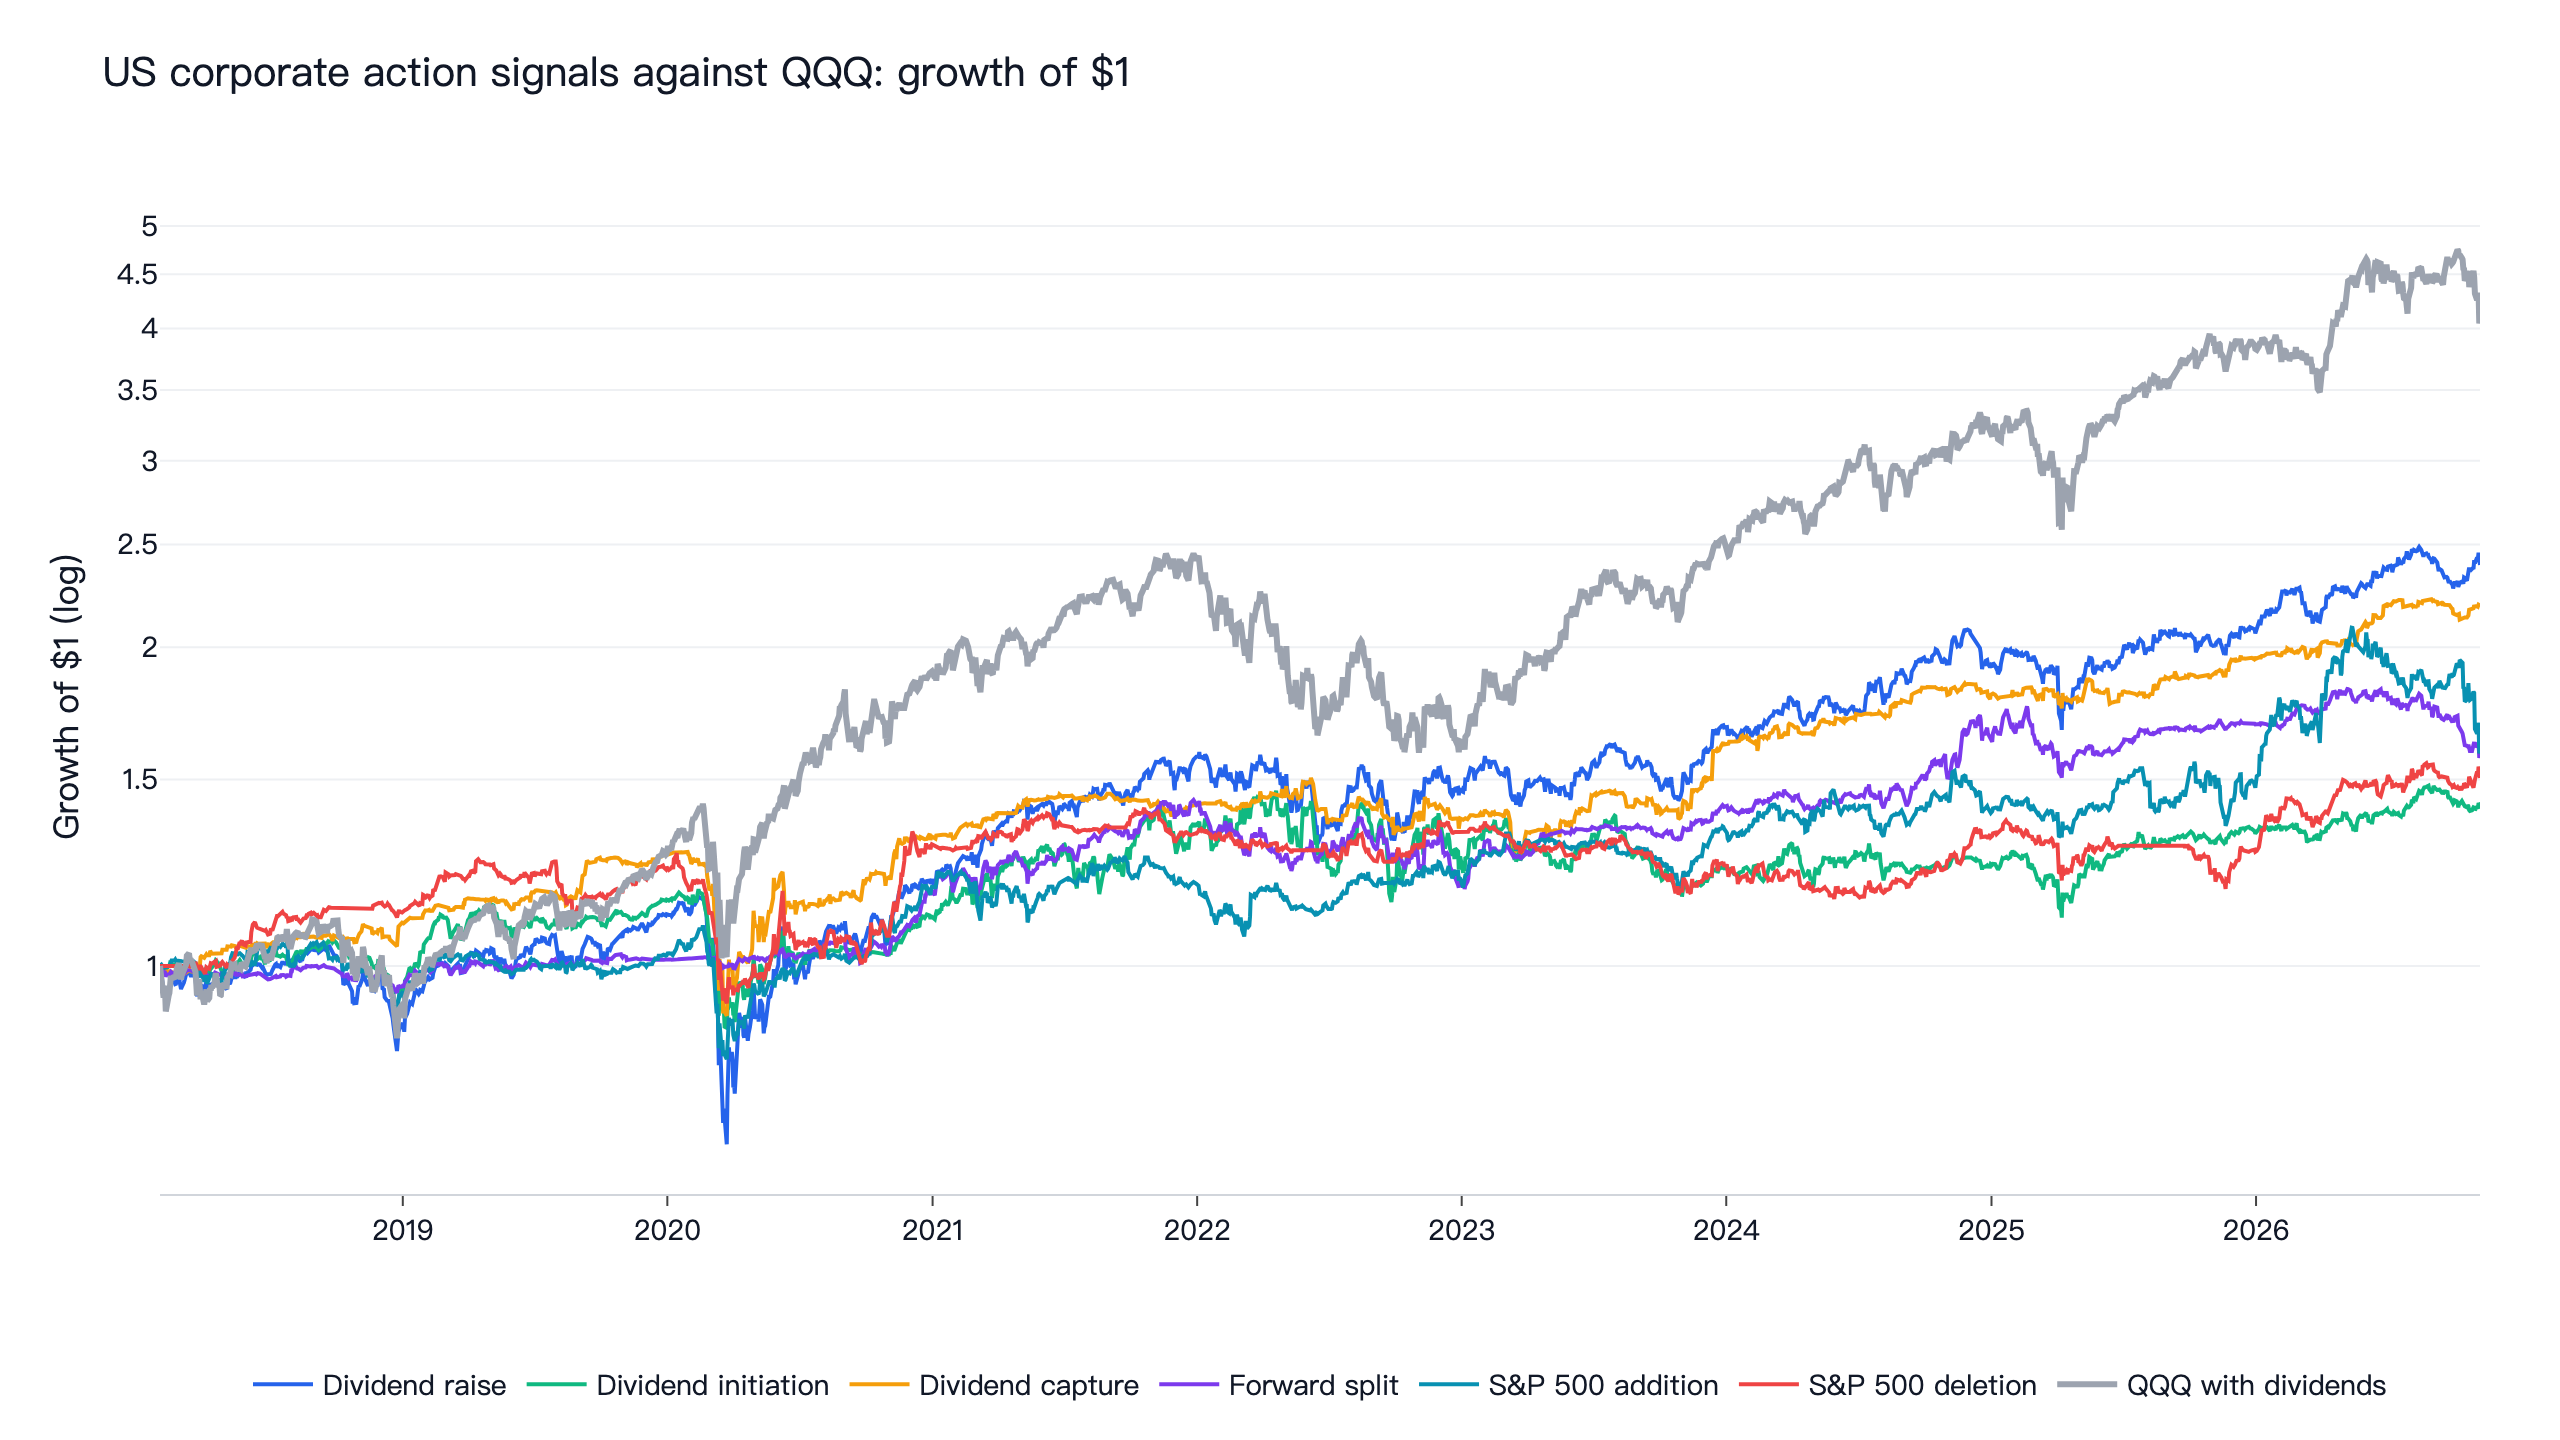
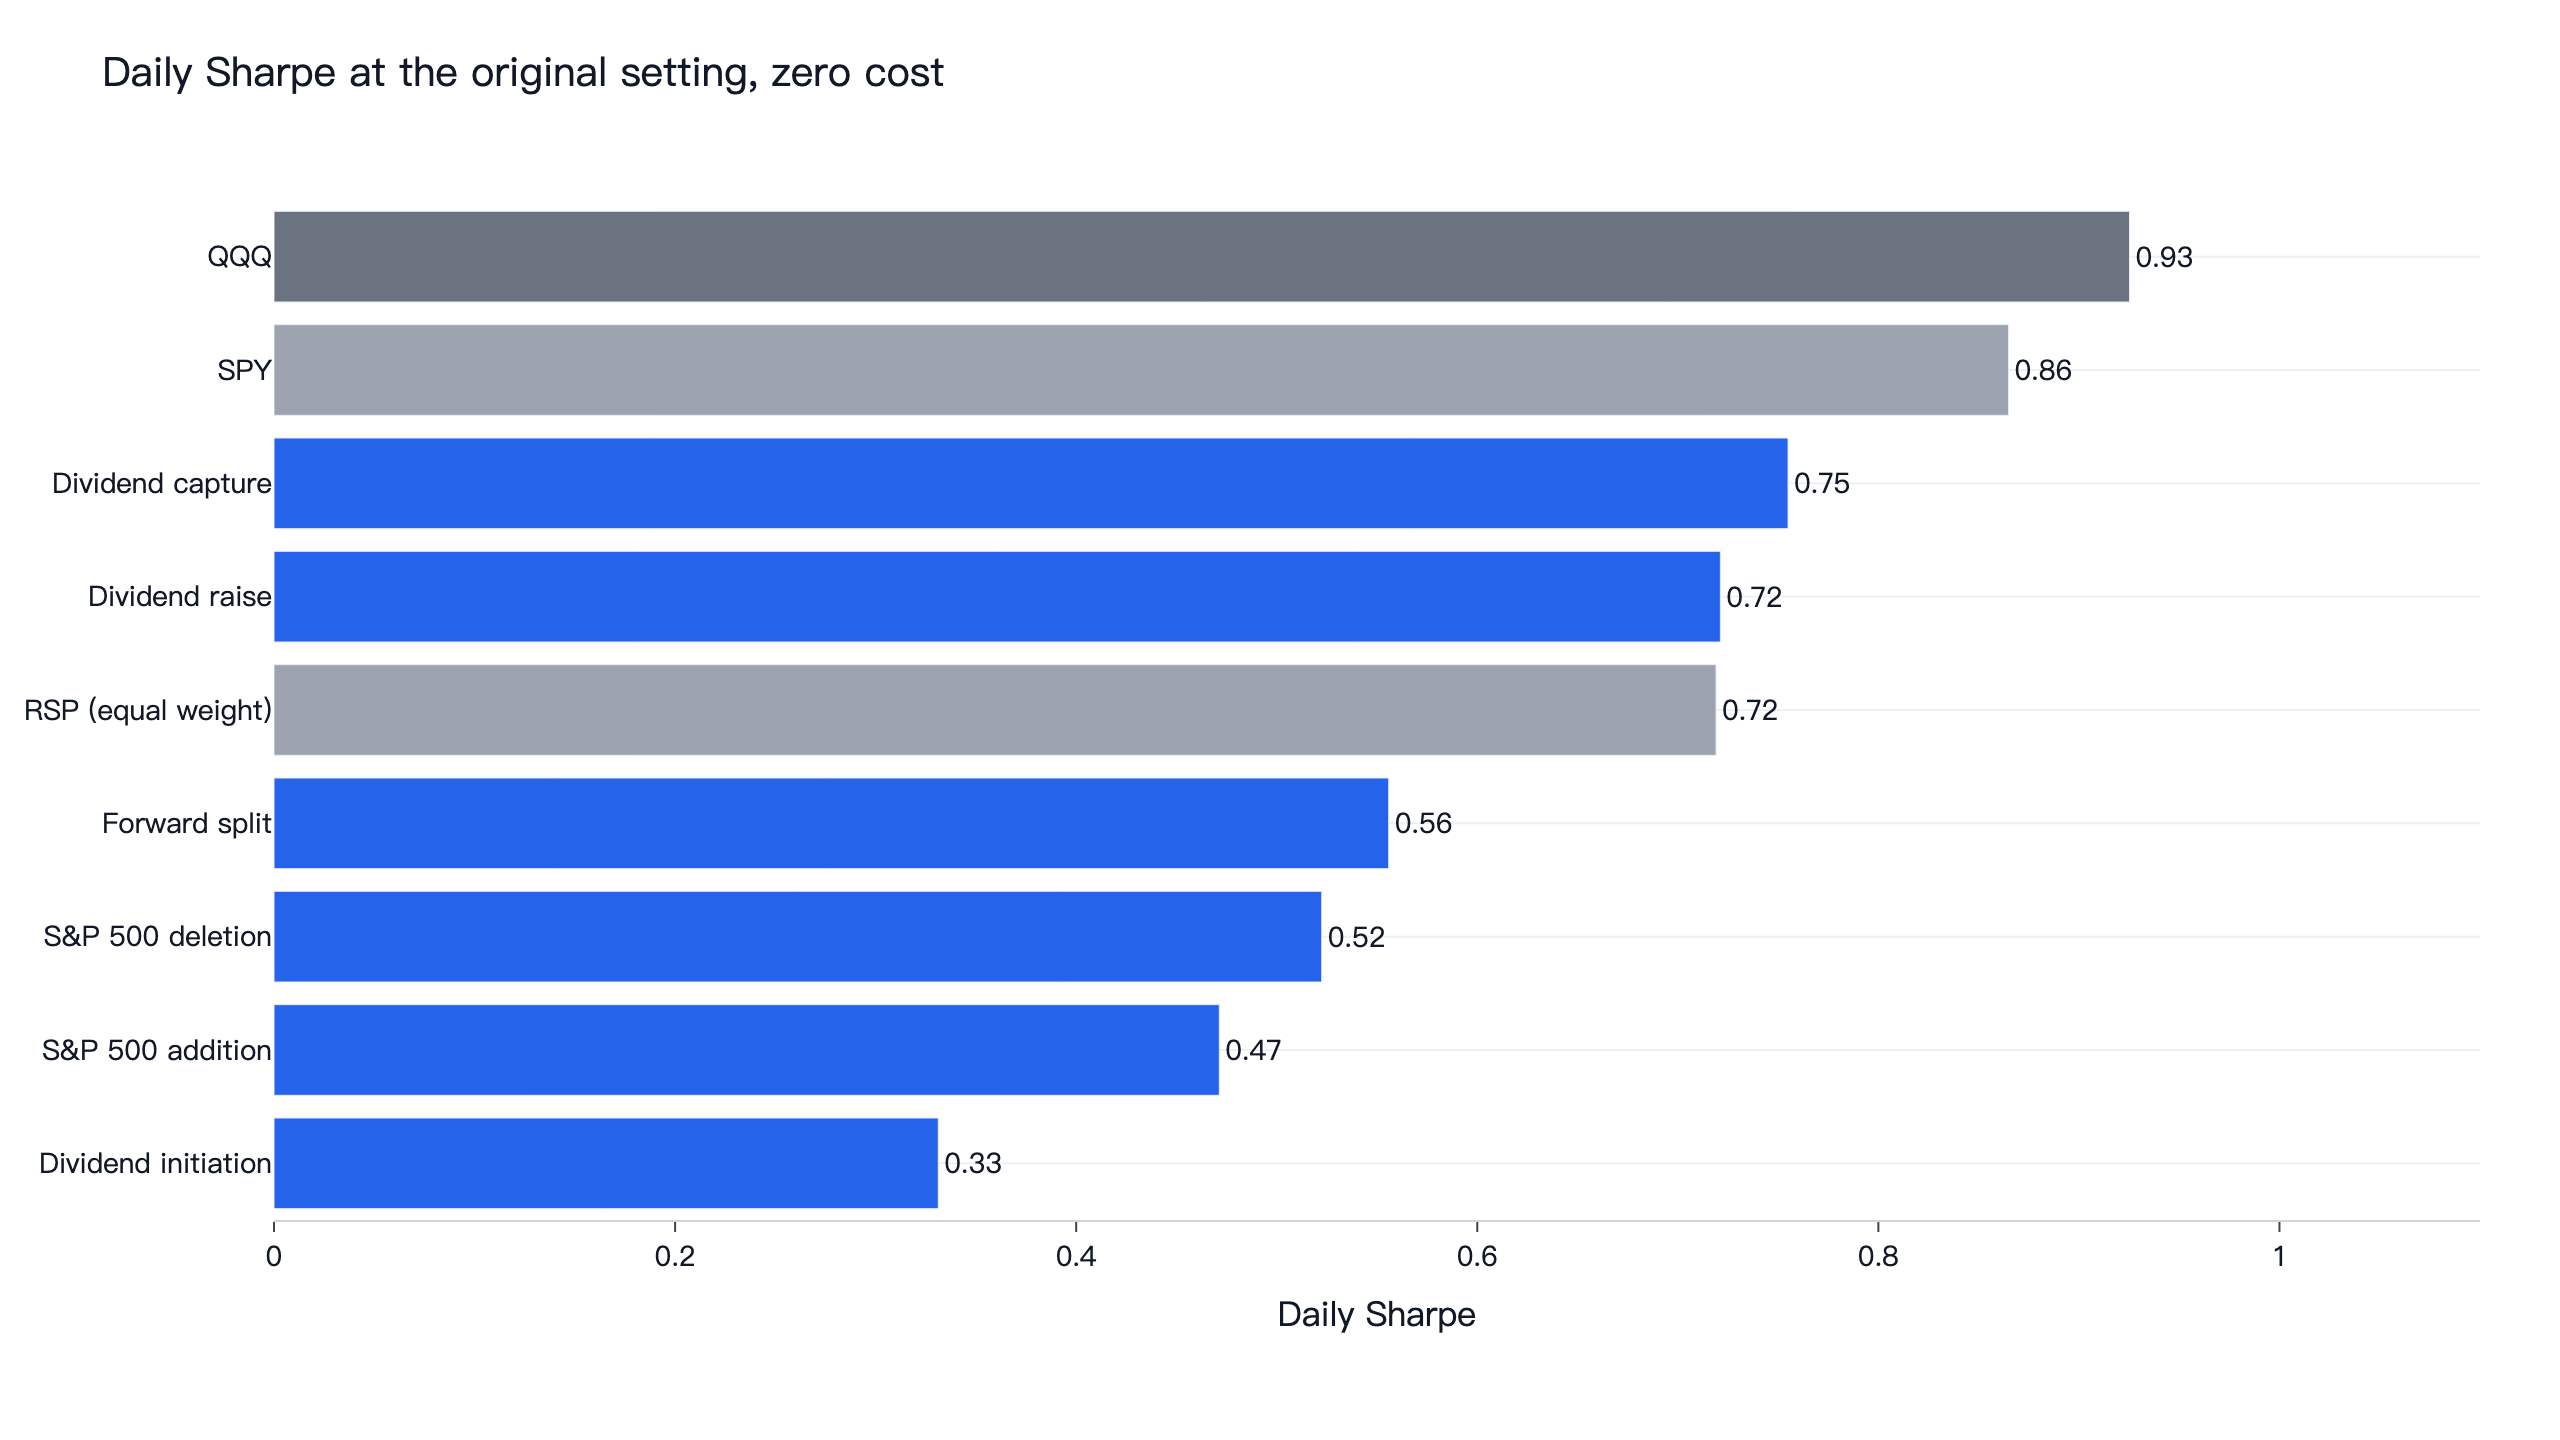
We turned six corporate actions into trading rules on US common stocks and tested them from July 2016 to November 2026: dividend raises, dividend initiations, dividend capture, forward stock splits, and joining or leaving the S&P 500. None beat QQQ with dividends reinvested. Dividend capture scored the highest daily Sharpe ratio at 0.75 against QQQ's 0.93, and fell to 0.29 at 0.1% per side. Dividend raises returned 12.4% a year with a Sharpe ratio of 0.72, the same risk-adjusted result as the equal-weight S&P 500 fund RSP and well behind QQQ's 20.0%. Of the 54 settings, one beat QQQ before costs, and at 0.1% per side it fell to -0.51.
Most of our US research ranks stocks on factors or times the market. Corporate actions are a different kind of signal: a dated event that the company or the index committee announces, with decades of academic work behind it. The question here is narrow and practical. If you buy after the event, on dates you could actually have known, is the result better than buying the Nasdaq 100?
Corporate action signals at a glance
| Signal | Original setting | Daily Sharpe | CAGR | Max drawdown | Beat QQQ | First / second half Sharpe | Sharpe at 0.1% per side | Sharpe above BIL |
|---|---|---|---|---|---|---|---|---|
| Dividend raise | 120 days, $20M | 0.72 | 12.4% | -41.6% | 0 / 9 | 0.79 / 0.64 | 0.68 | 0.60 |
| Dividend initiation or resumption | 120 days, $5M | 0.33 | 4.1% | -26.0% | 0 / 9 | 0.41 / 0.24 | 0.31 | 0.17 |
| Dividend capture | 3 days before, 1% yield | 0.75 | 8.6% | -30.1% | 1 / 9 | 0.70 / 0.86 | 0.29 | 0.57 |
| Forward split | 120 days, $20M | 0.56 | 5.0% | -17.6% | 0 / 9 | 1.01 / 0.32 | 0.54 | 0.33 |
| S&P 500 addition | 60 days, 10% limit | 0.47 | 6.0% | -25.3% | 0 / 9 | 0.57 / 0.39 | 0.44 | 0.32 |
| S&P 500 deletion | 60 days, 10% limit | 0.52 | 5.4% | -27.9% | 0 / 9 | 0.79 / 0.20 | 0.50 | 0.32 |
| QQQ, total return | benchmark | 0.93 | 20.0% | -35.1% | 1.27 / 0.60 | 0.92 | 0.83 | |
| SPY, total return | reference | 0.86 | 14.8% | -33.7% | ||||
| RSP, equal-weight S&P 500 | reference | 0.72 | 12.0% | -39.0% |
QQQ, SPY and RSP are shown for 2016-07-05 to 2026-11-06. The first event for dividend initiations falls in January 2018 and the deletion rule makes its first trade in November 2016, and each is compared with QQQ over its own dates (QQQ's Sharpe is 0.79 and 0.91 there). The dollar figure in each setting is the minimum average daily trading value.
The six corporate action rules
- Dividend raise. A company raises its regular dividend per share by more than 1% over its previous regular payment, split-adjusted. Hold for 60, 120 or 240 trading days, in stocks trading at least $5M, $20M or $50M a day.
- Dividend initiation or resumption. A company pays a dividend after two years without one, and has at least two years of prices. Hold for 60, 120 or 240 days, in stocks trading at least $1M, $5M or $20M a day. Initiations are rare, so this rule uses a lower liquidity floor.
- Dividend capture. Buy 1, 3 or 5 trading days before the ex-dividend date and sell at the ex-dividend close, for payments of at least 0.5%, 1% or 2% of the price. Details are in the dividend capture strategy backtest.
- Forward split. A split of at least 3-for-2 (a split factor of 1.5 or more). Hold for 60, 120 or 240 days, in stocks trading at least $5M, $20M or $50M a day.
- S&P 500 addition and deletion. Two separate rules that buy a stock when it joins or leaves the index. Hold for 20, 60 or 120 days, with at most 5%, 10% or 20% of the account in one stock. Details are in the S&P 500 additions backtest.
Each rule is a 3 × 3 grid, and the middle cell is the original setting. The grid was written down before any result was seen. Stocks are held at equal weight, at most 5% each unless the grid says otherwise, so the rest is cash when fewer than 20 stocks qualify.
Dates are the hard part of an event study
A corporate action is only useful if you knew about it. The rules date each event by what was public at the time.
| Event | Date used | Why it matters |
|---|---|---|
| Dividend | The declaration date, or the ex-dividend date when the source has none | Coverage of declaration dates is about 80 to 90% of payments in the source. The source's key_date field is a 2026 backfill time, so it cannot be used as the date a dividend became known |
| Forward split | The split date | The source has no announcement date, so the rule cannot trade the announcement itself |
| S&P 500 change | The day the list was observed | Before November 2022 the snapshots are a median of 8 days apart, so this date can lag the real announcement by weeks |
Three cleanups mattered. Dividends in the source are not split-adjusted (Apple paid $0.82 and then $0.205 after its 4-for-1 split in 2020), so amounts are converted with the source's split factors before comparing. Special dividends are removed from the raise baseline: a payment within 20 days of the last one, or at least twice the median of the last four regular ones, does not count as a raise. Ticker changes such as Fiserv's FISV to FI are not real additions, and neither are list edits reverted within a week, so we dropped 32 such pairs from the S&P 500 list. Without that step the addition rule scores 0.41 instead of 0.47.
The stock universe is common stocks, delisted ones included, one share class per company, with no ETFs, funds or ADRs. On the day of the event a stock must close above $5 and have no +/-50% day in the past year, with average daily trading value computed from the raw close. The adjusted close would inflate the trading value of stocks that later did a reverse split. Companies whose profile names a country other than the US are left out of the dividend and split rules, because their dividends are translated into dollars and an unchanged payment can look like a raise.
How a rule had to pass
"Beat" means a higher daily Sharpe ratio than QQQ with dividends reinvested over exactly the same days, with no risk-free rate subtracted. All of these conditions were fixed before any result was seen.
- Neighbouring settings. At least 7 of the 9 settings had to beat QQQ.
- Both halves. The original setting had to win in each half of its window.
- Costs. It had to win at finlab's default US cost of zero and at 0.1% per side.
- Cash. It had to win on returns above T-bills (BIL), because some rules sit largely in cash.
- No single year. It had to stay ahead after removing the calendar year of its largest lead over QQQ.
Every rule failed all five. The only setting of the 54 to beat QQQ was dividend capture bought one day before the ex-date with a 0.5% floor, at a Sharpe ratio of 1.11 before costs.
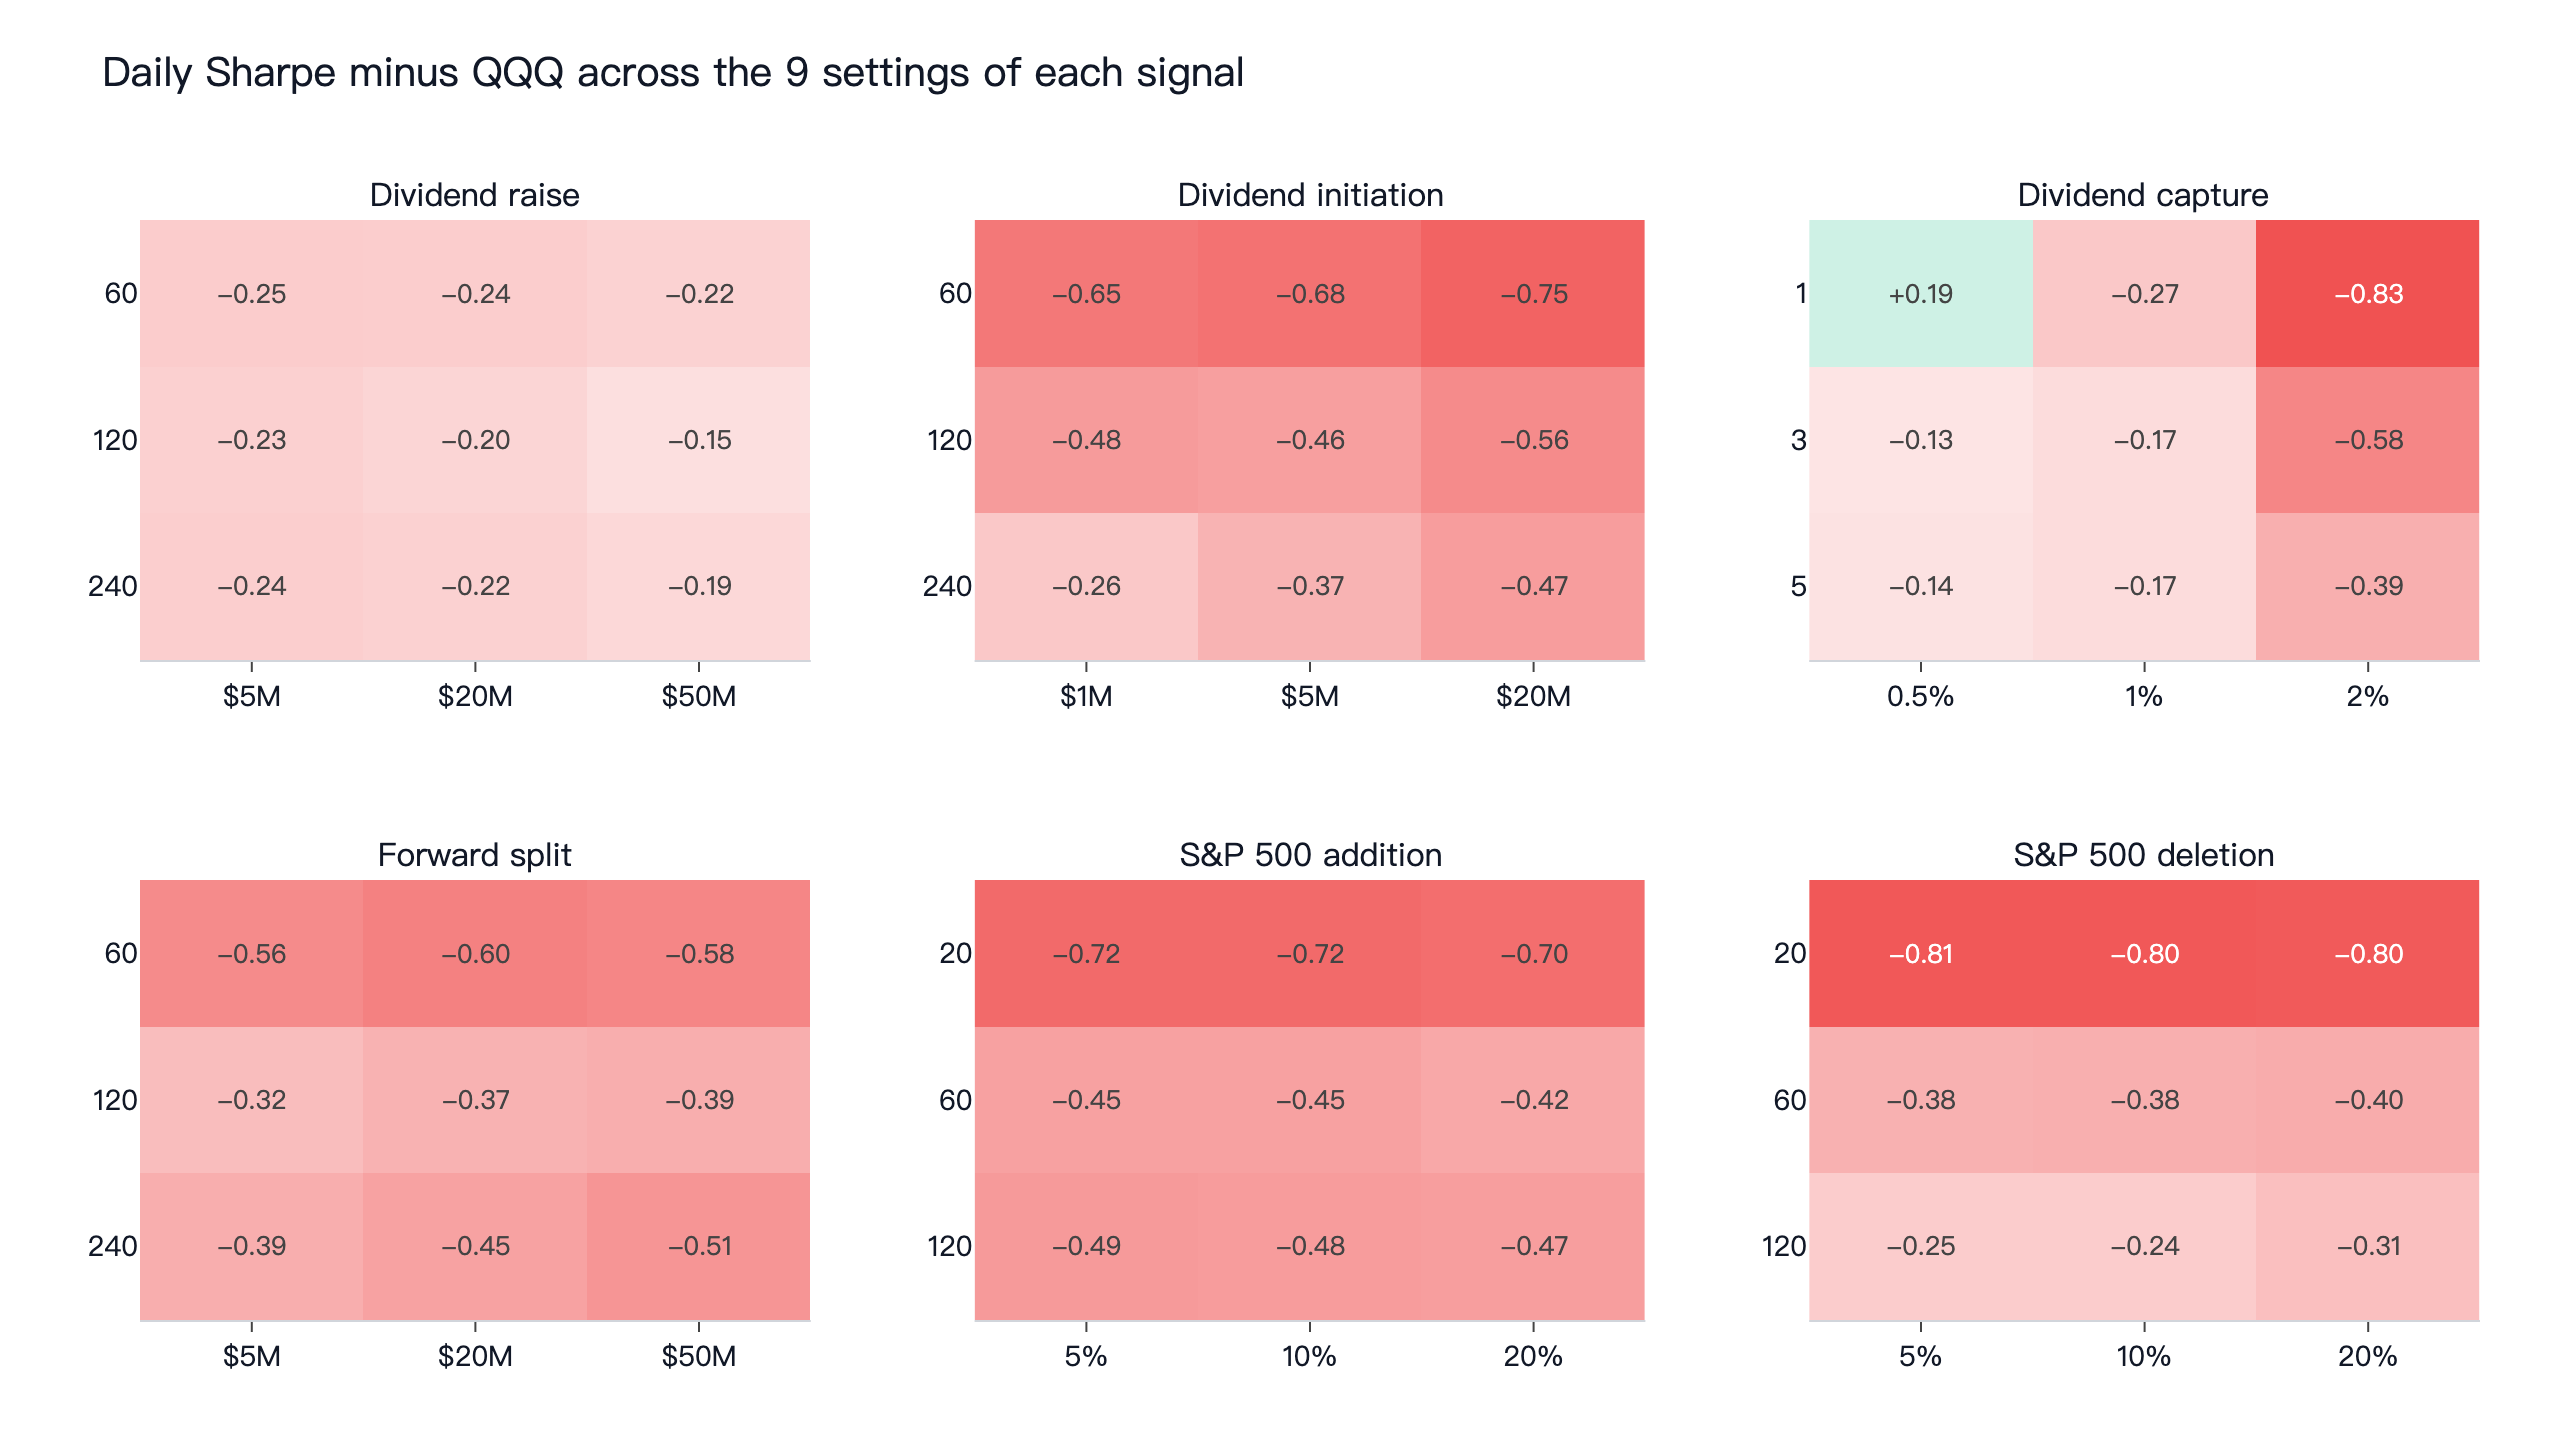
Each panel is one rule. Rows are holding days (for capture, days bought before the ex-date), and columns are the second parameter: liquidity, minimum yield or the weight limit. All but one of the 54 cells are below QQQ.
Dividend raises: a broad portfolio that matched RSP
The dividend raise rule held 256 stocks on average and was always fully invested. With that many names, it behaved like an equal-weight portfolio of large and mid-cap dividend payers: a Sharpe ratio of 0.72 against RSP's 0.72, and 12.4% a year against 12.0%. Its maximum drawdown of -41.6% was deeper than RSP's -39.0%. Costs barely mattered at 3.1 times a year of one-way turnover, with the Sharpe ratio moving from 0.72 to 0.68 at 0.1% per side.
The event itself did not add anything measurable against QQQ. Over the next 120 trading days the average raise trailed QQQ by 4.87 percentage points, and only 38.6% of them finished ahead. The 5,828 raises in the sample are spread across most of the market's dividend payers, so the comparison is mostly dividend payers against the Nasdaq 100. Benartzi, Michaely and Thaler (1997) found that dividend increases said more about past earnings than about future earnings growth, which fits a signal that arrives after the good news. A related comparison is our dividend growth screen in the famous stock screens backtest, which requires three straight years of raises.
Dividend initiations and resumptions
There were 220 initiations in stocks trading at least $5M a day from 2018. The portfolio held about 12 stocks and was 58% invested on average, so it was often partly in cash. It returned 4.1% a year with a Sharpe ratio of 0.33, and the first and second halves scored 0.41 and 0.24 against QQQ's 0.57 and 1.06.
Michaely, Thaler and Womack (1995) found that prices kept drifting up after dividend initiations. Here the average return was ahead of QQQ by 0.77 percentage points after 20 days and behind by 3.94 after 120 days, with only 37.1% of events ahead at 120 days. With 220 events the short-horizon figures are within noise, and this sample covers a very different market from theirs.
Forward splits: no drift left
The rule held about seven stocks and was 37% invested on average. It scored 1.01 in the first half against QQQ's 1.27, and 0.32 in the second half against 0.60. Ikenberry, Rankine and Stice (1996) and Desai and Jain (1997) reported positive abnormal returns in the year or more after splits. In this sample the average split trailed QQQ by 1.61 percentage points over 120 days and 6.29 over 240 days. The median event was further behind, at -5.19 points over 120 days, because a handful of large winners pulled the average up.
What the events do on average
| Signal | Events | 1 day | 5 days | 20 days | 60 days | 120 days | 240 days | Share above QQQ at 120 days |
|---|---|---|---|---|---|---|---|---|
| Dividend raise | 5,828 | +0.01% | -0.10% | -0.68% | -2.41% | -4.87% | -10.39% | 38.6% |
| Dividend initiation or resumption | 220 | -0.14% | +0.39% | +0.77% | -1.76% | -3.94% | -9.09% | 37.1% |
| Forward split | 164 | -0.33% | -0.11% | -0.18% | -1.43% | -1.61% | -6.29% | 41.7% |
| S&P 500 addition | 201 | -0.02% | +0.39% | -0.71% | -1.09% | -0.85% | -9.98% | 36.4% |
| S&P 500 deletion | 119 | +0.09% | -0.04% | -1.24% | -0.76% | +0.45% | -5.90% | 44.5% |
Returns start at the trade date, the day after the signal, and are measured against QQQ over the same days. Events without enough later prices drop out of the longer columns.
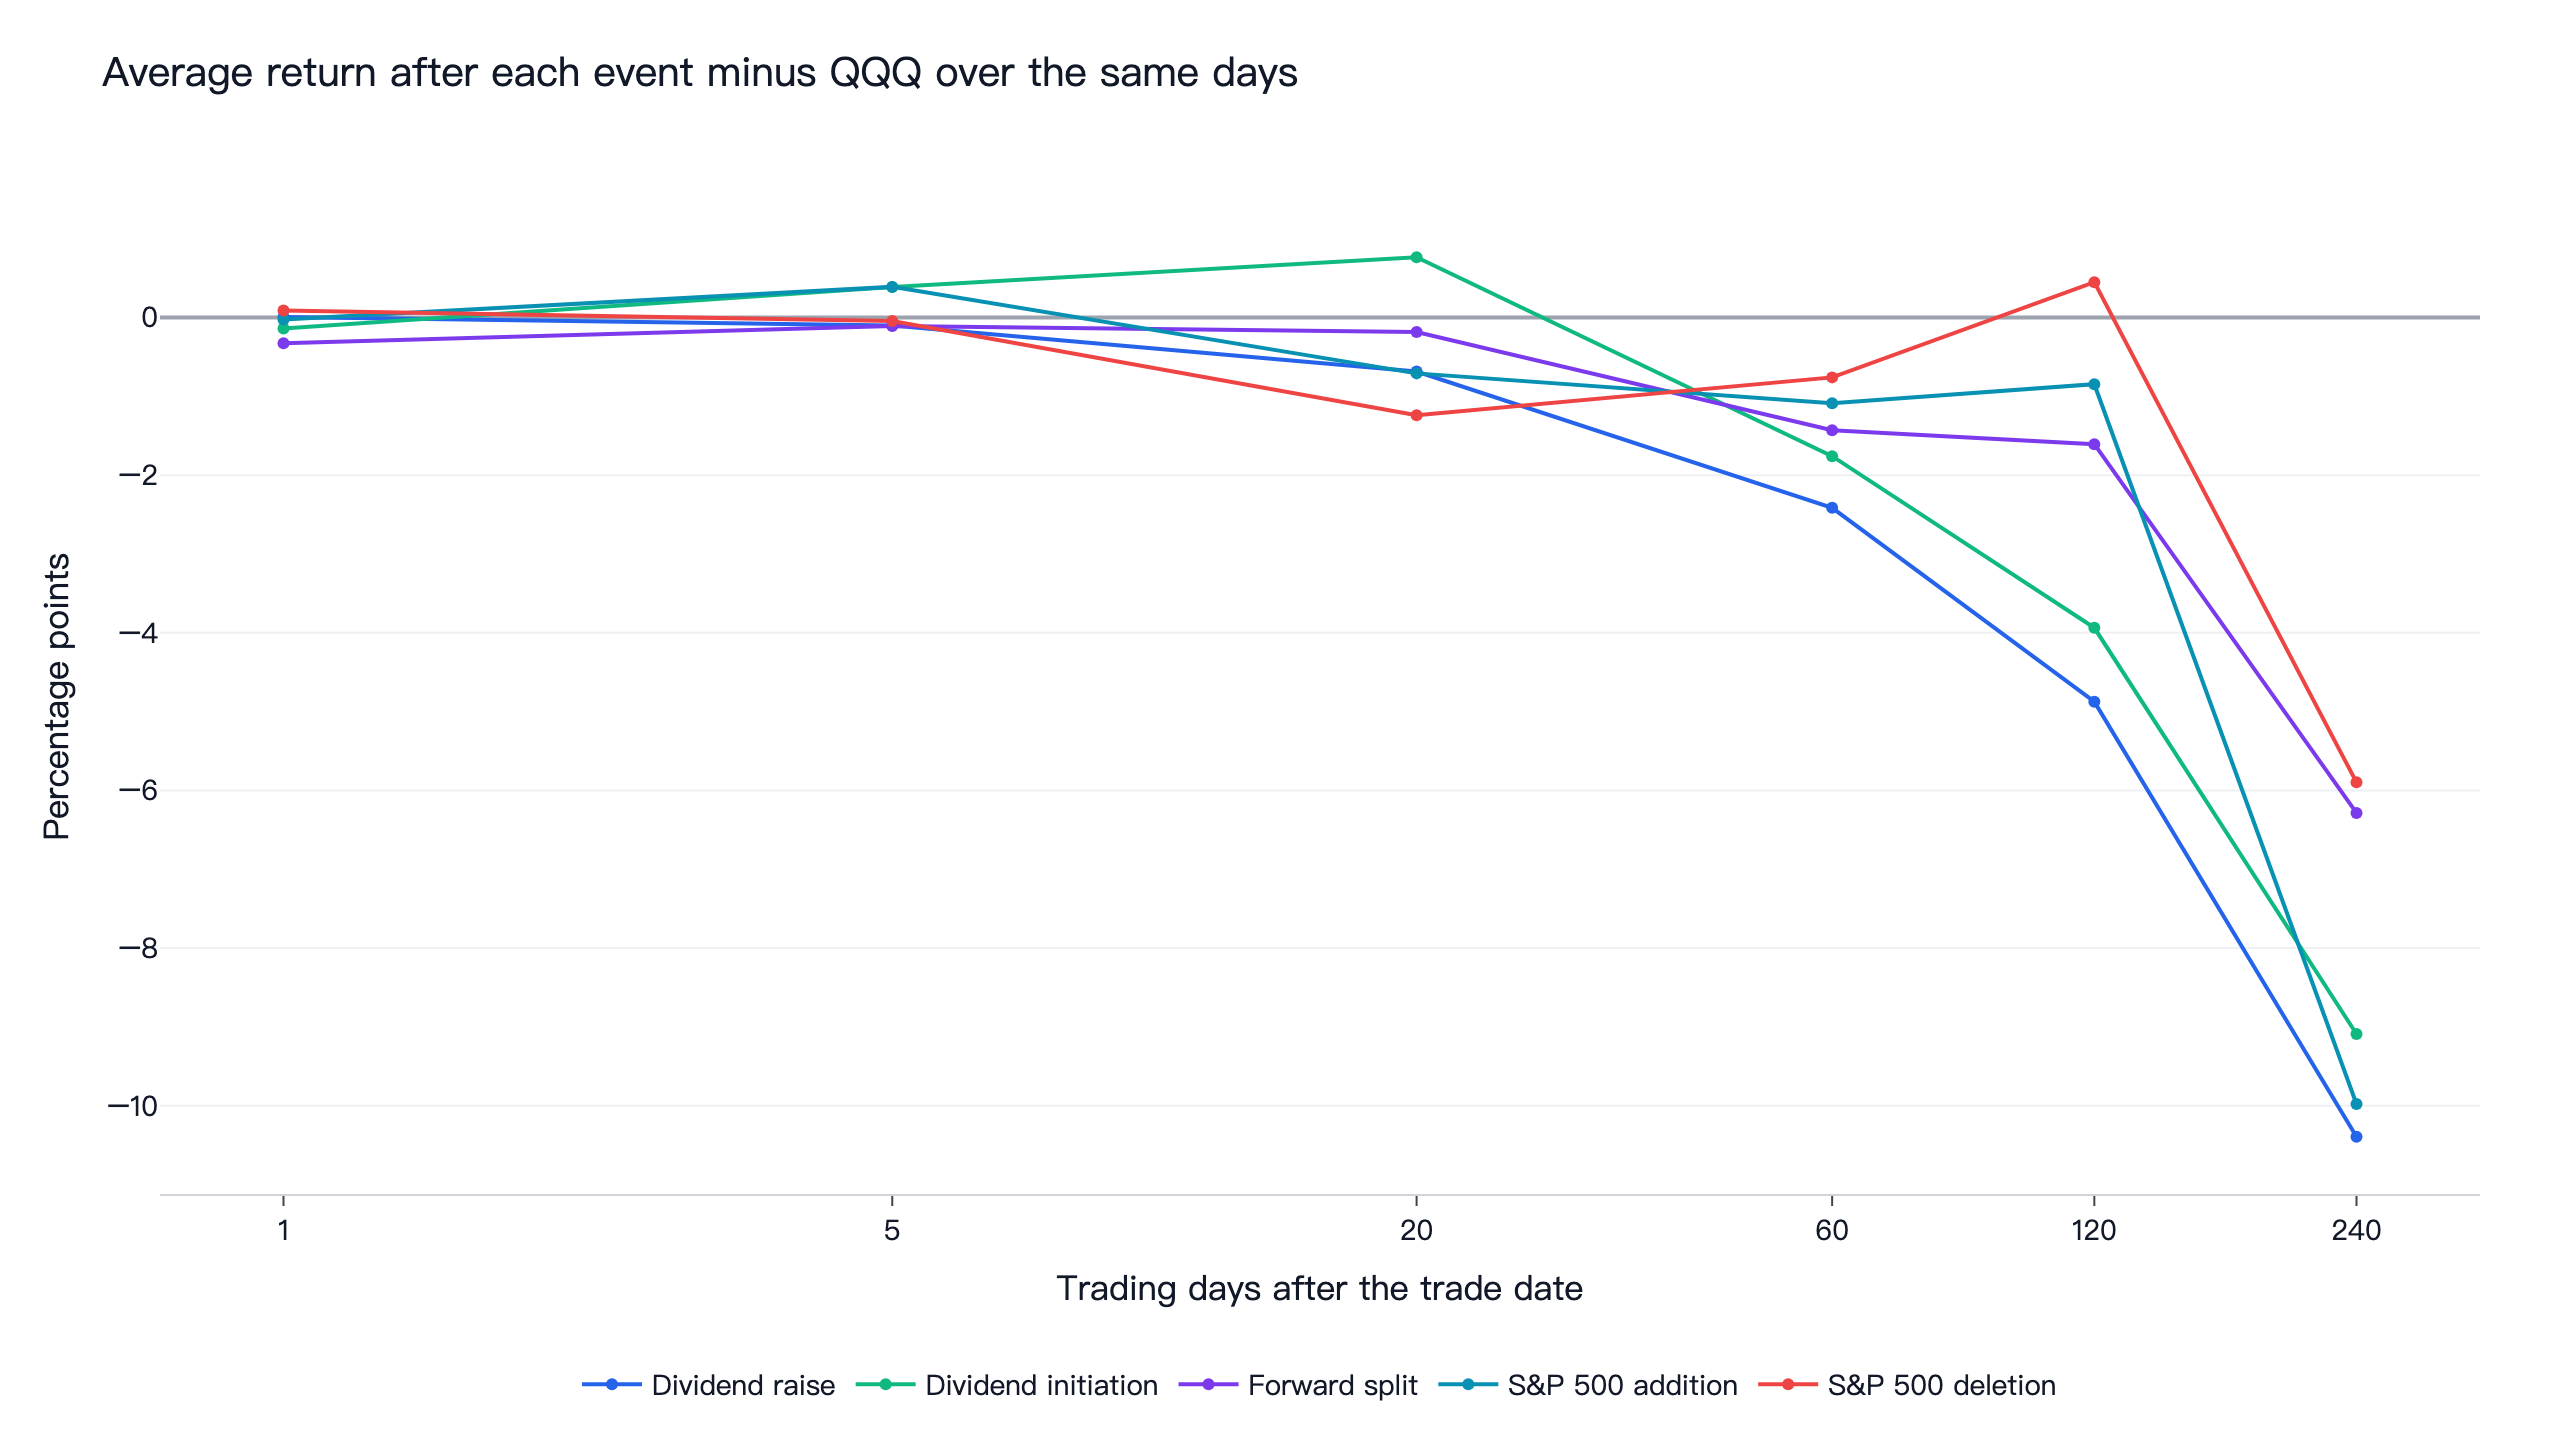
Two things show up in the table. First, the numbers are small for the first week and then lean negative, so nothing resembles the drifts in the older papers. Second, QQQ sets a high bar: it returned 20.0% a year, and at 240 days only 32% to 38% of the events in each row were ahead of it.
Why 2022 shows the largest lead for all six
The calendar year of the largest lead over QQQ was 2022 for every one of the six rules. QQQ lost 32.6% that year, while these portfolios lost much less or ended roughly flat. Take that year out and QQQ's Sharpe ratio rises from 0.93 to 1.26, while dividend raises rise from 0.72 to 0.85. The rules trailed in the years when QQQ rose quickly, and those years were most of the decade.
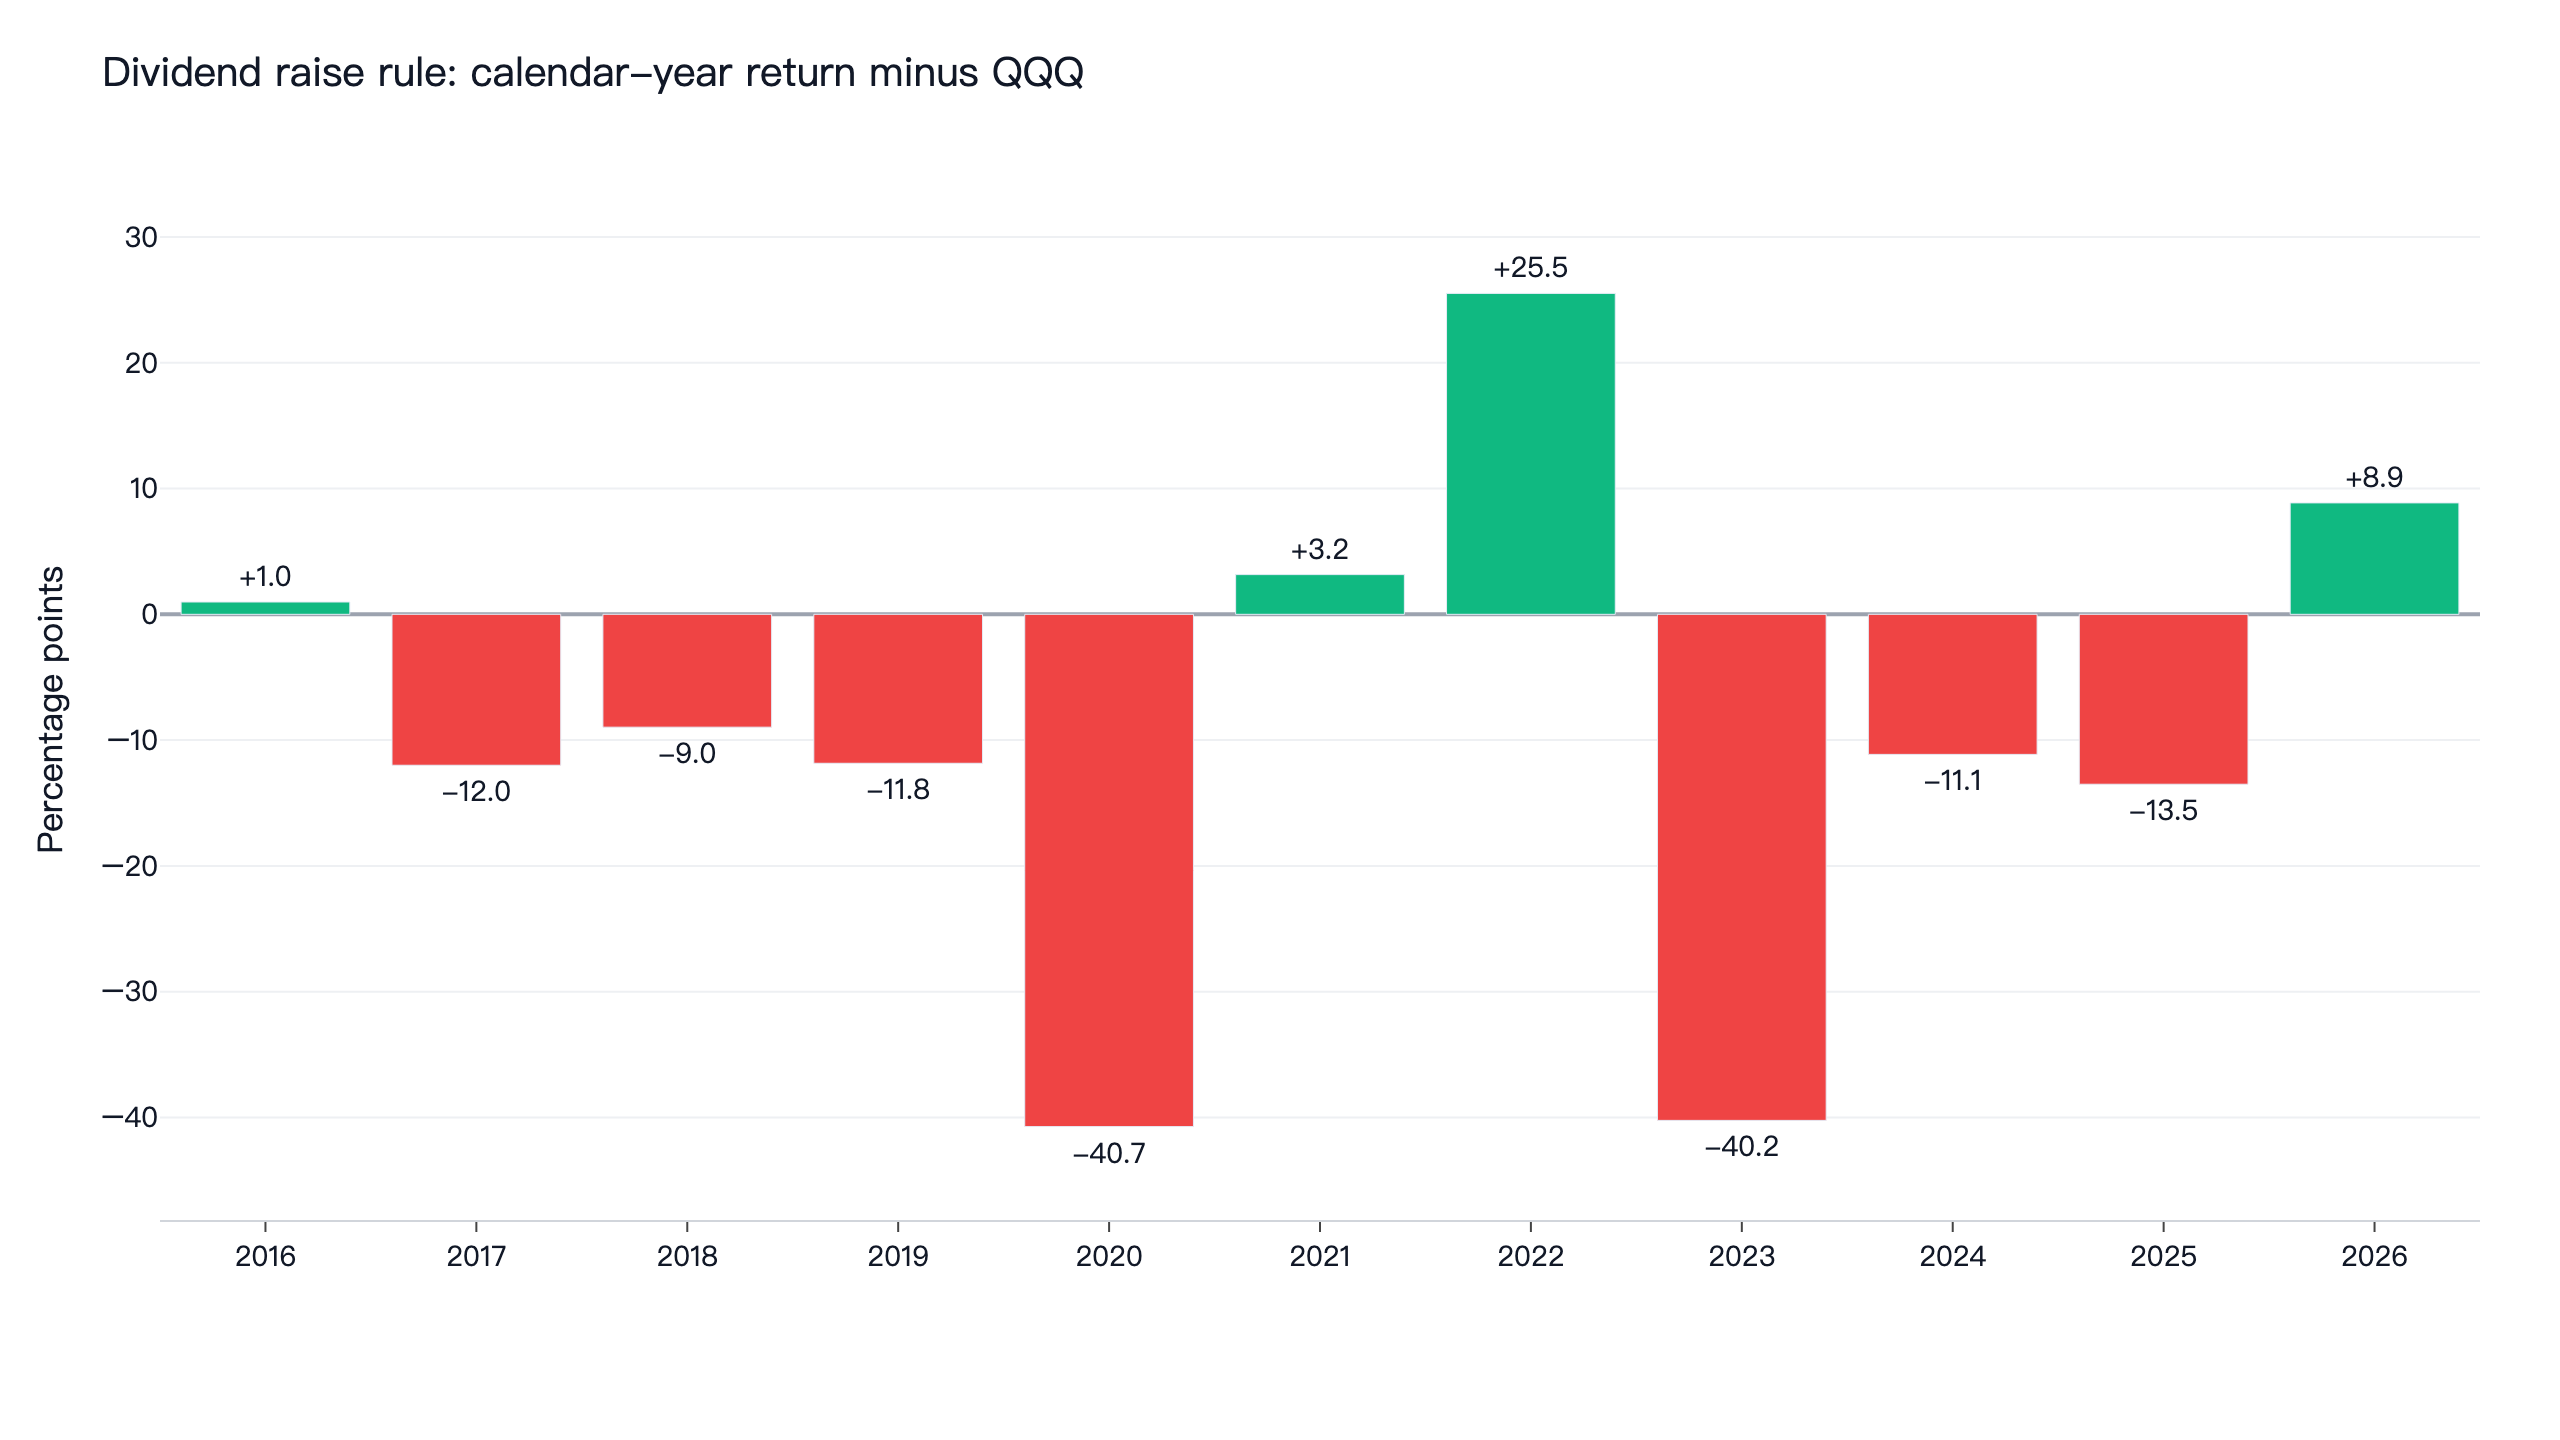
The second half of the sample was closer. QQQ's Sharpe ratio fell from 1.27 to 0.60, and dividend raises (0.64) and dividend capture (0.86) beat it there. Neither won the first half, so neither passes the halves check. A rule that works only in one half is exactly what the check is meant to catch.
Dividend capture and index changes: separate articles
Dividend capture and S&P 500 changes have enough of their own to explain, so each has its own page. In short:
- The dividend capture strategy backtest finds that prices fell by less than the dividend on the ex-date, worth about 0.17% to 0.18% a trade before costs on payments of 0.5% to 2%, smaller than a 0.2% round trip.
- The S&P 500 additions backtest finds that additions had already gained about 5.2 percentage points on QQQ in the 20 days before the observed date, and gave most of that back by 120 days after it.
The code
This is the forward split rule, the shortest of the six. On data through 2026-11-06 it prints a daily Sharpe of 0.56; the last digit can move as FinLab revises its data. research.py runs all six rules, the 54 settings and the five checks.
Show Code
import finlab
import numpy as np
import pandas as pd
from finlab import data
from finlab.backtest import sim

finlab.login()
data.set_market("us")
data.truncate_end = "2026-11-06"

adj_close = data.get("us_price:adj_close")
raw_close = data.get("us_price:close")
volume = data.get("us_price:volume")
days = adj_close.index

# US common stocks, delisted ones included, one share class per company
profile = pd.DataFrame(data.get("us_company_profile")).astype({"stock_id": str}).drop_duplicates("stock_id")
keep = (
    (profile["security_type"] == "common_stock")
    & ~profile["is_etf"].fillna(False).astype(bool)
    & ~profile["is_fund"].fillna(False).astype(bool)
    & ~profile["is_adr"].fillna(False).astype(bool)
)
stocks = profile.loc[keep, ["stock_id", "company_name", "country"]].astype(str).sort_values("stock_id")
stocks = stocks.drop_duplicates("company_name")
stocks = stocks[stocks["stock_id"].isin(adj_close.columns)]
us_stocks = set(stocks.loc[stocks["country"].isin(["US", "nan"]), "stock_id"])
columns = sorted(stocks["stock_id"])

# Tradable on the day of the event: above $5, $20M a day, no +/-50% day in a year
dollar_volume = (raw_close * volume).rolling(60, min_periods=20).mean()
daily_return = adj_close.pct_change(fill_method=None)
wild = (daily_return.abs() >= 0.5).astype(float).rolling(252, min_periods=1).max().shift(1).fillna(0) > 0
tradable = (raw_close > 5) & (dollar_volume > 20e6) & ~wild
tradable = pd.DataFrame(tradable).reindex(index=days, columns=columns).fillna(False).astype(bool)

# Forward splits of at least 3-for-2
actions = pd.DataFrame(data.get("us_corporate_actions")).astype({"symbol": str})
splits = actions[(actions["split_factor"] >= 1.5) & actions["symbol"].isin(us_stocks)]

events = pd.DataFrame(False, index=days, columns=columns)
rows = np.searchsorted(days.values, pd.DatetimeIndex(splits["date"]).values)
for row, symbol in zip(rows, splits["symbol"]):
    if symbol in events.columns and row < len(days):
        events.iloc[row, events.columns.get_loc(symbol)] = True

# Hold each split for 120 trading days, at most 5% in one stock
position = (events & tradable).astype(float).rolling(120, min_periods=1).max() > 0
position = position.loc["2016-07-01":"2026-11-06"]
position = position.loc[:, position.any()]

report = sim(position, resample=None, position_limit=0.05, upload=False)
returns = report.creturn.pct_change().dropna()
print("Daily Sharpe:", round(returns.mean() / returns.std() * 252 ** 0.5, 2))
Install the FinLab skill for your AI agent
You do not need to write this yourself. Install the FinLab skill in Claude Code, Codex or Gemini CLI with one command:
Show Code
npx skills add koreal6803/finlab-ai --skill finlab -g -yThen ask your agent in plain language, for example "test dividend raises on S&P 500 members only" or "add a 20-day momentum filter to the split rule and charge 0.05% per side". The agent setup page has the details, and FinLab Studio runs the same research in a browser.
Backtest method and limits
| Item | How it was handled |
|---|---|
| Window | 2016-07-01 to 2026-11-06. FinLab's US prices and dividend history start in January 2016; dividend initiations start in January 2018 because the rule needs two years with no dividend |
| Universe | US common stocks, delisted ones included, one share class per company, no ETFs, funds or ADRs. The S&P 500 rules use each day's index members |
| Liquidity | 60-day average of raw close times volume, above the threshold on the event day; close above $5 and no +/-50% day in the past year. S&P 500 rules use index membership instead |
| Signal dates | Dividends on the declaration date (ex-dividend date when missing), splits on the split date, index changes on the observed date; see the table above. This controls look-ahead bias for the dates the data can give us |
| Execution | Signal read at a close, traded at the next day's close, on adjusted prices |
| Weights | Equal weight, at most 5% in one stock (the S&P 500 grid varies this), re-equalised on days the list changes; cash earns nothing |
| Cost | finlab sim() default US cost of zero, plus a rerun at 0.1% per side. Slippage is not estimated separately. Turnover ranged from 0.8 times a year (splits) to 27.5 times a year (capture) one way on target weights |
| Taxes | None; see the dividend capture article for what tax does to that rule |
| Data | Dividend and split data come from one vendor and can miss payments. The rule requires two years of prices before an initiation, but an absent row does not prove no dividend was paid |
| Sample | Whole window in-sample. The halves only check stability; no out-of-sample test was run. |
What this result does and does not say
Within this window and these rules, buying after a dividend raise, an initiation, a forward split or an S&P 500 change did not beat QQQ, and dividend capture beat it in one of nine settings before costs. A dividend raise portfolio did match the equal-weight S&P 500 on a risk-adjusted basis, so if you already hold equal-weight US stocks, tilting toward raisers is not shown to do harm here. It also did not help.
This article cannot tell you whether the original academic effects still exist. Our dates are the first dates we can verify, and for S&P 500 changes they lag the real announcements. The test covers one decade in which QQQ was unusually strong. If you trade around corporate actions in smaller stocks, or trade the announcement rather than the event date, a different test is needed.
For an overview of what has and has not worked on US stocks, see our US quant trading strategies comparison, the QQQ vs SPY, VOO and VTI backtest and the earnings surprise strategy, which uses earnings events to time the market rather than to hold the stocks themselves. If you are new to rule-based investing, start with our quant trading guide.
FAQ
Do corporate actions predict stock returns?
Not after the fact in this test. From 2016 to 2026, none of the six US event rules beat QQQ with dividends. The closest was dividend capture at a daily Sharpe ratio of 0.75 against 0.93, before costs.
Is buying stocks that raise their dividends a good strategy?
It matched the equal-weight S&P 500 in this test: 12.4% a year and a Sharpe ratio of 0.72, against RSP's 12.0% and 0.72. It fell well short of QQQ's 20.0% and 0.93, in all 9 settings.
Do stocks go up after a split?
The average forward split trailed QQQ by 1.61 percentage points over the next 120 trading days, and the median trailed by 5.19. A portfolio holding each split for 120 days returned 5.0% a year with a Sharpe ratio of 0.56. Older studies found positive drift, in a different period.
Do stocks do well after a first dividend?
Not in this sample. The 220 dividend initiations in stocks trading at least $5M a day, from 2018 on, led to a Sharpe ratio of 0.33 and 4.1% a year. The average event was behind QQQ by 3.94 points after 120 days.
Why compare event portfolios with QQQ and not the S&P 500?
QQQ is the benchmark we use for every US strategy on this site, so results are comparable. The table also shows SPY and RSP. The dividend raise rule matched RSP but not SPY or QQQ.
Did any setting beat QQQ?
One of 54: dividend capture bought one day before the ex-date on payments of at least 0.5% of the price, at a Sharpe ratio of 1.11 before costs. At 0.1% per side it dropped to -0.51.
Can I rerun this?
Yes. Install the FinLab skill through the AI-assisted setup, download research.py below and run python research.py.
Reproduce it yourself
- research.py: the six rules, the 54 settings, both halves, the cost runs, the five checks and the event studies.
- data.csv: daily equity curves of the six rules at their original settings, plus QQQ, SPY and RSP.
- metrics.json: the statistics behind this article, including trades, holdings, returns after events and calendar-year returns.
Disclaimer: this article is for education only and does not constitute investment advice. Past performance does not guarantee future results, and investing involves risk. Nothing here recommends any individual stock. All results are in-sample, and the two halves were not validated out of sample.
Last updated: 2026-11 | Backtest window: 2016-07 to 2026-11 | Data through 2026-11-06, run 2026-11-09 | Benchmark: QQQ total return | Author: FinLab Quant Research (reviewed by a quantitative researcher)
FinLab AI
Want to build your own strategy?
Describe your stock-picking ideas in natural language. AI automatically validates, backtests, and gives you answers
Start Free