Run this strategy
Copy the prompt to reproduce the evidence above with the article’s data, assumptions, and risk checks.
Tell your AI:
Set up FinLab and rerun the S&P 500 low volatility backtest against QQQ and RSP. Please read: https://finlab.finance/en/setup?relatedUrl=/en/blog/low-volatility-stocks-backtest
Low volatility stocks are the shares that have moved least from day to day, usually measured by the standard deviation of daily returns over the past year. We rebuilt the rule behind SPLV, the S&P 500 low volatility ETF, on each day's index members from August 2017 to October 2026. It returned 8.5% a year with a daily Sharpe ratio of 0.60 and a -35.8% maximum drawdown, against 19.7%, 0.89 and -35.1% for QQQ with dividends, and it also trailed equal-weight RSP's 0.69. Two variants lost to QQQ as well. None of the 45 settings tested beat it, and none of the three designs passed, so there is no strategy page.
Volatility fell to 15.7% a year from QQQ's 23.4%, and the worst loss did not fall with it. The most useful finding is a backtest bug. A rerun of the third design as first written showed a Sharpe of 0.94 and a drawdown of only -16.7%. Both came from 26 empty months in its position table, and two lines of code catch that error.
Low volatility stocks: key numbers
| Design | Daily Sharpe | CAGR | Max drawdown | QQQ Sharpe, same dates | Beat QQQ | Beat RSP | First / second half Sharpe | Sharpe at 0.1% per side |
|---|---|---|---|---|---|---|---|---|
| SPLV's rule | 0.60 | 8.5% | -35.8% | 0.89 | 0 / 9 | 0 / 9 | 0.68 / 0.50 | 0.59 |
| Conservative formula | 0.58 | 9.3% | -40.9% | 0.88 | 0 / 9 | 0 / 9 | 0.31 / 1.17 | 0.57 |
| Low volatility + buybacks | 0.69 | 10.7% | -39.4% | 0.87 | 0 / 27 | 10 / 27 | 0.75 / 0.64 | 0.67 |
| SPLV, the fund | 0.57 | 8.2% | -36.3% | reference | 0.64 / 0.50 | |||
| USMV, the fund | 0.72 | 10.2% | -33.1% | reference | 0.73 / 0.73 | |||
| RSP, equal weight | 0.69 | 11.9% | -39.0% | reference | 0.74 / 0.63 | |||
| SPY | 0.84 | 14.9% | -33.7% | reference | 0.86 / 0.83 | |||
| QQQ | 0.89 | 19.7% | -35.1% | benchmark | 1.00 / 0.77 |
All lines include dividends and end on 2026-10-30. The designs start when their data allow: SPLV's rule on 2017-08-21, the buyback blend on 2017-09-01 and the conservative formula on 2019-04-01. Each is compared with QQQ over its own dates, and the five fund rows use the dates of SPLV's rule. The Beat columns count settings with a higher daily Sharpe.
What low volatility stocks are
Volatility measures how far a stock's price swings around its own average. Here it is the standard deviation of daily returns over the past 252 trading days, about a calendar year, and SPLV's rule needs at least 226 of those days to rank a stock. Low volatility stocks are the S&P 500 members with the smallest figure on the rebalance date. A portfolio's volatility is the same measure on its daily returns, annualised with √252.
Three measures of low risk get mixed together, and the research below does not all use the same one.
| Measure | What it captures | Used by |
|---|---|---|
| Total volatility | All of a stock's daily movement | All three designs here, SPLV |
| Idiosyncratic volatility | Movement left after market moves are removed | Ang et al. (2006) |
| Beta | How much a stock moves with the market | Frazzini & Pedersen (2014) |
Textbook finance expects more risk to earn more return. The low-volatility anomaly is the finding that riskier stocks have often earned less. Ang, Hodrick, Xing & Zhang (2006) found that stocks with high idiosyncratic volatility earned strikingly low returns. Blitz & van Vliet (2007) state the claim in their title, "The Volatility Effect: Lower Risk Without Lower Return". Baker, Bradley & Wurgler (2011) treat benchmarks as a limit to arbitrage: institutions measured against an index cannot easily exploit the anomaly. Frazzini & Pedersen (2014) argue that leverage-constrained investors overpay for high-beta assets, and they build "betting against beta" from leveraged low-beta stocks and shorted high-beta stocks. A long-only holder gets one side of that portfolio.
Those papers cover decades. This study covers 9.2 years and asks something narrower: would a long-only basket of low volatility S&P 500 stocks have beaten QQQ, or RSP, in that window? RSP is the more telling control. These designs pick from the stocks RSP holds at equal weight, so losing to QQQ alone says little.
Our low volatility investing strategy is a different thing, a QQQ timing rule expressed through a 2x leveraged ETF, so its results do not apply to the stock baskets here.
Which stocks count as low volatility
On SPLV's rule, the weight leans toward defensive sectors. The table gives each design's average weight by sector. The labels are today's, because the data keep no history of them.
| Sector | SPLV's rule | Conservative formula | Low volatility + buybacks |
|---|---|---|---|
| Utilities | 20% | 4% | 2% |
| Consumer staples | 17% | 10% | 13% |
| Financials | 15% | 25% | 32% |
| Health care | 11% | 11% | 16% |
| Industrials | 11% | 15% | 10% |
| Real estate | 9% | 6% | 2% |
| Technology | 7% | 9% | 8% |
| Consumer cyclical | 5% | 9% | 11% |
| Communication services | 2% | 5% | 2% |
| Materials | 2% | 3% | 3% |
| Energy | 1% | 3% | 1% |
Utilities, consumer staples and financials made up 52% of SPLV's rule on average, and technology 7%. The names change: target weights turn over about 0.65 times a year, so a fixed list goes stale. The last row of picks in the code below gives the names at the latest rebalance. The two variants are different portfolios that start from a volatility signal. Utilities fall to 4% and 2%, and financials rise to 25% and 32%.
How SPLV works and how close our rebuild came
SPLV tracks the S&P 500 Low Volatility Index, and the rule has four steps.
- Rank S&P 500 members by 252-day volatility.
- Keep the 100 lowest.
- Weight each stock inversely to its volatility, so the calmest gets the most.
- Rebalance after the third Friday of February, May, August and November.
We applied those steps to FinLab's point-in-time member list, with one difference: the index reads its market data on the last trading day of the month before, and ours reads them on the third Friday. The result tracked the fund with a daily correlation of 0.997. Over the same dates our rule returned 8.5% a year with a Sharpe of 0.60, and SPLV 8.2% with 0.57. The fund's return is after its fees and ours has no costs; we did not split that gap further. The rebuild is close enough that a test of the rule works as a test of the fund's recipe.
USMV, another low volatility ETF, uses a minimum-variance optimisation, a different rule that also weighs how stocks move together. Its daily correlation with our rule is 0.939. It scored 0.72 with 10.2% a year and a -33.1% drawdown. Its Sharpe was ahead of SPLV's and RSP's and behind QQQ's. It appears here as a reference line only, because we did not rebuild it.
Three designs and how each had to pass
The designs, their neighbouring settings and the pass rules were written on a GitHub issue before this study ran a backtest. SPLV's rule and the conservative formula were defined without seeing any result. The third design came from an earlier notebook whose result was already known, so its settings were kept unchanged.
- SPLV's rule. As above. Neighbours: 50, 100 or 150 stocks and 126, 252 or 378-day windows.
- Conservative formula. From Blitz & van Vliet (2018), "The Conservative Formula: Quantitative Investing Made Easy". Take the calmest half of members on 36-month volatility, then hold the 50 with the best average rank of 12-1 month momentum and 12-month net payout yield (dividends plus buybacks minus issuance). Equal weight, rebalanced each quarter end. The paper holds 100 of the 1,000 largest US stocks, and this study holds 50 of about 500 members. Neighbours: the calmest 40%, 50% or 60% and 40, 50 or 60 stocks. It starts in April 2019 because it needs 36 months of prices.
- Low volatility + buybacks. Rank members on low 252-day volatility and on the four-quarter fall in diluted shares, blend the ranks equally, and hold the top 25 among stocks whose share count fell. A change above 30% does not count, because it is treated as a split or a merger. Equal weight, rebalanced monthly. Neighbours: 15, 25 or 40 stocks, 126, 252 or 378-day windows, and a volatility share of 0.3, 0.5 or 0.7.
"Beat" means a higher daily Sharpe ratio than QQQ with dividends over exactly the same dates. Sharpe is the mean daily return over its standard deviation, times √252, with no risk-free rate deducted. Some strategy comparison pages on this site report monthly Sharpe, so those figures do not mix with these. A design passes only if it meets all six rules.
- Neighbouring settings. At least 70% beat QQQ.
- Both halves. The original setting beats QQQ in each half.
- Costs. It beats QQQ at finlab's default US cost of zero and at 0.1% per side.
- No single year. It still beats QQQ without the calendar year of its largest lead.
- Cash. A design averaging over 10% cash must also beat QQQ on returns above T-bills (BIL). All three stayed fully invested, so this rule did not apply.
- Combinations. A combined design must beat its single-signal base on the same dates.
| Check | SPLV's rule | Conservative formula | Low volatility + buybacks |
|---|---|---|---|
| 1. Neighbours beating QQQ | 0 / 9 | 0 / 9 | 0 / 27 |
| 2. First half: design / QQQ / RSP | 0.68 / 1.00 / 0.74 | 0.31 / 0.57 / 0.57 | 0.75 / 0.99 / 0.74 |
| 2. Second half: design / QQQ / RSP | 0.50 / 0.77 / 0.63 | 1.17 / 1.32 / 0.92 | 0.64 / 0.75 / 0.61 |
| 3. At 0.1% per side: design / QQQ | 0.59 / 0.89 | 0.57 / 0.88 | 0.67 / 0.87 |
| 4. Without 2022, the largest lead: design / QQQ | 0.70 / 1.25 | 0.73 / 1.31 | 0.73 / 1.23 |
| 5. Above T-bills, for disclosure: design / QQQ | 0.44 / 0.78 | 0.44 / 0.77 | 0.54 / 0.77 |
| 6. Against its base: design / base | is the base | 0.58 / 0.53 | 0.69 / 0.59 |
| Result | Fails | Fails | Fails |
The halves split at 2022-03-24, 2023-01-12 and 2022-03-30.
Result: all 45 settings trailed QQQ
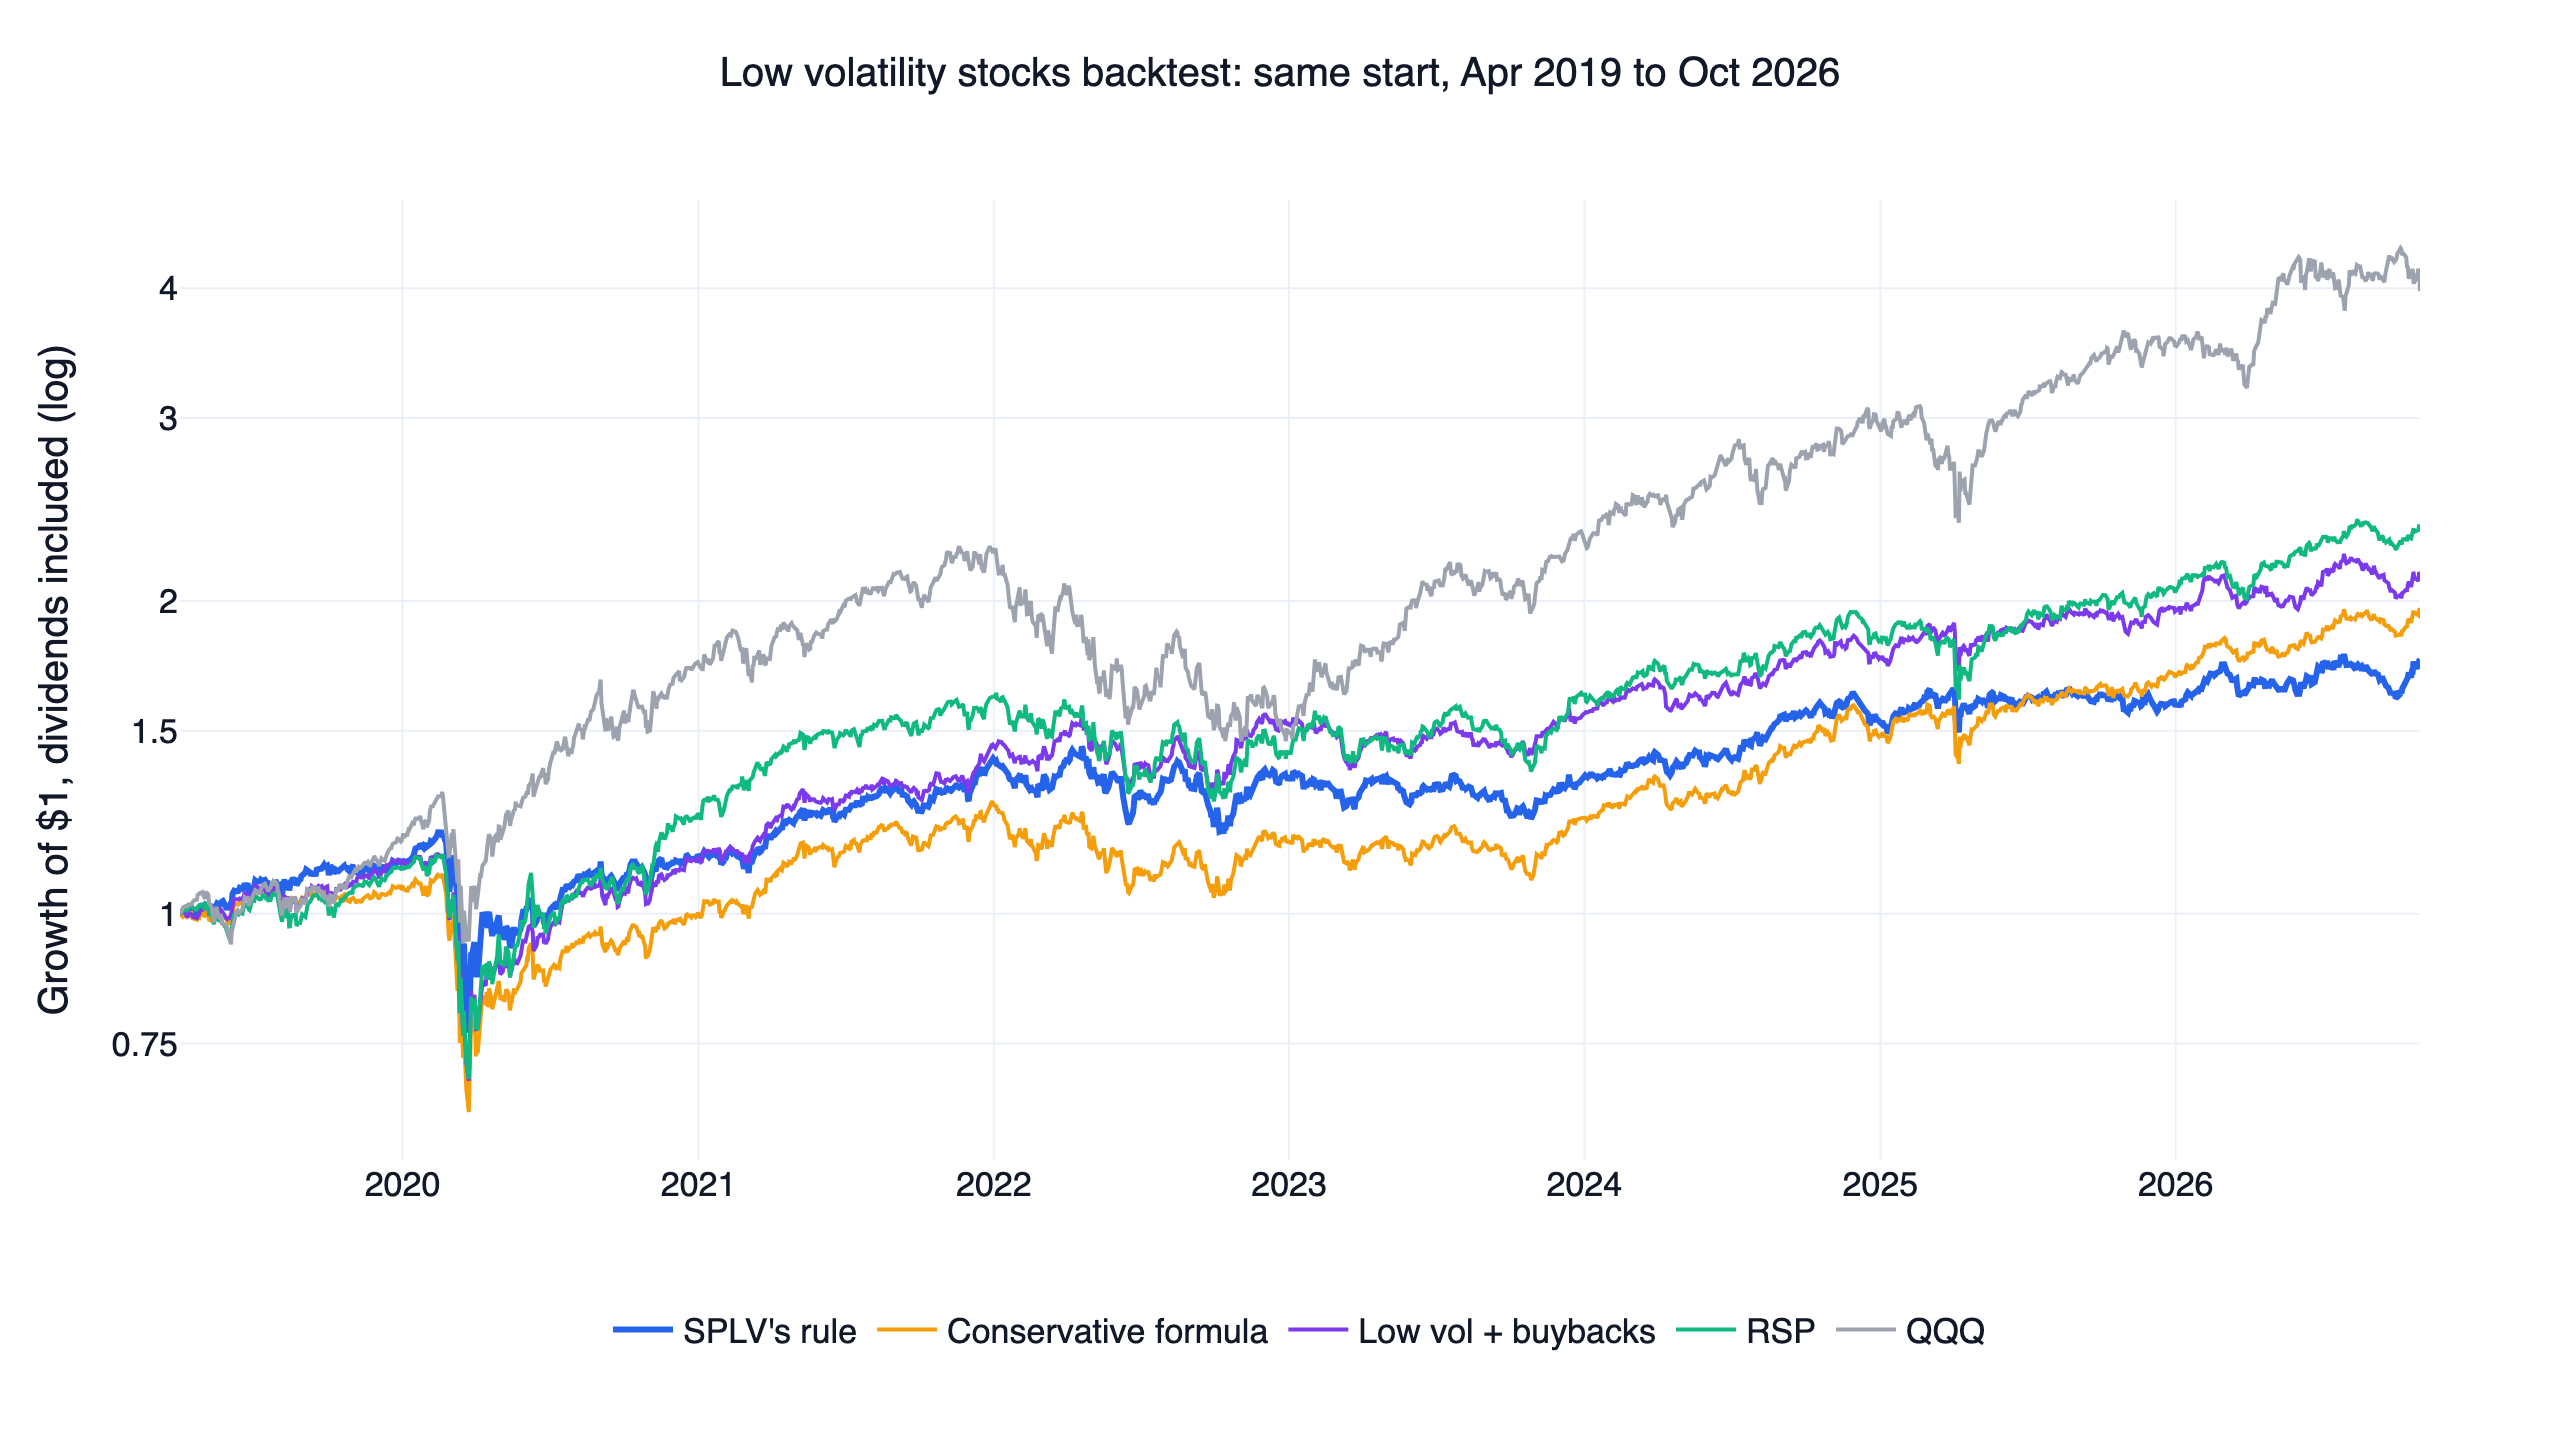
The chart at the top puts the designs on one start date, April 2019. From there QQQ returned 20.0% a year, RSP 11.9%, the conservative formula 9.3% and SPLV's rule 7.7%, and the buyback blend finished between RSP and the conservative formula. All of the lines drop in March 2020, and the conservative formula reaches its -40.9% low there. In 2022 the designs moved sideways while QQQ fell back toward them. From 2023 QQQ pulled away. The conservative formula spent six years below SPLV's rule and passed it in the second half of 2025.
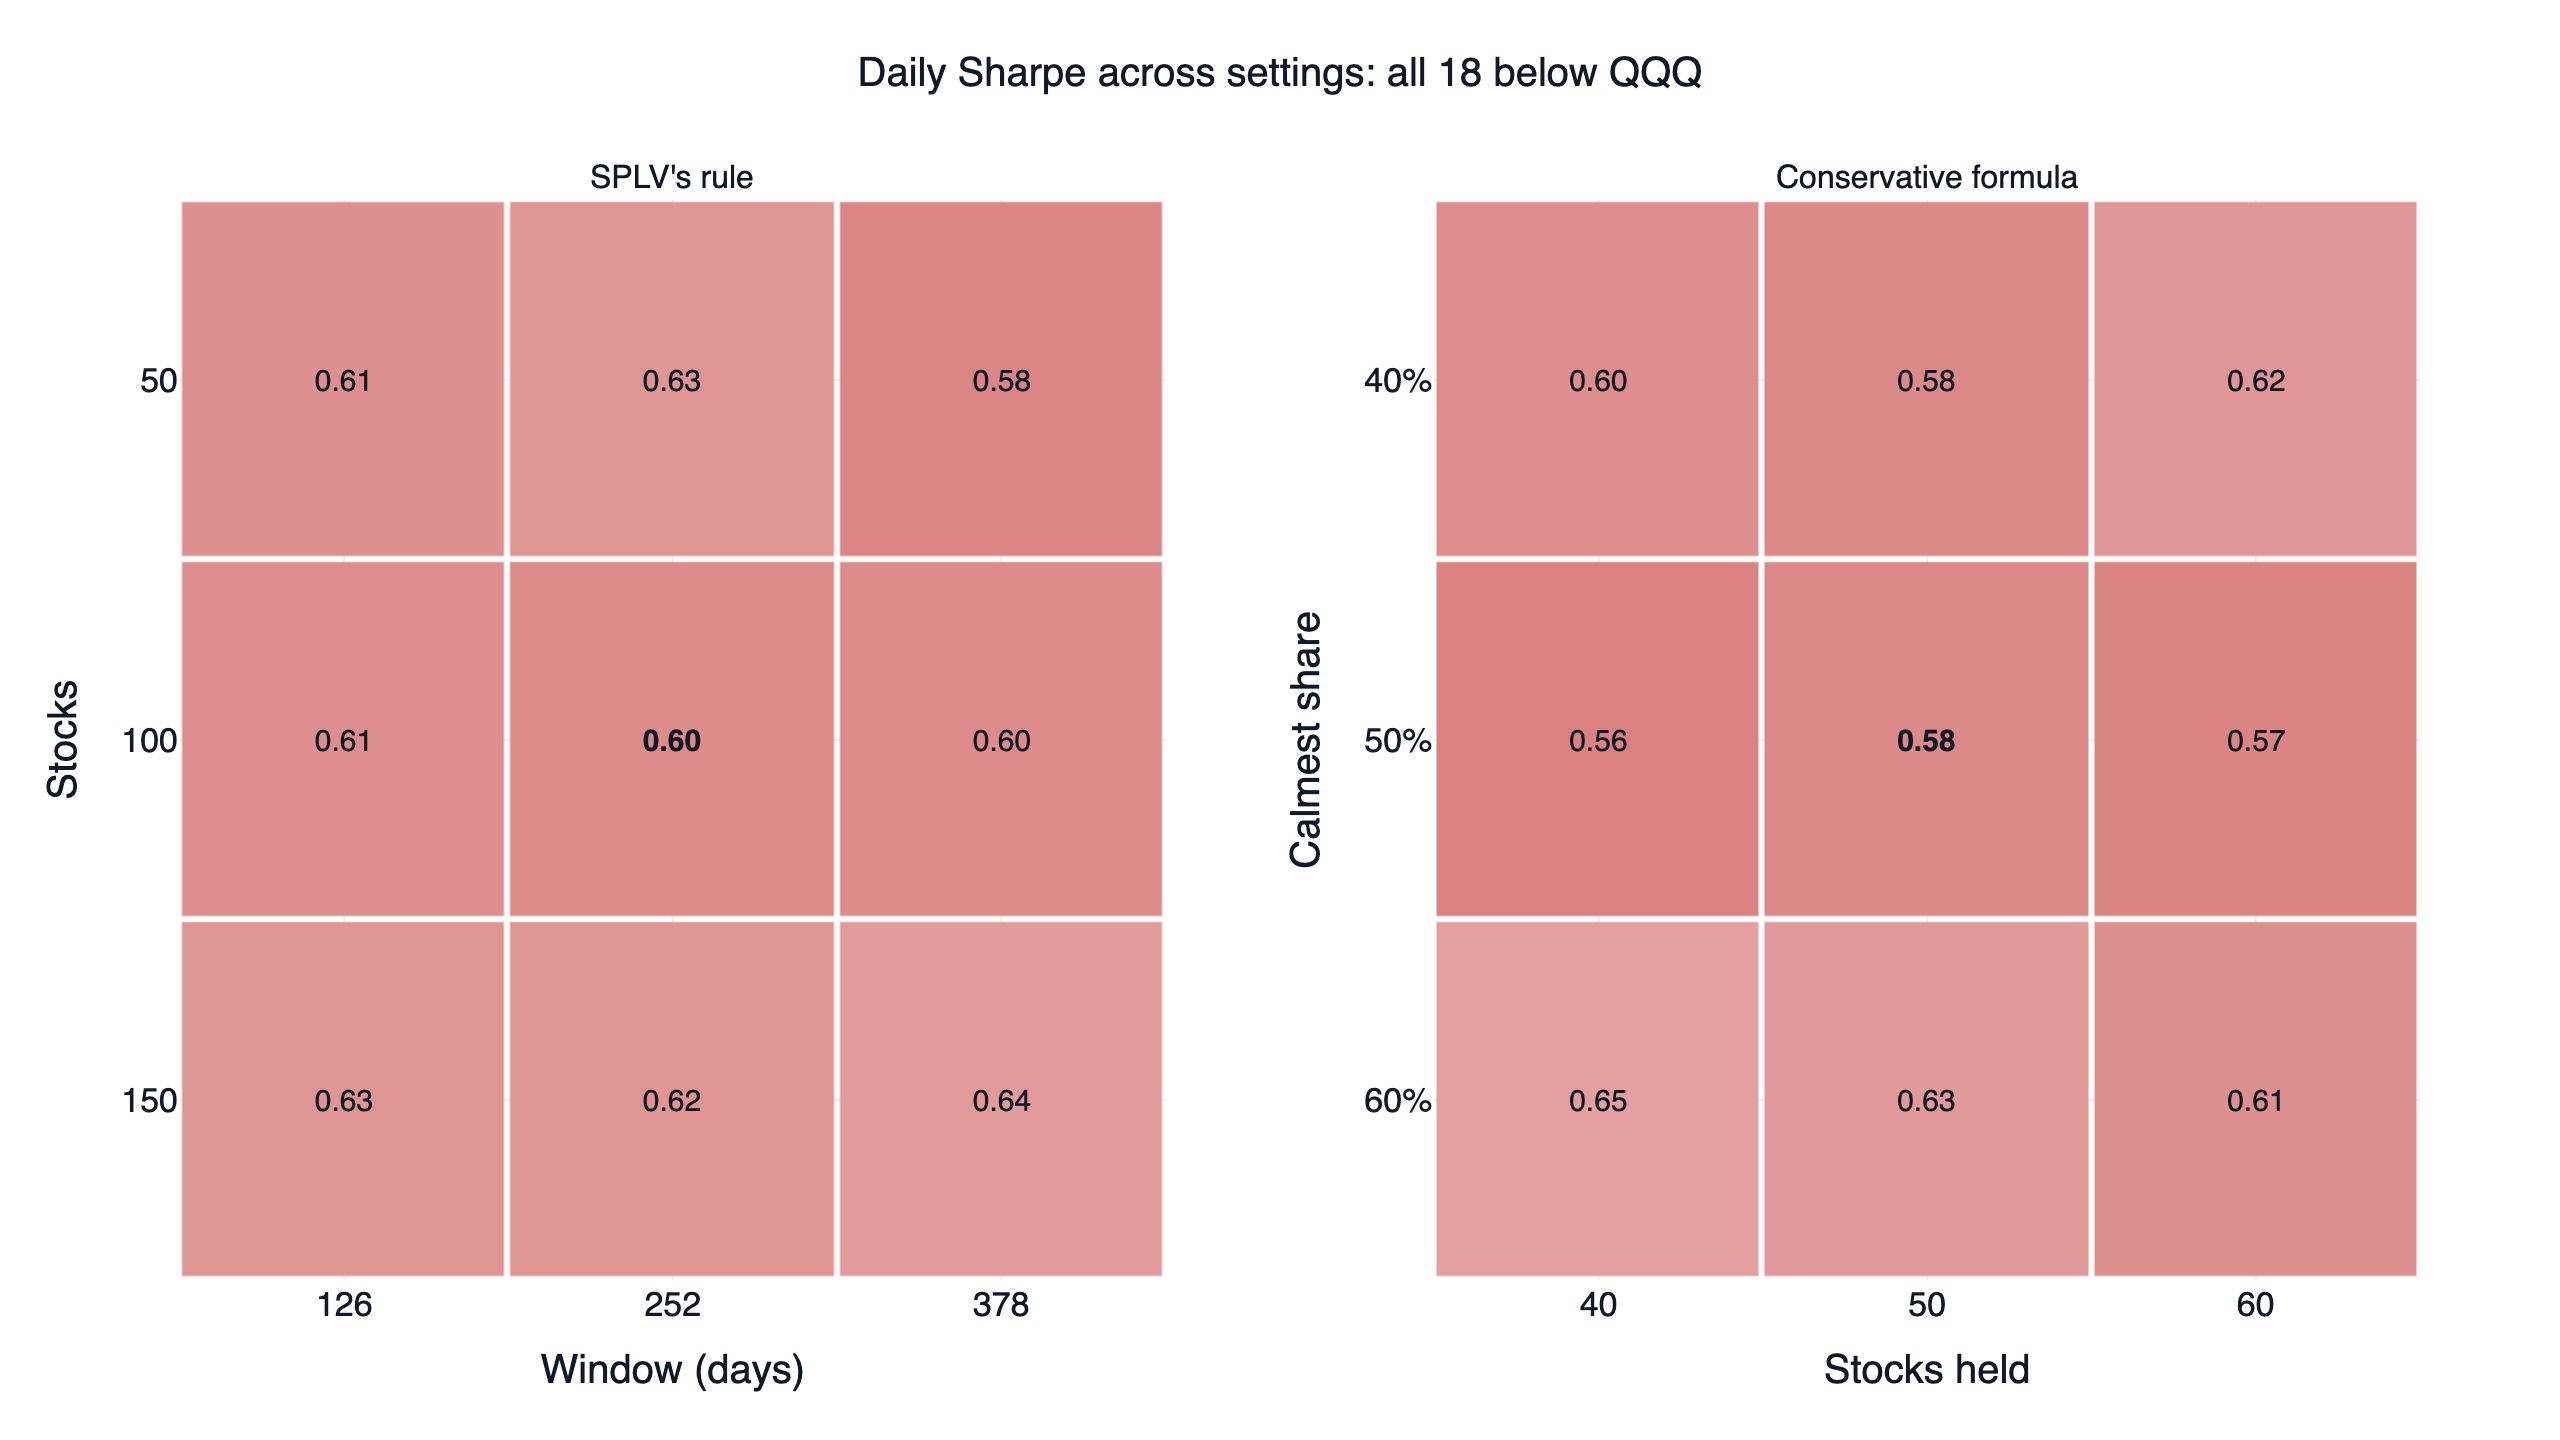
Bold marks the original settings, and all 18 cells are below QQQ's 0.89 and 0.88. SPLV's rule ranges from 0.58 to 0.64 and the conservative formula from 0.56 to 0.65. Neither grid has a sharp peak, and the original settings sit low in both. The conservative formula's best row is the widest pool, the calmest 60%, at 0.61 to 0.65. The 27 buyback settings do not fit a flat map, so they are in metrics.json, linked below. They range from 0.61 to 0.72 against QQQ's 0.87.
Both combinations cleared rule 6: 0.58 against 0.53 for the conservative formula and 0.69 against 0.59 for the buyback blend, each on its own dates. Both also drew down further than the base, at -40.9% and -39.4% against -35.8%. The conservative formula still lost to QQQ and to RSP, and its halves were lopsided: 0.31 in the first, then 1.17 in the second, ahead of RSP's 0.92 and behind QQQ's 1.32.
The buyback blend came closest. Its 0.69 edged RSP's 0.68 on its dates, and it led RSP in both halves. At 0.1% per side the edge is gone, 0.67 against 0.68, and 10 of its 27 settings beat RSP. Its target weights turn over 1.80 times a year, nearly three times the rate of SPLV's rule.
Volatility fifths: return rose with risk and Sharpe did not
We added this test after seeing the results, so it carries no pass or fail. Each month the members were split into five groups by trailing 252-day volatility, about 99 stocks each, and held at equal weight from September 2017.
| Volatility fifth | Volatility | CAGR | Daily Sharpe | Max drawdown |
|---|---|---|---|---|
| 1, calmest | 15.3% | 9.6% | 0.68 | -34.7% |
| 2 | 17.1% | 9.4% | 0.61 | -37.6% |
| 3 | 19.2% | 11.6% | 0.67 | -40.3% |
| 4 | 21.8% | 12.2% | 0.64 | -40.8% |
| 5, most volatile | 29.1% | 14.6% | 0.62 | -47.4% |
| RSP | 18.9% | 11.6% | 0.68 | -39.0% |
| QQQ | 23.4% | 19.3% | 0.87 | -35.1% |
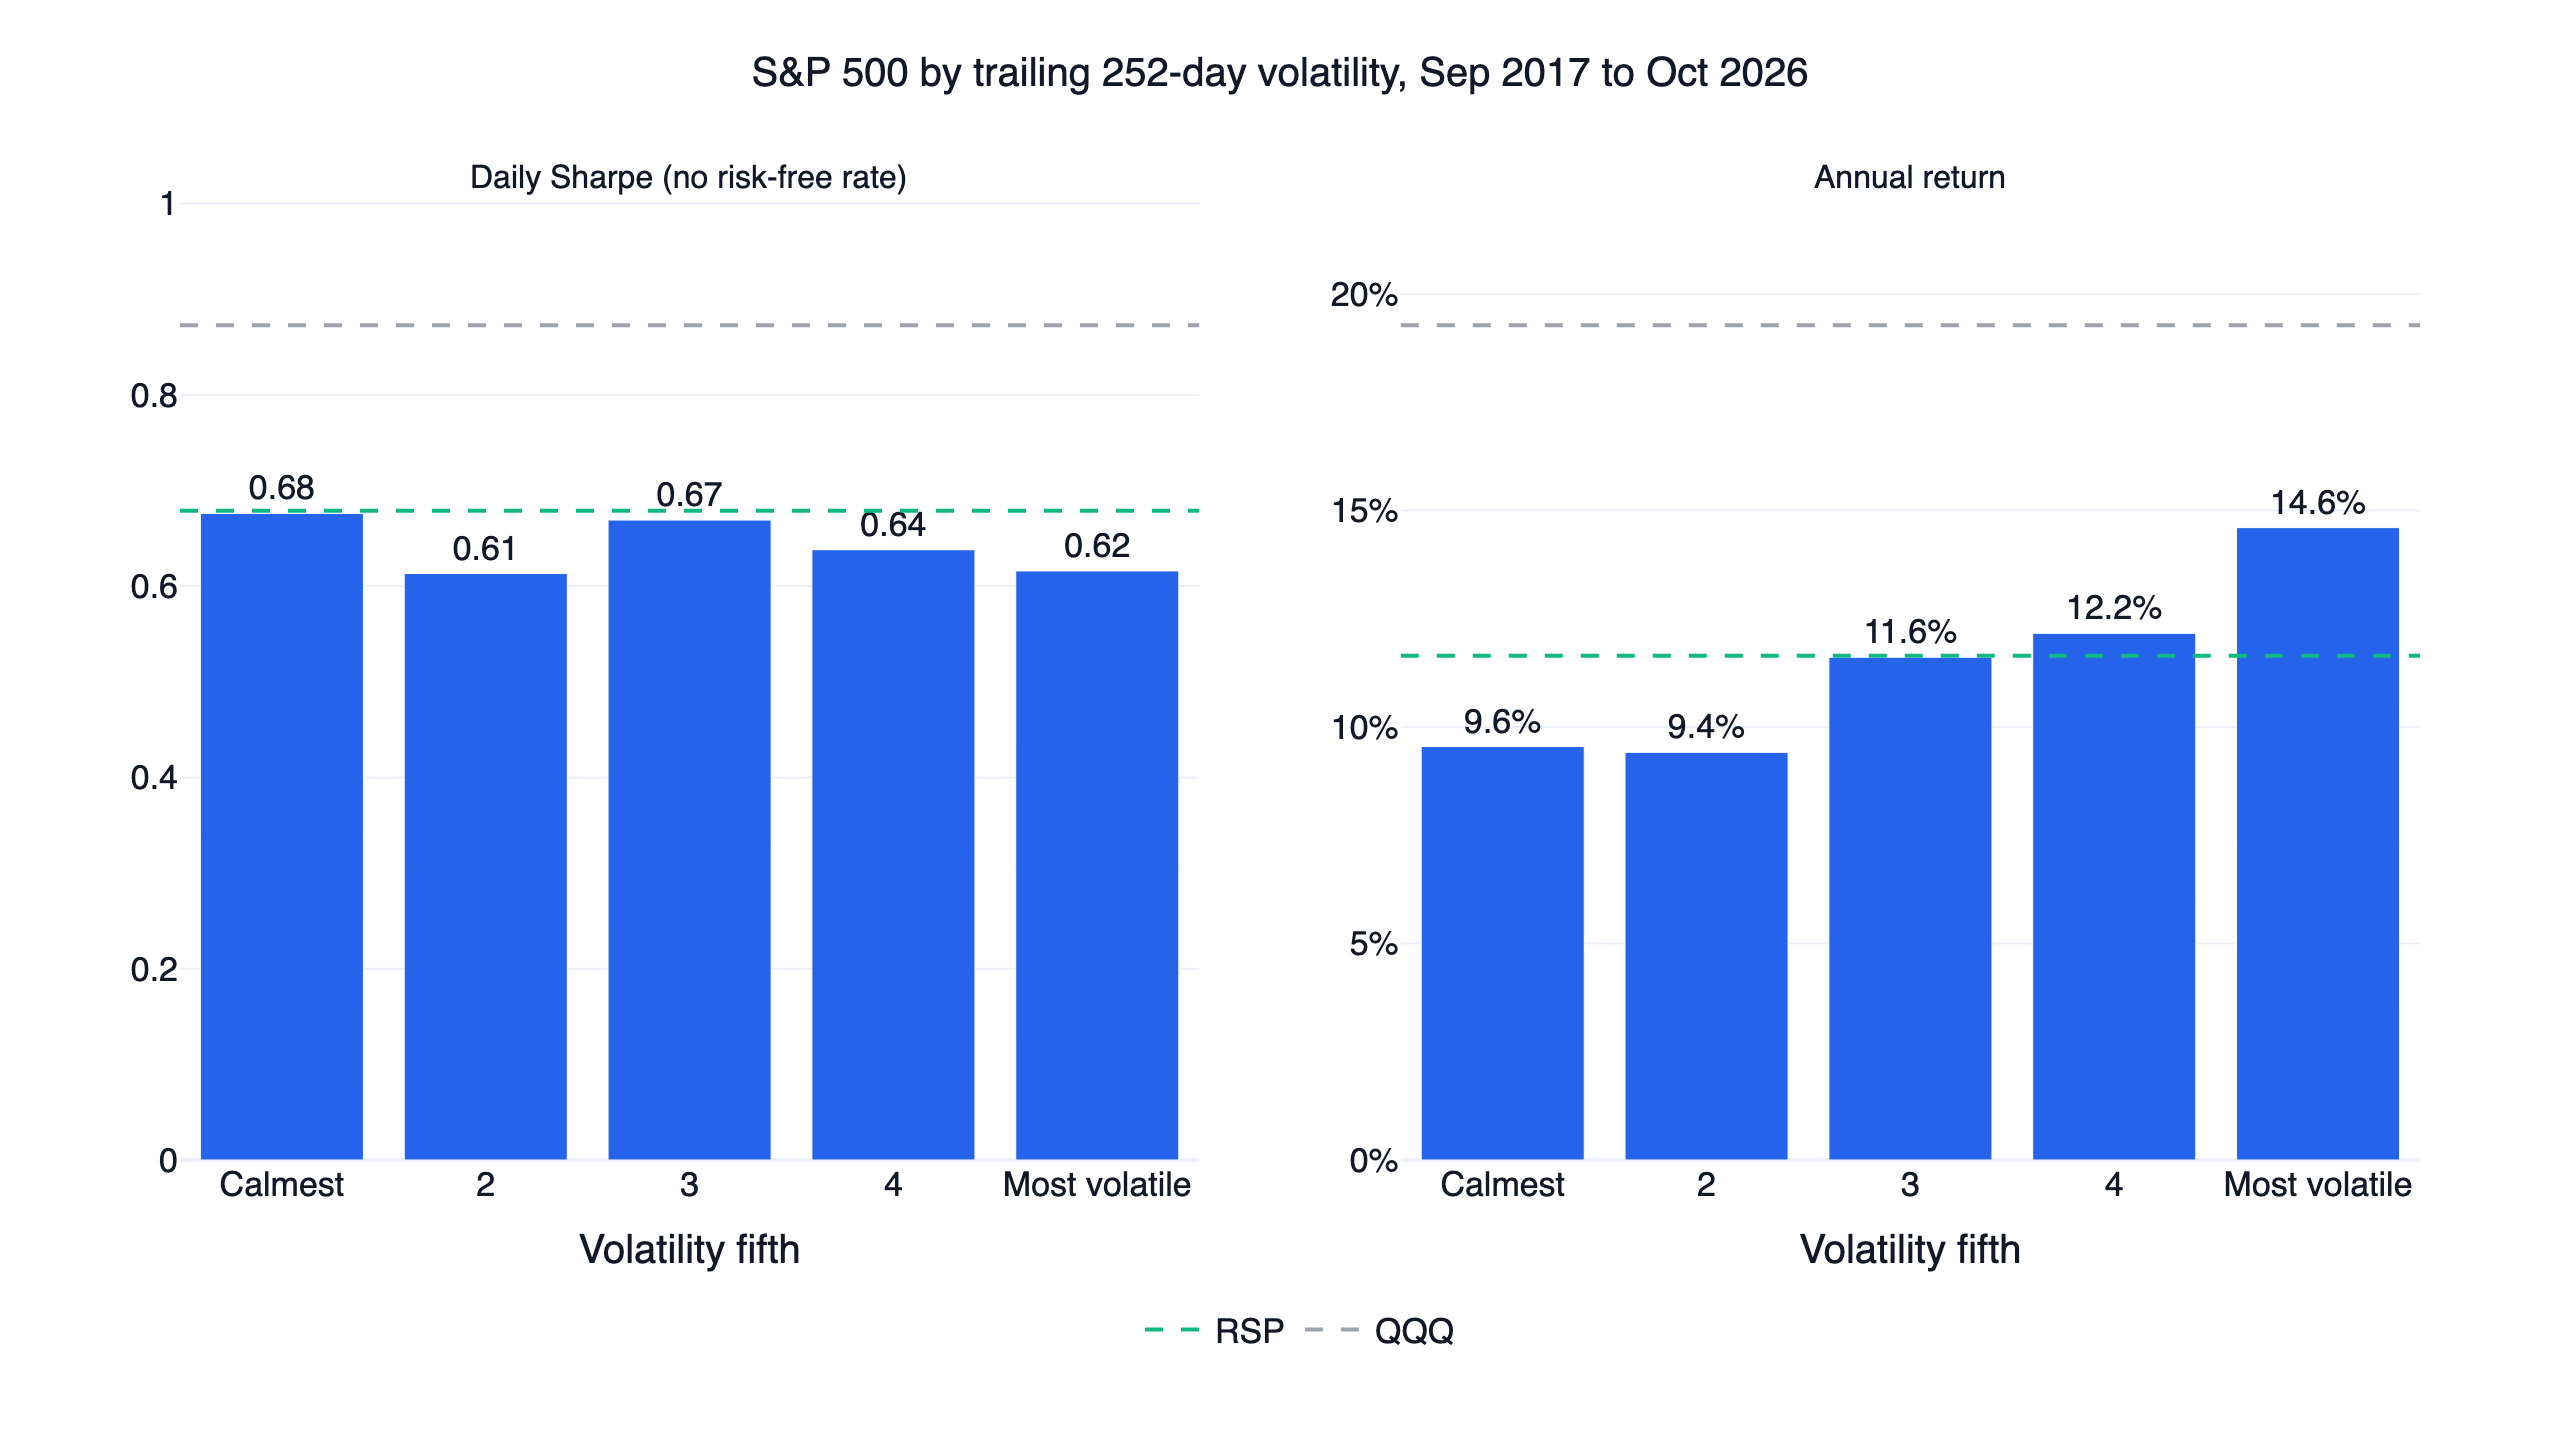
Volatility rose from 15.3% to 29.1% across the fifths, and return from 9.6% to 14.6%, with the second fifth just below the first. Sharpe stayed between 0.61 and 0.68 with no order, around RSP's dashed line at 0.68. QQQ's line sits above every bar on both panels. In this window the calmest fifth matched equal weight on Sharpe and did not beat it. Above T-bills the fifths scored 0.47 to 0.54 against QQQ's 0.77.
The sort changed how much risk you carried and how much you earned, and it left the return per unit of risk about where it was. The most volatile fifth earned the most, so the claim that the riskiest stocks earn less did not show up in S&P 500 members over these years.
On these dates the calmest fifth scored 0.68 and SPLV's rule 0.59. Both hold roughly the calmest hundred members. The rule weights inversely to volatility and rebalances quarterly, and the fifth weights equally and rebalances monthly. We did not test which difference accounts for the gap.
Calmer, but not always safer in a crash
SPLV's rule delivered the calm it promises, with volatility of 15.7% a year against QQQ's 23.4%. The maximum drawdown did not follow: -35.8% against -35.1%. Its worst loss came in the 2020 crash, and QQQ's came in 2022.
| Portfolio | 19 Feb to 23 Mar 2020 | 2022 |
|---|---|---|
| SPLV's rule | -35.4% | -4.3% |
| Low volatility + buybacks | -39.2% | +4.7% |
| SPLV, the fund | -35.8% | -4.9% |
| USMV, the fund | -33.0% | -9.4% |
| RSP | -39.0% | -11.6% |
| SPY | -33.7% | -18.2% |
| QQQ | -27.9% | -32.6% |
From the top of the 2020 market to its low, the rule and the fund both lost more than QQQ and SPY, and the buyback blend lost about what RSP lost. Picking the calmest stocks of the previous year did not hold up better than those two funds in that crash. We did not measure which holdings drove it.
2022 went the other way. The rule lost 4.3% and the buyback blend gained 4.7% while QQQ lost 32.6%. That single year carries much of the case for the idea: the rule's 28.2-point lead over QQQ was its largest of any year. Take 2022 out and the rule scores 0.70 against QQQ's 1.25. On returns above T-bills it scored 0.44 against 0.78, a figure given for disclosure because the design is fully invested.
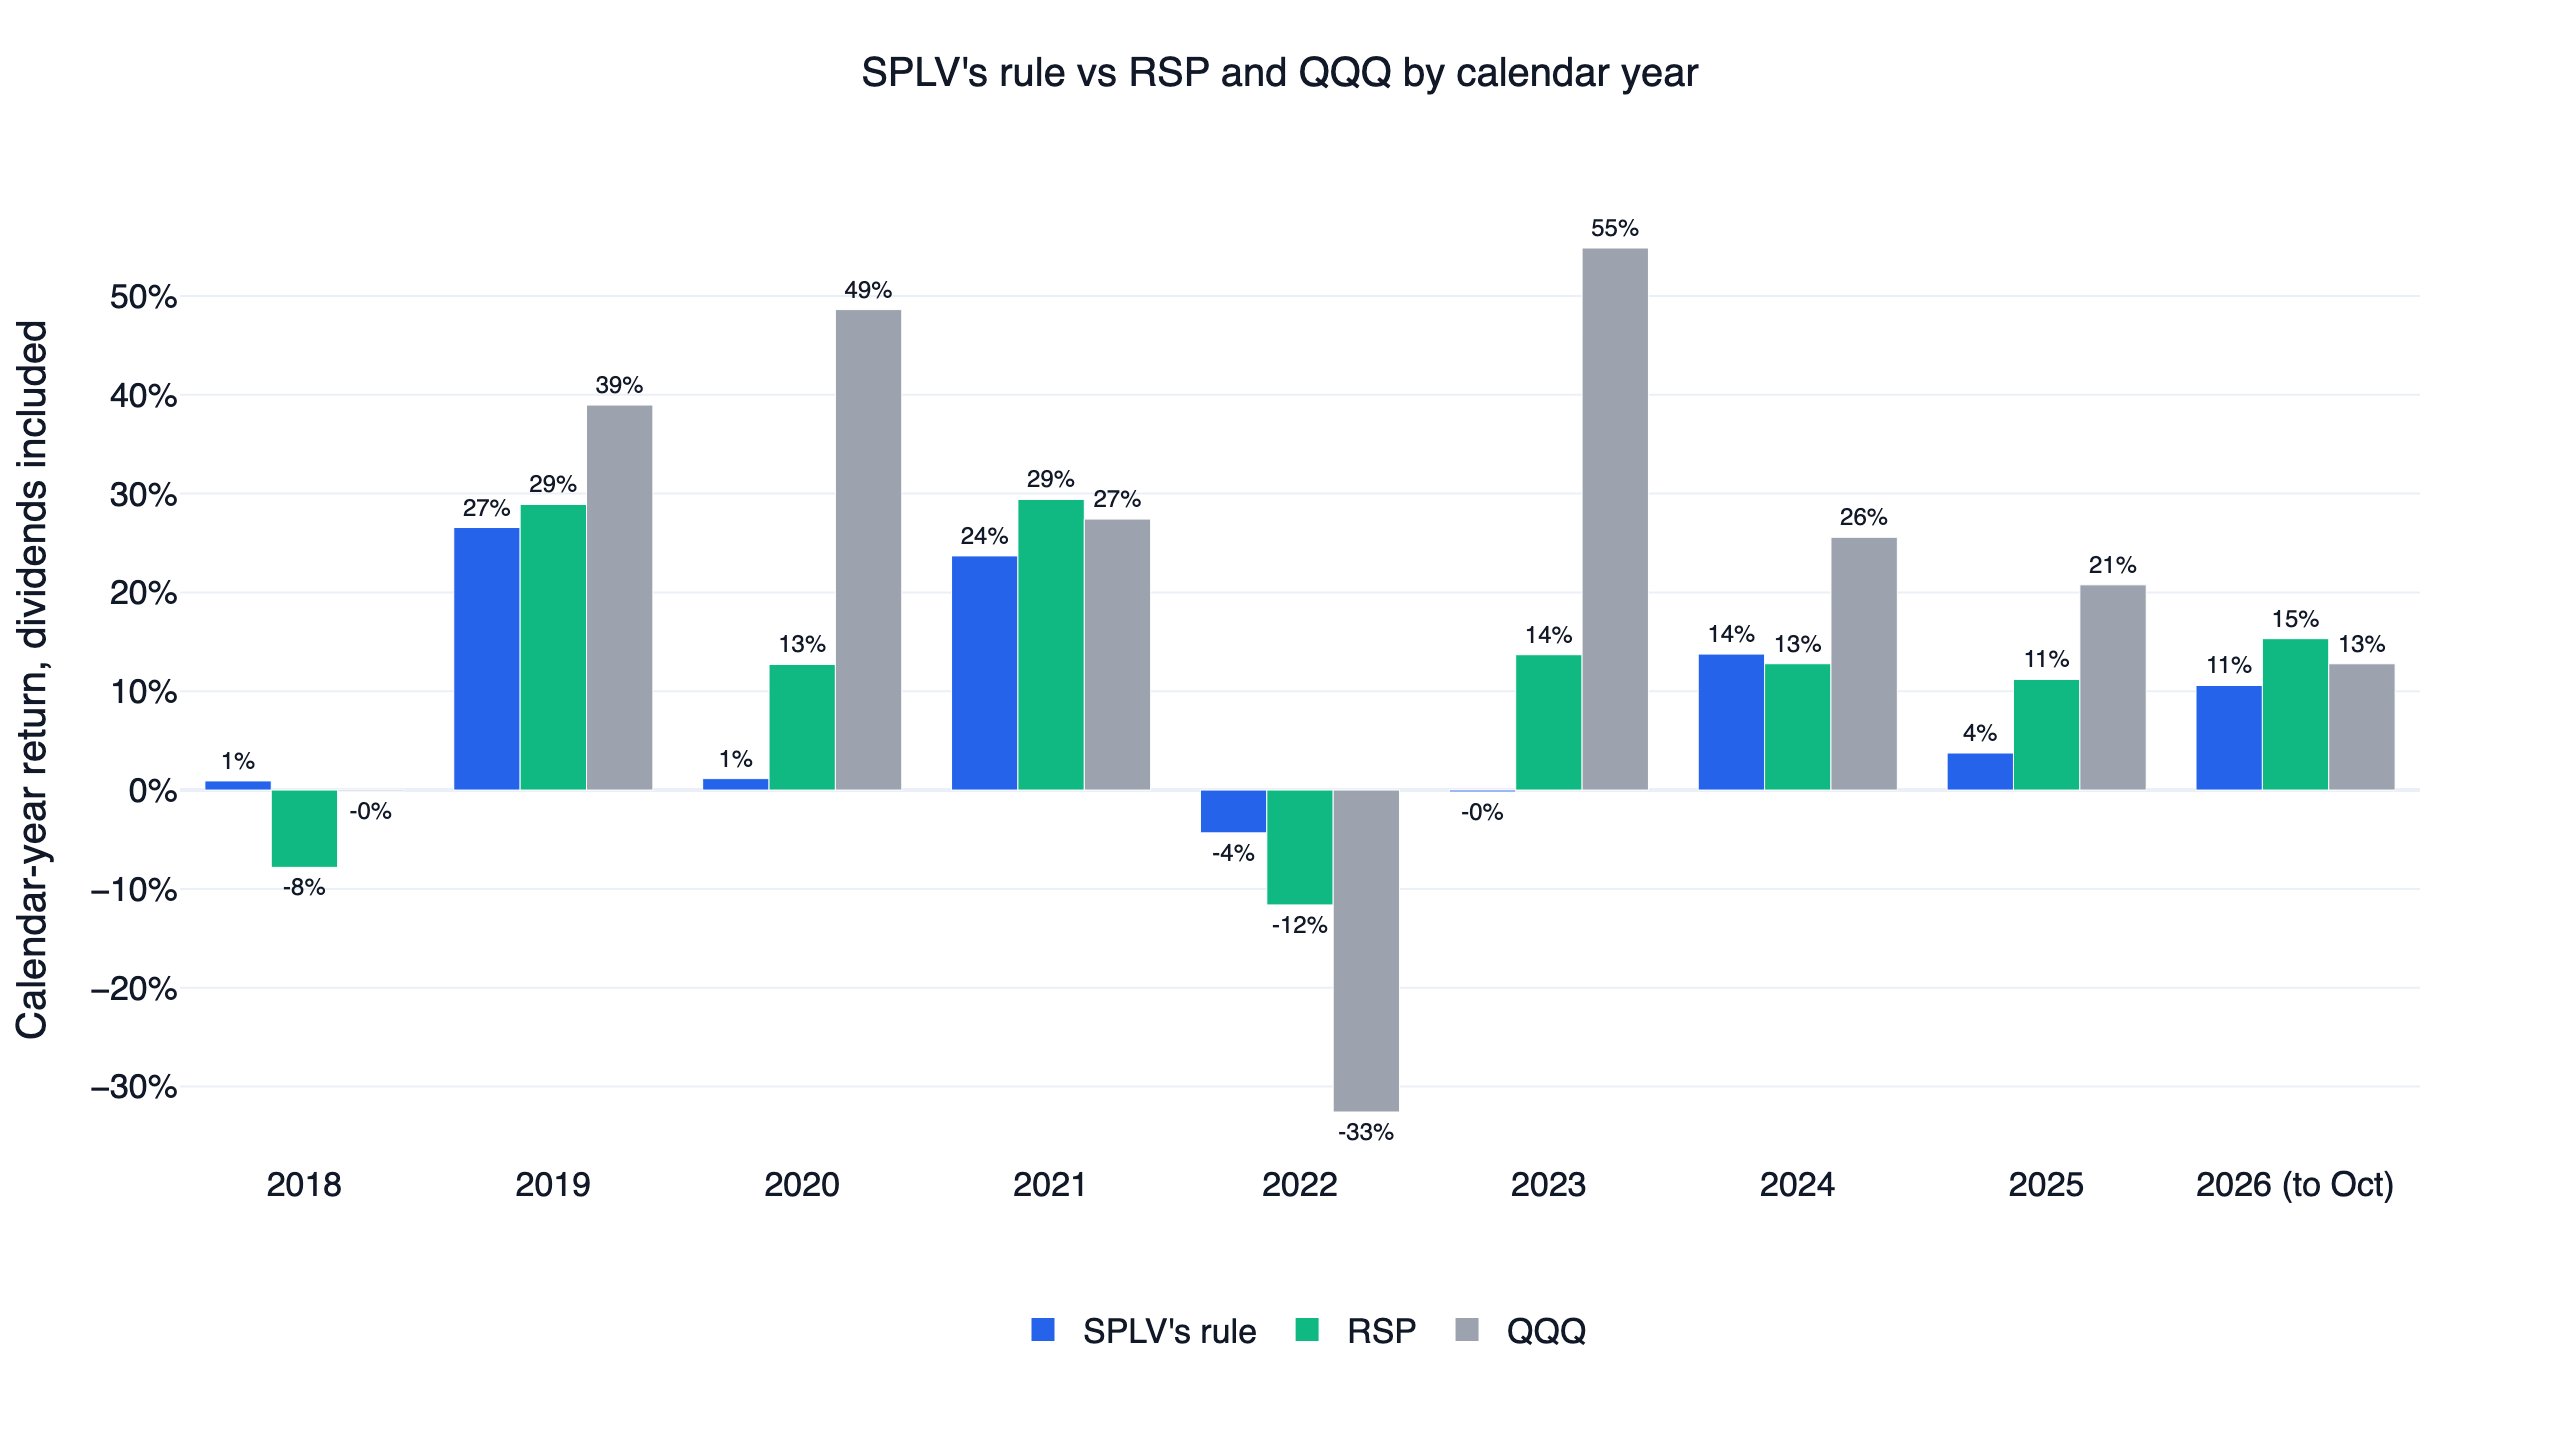
The rule beat QQQ in two of the nine bars, 2018 and 2022, and RSP in three, 2018, 2022 and 2024 (13.8% against 12.8%). 2023 is the mirror of 2022: -0.2% against 54.9% for QQQ and 13.7% for RSP. In 2020 the rule made 1.2% against 48.6% and 12.7%. It stayed near RSP in 2019 (26.6% against 28.9%) and 2021 (23.7% against 29.4%), then lagged both funds in 2025 (3.7% against 11.2% for RSP and 20.8% for QQQ) and in 2026 through October (10.6% against 15.3% and 12.8%).
A backtest bug that looked like an edge
The low volatility + buybacks design came from an internal research notebook, and its result had been seen before this study began: a daily Sharpe of 0.92 against QQQ's 0.96, with 1.07 against 1.20 in the first half and 0.79 against 0.72 in the second. That is why its settings were kept as they were. That run had its own dates and a small trading cost, so its figures differ from the rerun below, but it had the same empty months.
Rerunning it showed something wrong. The maximum drawdown was only -16.7% over a window that includes 2020, while RSP, an equal-weight basket of the same index, fell 39.0% in five weeks. A fully invested basket of 25 of those stocks should not have done that.
The cause was a date mismatch. The notebook blended a daily volatility rank with a quarterly share-count rank, and quarterly tables carry filing dates. Some fall on weekends and holidays, and some are stamped a second or so off midnight. Adding the two tables kept the dates of both, so the combined table gained 650 rows with no match in the price table. The notebook filtered the share-count rank with a daily membership table, which has no entry on those rows, so that rank came out blank and all 650 were empty.
A monthly rebalance reads the last row of the month. When a month ended on a weekend or holiday with one of those rows behind it, the empty row was what it read, and the backtest held nothing until the next rebalance. That happened at 26 of 117 rebalances and covered 23% of days. One of them fell on Saturday 29 February 2020, so the backtest sat in cash through March 2020.
| Same rule, no cost, from February 2017 | CAGR | Daily Sharpe | Volatility | Max drawdown |
|---|---|---|---|---|
| As written | 11.0% | 0.94 | 11.9% | -16.7% |
| Rows not in the price table removed | 11.0% | 0.72 | 16.3% | -39.4% |
| QQQ | 19.9% | 0.91 | 22.9% | -35.1% |
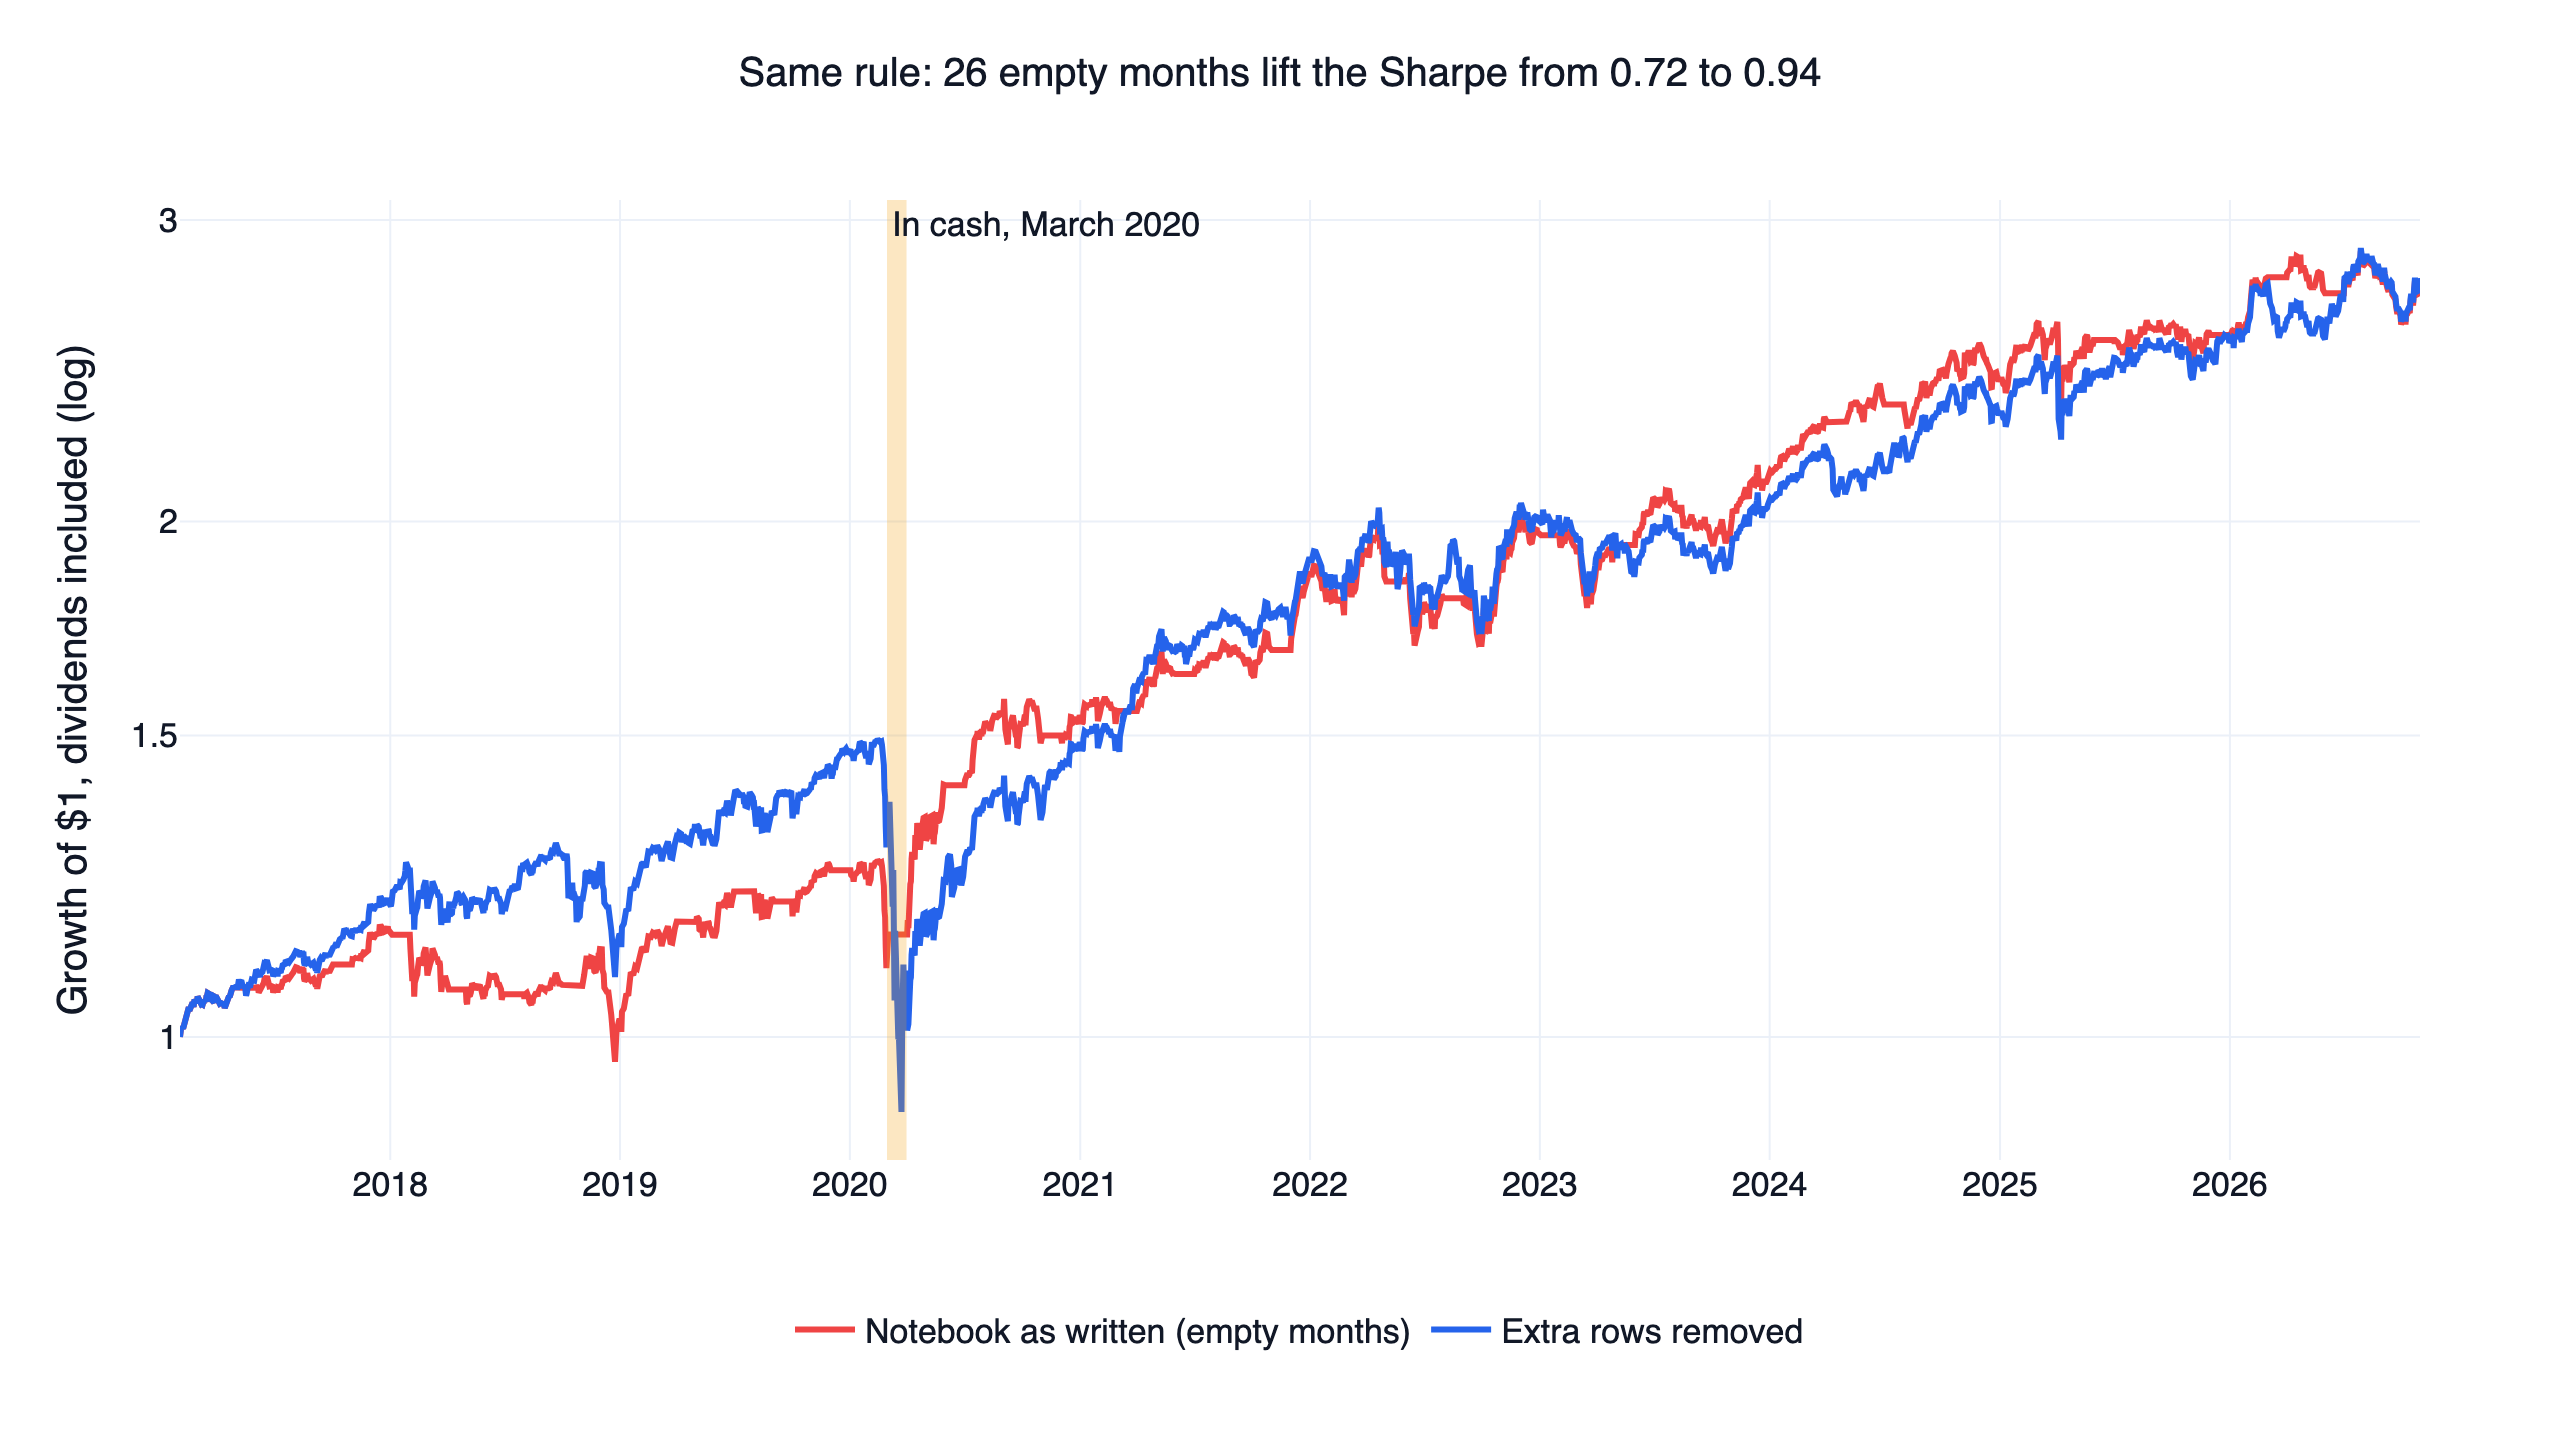
The return is the same to one decimal and the apparent risk is far lower. Cash months add no return and no variance, and here the gains and losses of the missed months cancelled almost exactly. So the return stayed at 11.0%, volatility dropped from 16.3% to 11.9%, the drawdown shrank by more than half, and the Sharpe rose from 0.72 to 0.94, above QQQ's 0.91. None of that came from the rule. Which months were skipped depended on where filing dates and month ends happened to fall.
In the chart the red line trails the blue one until March 2020, then runs flat through the shaded band while blue falls through it. After that the two stay close and finish in almost the same place. The version in this study has no such rows, because it places quarterly figures on the trading-day grid before ranking. Its daily returns correlate above 0.999 with the blue line. It starts in September 2017, which is why the key numbers table shows 0.69 and not 0.72.
Two checks catch this before you trust a backtest, with position as your position table and close as your price table.
position.index.difference(close.index)lists rows with no match in the price table. It should come back empty. If it does not,position.reindex(close.index)removes them.position.sum(axis=1).eq(0).sum()counts rows with zero holdings. Rows before the first signal are empty by design, so count from your start date, and any others need a reason.
The warning sign here was a drawdown far shallower than comparable funds in the same crash. That is worth checking in the position table before reading anything into the equity curve.
Earlier studies: low idiosyncratic volatility and low beta
Two close relatives were tested earlier on a different universe. The academic factors backtest held 30 stocks a month from the 1,000 most liquid US stocks, with financials excluded. Low idiosyncratic volatility scored 0.75 and low beta 0.60 against QQQ's 0.89, and none of the nine neighbouring settings of either beat QQQ. In that universe the factor investing overview measured the return of the best decile minus the worst: -2.2% a year for low idiosyncratic volatility and -7.1% for low beta, the same direction as the fifths above.
The large-cap factors backtest tested the lowest 126-day volatility: 0.64 among the 200 largest companies and 0.51 among the 500 most traded, against QQQ's 0.90. We did not rerun any of these, and their universes, weights and dates differ, so the figures are not directly comparable.
The code
This is SPLV's rule on each day's S&P 500 members. On data through 2026-10-30 it prints 0.6, the table's 0.60 to two decimals. It keeps both share classes of a company, the one difference from research.py, which keeps one per company.
Show Code
import finlab
import pandas as pd
from finlab import data
from finlab.backtest import sim
from finlab.dataframe import FinlabDataFrame

finlab.login()
data.set_market("us")

close = data.get("us_price:adj_close")
members = data.get("us_index_constituents:sp500").astype(bool)
tickers = members.columns.intersection(close.columns)
close = close[tickers]
members = members[tickers].reindex(close.index, method="ffill").fillna(False).astype(bool)

# Rebalance after the third Friday of February, May, August and November
fridays = pd.date_range("2017-08-01", "2026-10-30", freq="WOM-3FRI")
days = pd.DatetimeIndex([close.index[close.index <= d][-1] for d in fridays if d.month in (2, 5, 8, 11)])

# The 100 lowest 252-day volatilities among that day's members
volatility = close.pct_change(fill_method=None).rolling(252, min_periods=226).std()[members].loc[days]
picks = FinlabDataFrame(volatility).is_smallest(100)

# SPLV weights each stock inversely to its volatility
weights = (1 / volatility)[picks]
weights = weights.div(weights.sum(axis=1), axis=0).fillna(0)

report = sim(weights.loc[:, weights.any()], resample=days, trade_at_price="close",
             position_limit=1, market="us", upload=False)
curve = report.creturn.loc["2017-08-21":]
returns = curve.pct_change().dropna()
print(round(returns.mean() / returns.std() * 252 ** 0.5, 2))
Install the FinLab skill for your AI agent
You do not need to write this yourself. Install the FinLab skill in Claude Code, Codex or Gemini CLI with one command:
Show Code
npx skills add https://github.com/koreal6803/finlab-ai --skill finlabThen ask your agent in plain language, for example "weight the 100 calmest S&P 500 stocks equally and compare the result with SPLV's rule" or "count the rows outside trading days in my position table". The agent setup page has the details, and FinLab Studio runs the same research in a browser.
Backtest method and limits
| Item | How it was handled |
|---|---|
| Window | SPLV's rule from 2017-08-21, the buyback blend from 2017-09-01, the conservative formula from 2019-04-01, all to 2026-10-30. Statement data for S&P 500 companies effectively start in 2016-Q1, with fewer than 80 companies a quarter in 2015, which sets the buyback blend's first month, and SPLV's rule, its base, starts in the same month. 36 months of prices set the third |
| Universe | Each day's S&P 500 members from FinLab's point-in-time list, one share class per company. Companies that left the index stay in while they were members. In September 2017, 12 of 505 members have no price that day, falling to 0 by 2024, so the study draws on about 490 to 500 names a day |
| Liquidity and exclusions | No filter beyond index membership, and no sector is excluded. Capacity is not estimated |
| Look-ahead | Signals are read at a close and traded at the next close. Quarterly figures count from the filing date (look-ahead bias control). Sector labels are today's and appear only in the sector table |
| Weights | SPLV's rule weights inversely to volatility. The other designs use equal weight with at most 5% in a stock. Cash earns nothing |
| Costs | finlab's default US cost is zero. At 0.1% per side, CAGR falls from 8.5% to 8.3% for SPLV's rule, 9.3% to 8.9% for the conservative formula and 10.7% to 10.2% for the buyback blend |
| Slippage | No slippage model |
| Turnover | One-way turnover of target weights: 0.65, 1.54 and 1.80 times a year, in the order of the designs above |
| Taxes | None. Dividends are reinvested in full |
| Calibration | Equal-weighting all members tracks RSP with a daily correlation of 0.998 and a Sharpe of 0.68 against 0.68, so the universe and engine behave |
| Benchmark | QQQ with dividends over the same dates. RSP, SPY, SPLV and USMV are reference lines and are not judged |
| Sample | Everything is in sample, with no out-of-sample period. The two halves are a stability check |
What this result does and does not say
In this setting, from August 2017 to October 2026, low volatility stocks in the S&P 500 lowered day-to-day risk and did not beat QQQ. Against RSP they lost, apart from a thin margin for the buyback blend that costs removed. That leaves the decades of research cited above where it was. A 9.2-year window is short, and two events shape it: a pandemic crash that hit defensive portfolios hard and a 2022 that favoured them. We tested large US stocks only, with no leverage and no short side.
The evidence fits a reader who wants smaller daily swings and a portfolio that held up in a 2022-style fall, and who accepts years like 2023. It fits poorly if the aim is the highest return, or protection from a sudden crash.
To take this further, run the two row checks on any backtest that mixes daily and quarterly data, compare any low volatility idea with RSP as well as QQQ, and change one setting at a time. Other uses of volatility are covered in the QQQ volatility targeting strategy, which scales exposure to the fund, and the risk parity backtest, which weights ETFs inversely to volatility. The US stock backtest tutorial walks through a first strategy, and the US strategy comparison collects the rest. Two sister studies ran under the same rules: the PEG ratio backtest and the Piotroski F-Score backtest.
FAQ
What are low volatility stocks?
Stocks whose prices have moved least from day to day. Here that means the lowest standard deviation of daily returns over the past 252 trading days among S&P 500 members. On SPLV's rule the group averaged 20% utilities, 17% consumer staples and 15% financials.
Do low volatility stocks outperform the market?
Not in this test. From August 2017 to October 2026 SPLV's rule returned 8.5% a year against 19.7% for QQQ and 11.9% for RSP, and scored 0.60 against 0.89 and 0.69. The papers cited above study decades, so this is a result about one 9.2-year window.
Are low volatility stocks safer in a crash?
Not every time. In the 2020 crash the rule lost 35.4%, more than QQQ's 27.9% and SPY's 33.7%. In 2022 it lost 4.3% against QQQ's 32.6%. Its volatility was lower over the whole window, 15.7% against 23.4%.
What is the difference between SPLV and USMV?
SPLV holds the 100 least volatile S&P 500 stocks, weighted inversely to volatility. USMV uses a minimum-variance optimisation. Over the same dates SPLV returned 8.2% a year with a Sharpe of 0.57, and USMV 10.2% with 0.72. Our rule tracked SPLV with a daily correlation of 0.997 and USMV with 0.939.
Is low volatility the same as low beta?
No. Volatility counts all of a stock's movement, and beta counts only the part tied to the market, so the two lists can differ. Our earlier test of low beta scored 0.60 on a different universe, the same as SPLV's rule here, but the two figures are not directly comparable.
Does adding momentum or buybacks improve low volatility?
On Sharpe, yes on the same dates: the conservative formula scored 0.58 against 0.53 and the buyback blend 0.69 against 0.59. Both drew down further than the plain rule, and neither beat QQQ in any setting.
How do I check a backtest for empty months?
Count rows missing from the price table with position.index.difference(close.index) and rows with zero holdings with position.sum(axis=1).eq(0).sum(). In this study 26 of 650 such rows were read at month ends, which left a backtest in cash for 23% of days, and its Sharpe read 0.94 instead of 0.72.
Can I rerun this?
Yes. Install FinLab through the AI-assisted setup, download research.py below and run python research.py.
Reproduce it yourself
| File | Contents |
|---|---|
| research.py | All three designs, the 45 settings, both halves, cost runs, volatility fifths and the empty-month comparison |
| data.csv | Daily equity of the three designs, QQQ, SPY, RSP, SPLV and USMV |
| metrics.json | The statistics behind this article, including every setting, the sector mix and yearly returns |
The team behind this research is on the about page.
Disclaimer: this article is for education only and does not constitute investment advice. Past performance does not guarantee future results, and investing involves risk. All results are in-sample, and the two halves were not validated out of sample. The funds named are used to describe research results, not as recommendations.
Last updated: 2026-11|Backtest window: 2017-08 to 2026-10|Benchmark: QQQ with dividends|Author: FinLab Quant Research
FinLab AI
Want to build your own strategy?
Describe your stock-picking ideas in natural language. AI automatically validates, backtests, and gives you answers
Start Free