Run this strategy
Copy the prompt to reproduce the evidence above with the article’s data, assumptions, and risk checks.
Tell your AI:
Set up FinLab and backtest the seven largest S&P 500 stocks held in equal weight, rebalanced monthly, against QQQ with dividends. Please read: https://finlab.finance/en/setup?relatedUrl=/en/blog/covered-call-etf-mag-7-dividend-backtest
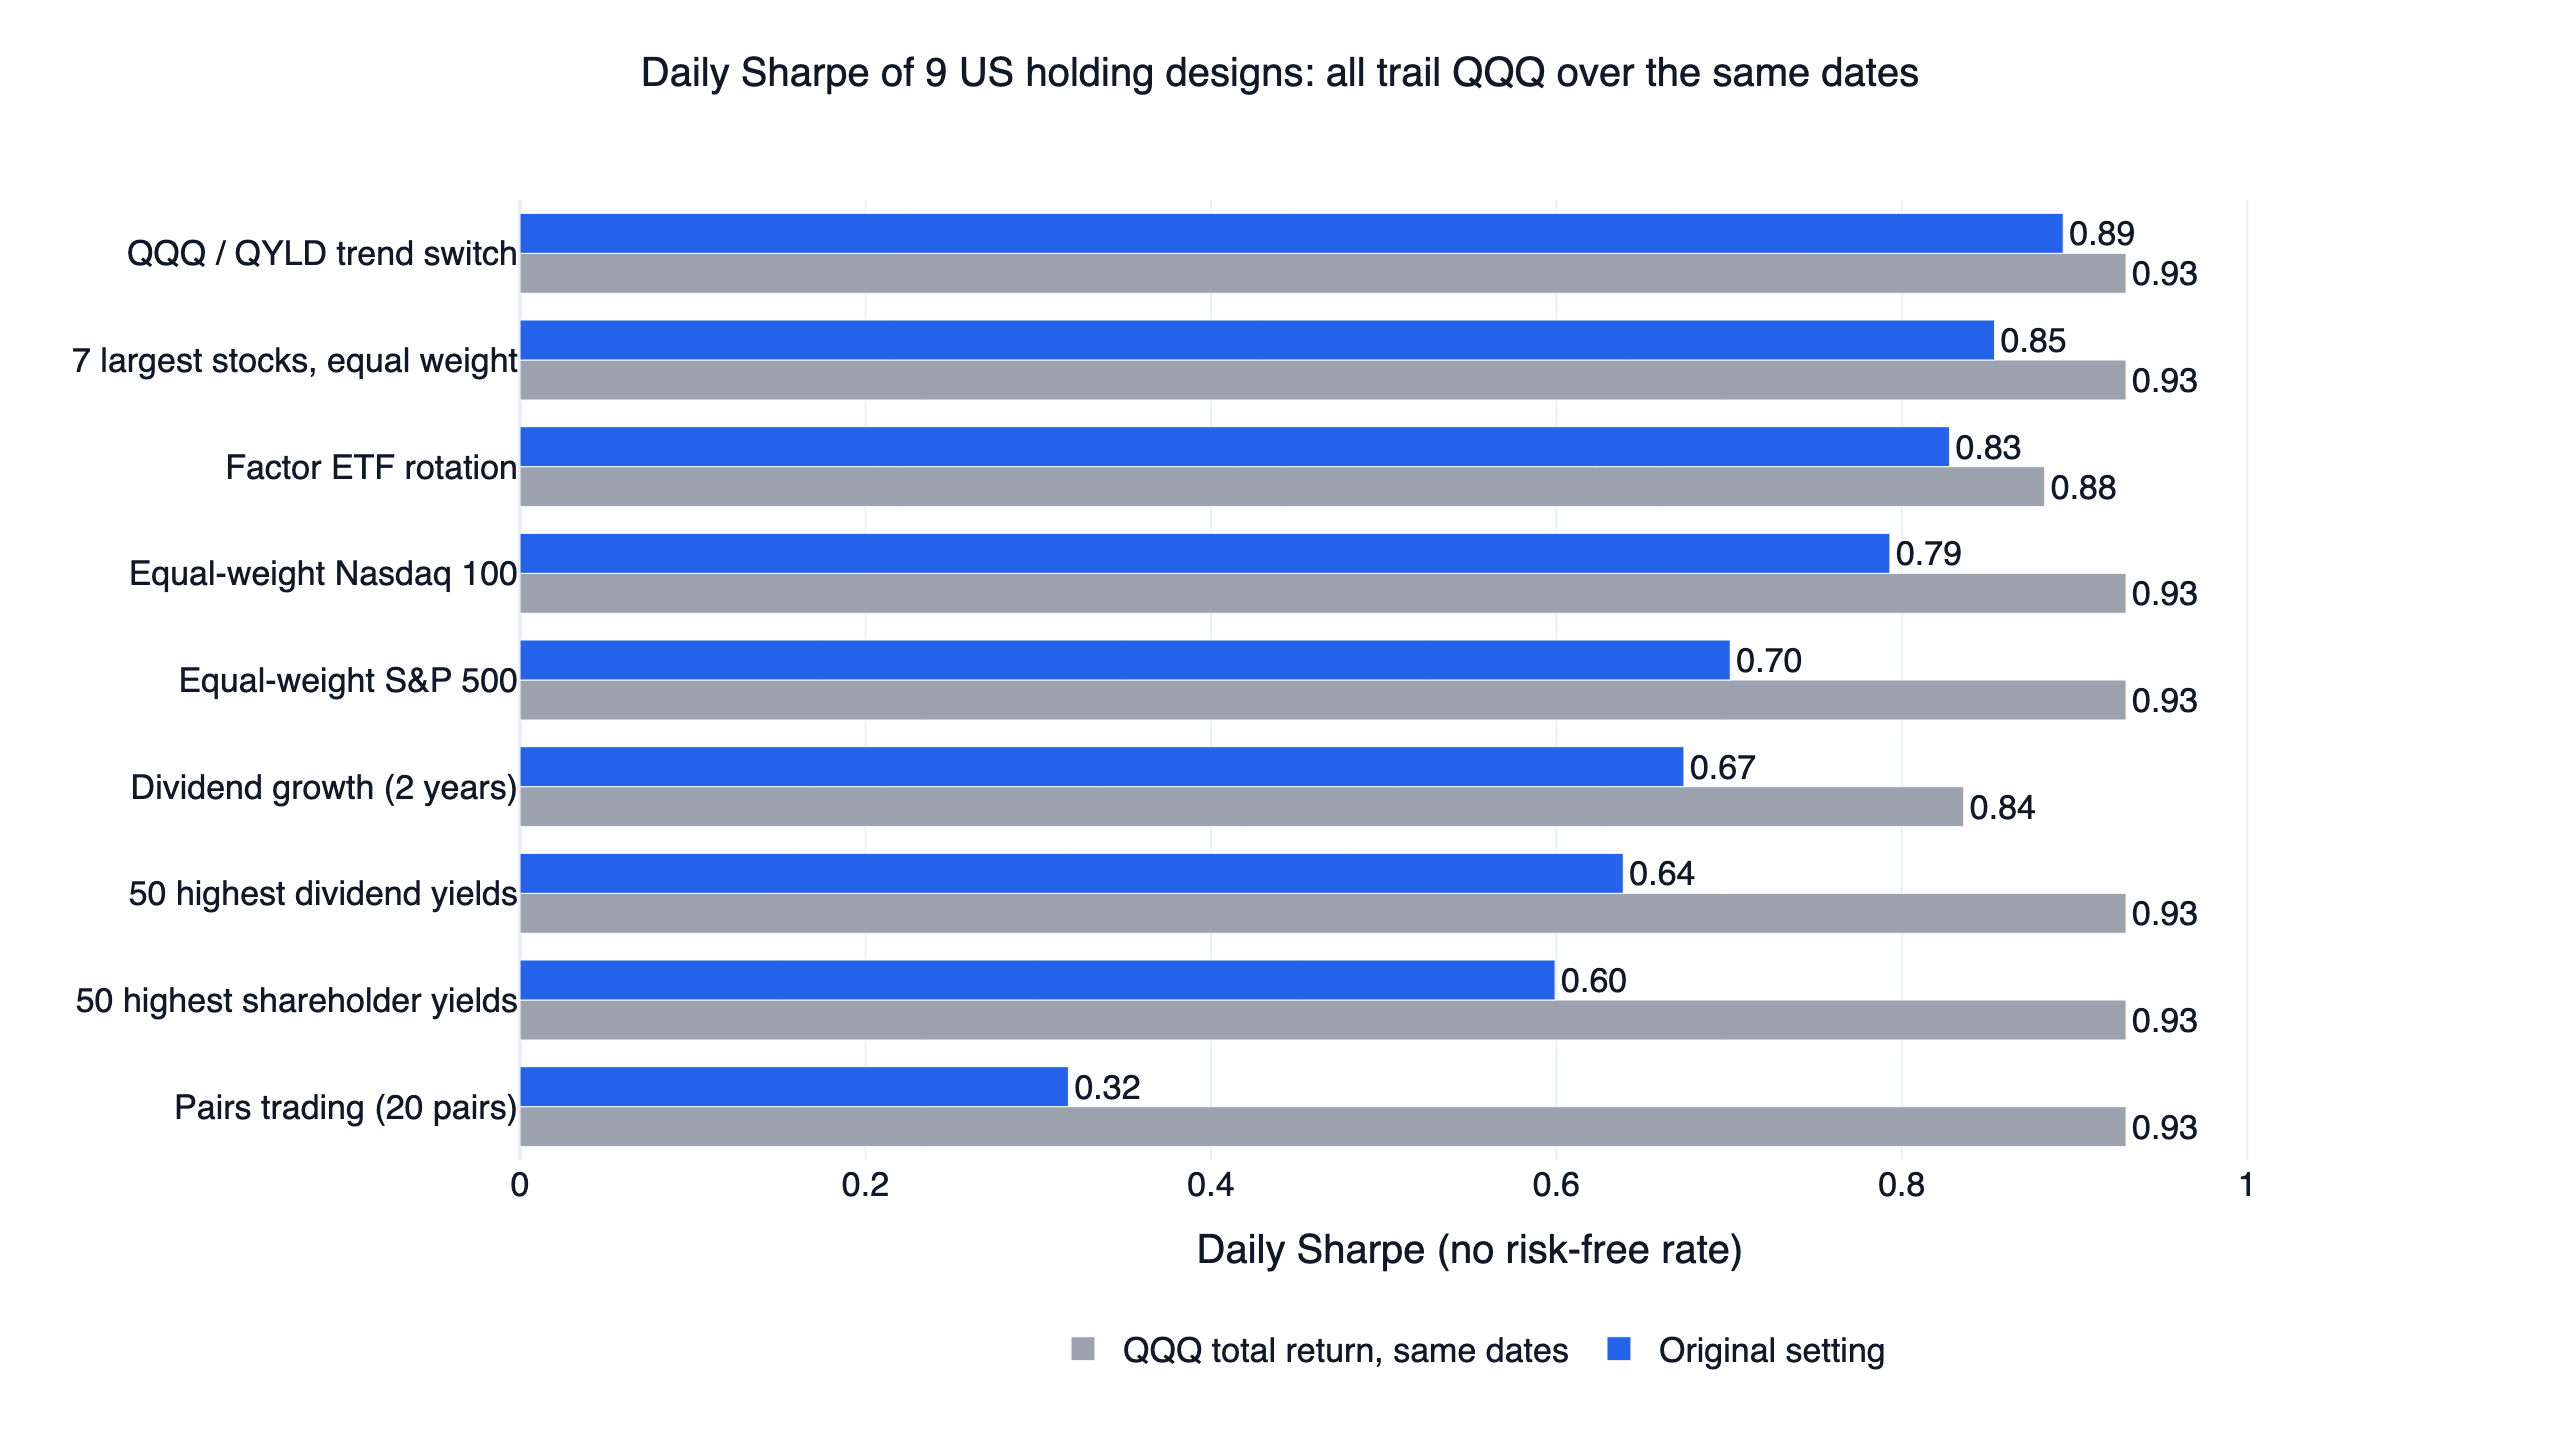
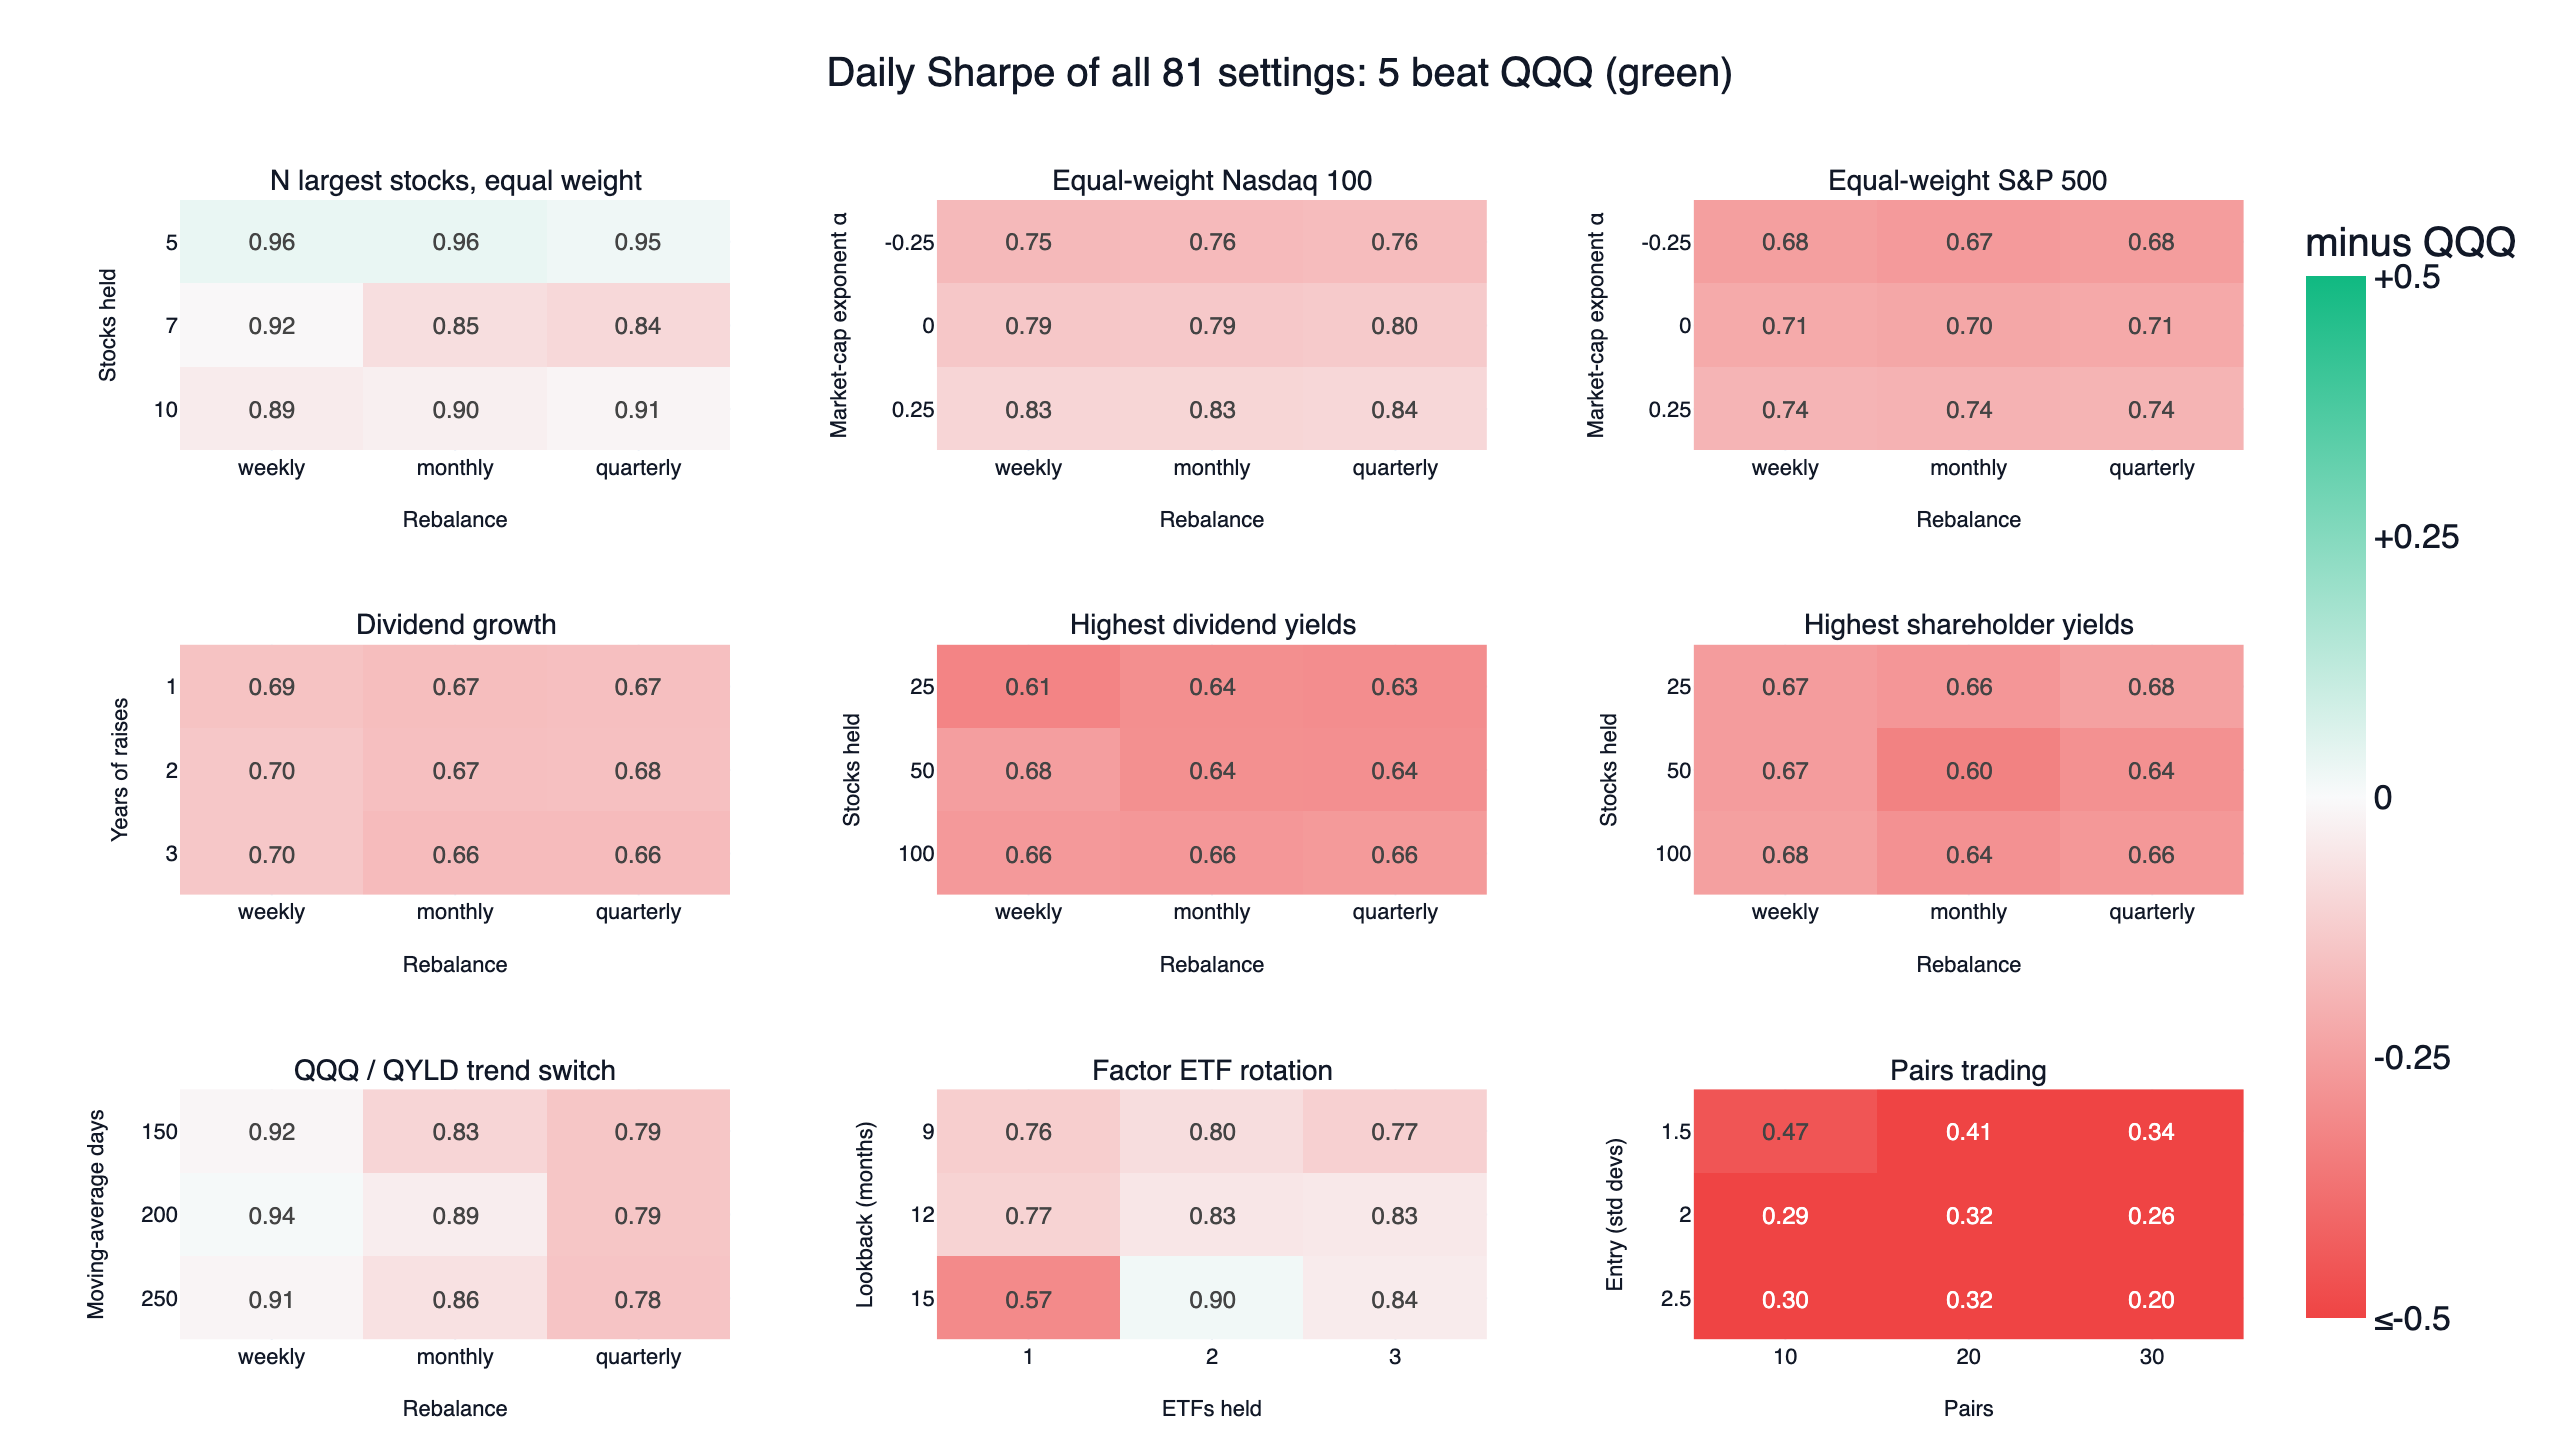
We backtested nine ways of holding US stocks and ETFs that differ from simply holding QQQ: the seven largest stocks, equal-weight Nasdaq 100 and S&P 500, dividend growth stocks, high dividend yield, shareholder yield, switching between QQQ and a covered call ETF (QYLD), factor ETF rotation, and pairs trading, all on point-in-time index membership. From January 2017 to October 2026, only 5 of the 81 parameter settings beat QQQ with dividends reinvested on daily Sharpe, and no design passed our three robustness checks. The smallest Sharpe gaps were the QQQ / QYLD trend switch (0.89 against 0.93 for QQQ) and factor ETF rotation (0.83 against 0.88 over its dates). Today's Magnificent 7 (Apple, Microsoft, Alphabet, Amazon, Nvidia, Meta, Tesla) held equally since 2017 returned 35.1% a year, but that list only existed from 2023. Picking the seven largest stocks each month, which an investor could actually do, returned 19.5% a year, slightly behind QQQ's 20.4%.
We also show the covered call ETFs on their own. Since its May 2020 launch JEPI has a daily Sharpe of 1.03 against QQQ's 0.89, but it returned 10.8% a year against 19.1%, and on returns above T-bills the two are level (0.76 each).
Key numbers
| Design (original setting) | Daily Sharpe | QQQ, same dates | CAGR | Max drawdown | Settings beating QQQ | First / second half Sharpe | Verdict |
|---|---|---|---|---|---|---|---|
| 7 largest S&P 500 stocks, equal weight | 0.85 | 0.93 | 19.5% | -45.2% | 3 / 9 | 1.27 / 0.49 | Fails |
| Equal-weight Nasdaq 100 | 0.79 | 0.93 | 15.7% | -31.5% | 0 / 9 | 1.08 / 0.50 | Fails |
| Equal-weight S&P 500 | 0.70 | 0.93 | 12.0% | -39.9% | 0 / 9 | 0.78 / 0.61 | Fails |
| Dividend growth, 2 years of raises (from 2020) | 0.67 | 0.84 | 12.0% | -39.2% | 0 / 9 | 0.42 / 1.27 | Fails |
| 50 highest dividend yields | 0.64 | 0.93 | 13.0% | -50.4% | 0 / 9 | 0.60 / 0.73 | Fails |
| 50 highest shareholder yields | 0.60 | 0.93 | 12.3% | -51.1% | 0 / 9 | 0.58 / 0.66 | Fails |
| QQQ above its 200-day average, otherwise QYLD | 0.89 | 0.93 | 17.7% | -28.6% | 1 / 9 | 1.17 / 0.60 | Fails |
| Factor ETF rotation, top 2 on 12 months (from 2017-05) | 0.83 | 0.88 | 14.4% | -33.9% | 1 / 9 | 0.74 / 0.95 | Fails |
| Pairs trading, 20 pairs at 2 standard deviations | 0.32 | 0.93 | 0.5% | -2.9% | 0 / 9 | 0.16 / 0.52 | Fails |
| QQQ buy and hold, dividends reinvested | 0.93 | 20.4% | -35.1% | benchmark | 1.25 / 0.62 |
The backtest starts with the first rebalance on 2016-12-30 (filled the next day) and runs to 2026-10-30. Dividend growth needs three years of dividend changes and starts on 2019-12-31; factor ETF rotation needs 15 months of returns and starts on 2017-04-28. QQQ is always bought and held over exactly the same dates, which is why its column changes slightly. The halves split on 2021-11-29 (2023-05-31 for dividend growth, 2022-01-27 for factor rotation).
How a design had to pass
Before running anything we fixed the definition and the neighbouring parameters of all nine designs, and nothing changed after we saw results. "Beats QQQ" means a higher daily Sharpe ratio than QQQ with dividends reinvested over the same dates. Daily Sharpe is the mean daily return divided by its standard deviation, times the square root of 252, with no risk-free rate deducted. A design had to pass all three checks:
- Neighbouring parameters: the original setting and one step either side on two parameters; at least 7 of the 9 settings beat QQQ.
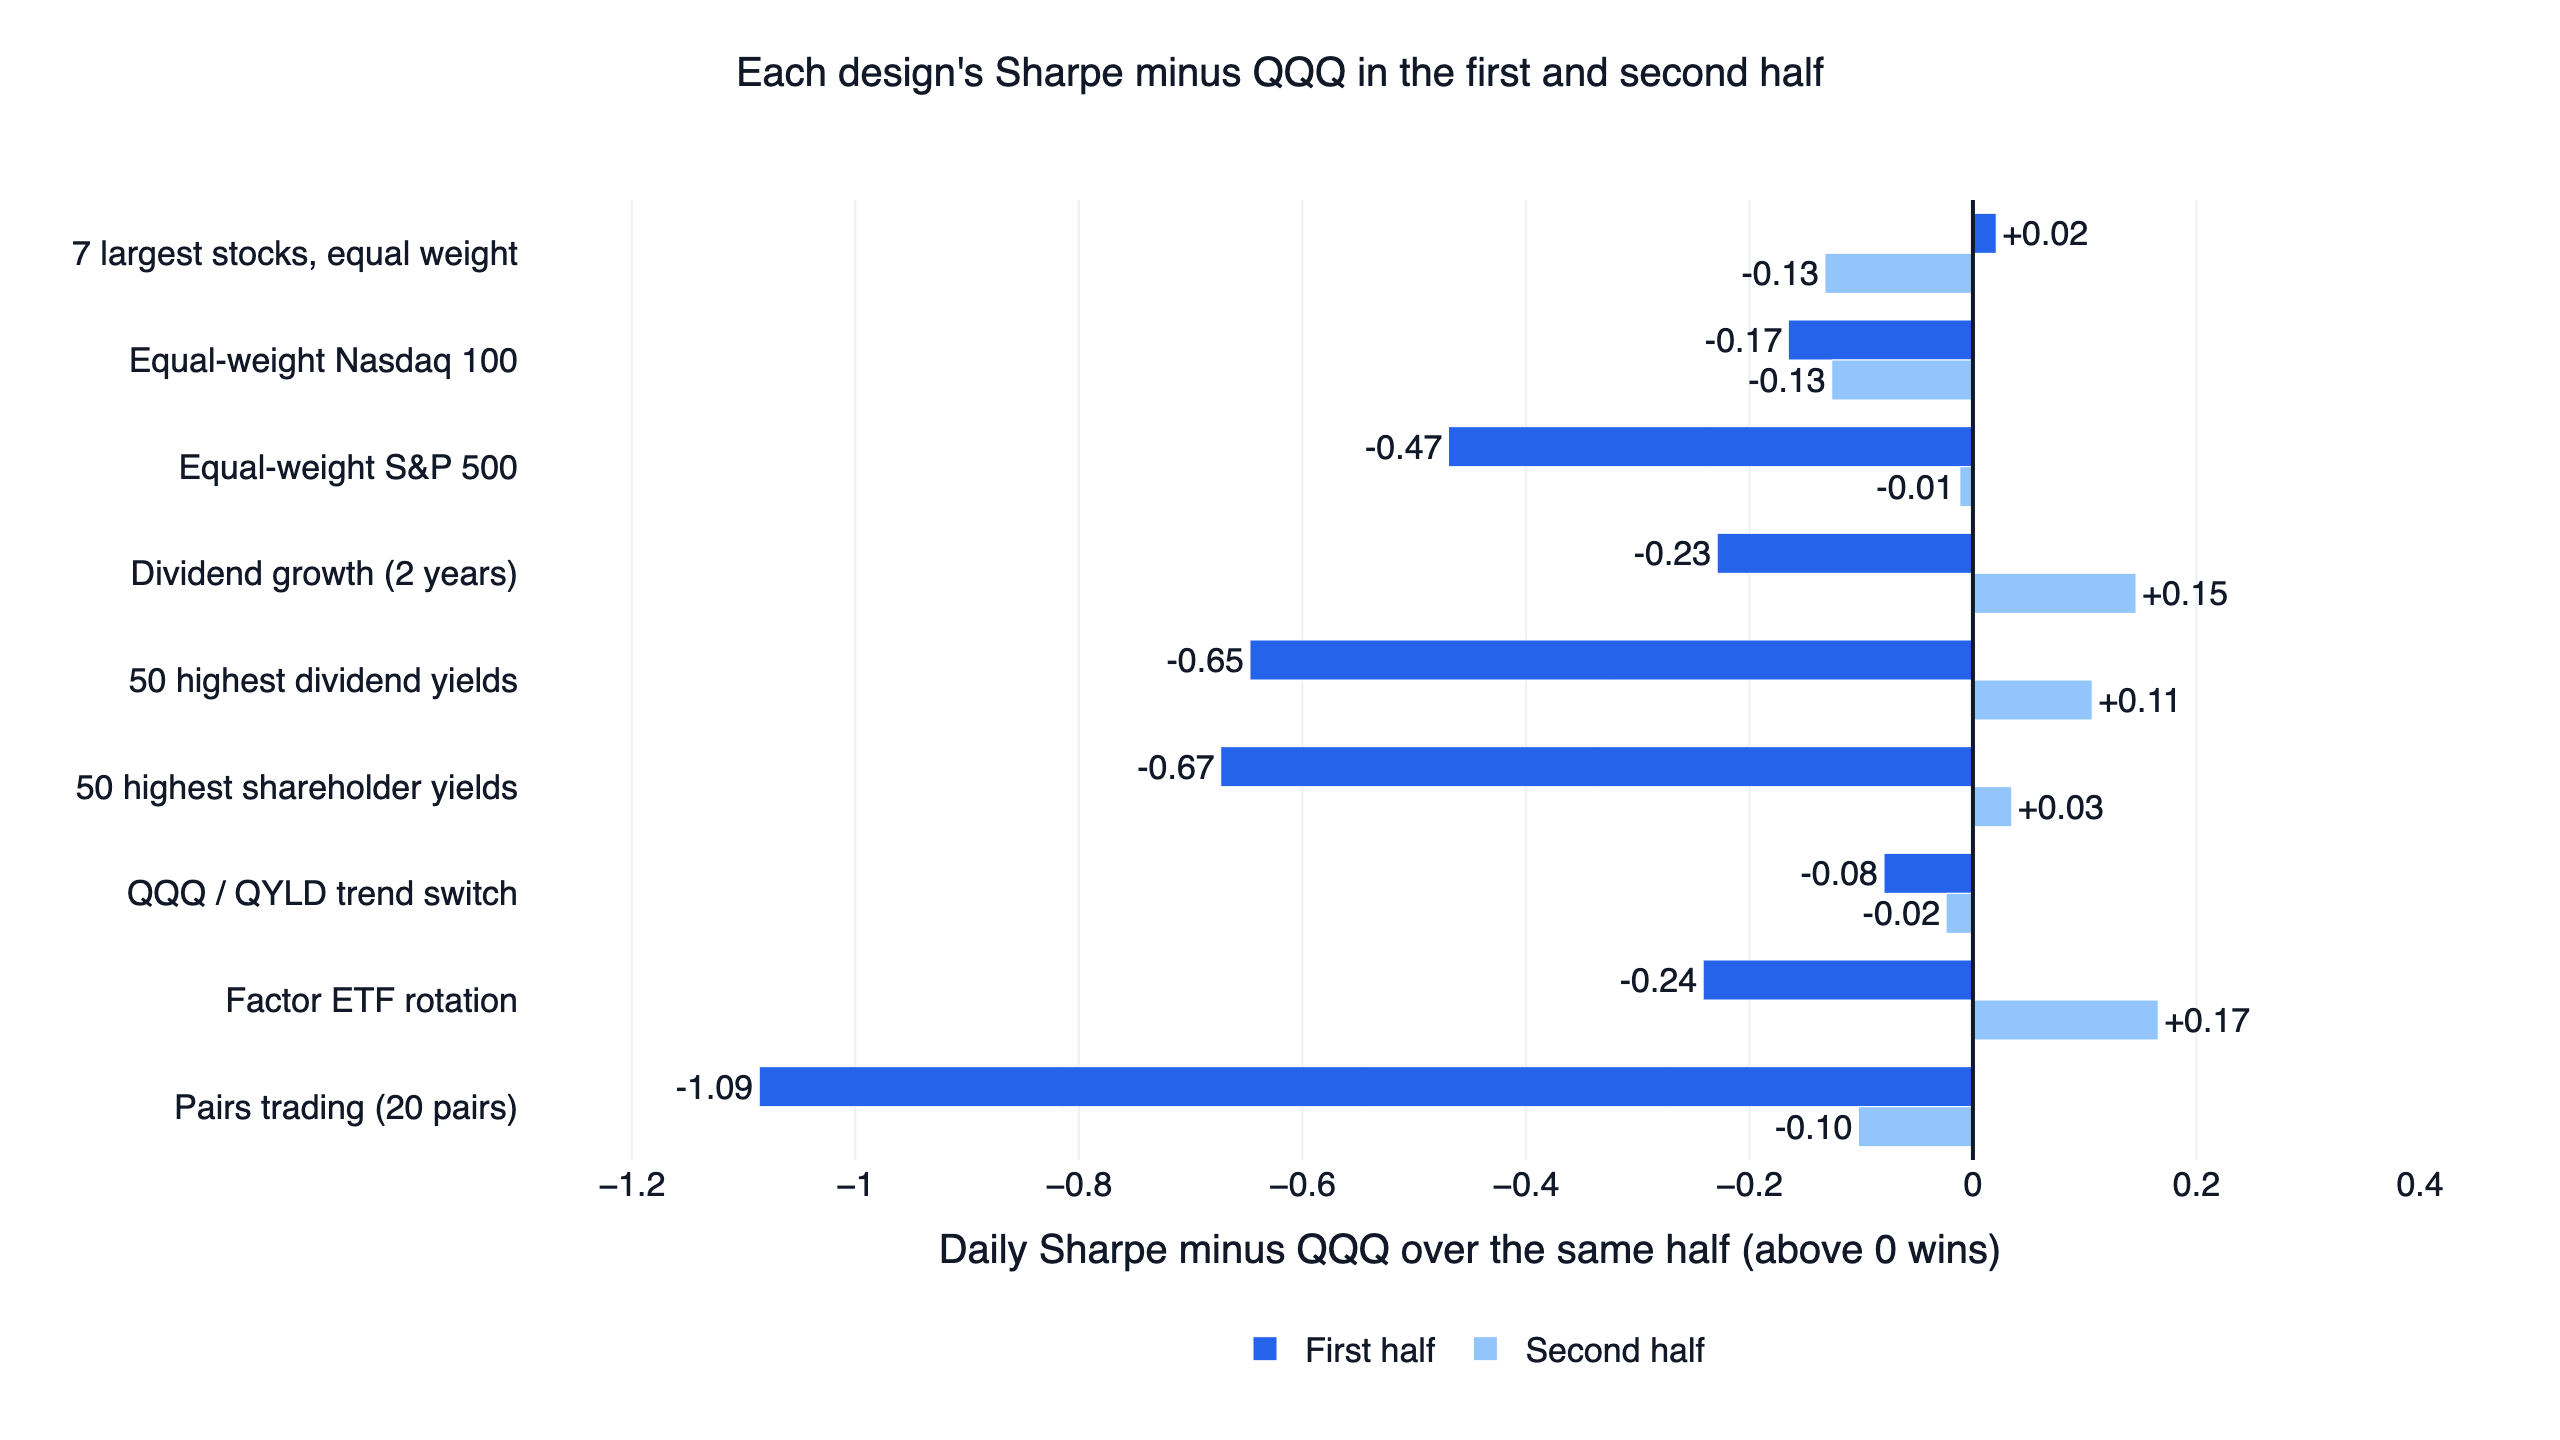
- Both halves: the original setting beats QQQ in the first and in the second half of the backtest.
- Trading costs: finlab's US default commission and tax are both zero, so we rerun the original setting paying 0.1% on every buy and every sell, and it still has to beat QQQ.
A design passing all three then faces two controls that separate the holding style from other effects: its Sharpe on returns above T-bills (BIL) must also beat QQQ's, and the two timing designs (the QQQ / QYLD switch and factor rotation) must beat the same assets held at their average weights. No design got that far this time, but here are the controls for comparison. On returns above T-bills the seven largest stocks score 0.76, the equal-weight Nasdaq 100 0.68, the equal-weight S&P 500 0.57, high yield 0.54, shareholder yield 0.50, the trend switch 0.78 and pairs trading -1.00, against 0.83 for QQQ; dividend growth scores 0.54 (QQQ 0.73 over its dates) and factor rotation 0.70 (QQQ 0.78). The fixed-weight controls for the two timing designs are in sections 5 and 6.
1. Mega-cap concentration: the 7 largest stocks track QQQ with deeper drawdowns
At every month end we take the N largest S&P 500 members by market value that day and hold them in equal weight until the next month end. Bessembinder (2018) found that the US stock market's long-run wealth creation comes from a small number of stocks and that most individual stocks fail to beat Treasury bills, which is the case for concentrating in the largest names.
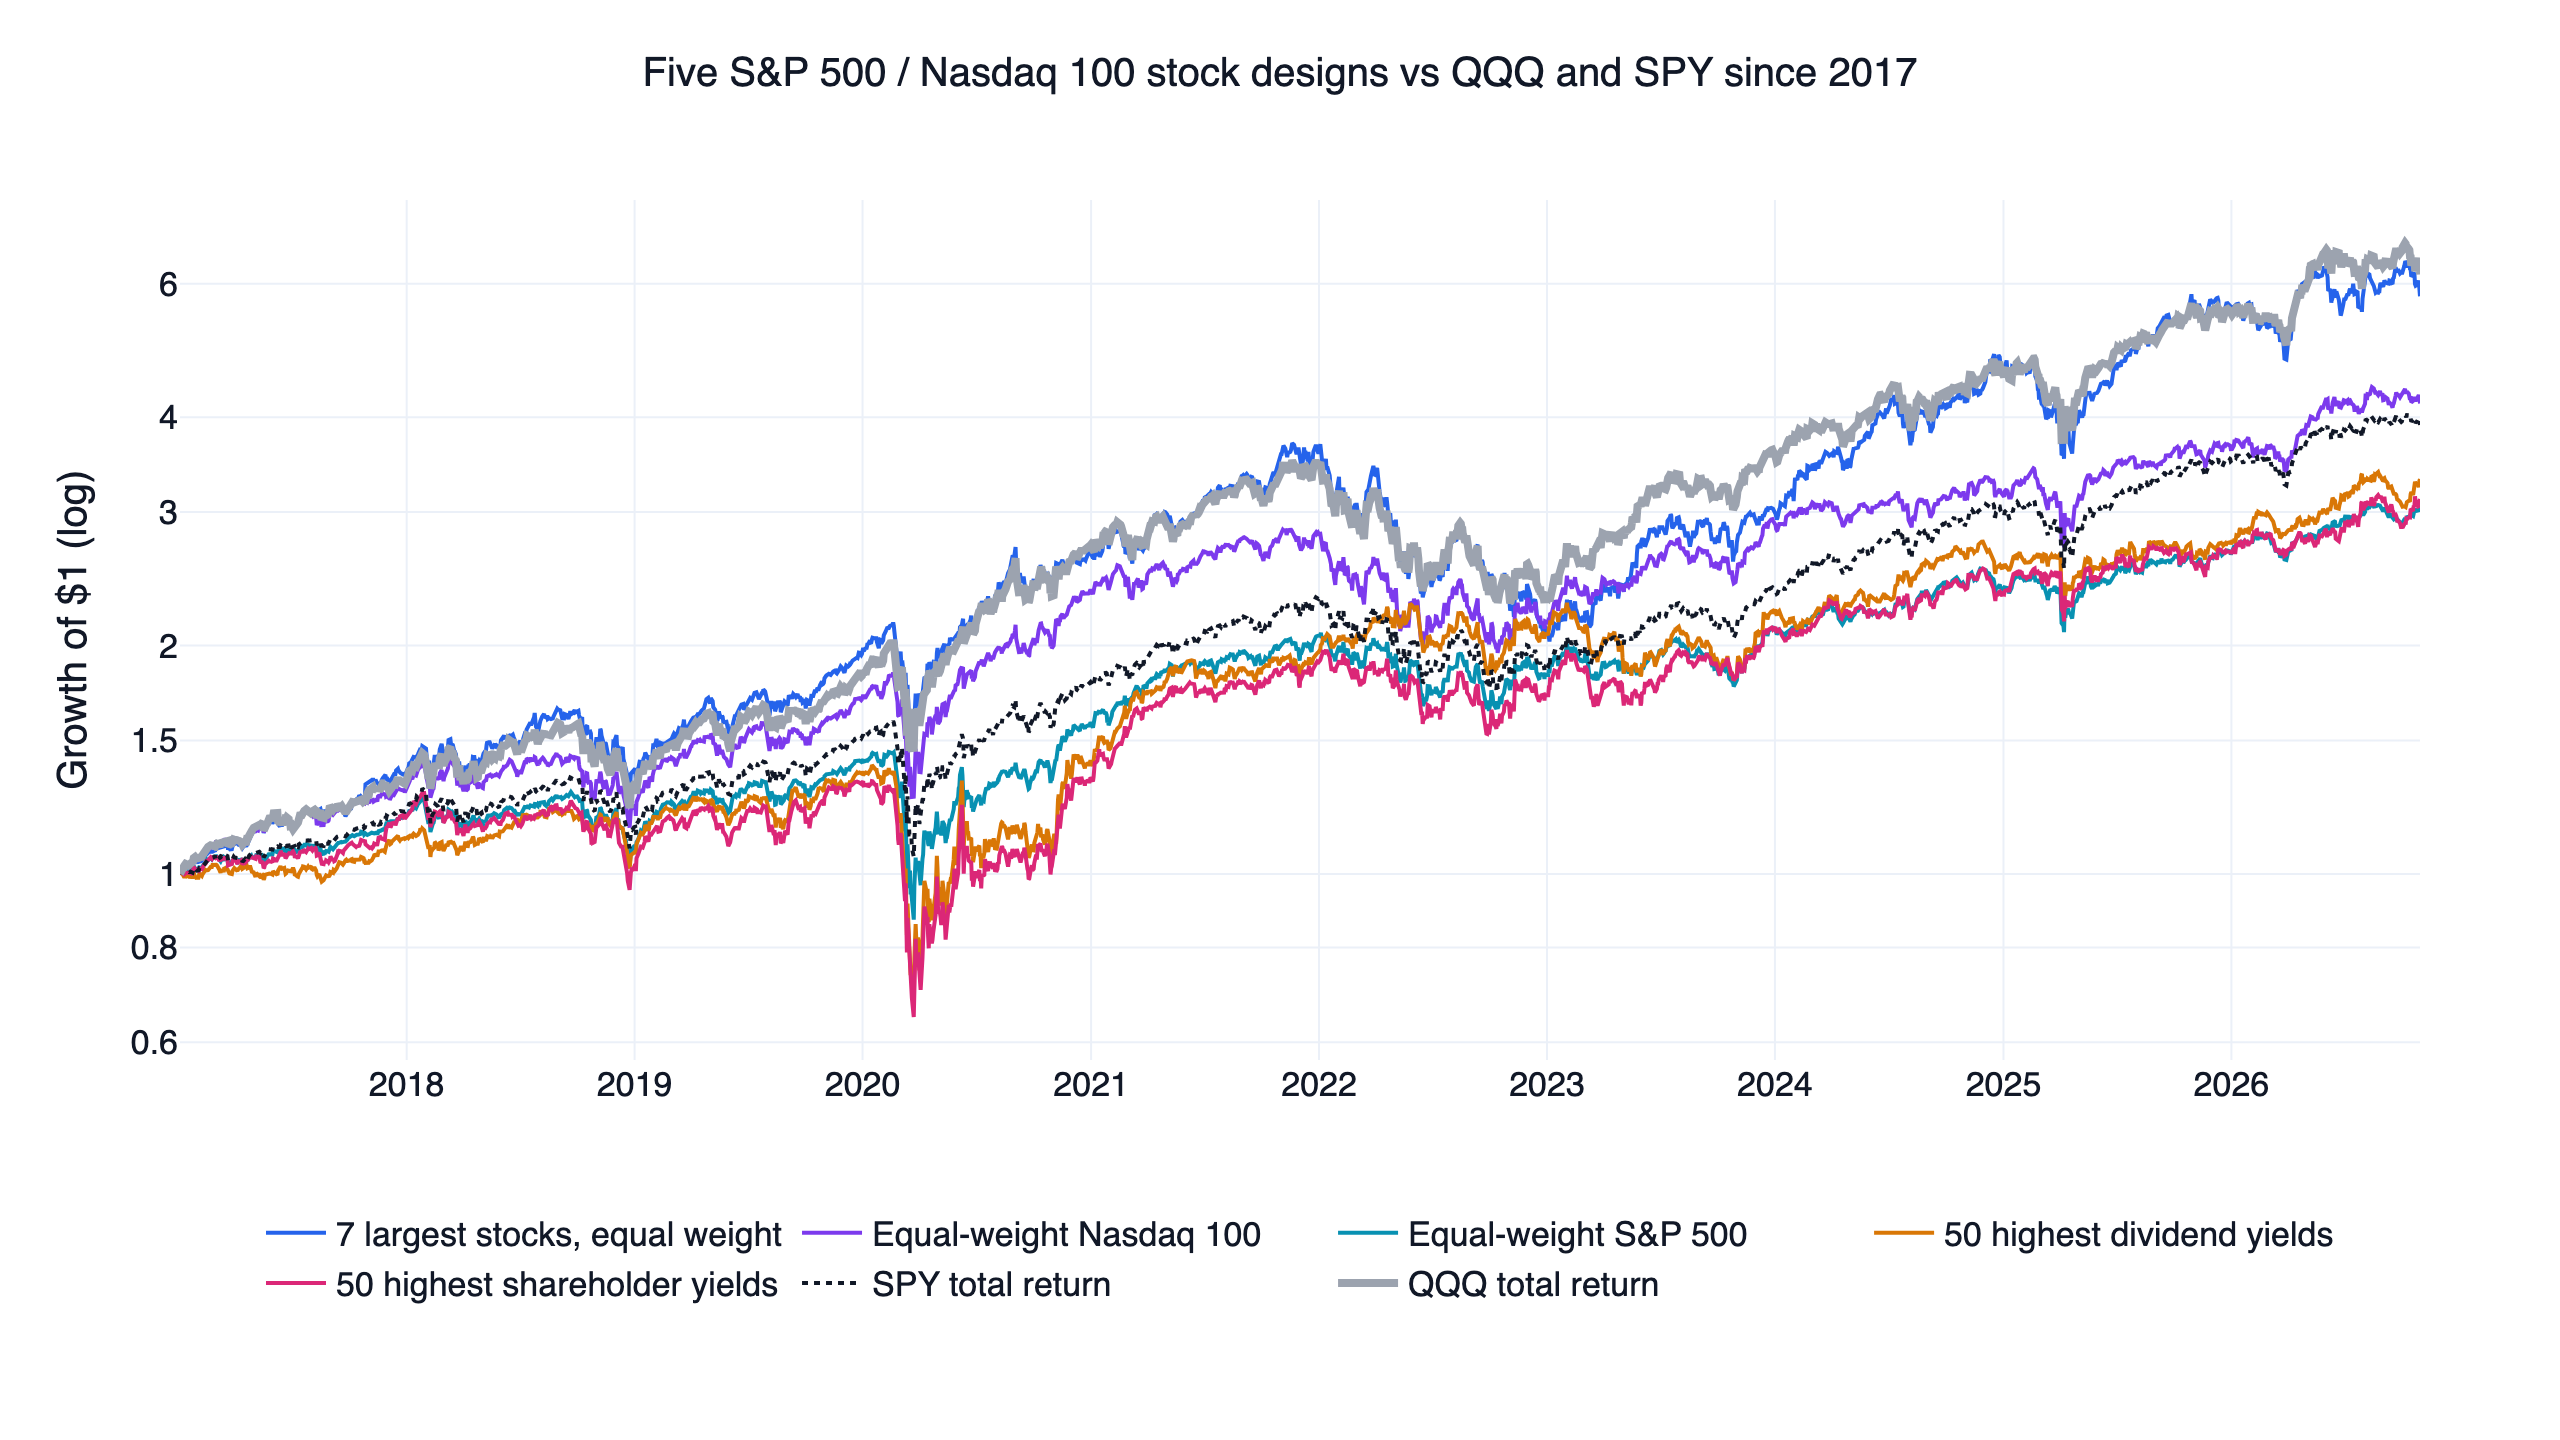
The original setting (top 7, monthly) returned 19.5% a year with a daily Sharpe of 0.85, annual volatility of 24.5% and a maximum drawdown of -45.2% between November 2021 and January 2023. It lost 41.0% in 2022 against QQQ's 32.6%. It edged QQQ in the first half (1.27 against 1.25) and lost in the second (0.49 against 0.62). Across 5, 7 and 10 stocks rebalanced weekly, monthly or quarterly, only the three top-5 settings won (0.95 to 0.96); all six top-7 and top-10 settings lost. Paying 0.1% per side leaves 0.85, and on returns above T-bills it scores 0.76 against QQQ's 0.83.
Over 119 month ends, Apple, Amazon, Alphabet and Microsoft were in the top 7 every time, Meta 103 times and Berkshire Hathaway 93 times. Nvidia made it 49 times and Tesla 38; the other slots went to Broadcom, Johnson & Johnson, Visa, JPMorgan, UnitedHealth and Exxon Mobil.
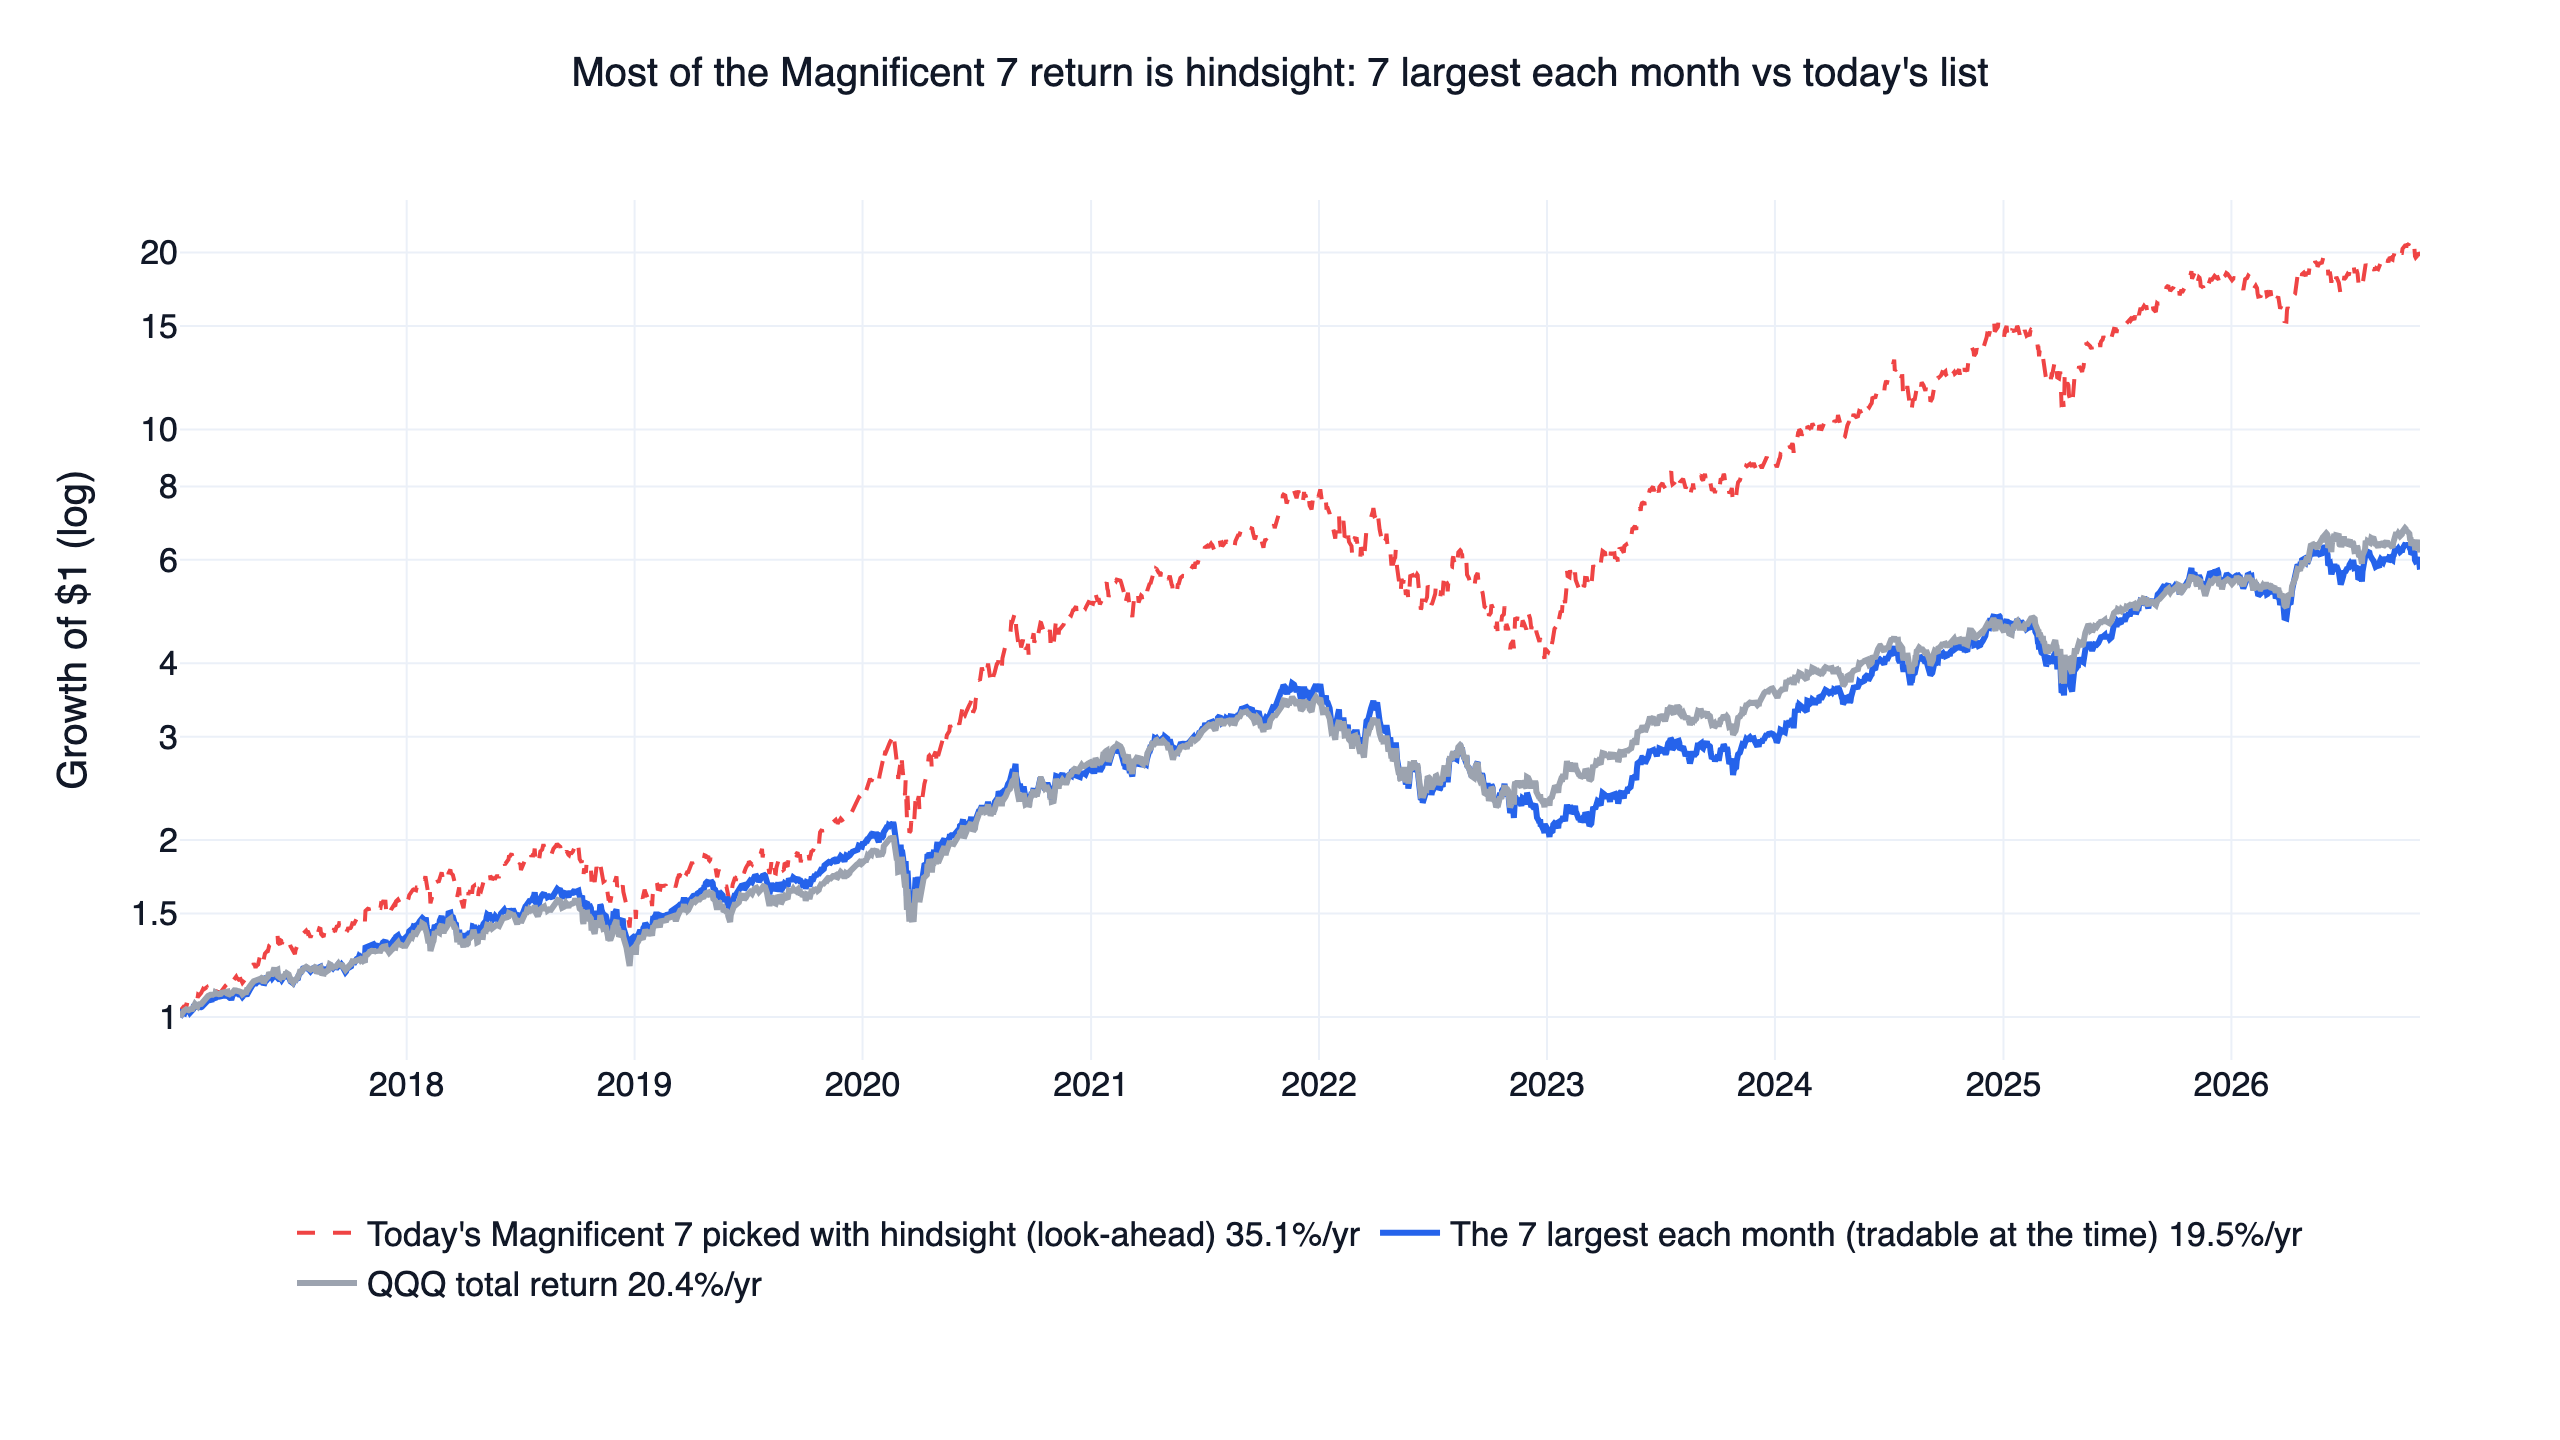
The "Magnificent 7" label dates from 2023. Holding today's seven names in equal weight from 2017, rebalanced monthly, returns 35.1% a year with a daily Sharpe of 1.18 and a -48.9% drawdown, far ahead of QQQ. An investor in 2017 could not have known that Nvidia and Tesla would become two of the largest companies; that is look-ahead bias. Choosing the seven largest by market value at the time drops the return to 19.5%, and the gap between the two lines is the value of hindsight. This comparison is an illustration only, not one of the tested designs.
2. Equal-weight Nasdaq 100 and S&P 500: they match RSP and QQQE, and trail QQQ
Here we hold every index member that day with weights proportional to market value raised to the power α: α = 0 is equal weight and α = 1 is the cap-weighted index itself. The neighbours are α = -0.25 (tilted further toward smaller members), 0 and 0.25 (tilted toward the largest), each rebalanced weekly, monthly or quarterly. DeMiguel, Garlappi and Uppal (2009) showed that naive 1/N weighting often matches optimised portfolios out of sample, the empirical case for equal weight; the question here is whether it beats cap-weighted QQQ.
The equal weight S&P 500 at its original setting scored a daily Sharpe of 0.70, returned 12.0% a year and drew down -39.9%. Over the same dates RSP, the equal weight S&P 500 ETF, scored 0.70, 11.7% and -39.0%, so the reconstruction lines up with the real fund. SPY, the cap-weighted index, scored 0.86 and 14.9%, and QQQ 0.93. In the RSP vs SPY comparison, SPY had the better risk-adjusted return over this window. The equal-weight Nasdaq 100 scored 0.79, 15.7% and -31.5%, against 0.74 and 14.3% for QQQE. All 18 settings lost to QQQ.
Both indices show the same pattern: the larger α (the closer to cap weight), the higher the Sharpe, from 0.75 to 0.84 for the Nasdaq 100 and from 0.67 to 0.74 for the S&P 500. Rebalancing frequency barely matters; at any one α the three frequencies sit within 0.02 of each other. From 2017 to 2026 returns concentrated in the largest companies, and spreading the weight evenly means owning less of the period's strongest stocks. In the second half (from 2021-11-29) the equal-weight S&P 500 scored 0.61 against QQQ's 0.62, close to level; in the first half it was 0.78 against 1.25. Our famous US stock screens backtest tested the equal-weight S&P 500 from a different start date and reached the same conclusion.
3. Dividend growth stocks: behind QQQ and behind VIG
At every month end we select the S&P 500 members whose trailing 12-month dividend per share (adjusted for splits) rose year over year in each of the last N years, and hold them all in equal weight. FinLab's US dividend history starts in 2016, and comparing three years of changes needs the 2016 dividends, so this design starts on 2019-12-31 and N can go up to three years at most. The dividend aristocrats rule asks for 25 years of raises, which this data cannot test, and the aristocrats ETF (NOBL) only has prices in FinLab's data from September 2026.
The original setting (two years of raises) held about 291 stocks on average and scored a daily Sharpe of 0.67, with 12.0% a year and a -39.2% drawdown, against 0.84, 19.3% and -35.1% for QQQ. With N of 1, 2 or 3 years and three rebalancing frequencies, all 9 settings landed between 0.66 and 0.70 and all lost; asking for more years of raises did not help. It lost the first half (2020-01 to 2023-05, 0.42 against 0.65) and won the second (1.27 against 1.13). Over the same dates the dividend growth ETFs VIG (0.76) and DGRO (0.73) and SPY (0.79) all did better than this version.
The classic study of dividend changes is Michaely, Thaler and Womack (1995): after a company starts or stops paying dividends, its share price keeps drifting in the same direction over the following year, so dividend changes carry information about the business. A string of raises is a milder dividend signal, and this design tests whether it earns an excess return inside the S&P 500. Consecutive raises mostly pick mature companies with steady cash flow, and from 2020 those companies trailed technology stocks. The dividend growth screen in our famous stock screens backtest passed from 2021 but failed from other start dates; read together with this 2020 start, the result for dividend growth stocks depends mainly on where the backtest begins.
4. High dividend stocks and shareholder yield: drawdowns above 50%
For high dividend stocks we take, at every month end, the K S&P 500 members with the highest trailing 12-month dividend yield (split-adjusted dividends per share divided by price), in equal weight. Litzenberger and Ramaswamy (1979) found that higher-yielding stocks earn higher pre-tax returns, which they explained as compensation for the tax on dividends.
The original setting (top 50, monthly) scored a daily Sharpe of 0.64, returned 13.0% a year and drew down -50.4%. With 25, 50 or 100 stocks and three rebalancing frequencies, the best was 50 stocks rebalanced weekly at 0.68; all 9 lost to QQQ's 0.93. Over the same dates the high dividend ETFs HDV and SCHD scored 0.71 and 0.83. The high-yield portfolio made only 3.5% in 2020 (QQQ 48.6%) and 5.5% in 2022 (QQQ -32.6%), so it won the second half (0.73 against 0.62) and lost the first by a wide margin (0.60 against 1.25).
Shareholder yield adds buybacks: common dividends plus net share repurchases (buybacks minus issuance) over the last four quarters, divided by market value. Boudoukh, Michaely, Richardson and Roberts (2007) found that this payout yield predicts returns better than dividend yield alone. The original setting (top 50) scored 0.60, returned 12.3% a year and drew down -51.1%; its 9 settings ranged from 0.60 to 0.68 and all lost. Our 17 US large-cap factors backtest tested shareholder yield in another universe and it also trailed QQQ.
A high yield is often the result of a falling share price. Both designs hit their maximum drawdown between January and 23 March 2020, while QQQ's came in 2022.
5. Covered call ETFs: QYLD, XYLD, JEPI and JEPQ against QQQ
A covered call strategy holds stocks and sells call options on them for the premium. The premium smooths returns, and the cost is giving away the upside in strong rallies. Whaley (2002) found that the CBOE S&P 500 BuyWrite Index (BXM) earned close to the S&P 500's return from 1988 to 2001 with about two-thirds of its volatility. Israelov and Nielsen (2015) split a covered call into equity exposure, short volatility and a timing position that sells into rallies, and argued that the last part drags returns over time.
Holding a covered call ETF has no parameter to vary, so it is not put through the three checks; it is shown as a reference. JEPI and JEPQ are measured from the first month end after launch. QYLD and XYLD listed in 2013, but FinLab's prices start in 2016, so they are measured from January 2016. Each is compared with QQQ over the same dates:
| ETF (start) | Daily Sharpe | QQQ | Above T-bills | QQQ | CAGR | QQQ | Max drawdown |
|---|---|---|---|---|---|---|---|
| QYLD (2016-01) | 0.69 | 0.94 | 0.55 | 0.84 | 9.9% | 20.1% | -24.7% |
| XYLD (2016-01) | 0.70 | 0.94 | 0.54 | 0.84 | 9.1% | 20.1% | -33.4% |
| JEPI (2020-05) | 1.03 | 0.89 | 0.76 | 0.76 | 10.8% | 19.1% | -13.7% |
| JEPQ (2022-05) | 0.99 | 0.97 | 0.73 | 0.78 | 15.9% | 20.8% | -20.1% |
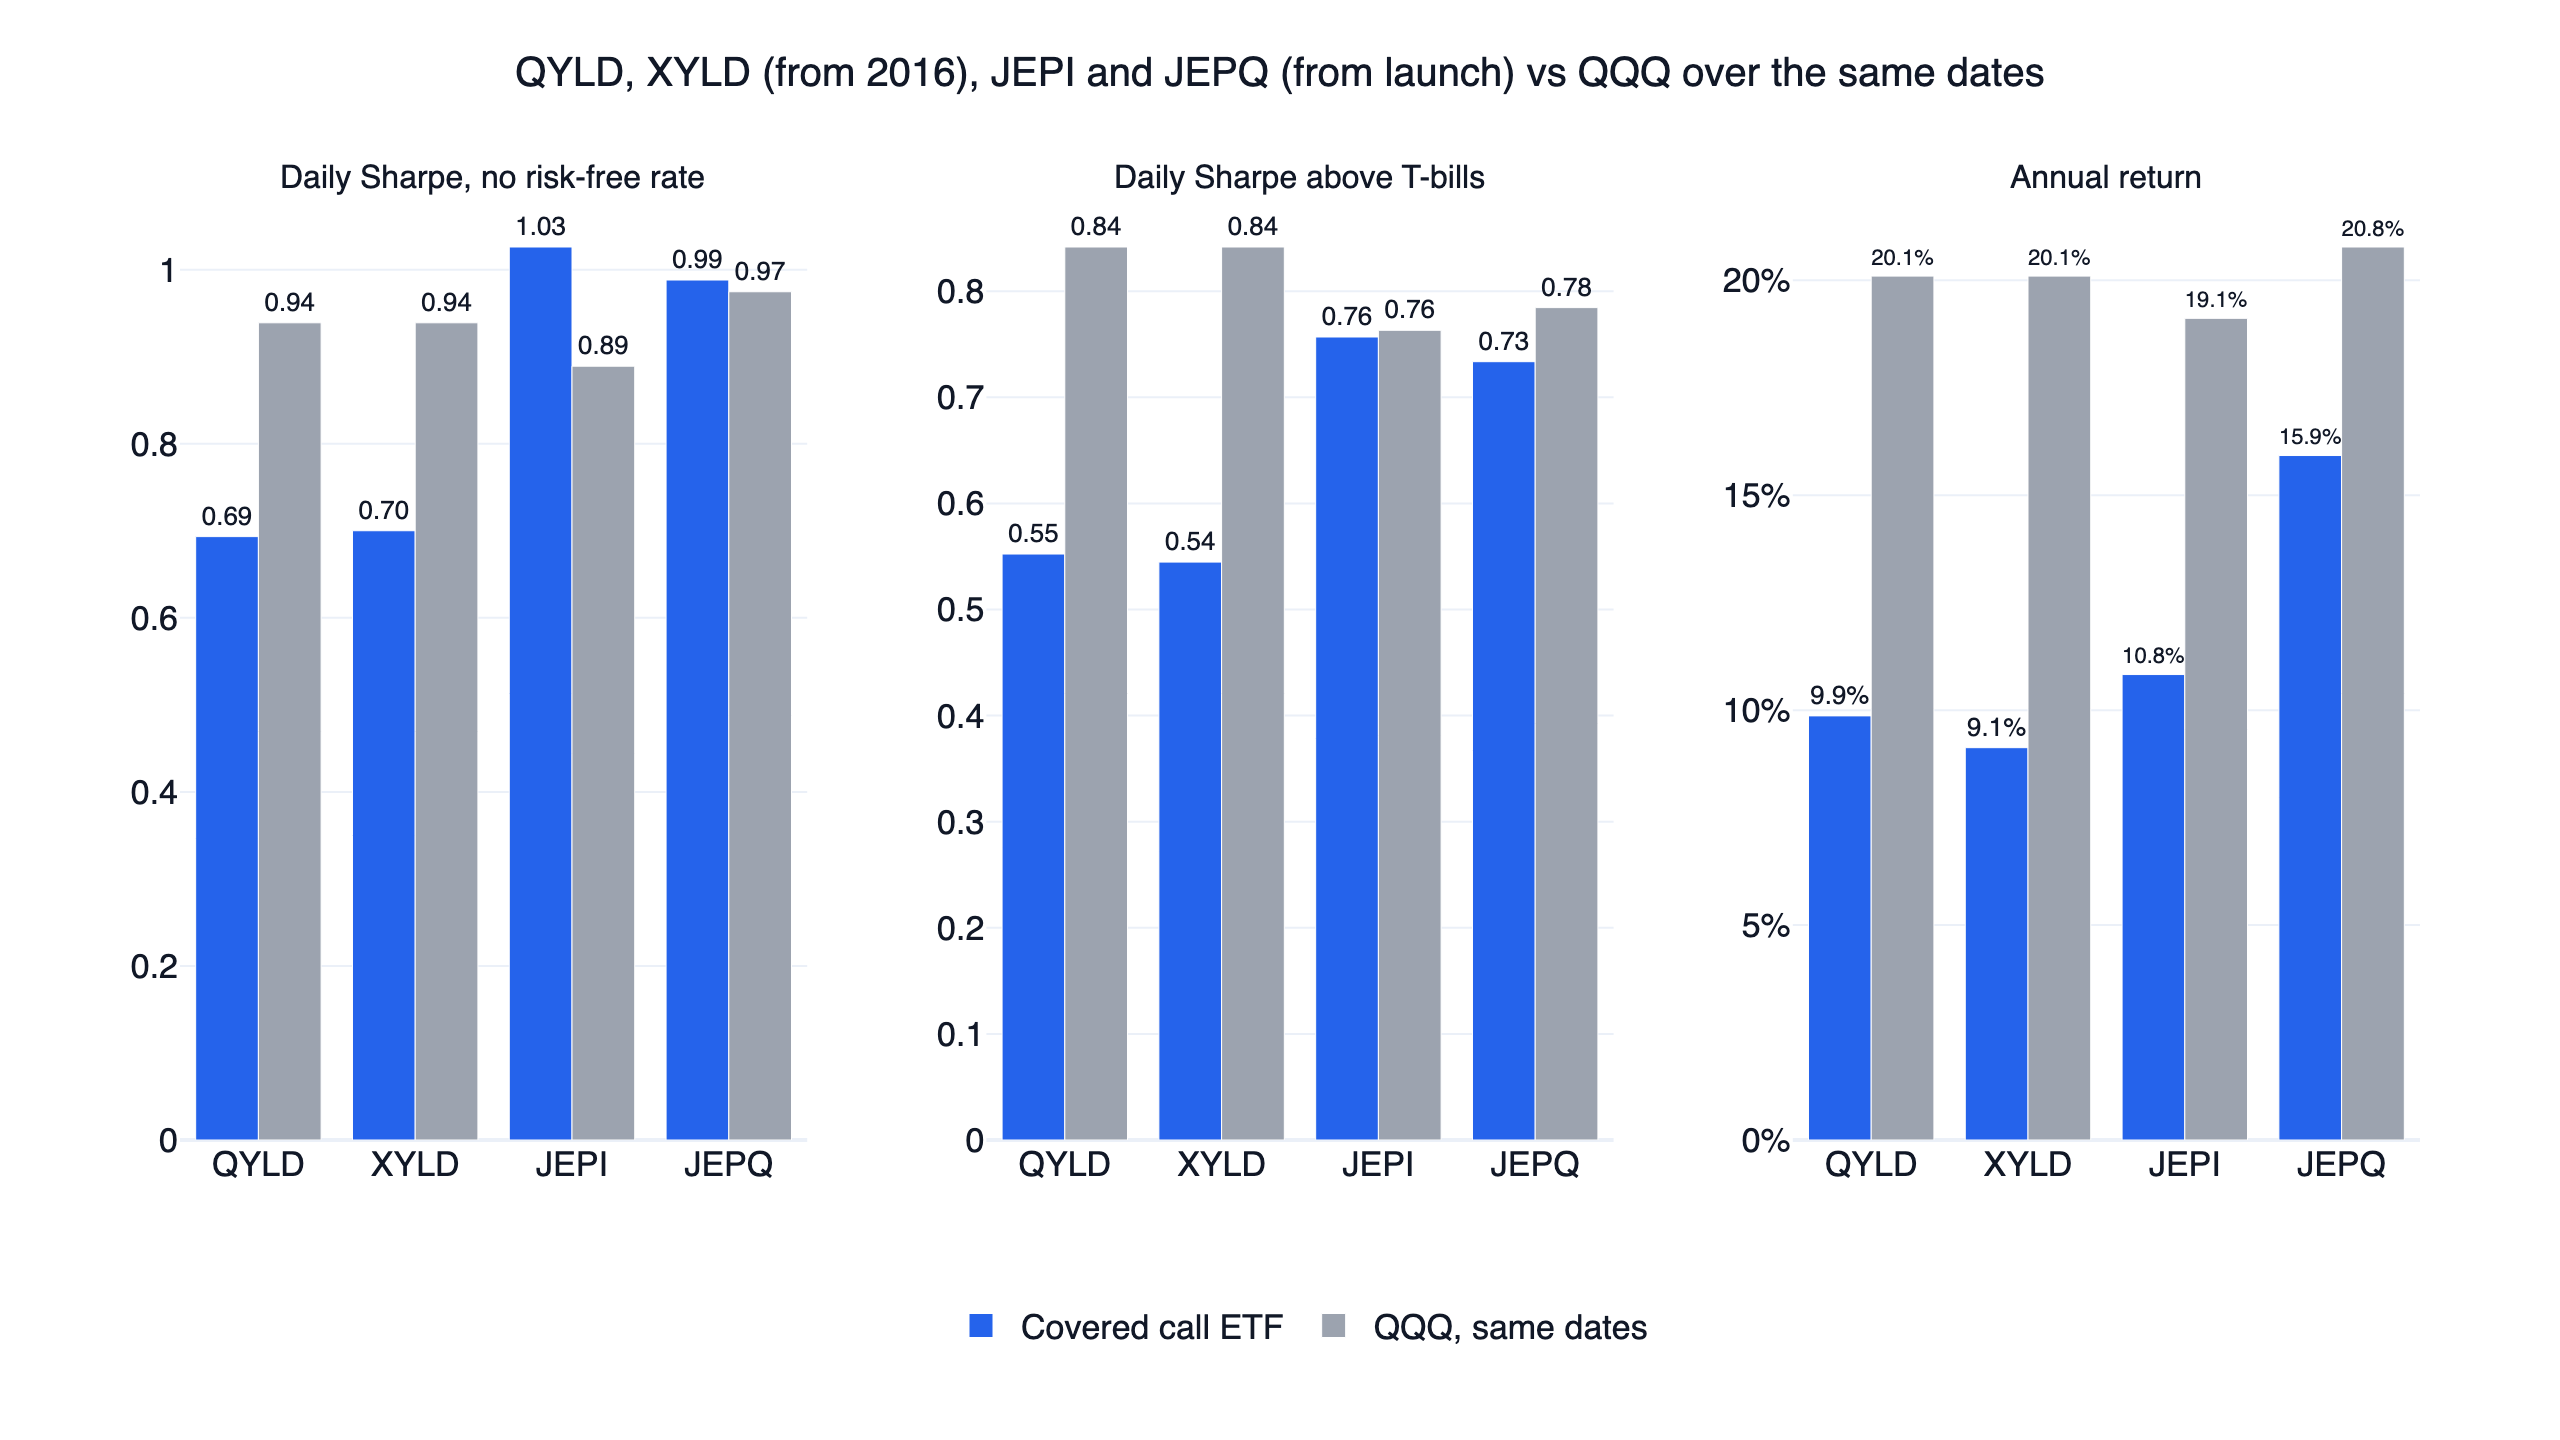
QYLD and XYLD sell at-the-money calls on the whole index every month and returned less than half of QQQ's annual return. In 2023 QQQ gained 54.9% and QYLD 22.7%. JEPI and JEPQ look ahead of QQQ on daily Sharpe because they are less volatile: JEPI's annual volatility was only 10.6%. Treasury bill yields were not low over this period, and a Sharpe ratio with no risk-free rate flatters low-volatility assets. On returns above T-bills JEPI scores 0.757 against QQQ's 0.763 and JEPQ 0.73 against 0.78, so neither wins. JEPI won the first half of its history (May 2020 to August 2023, 1.10 against 0.73) and lost the second (0.94 against 1.08).
JEPI vs JEPQ
JEPI holds lower-volatility S&P 500 stocks and JEPQ holds Nasdaq 100 stocks; both sell calls through equity-linked notes. In the full calendar years both existed, JEPI returned 9.8% in 2023 against 36.2% for JEPQ, 12.6% against 24.9% in 2024, and 8.1% against 15.2% in 2025; 2026 to the end of October is 6.8% against 8.3%. JEPQ rises and falls with the Nasdaq 100: from its May 2022 launch to year end it lost 12.9%, while JEPI lost 3.5% over all of 2022. Taxes on the distributions are not in the backtest for either fund. Against QQQ since JEPQ's launch: 15.9% a year against 20.8%, with a maximum drawdown of -20.1% against -22.8%.
The trend switch: QYLD when QQQ weakens
This is the design under test in this section: hold QQQ while it closes above its own L-day moving average and switch to QYLD when it falls below. The original setting (200-day average, checked monthly) returned 17.7% a year with a daily Sharpe of 0.89 and a -28.6% drawdown; in 2022 it lost 21.7% against QQQ's 32.6%. Of 150, 200 and 250-day averages checked weekly, monthly or quarterly, only the 200-day average checked weekly beat QQQ (0.938 against 0.930), and the three quarterly settings scored just 0.78 to 0.79. QYLD was held in about 17% of months, and holding a fixed 83% QQQ and 17% QYLD scores 0.91, more than the switching rule, so the switch adds nothing.
6. Factor ETF rotation: rotating trails holding all four
We planned to use iShares MTUM (momentum), QUAL (quality), USMV (minimum volatility) and VLUE (value), but FinLab's data only has prices for those four from 2026-09-08. We used Invesco's S&P 500 factor ETFs instead, which have full history: SPMO (momentum), SPHQ (quality), SPLV (low volatility) and RPV (pure value). At every month end we hold the k funds with the best L-month return in equal weight. Asness, Moskowitz and Pedersen (2013) found momentum across asset classes, and Ehsani and Linnainmaa (2022) found that factors themselves have momentum: factors that paid off recently tend to keep paying.
The original setting (12 months, top 2) returned 14.4% a year with a daily Sharpe of 0.83 and a -33.9% drawdown, against 0.88 and 19.4% for QQQ. Over lookbacks of 9, 12 and 15 months and 1, 2 or 3 funds, only 15 months with the top 2 won (0.90), while 15 months with only the top fund was the worst at 0.57, so there is no plateau. Holding the four funds at their average weights (SPMO 33%, SPHQ 29%, SPLV 15%, RPV 22%) scores 0.85, above the rotation. SPMO on its own scored 0.92 over the same dates with 19.1% a year, slightly ahead of QQQ's 0.88; measured from January 2017 it is 0.930 against 0.934, a small loss, so that edge depends on the start date.
7. Pairs trading: too little return to survive costs
We followed the distance method of Gatev, Goetzmann and Rouwenhorst (2006). Every six months, using the last 252 trading days, we find the P pairs of same-sector S&P 500 stocks whose normalised prices stayed closest. Over the next six months, when a pair's spread moves more than z formation-period standard deviations, we buy the laggard and short the leader, and close when the spread crosses zero or the six months end. Each leg takes 1/(2P) of the account.
The original setting (20 pairs, 2 standard deviations) returned 0.5% a year with a daily Sharpe of 0.32 and a -2.9% drawdown, at an annual volatility of just 1.8%: on average only about 15.6 legs were open out of a possible 40, so most of the capital sat idle. Over z of 1.5, 2 and 2.5 and 10, 20 or 30 pairs, the best was 1.5 standard deviations with 10 pairs at 0.47, and all 9 lost. Paying 0.1% per side turns the return to -0.1% a year and the Sharpe to -0.03. The method was very profitable in the paper's 1962-2002 sample, but Do and Faff (2010) extended the sample to 2009 and found its profits declining over time; this large-cap test from 2017 is weaker still. The backtest charges no stock borrow fee and pays no interest on idle cash or short proceeds.
Both halves
Only the seven largest stocks won the first half (1.27 against 1.25), and they lost the second. Dividend growth, high yield, shareholder yield and factor rotation won the second half and lost the first: these four fell furthest behind in 2020 (QQQ 48.6%, they 1.4% to 18.5%) and lost less than QQQ in the 2022 bear market. The equal-weight S&P 500 and the QQQ / QYLD switch were close to level in the second half (-0.01 and -0.02). No design won both halves.
What this result does and does not say
- From 2017 to 2026 QQQ's return was concentrated in the largest technology stocks. Holding styles that spread weight away from them, such as equal weight, dividends, value and low volatility, all trailed QQQ, and the more they spread (the smaller α), the worse they did.
- Most of the Magnificent 7's headline return comes from picking the names afterwards. Holding the seven largest stocks at the time earned about what QQQ did, with a deeper drawdown.
- Covered call ETFs cut drawdowns at a large cost in return: QYLD and XYLD earned less than half of QQQ's annual return, JEPI over 40% less and JEPQ about a quarter less. The higher Sharpe of JEPI and JEPQ before deducting a risk-free rate disappears once T-bill returns are taken out.
- This study does not cover data before 2016, the 25-year dividend aristocrats rule, taxes on dividends and capital gains, stock borrow fees, or other factor ETF families. The conclusion is limited to these nine designs and this period.
The code
The core of the seven-largest design: take that day's S&P 500 members, pick the seven largest by market value and rebalance monthly.
Show Code
import finlab
from finlab import data
from finlab.backtest import sim

finlab.login()  # finlab guides you through login
data.set_market("us")

# 1. S&P 500 members on each day (point-in-time, including later removals)
members = data.get("us_index_constituents:sp500")
members = members.drop(columns=["GOOGL"])  # one share class per company: keep GOOG

# 2. The 7 members with the largest market value
market_value = data.get("etl:us_market_value")
top7 = market_value[members].is_largest(7)

# 3. Rebalance on the last trading day of each month, equal weight, fill at the next close
report = sim(top7.loc["2016-12-30":], resample="M", trade_at_price="close", upload=False)

# 4. Daily Sharpe ratio (no risk-free rate)
returns = report.creturn.pct_change().dropna()
print(round(returns.mean() / returns.std() * 252 ** 0.5, 2))
With data through 2026-10-30 this prints 0.85, the same as the original setting in research.py. The full research.py covers all nine designs, 81 neighbouring settings, both halves, the cost runs, the T-bill and fixed-weight controls, and the covered call ETF and hindsight Magnificent 7 comparisons.
Install the FinLab skill for your AI agent
You do not need to write the code yourself. Install the FinLab skill in Claude Code, Codex or Gemini CLI with one command:
Show Code
npx skills add https://github.com/koreal6803/finlab-ai --skill finlabThen ask your agent in plain language, for example "make it the five largest stocks, rebalanced weekly" or "switch JEPQ to SHY below its 200-day average and compare it with QQQ". The AI agent setup page walks through each tool, the AI-assisted setup connects your FinLab account, and the same research runs in the browser at studio.finlab.finance.
Backtest method and limits
| Item | Choice |
|---|---|
| Window | 2016-12-30 (first rebalance) to 2026-10-30; dividend growth from 2019-12-31 and factor ETF rotation from 2017-04-28. FinLab's US prices and dividends start in 2016, and each design starts at the first month end on which all its neighbouring settings have their full look-back. |
| Universe | That day's S&P 500 or Nasdaq 100 members (us_index_constituents, history from 2015 including later removals). Each day keeps one share class per company, and a company that changed ticker uses each ticker for its own dates. Of the 768 stocks that were S&P 500 members at some point since 2015, 35 have no price data (mostly companies acquired, delisted or renamed between 2015 and 2018, many of them before this window) and are left out. At the end of 2016 about 8% of S&P 500 members (9% of the Nasdaq 100) had no market value; designs that use market value only use members that have one. |
| Look-ahead | Membership, market value and dividends are as known on each day; cash flow statements enter on their SEC filing date. Signals use data known at a close and trade at the next close. Dividends count on the ex-date, adjusted only for splits that had already happened. |
| Weights | Stock designs in equal weight; the equal-weight index designs by market value to the power α; the trend switch holds 100% QQQ or 100% QYLD; pairs trading 1/(2P) per leg with unused capital in cash (no interest). No leverage. |
| Costs | finlab sim() US defaults: zero commission and tax. The original settings were rerun at 0.1% per side. No borrow fee, no taxes on dividends or capital gains. |
| Slippage, turnover, capacity | Not estimated; the 0.1% per-side rerun stands in for trading costs. All universes are S&P 500 or Nasdaq 100 members and the ETFs are large funds. |
| Benchmark | QQQ buy and hold with dividends reinvested, same dates, no costs. Daily Sharpe with no risk-free rate; a version above BIL returns is included. |
| Substitutions | MTUM, QUAL, USMV, VLUE and NOBL only have prices in FinLab's data from 2026-09-08, so factor rotation uses SPMO, SPHQ, SPLV and RPV. Sectors come from the current company profile, without historical reclassifications. |
| Sample | About ten years, all in sample; the two halves are a stability check, not an out-of-sample test. |
| Software | finlab 2.2.24, pandas 3.1. |
FAQ
What are the Magnificent 7 stocks?
Apple, Microsoft, Alphabet (Google), Amazon, Nvidia, Meta and Tesla, the seven large technology stocks the market started calling the Magnificent 7 in 2023. The list was chosen after the fact, so backtests of it carry look-ahead bias.
Does holding the largest few stocks beat QQQ?
From 2017 to 2026, the seven largest S&P 500 stocks held equally and rebalanced monthly returned 19.5% a year with a daily Sharpe of 0.85, slightly behind QQQ's 20.4% and 0.93, with a deeper maximum drawdown (-45.2% against -35.1%). Three settings holding only the top five won, but every top-7 and top-10 setting lost, which is not a stable result.
Can covered call ETFs like QYLD or JEPI replace QQQ?
Not on this evidence. All four returned 5 to 11 percentage points a year less than QQQ over the same dates. JEPI and JEPQ have a slightly higher daily Sharpe before deducting a risk-free rate, but neither wins on returns above T-bills. Their advantage is smaller drawdowns, such as JEPI's -13.7% since launch.
What is the difference between JEPI and JEPQ?
JEPI holds lower-volatility S&P 500 stocks and JEPQ holds Nasdaq 100 stocks; both sell calls for premium. JEPQ returned more than JEPI in every year from 2023 to 2025 and fell further in the 2022 decline.
Is the equal weight S&P 500 (RSP) better than SPY?
Not over this period. Over the same dates RSP scored a daily Sharpe of 0.70 with 11.7% a year, and SPY 0.86 with 14.9%. Our reconstruction of the equal-weight S&P 500 from point-in-time members scored 0.70 and 12.0%, in line with RSP.
Do high dividend or dividend growth stocks beat the market in the US?
Not from 2017 to 2026. The 50 highest dividend yields, the 50 highest shareholder yields and the consecutive dividend raisers all scored daily Sharpe ratios between 0.60 and 0.70, behind both QQQ and SPY, and the two yield portfolios drew down more than 50%.
Does pairs trading still work?
In this test on S&P 500 stocks from 2017, the distance method returned 0.5% a year, and 0.1% per side in costs made it negative. Over this period the simple distance rule did not make money after costs on large caps; pairs trading needs very low trading costs and a more refined way of choosing pairs.
Can I rerun this?
Yes. Install FinLab through the AI-assisted setup, download research.py below and run it; it takes about ten minutes.
Reproduce it yourself
- research.py: all nine designs, 81 neighbouring settings, both halves, cost runs, the T-bill and fixed-weight controls, and the covered call ETF and hindsight Magnificent 7 comparisons.
- data.csv: daily equity of the nine designs at their original settings, the hindsight Magnificent 7, and QQQ, the covered call, factor and dividend ETFs.
- metrics.json: every statistic quoted here, including each setting, both halves, the reference ETFs and yearly returns.
More US research is in the US quant trading strategies overview, the US factor investing overview, the long-short and trend-following backtest from the same study, the QQQ volatility targeting strategy that passed in it, the sector rotation backtest and the lazy portfolio backtest. Turnover explains how rebalancing frequency drives costs.
Last updated: 2026-11 | Backtest window: 2017-01 to 2026-10 | Benchmark: QQQ total return | Author: FinLab Quant Research (reviewed by a quantitative researcher)
Past performance does not represent future results, and every result here is an in-sample backtest. The stocks and ETFs named are used to describe research results, not as recommendations. This content is for education only and does not constitute investment advice.
FinLab AI
Want to build your own strategy?
Describe your stock-picking ideas in natural language. AI automatically validates, backtests, and gives you answers
Start Free