Run this strategy
Copy the prompt to reproduce the evidence above with the article’s data, assumptions, and risk checks.
Tell your AI:
Set up FinLab and rerun the revenue growth sector rotation against QQQ and XLK. Please read: https://finlab.finance/en/setup?relatedUrl=/en/blog/sector-rotation-strategy-backtest
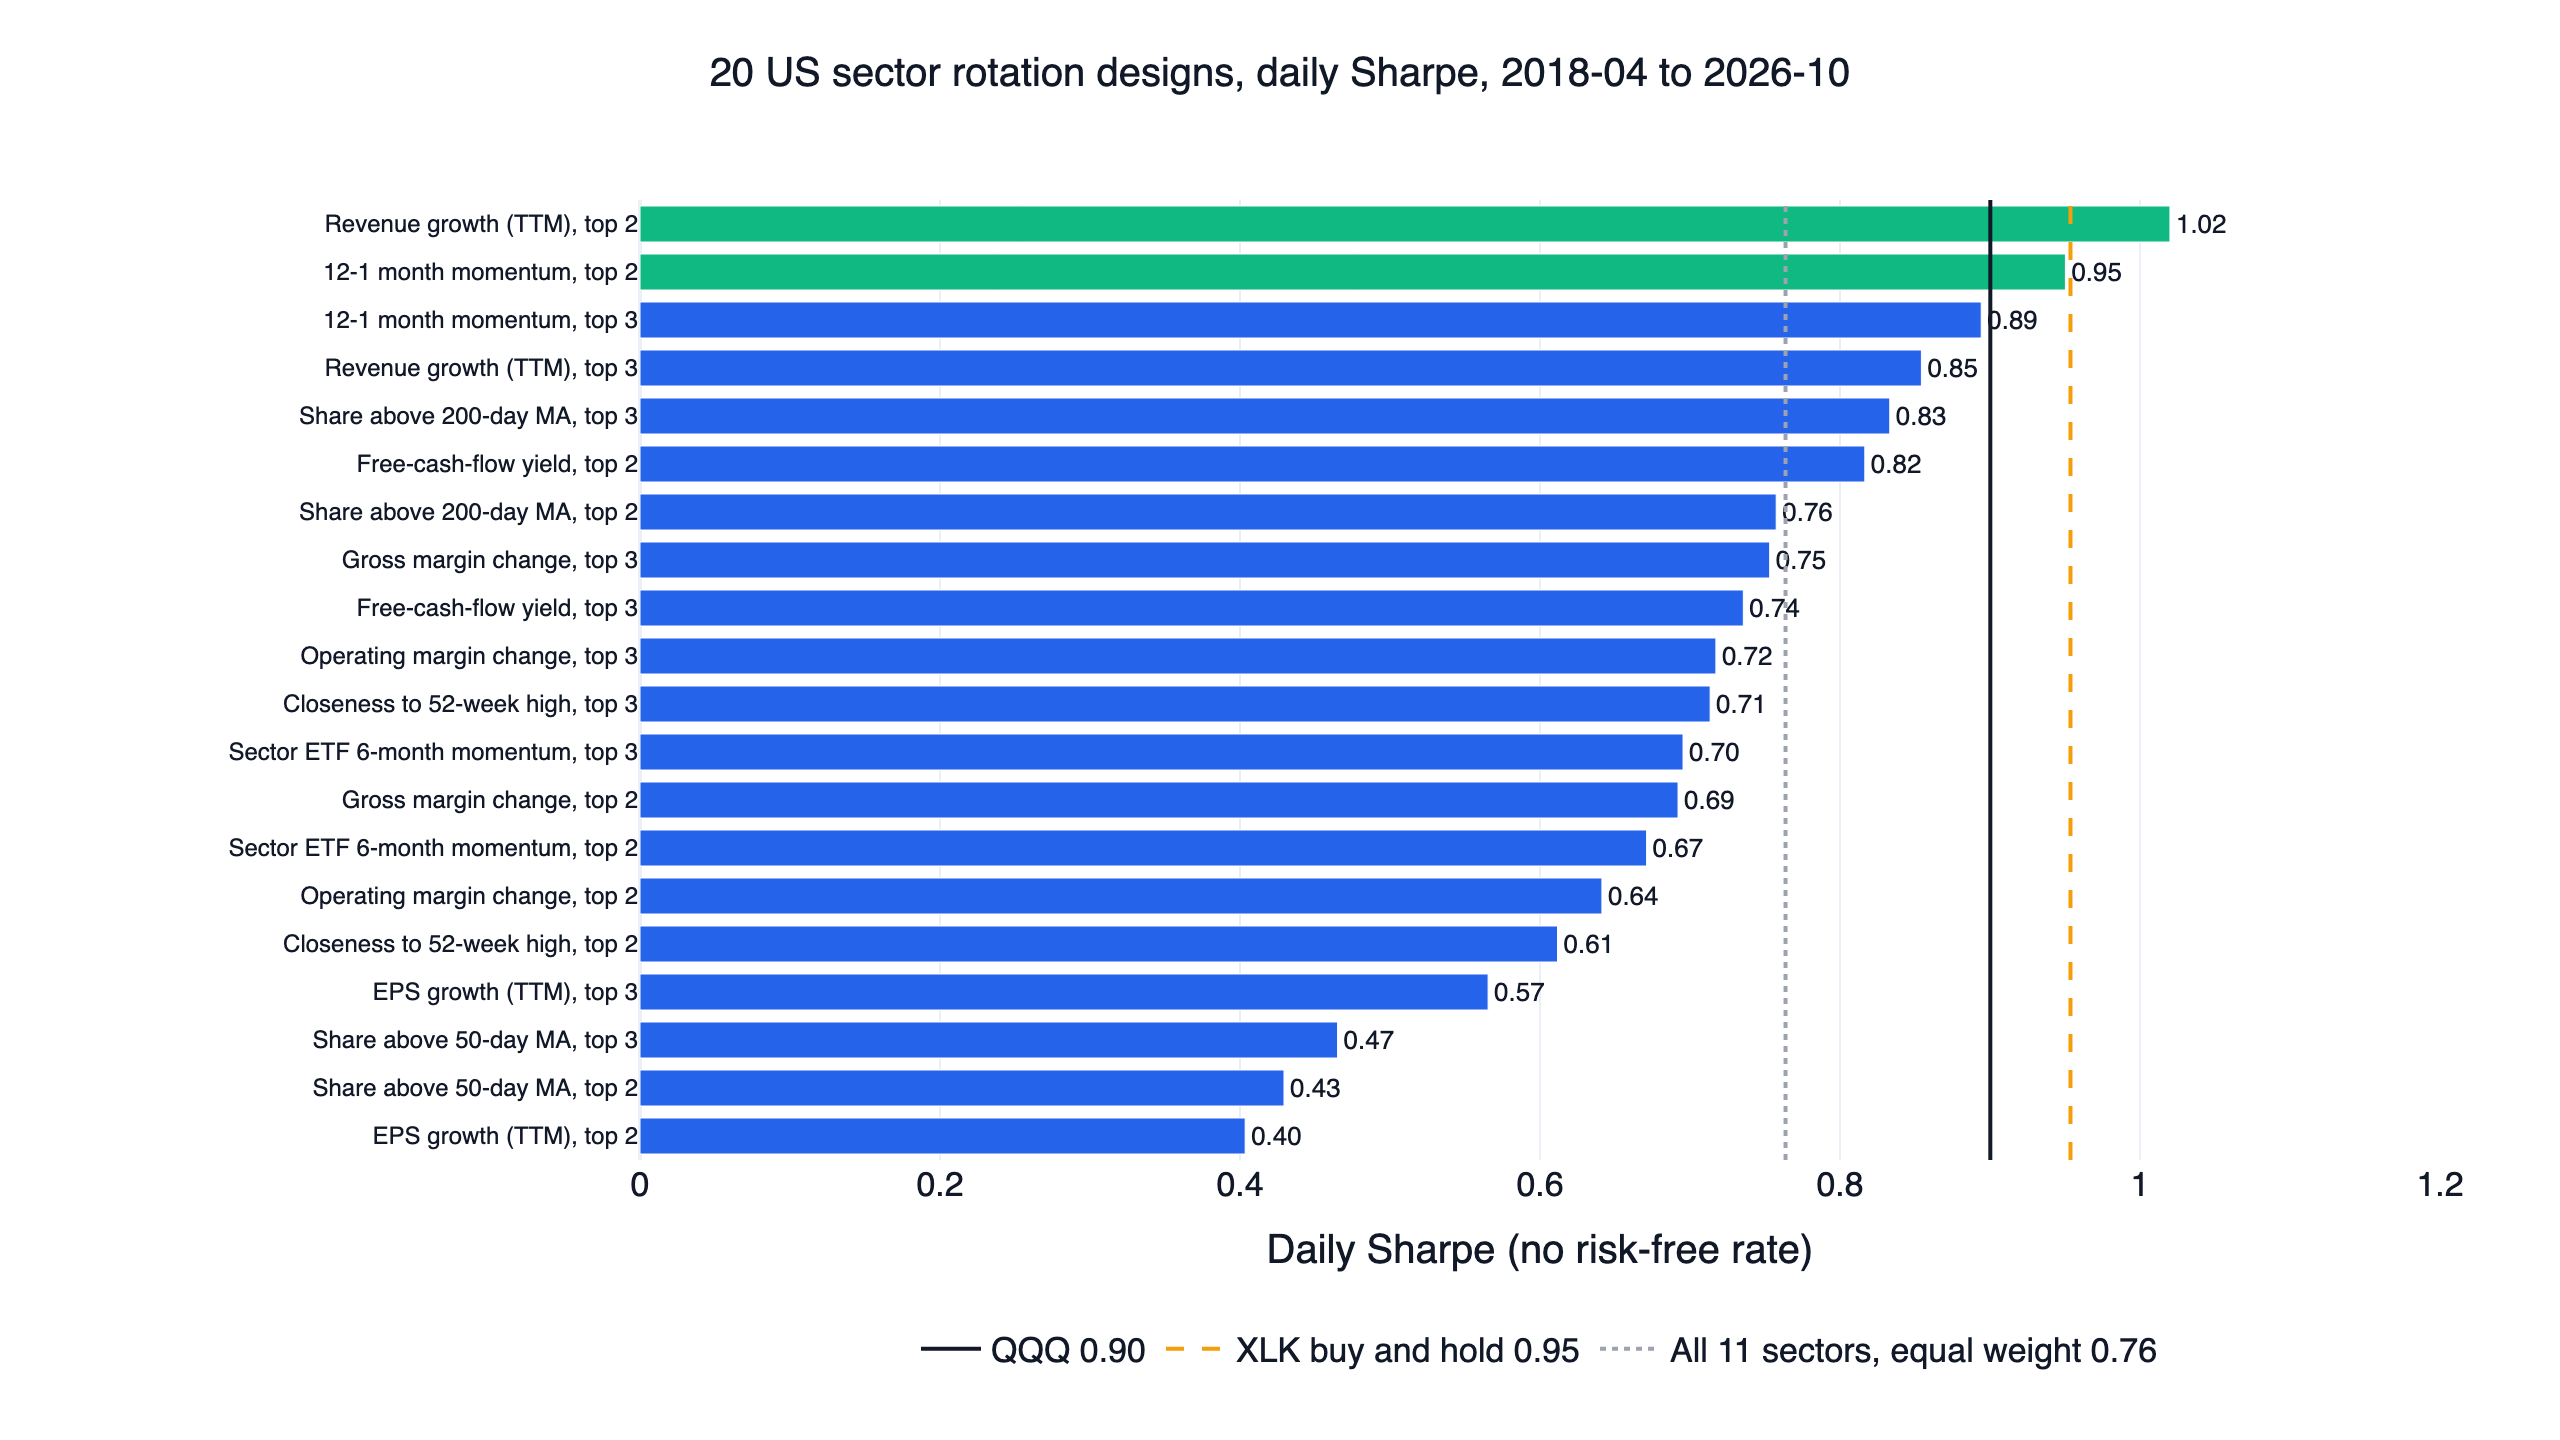
We ranked the 11 SPDR sector ETFs every month on ten signals built from the stocks inside each sector, such as the median revenue growth, free-cash-flow yield and 12-month momentum of its companies or the share of them above their 200-day average, and held the top two or three sectors. From April 2018 to October 2026, 2 of the 20 designs beat QQQ at their base settings and none passed all three of our checks. The best, the two sectors with the fastest trailing-twelve-month revenue growth, scored a daily Sharpe of 1.02 against 0.90 for QQQ with dividends reinvested and passed both halves and the cost test, but only 6 of its 9 neighbouring settings won (7 were needed). It held XLK in 65 of 103 months; with XLK removed it scored 0.65, below a plain equal-weight basket of the other ten sectors (0.71). So no sector rotation design in this study counts as a working strategy.
Key numbers
| Design or benchmark | Daily Sharpe | CAGR | Max drawdown | Settings beating QQQ | First / second half Sharpe |
|---|---|---|---|---|---|
| Revenue growth (TTM), top 2 sectors | 1.02 | 21.3% | -30.5% | 6 / 9 | 0.80 / 1.32 |
| 12-1 month momentum, top 2 sectors | 0.95 | 18.8% | -34.2% | 2 / 9 | 0.76 / 1.27 |
| Best of the other 18 designs (12-1 momentum, top 3) | 0.89 | 16.4% | -36.4% | not tested | 0.61 / 1.40 |
| QQQ, total return | 0.90 | 20.3% | -35.1% | benchmark | 0.70 / 1.15 |
| XLK buy and hold | 0.95 | 24.2% | -33.6% | ||
| SPY, total return | 0.85 | 15.2% | -33.7% | ||
| All 11 sector ETFs, equal weight, monthly | 0.76 | 12.6% | -36.1% |
Every curve runs from 2018-04-03 to 2026-10-28; QQQ, XLK and SPY are buy and hold with dividends reinvested over the same days. The halves split at 2022-07-14.
How a design had to pass
"Beat" means a higher daily Sharpe ratio than QQQ total return over exactly the same trading days. Sharpe is the mean daily return over its standard deviation, annualised with √252, with no risk-free rate subtracted. (The US strategy comparison reports monthly Sharpe, on which QQQ scores higher, so its figures are not directly comparable with these.) Each design was first run once at its base setting. Only a design that beat QQQ there went on to the three checks used across FinLab's research, such as the 10-factor study:
- A plateau, not a peak. The two main parameters were each set to three nearby values that include the base value, nine settings in all, and at least 70% (7 of 9) had to beat QQQ.
- Both halves. The window was cut at its midpoint, and the base setting had to beat QQQ in each half.
- Costs included. Every run uses finlab
sim()with its default US cost model (zero commission, no transfer tax), and the base setting also had to stay ahead of QQQ with 0.1% cost per side.
How the sector scores were built
The stocks come from FinLab's US company profile: common stocks, including companies that were later acquired or delisted, one share class per company, no ADRs, ETFs or funds, and financial stocks included. On each month's last trading day we kept stocks priced above 5 million, skipped any stock for a year after a ±50% day (usually a data error or a reused ticker), dropped stocks whose profile has none of the 11 sector names, and took the 1,000 with the highest dollar volume. Each stock's sector is the profile's sector field, whose 11 names map one to one onto the SPDR funds: technology XLK, financial services XLF, healthcare XLV, consumer cyclical XLY, consumer defensive XLP, energy XLE, industrials XLI, basic materials XLB, utilities XLU, real estate XLRE and communication services XLC.
A sector's score is the median of a signal across its stocks, or for the two moving-average signals the share of its stocks above the average. A sector needed at least five stocks with a value to be scored. The portfolio held the ETFs of the top two or three sectors at equal weight, traded at the next day's close, and kept them until the next month end. The ten signals:
- Revenue growth: trailing-twelve-month revenue over the same figure a year earlier. Jegadeesh & Livnat (2006) found that revenue surprises predict individual stock returns; here we ask whether a sector's typical growth predicts the sector's.
- Free-cash-flow yield: trailing free cash flow over market value.
- 12-1 month momentum: the 12-month price return skipping the latest month, a version of the momentum studied by Jegadeesh & Titman (1993) (skipping a month is the later convention), taken as the sector's median stock.
- Share above the 200-day average, a market breadth measure applied inside each sector.
- Sector ETF 6-month momentum: the ETF's own return. Moskowitz & Grinblatt (1999) found that industry momentum explains much of stock momentum, and Faber (2010) tested the same idea on US sector portfolios.
- Operating margin change: trailing operating margin minus a year earlier.
- Share above the 50-day average.
- Closeness to the 52-week high: price over its 52-week high, after George & Hwang (2004).
- EPS growth: trailing diluted EPS over a year earlier. Chordia & Shivakumar (2006) linked price momentum to earnings momentum.
- Gross margin change: trailing gross margin minus a year earlier. Novy-Marx (2013) showed that the level of gross profitability predicts returns; a change in margin is a different, untested measure, which is why it is here.
Signals 1 to 8 came from an initial screen run before this study; 9 and 10 were added afterwards with the sources above. All statement items enter on their SEC filing date.
Result 1: 2 of 20 designs beat QQQ, and both lean on technology
The chart at the top shows all 20 designs. Two cleared QQQ's 0.90: revenue growth with the top two sectors (1.02) and 12-1 momentum with the top two (0.95). Every other design scored between 0.40 and 0.89. Fourteen of the 20 did not even beat an equal-weight basket of all 11 sector ETFs (0.76), and the short-term breadth signal was the weakest of the price signals: holding the sectors with the most stocks above their 50-day average scored 0.43 and 0.47 and traded the most, about eight times the portfolio a year.
XLK alone set a high bar. Bought and held, it compounded at 24.2% a year with a 0.95 Sharpe, better than QQQ, while the other ten sector ETFs scored between 0.44 (XLRE) and 0.72 (XLV). Any rule that left technology out for long stretches was starting far behind.
Result 2: neither design survives its neighbours
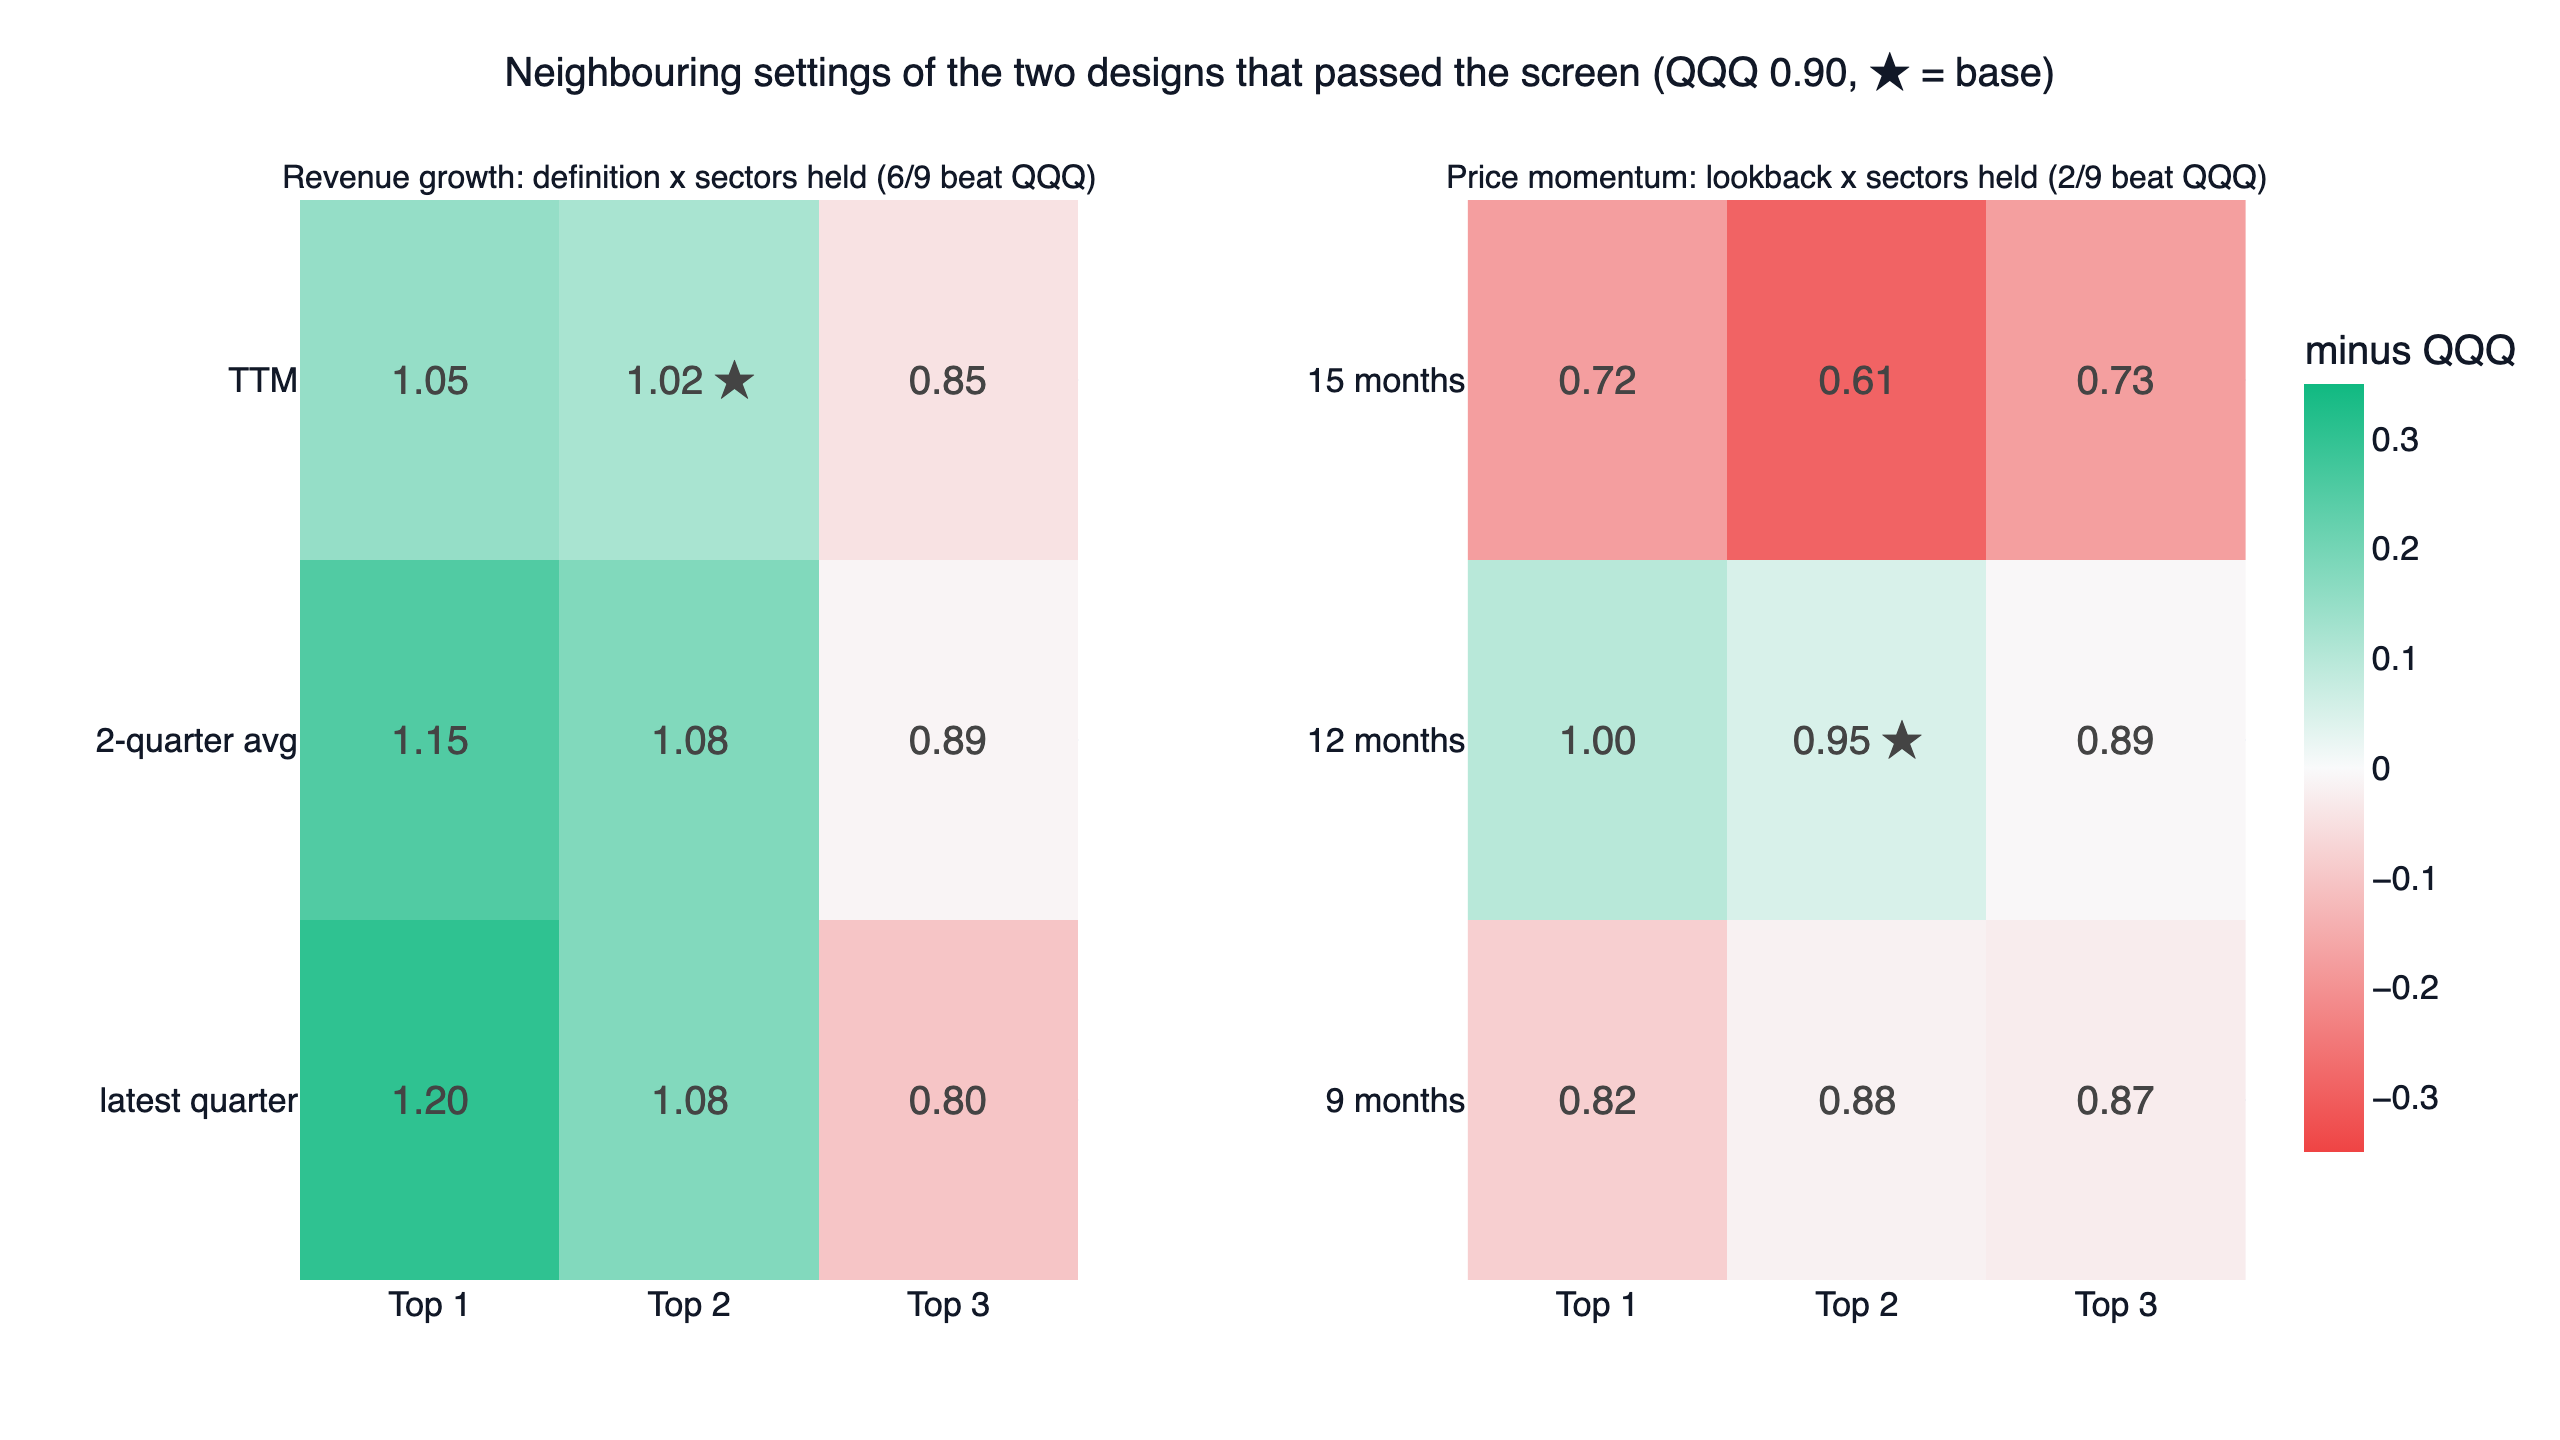
For revenue growth, the two parameters were the definition (latest quarter, the average of the last two quarters, or the trailing twelve months) and the number of sectors held (one, two or three). Six of nine settings beat QQQ, one short of the bar. The pattern is a clean slope: one sector scored 1.05 to 1.20, two sectors 1.02 to 1.08, three sectors 0.80 to 0.89, so every three-sector version lost.
The plateau test came down to one setting. The closest losing cell, the two-quarter average with three sectors, scored 0.889 against 0.900. finlab versions before 2.2.21 treat 55 US market holidays in the ETF price table as flat trading days; on that data QQQ scores 0.893, the same cell also scores 0.893 and edges past it by 0.0007, and the grid reaches 7 of 9. A pass that depends on whether holidays count as trading days is not a plateau, and the sections below show that the result rests on XLK and on one year, 2022, so we do not count the design under either version.
The base setting passed the other two checks. It beat QQQ in the first half (0.80 against 0.70) and the second (1.32 against 1.15), and after 0.1% cost per side it still scored 1.00 with a 20.9% CAGR. Turnover was modest, about 1.6 times the portfolio a year.
For 12-1 momentum, the parameters were the lookback (9, 12 or 15 months, each skipping the latest month) and the sectors held. Only two of nine settings beat QQQ, both at the 12-month lookback; the 15-month versions scored 0.61 to 0.73. It passed both halves (0.76 and 1.27) and the cost test (0.91), but 2 of 9 is not a plateau.
Is the revenue growth rotation just holding XLK?
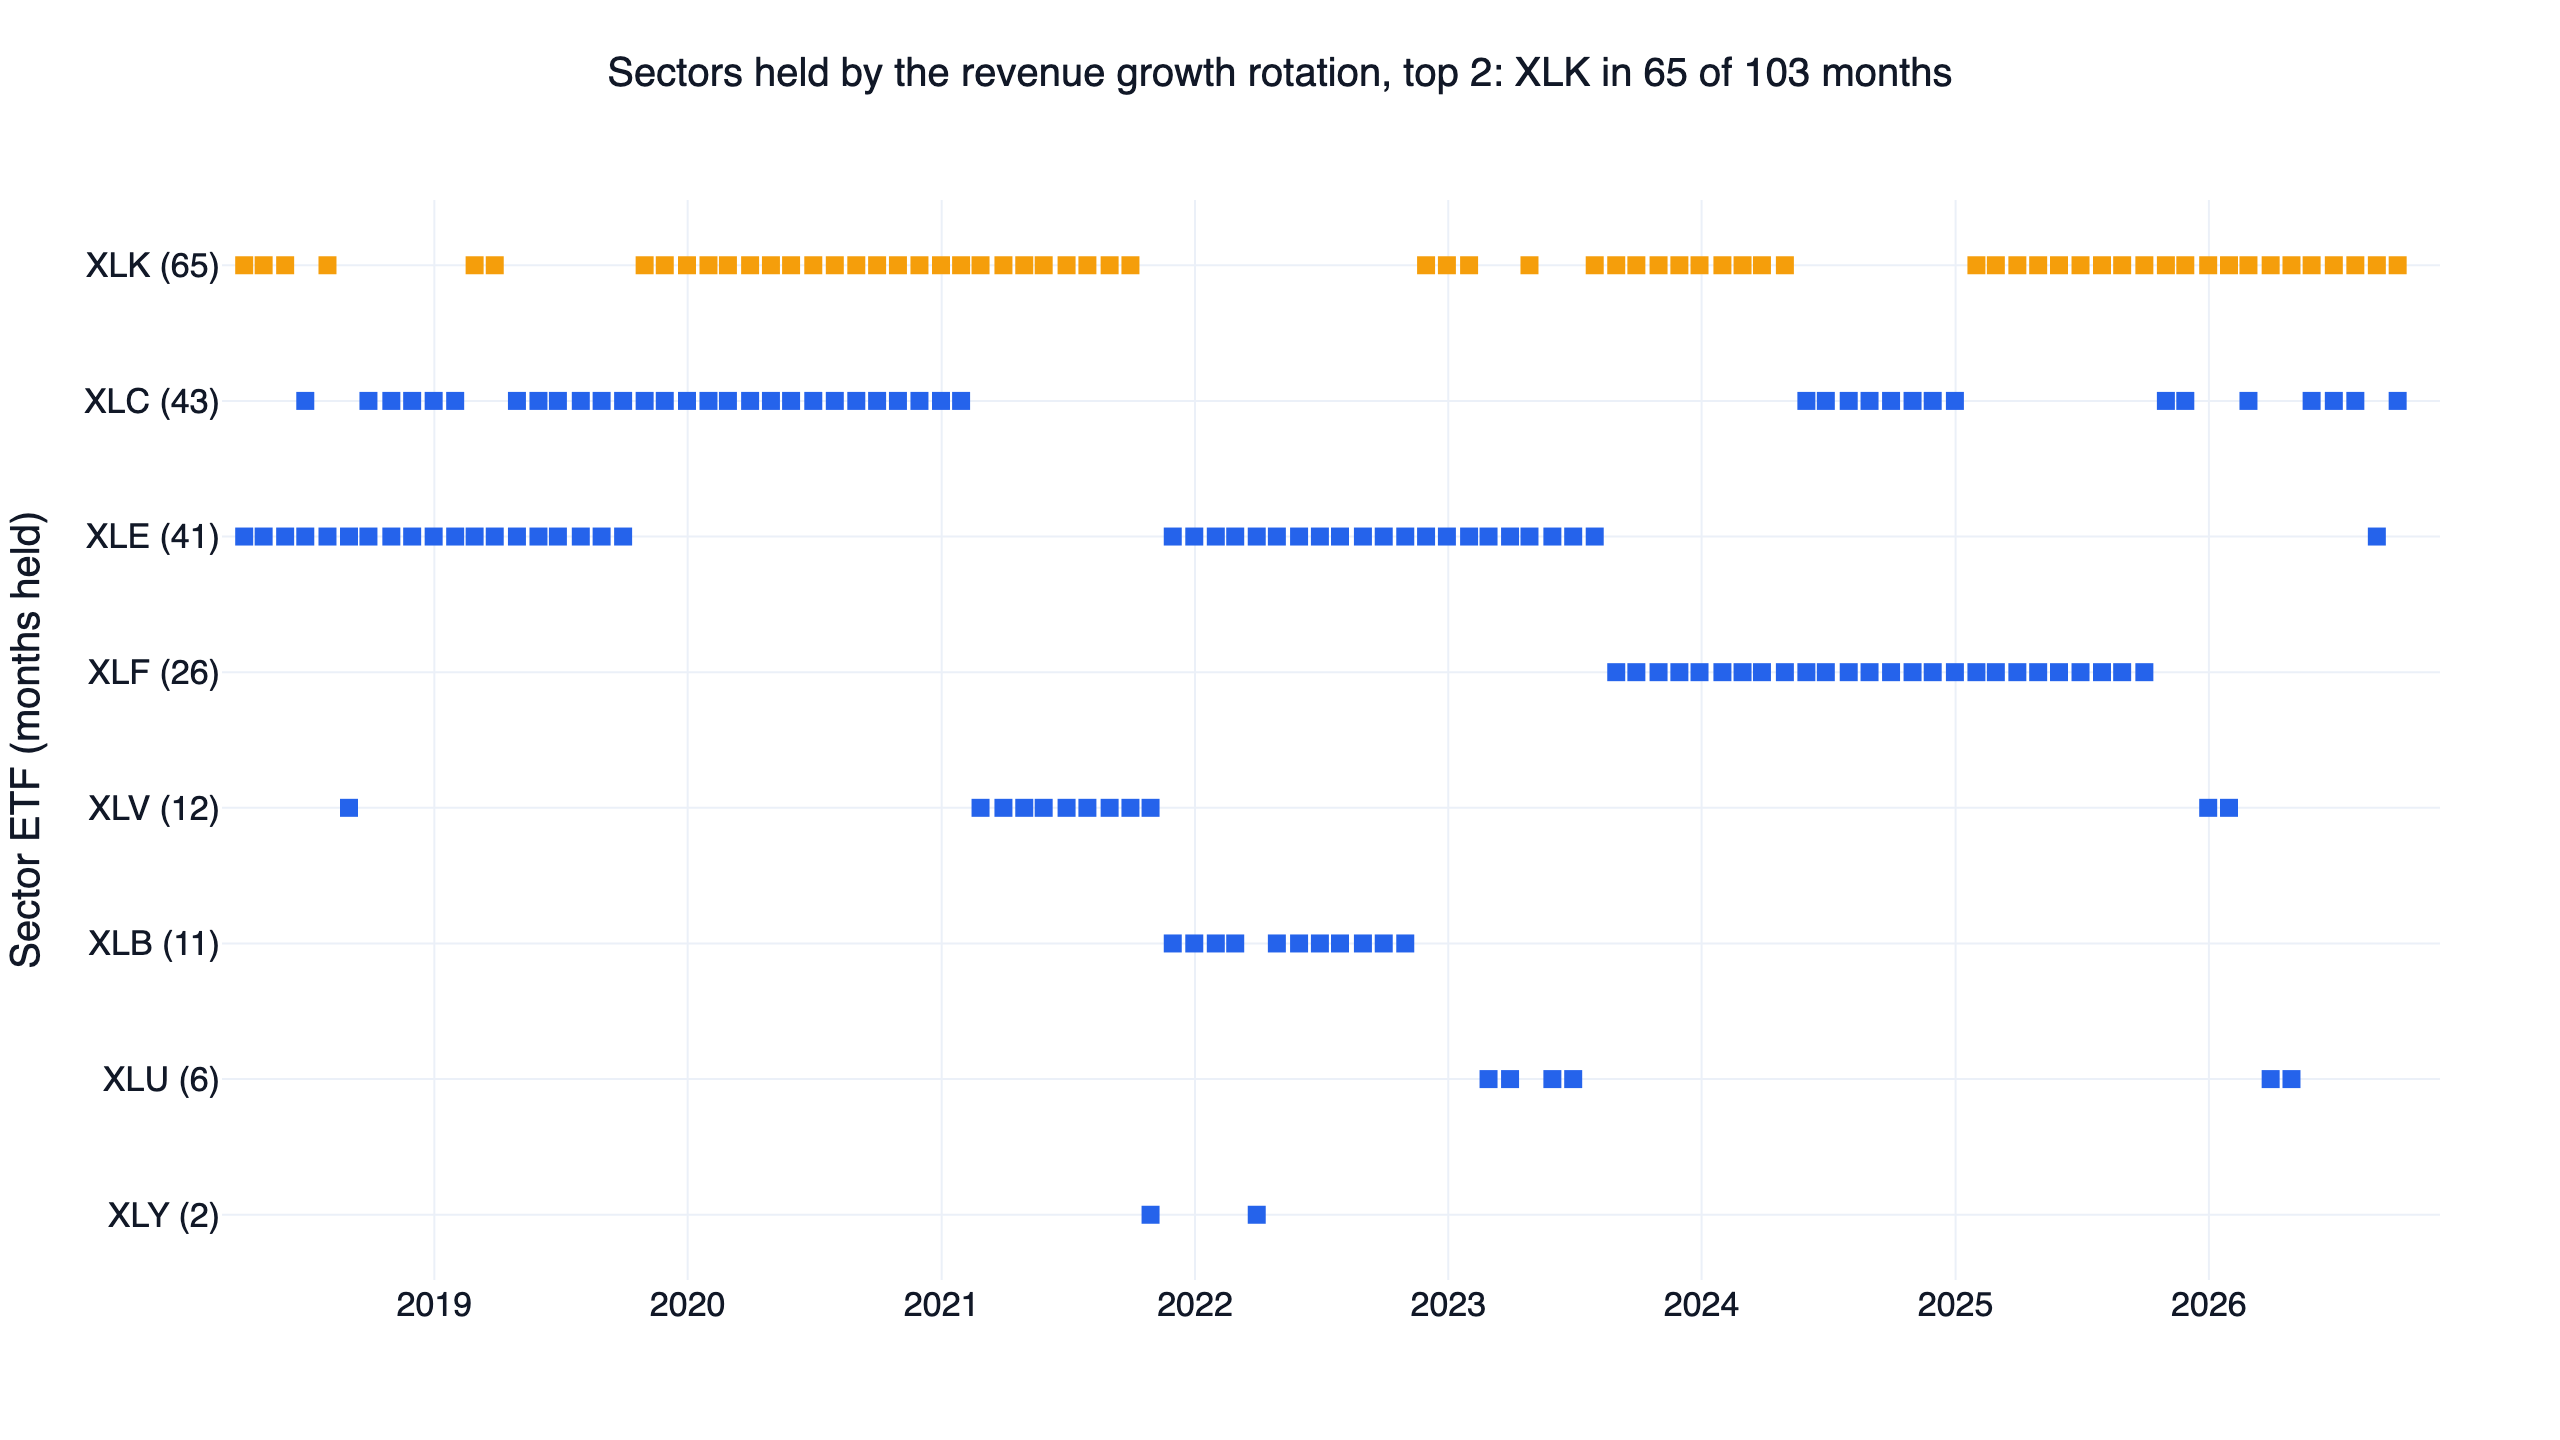
Mostly, yes. Over the 103 months it was invested, the strategy held XLK in 65, communication services (XLC) in 43 and energy (XLE) in 41; consumer defensive, industrials and real estate never made the top two. The chart shows long runs: XLK through most of 2020-2021 and from 2025, XLE from 2018 into 2019 and again from late 2021 to mid-2023, financials (XLF) from 2023 to 2025.
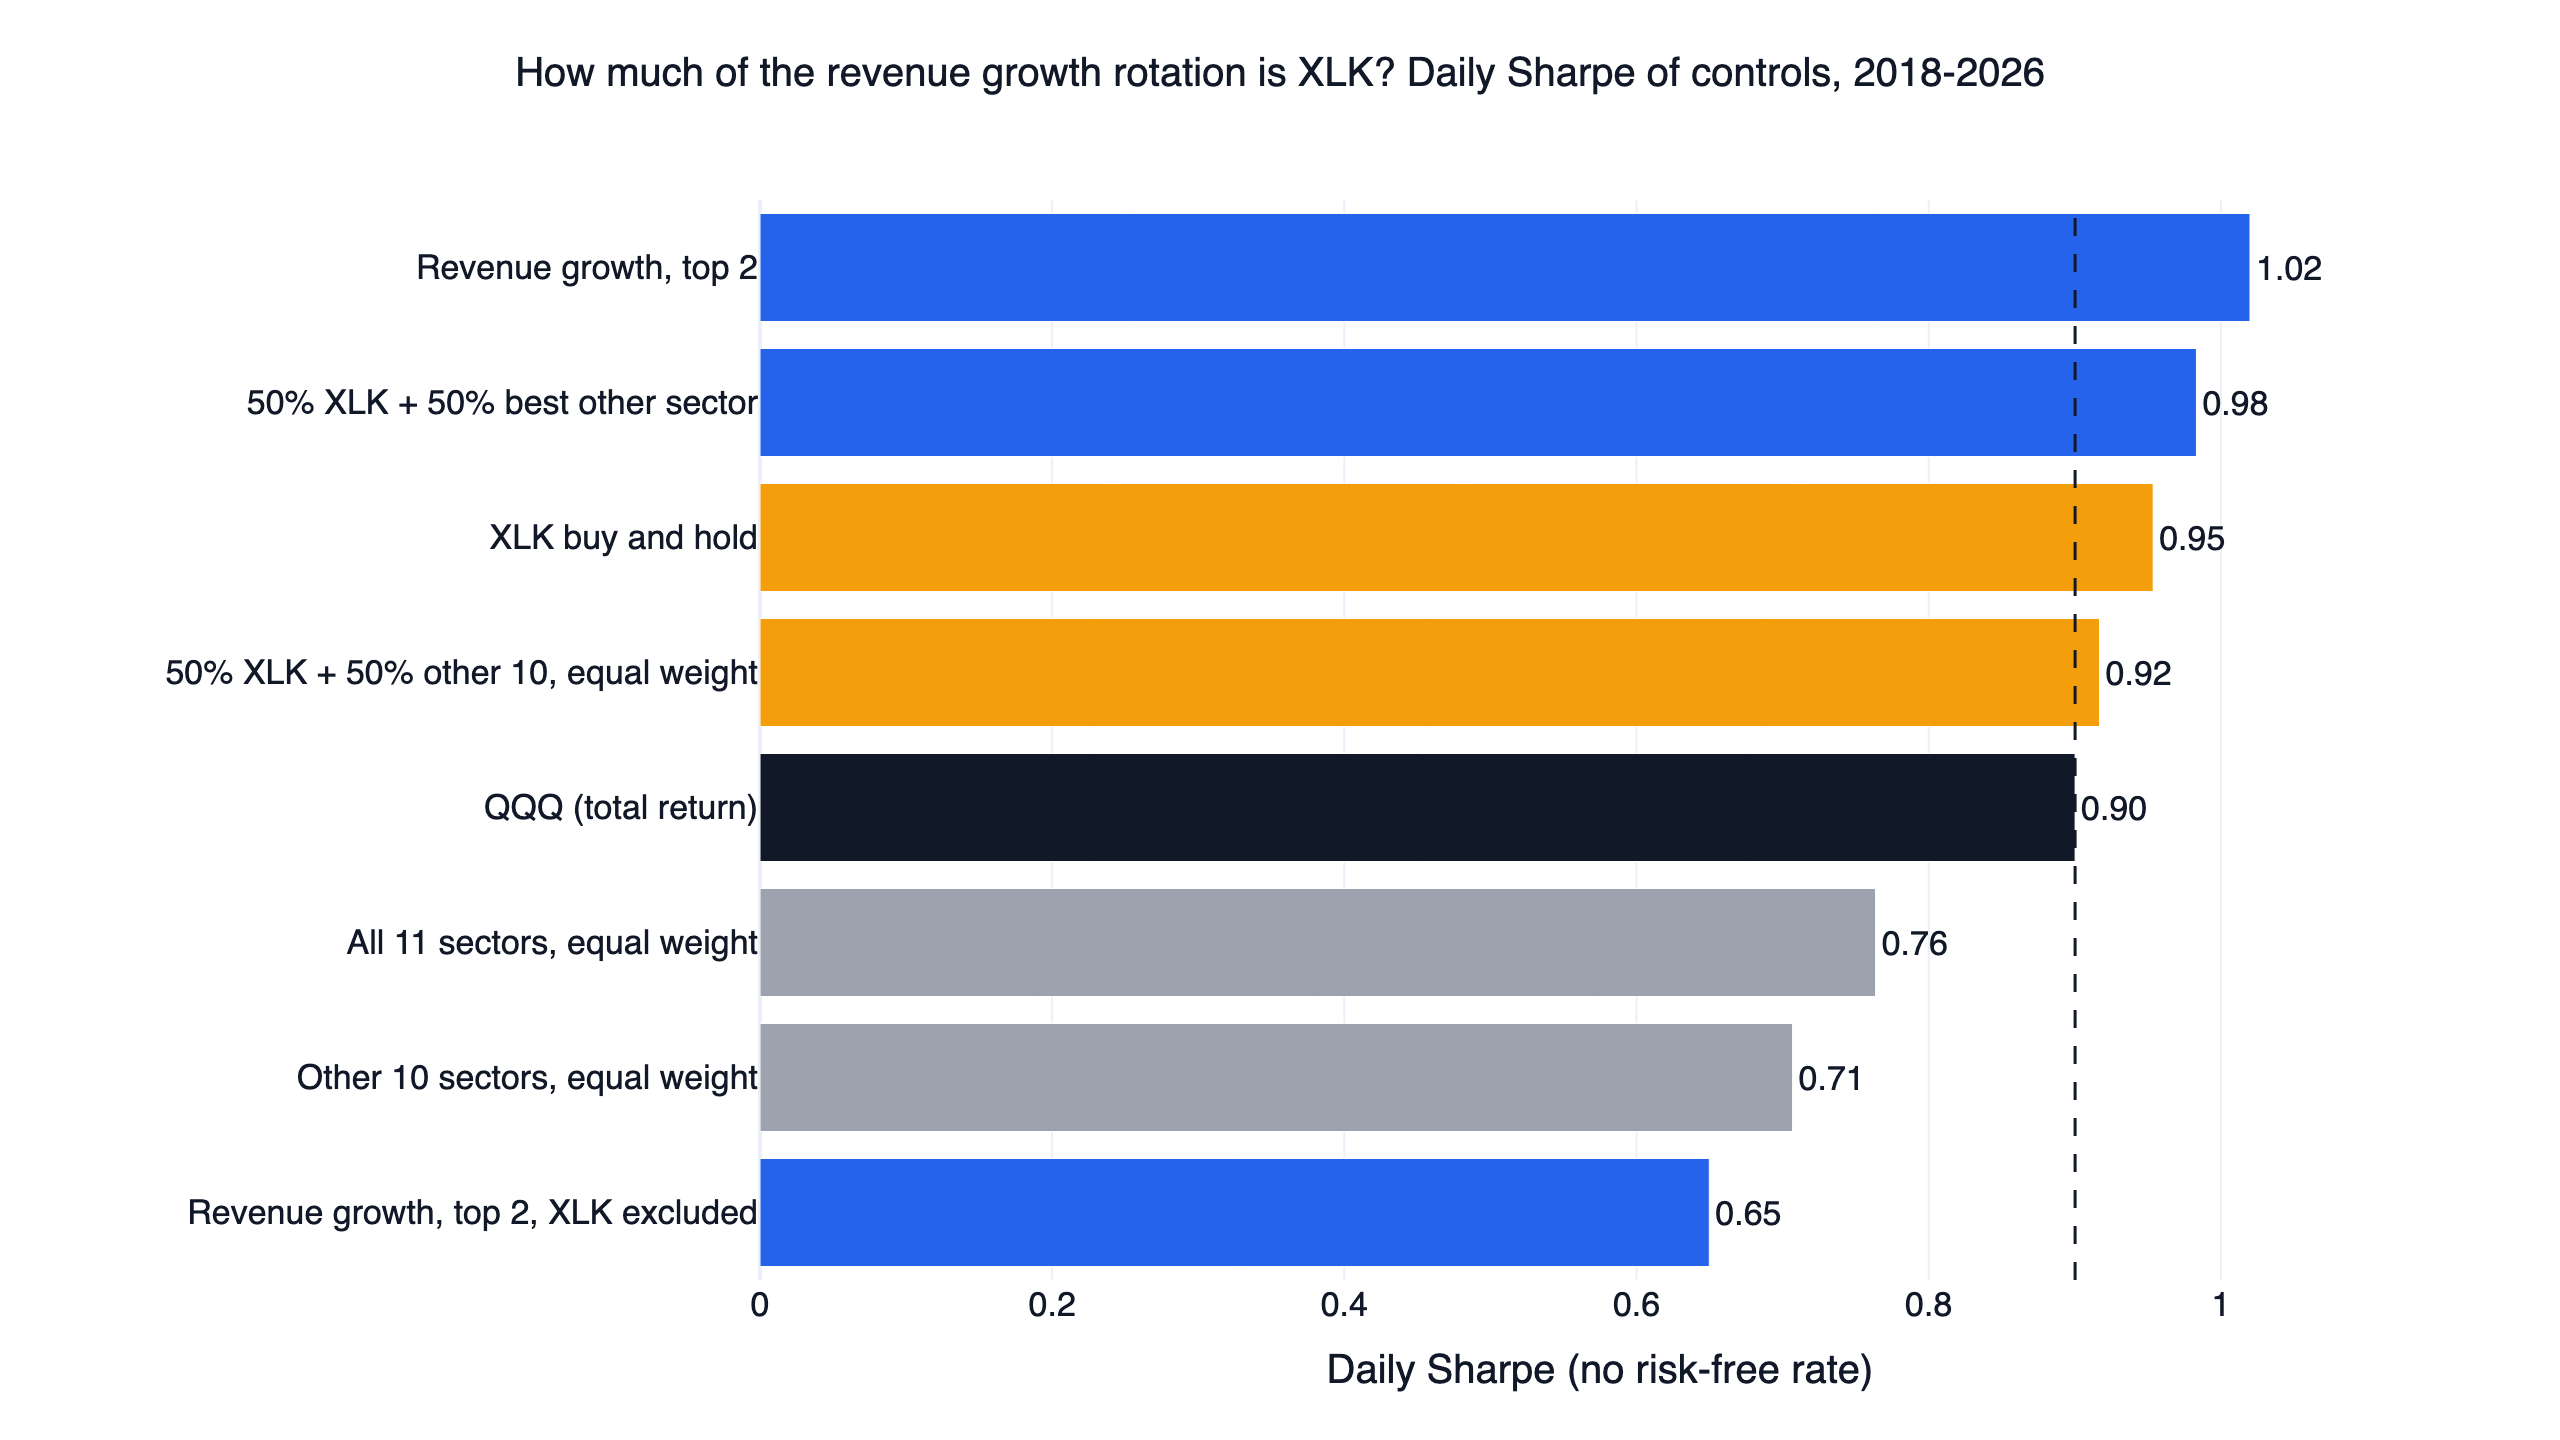
We ran four controls on the same dates to separate the parts:
- Remove XLK from the choices and hold the top two of the other ten sectors: 0.65 Sharpe and 11.6% a year. An equal-weight basket of the same ten sectors scored 0.71. Without technology, ranking by revenue growth picked worse than not ranking at all.
- Hold 50% XLK and 50% equal-weight in the other ten, rebalanced monthly: 0.92, about QQQ.
- Hold 50% XLK and 50% in the fastest-growing other sector: 0.98, with a 20.8% CAGR.
- Hold XLK alone: 0.95 and 24.2% a year.
So the strategy's 1.02 is roughly XLK's return with a second sector that lowered volatility (21.2% a year against XLK's 26.5%), and the revenue signal added something when it picked that second sector, about 0.07 of Sharpe (0.98 against 0.92) over an equal-weight partner.
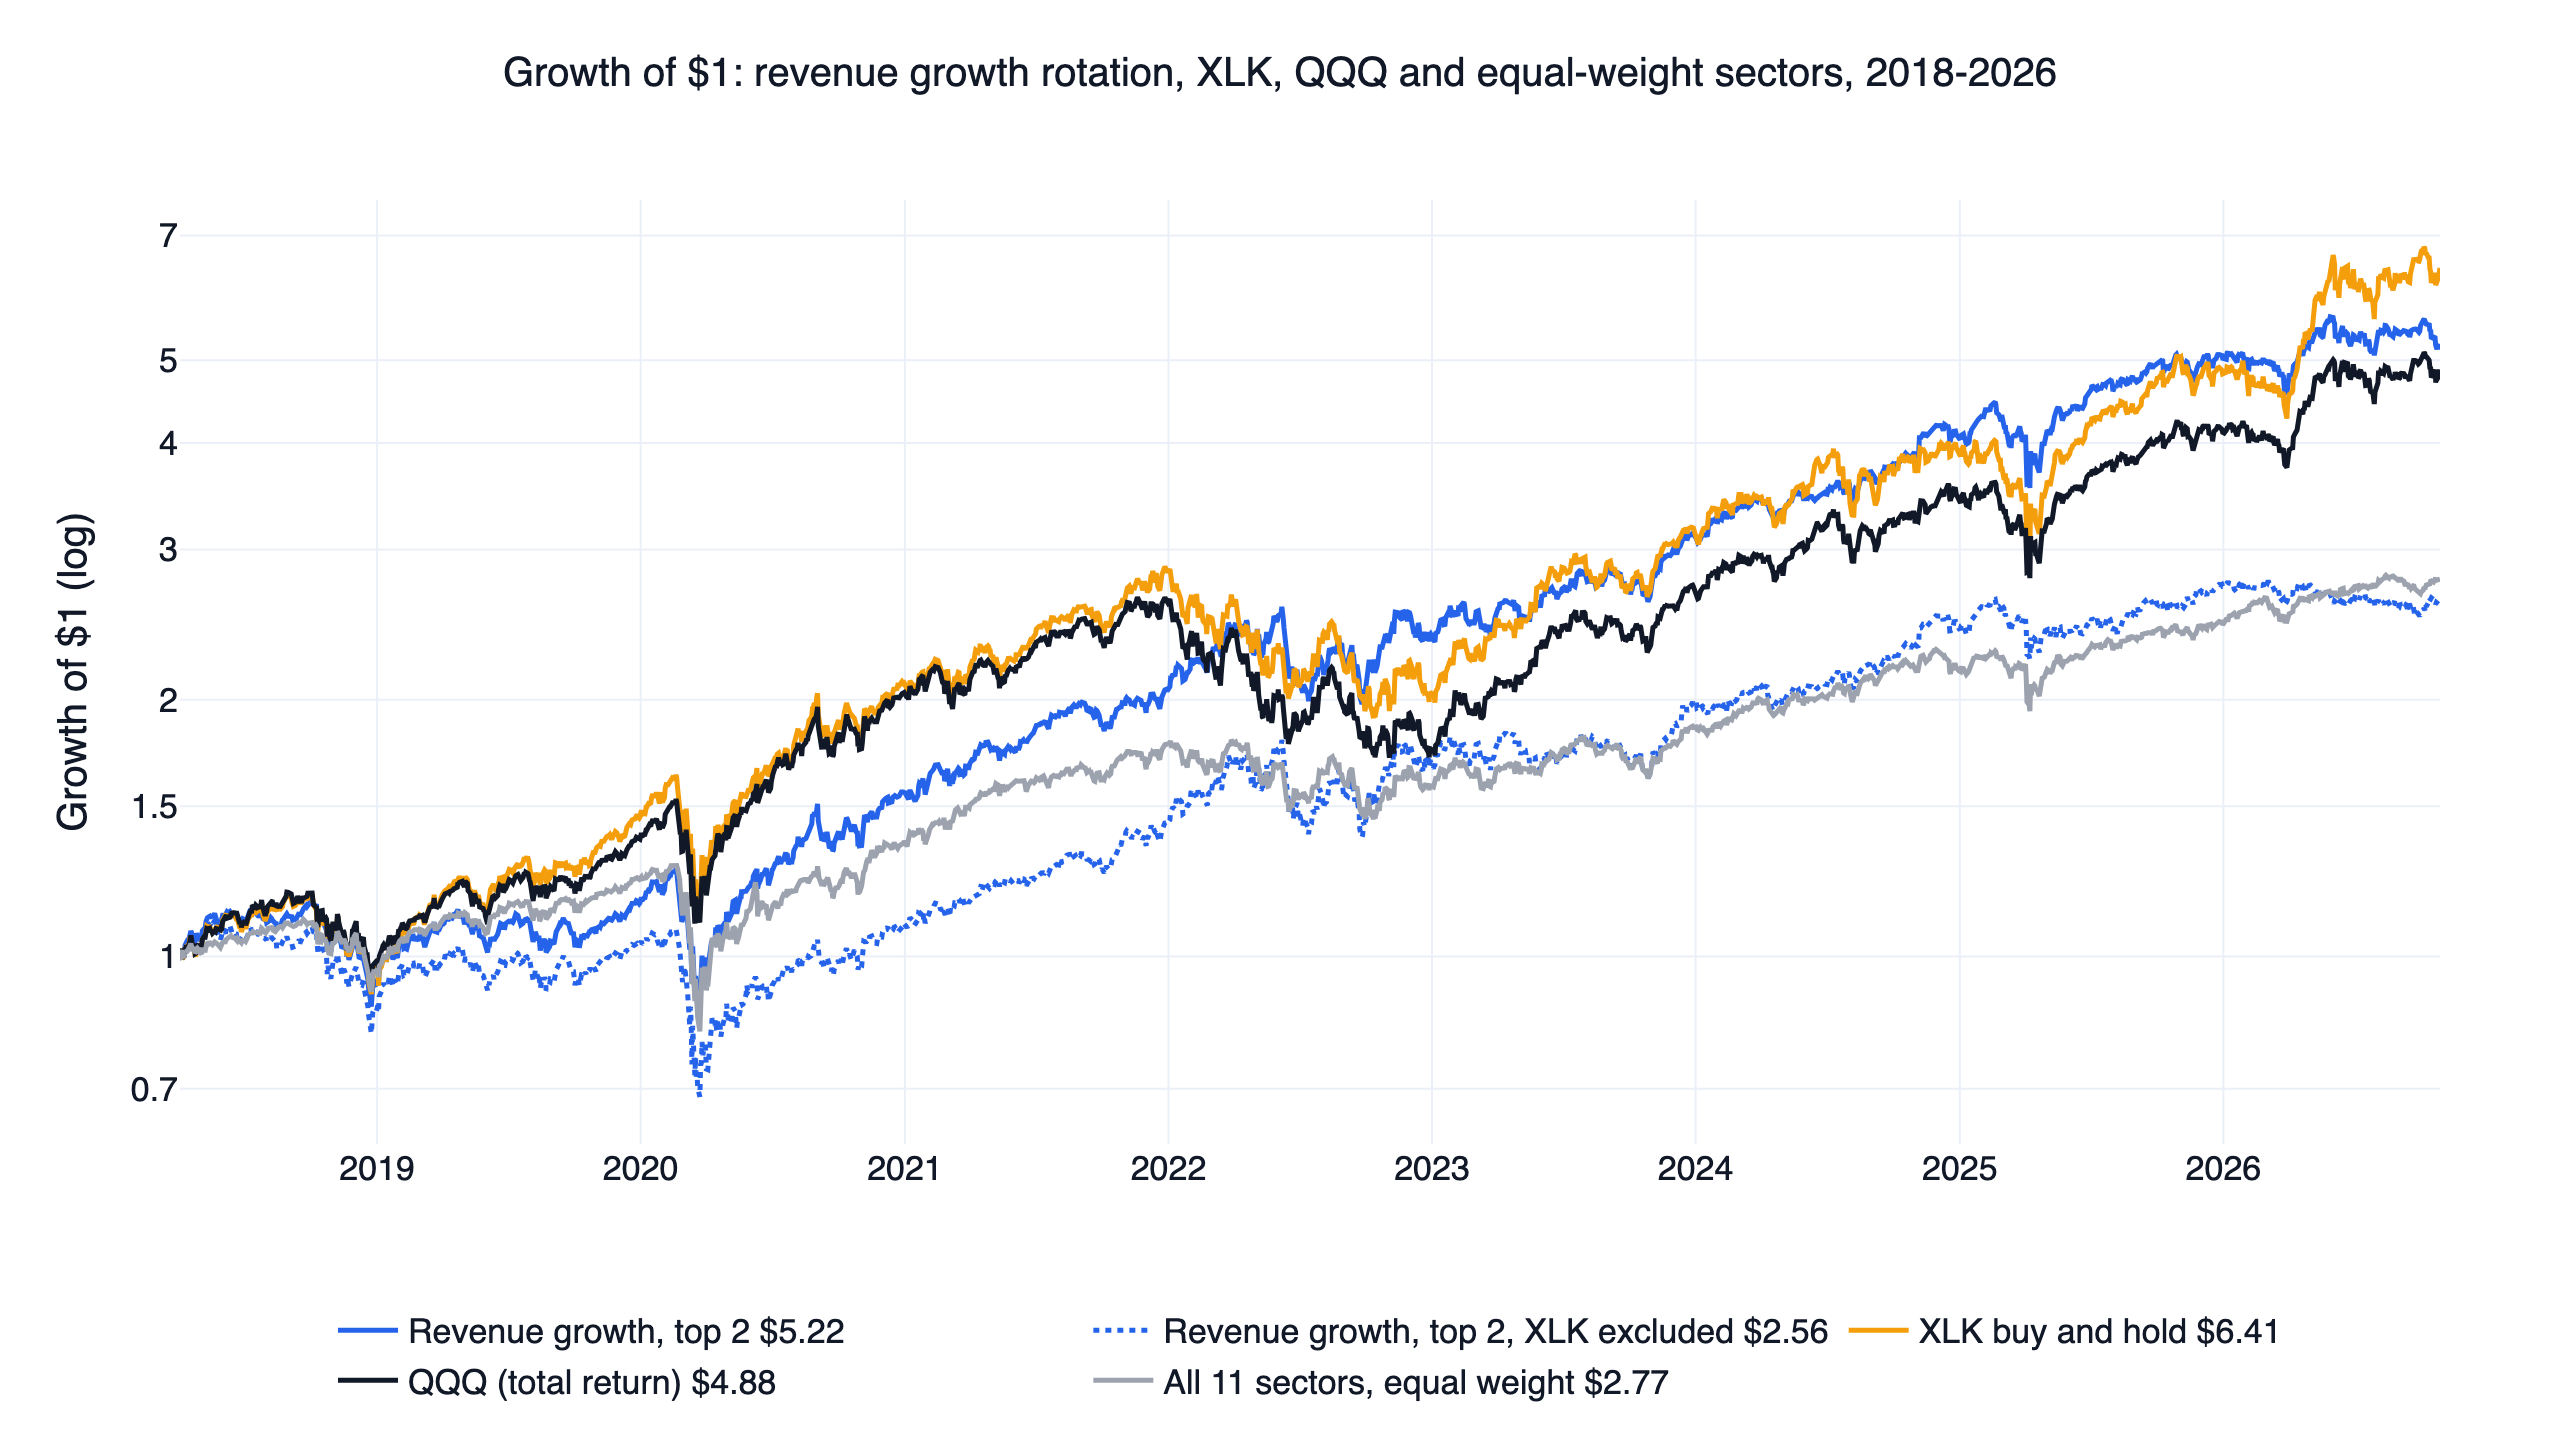
The growth-of-a-dollar chart shows when the strategy earned its margin. It held no XLK for the first eleven months of 2022, mostly energy and materials, and returned 16.3% that year while QQQ lost 32.6% and XLK 27.7%. That one year is the whole first-half lead: from April 2018 to the end of 2021 the strategy scored 0.94 against 1.17 for QQQ. In the other years it usually trailed XLK: one dollar grew to 6.41 in XLK and $4.88 in QQQ. In 2026 so far it is up 3.9% while QQQ is up 18.5%; its second slot was XLC, down 11.6% this year, in half of the months.
Why holding more sectors made it worse
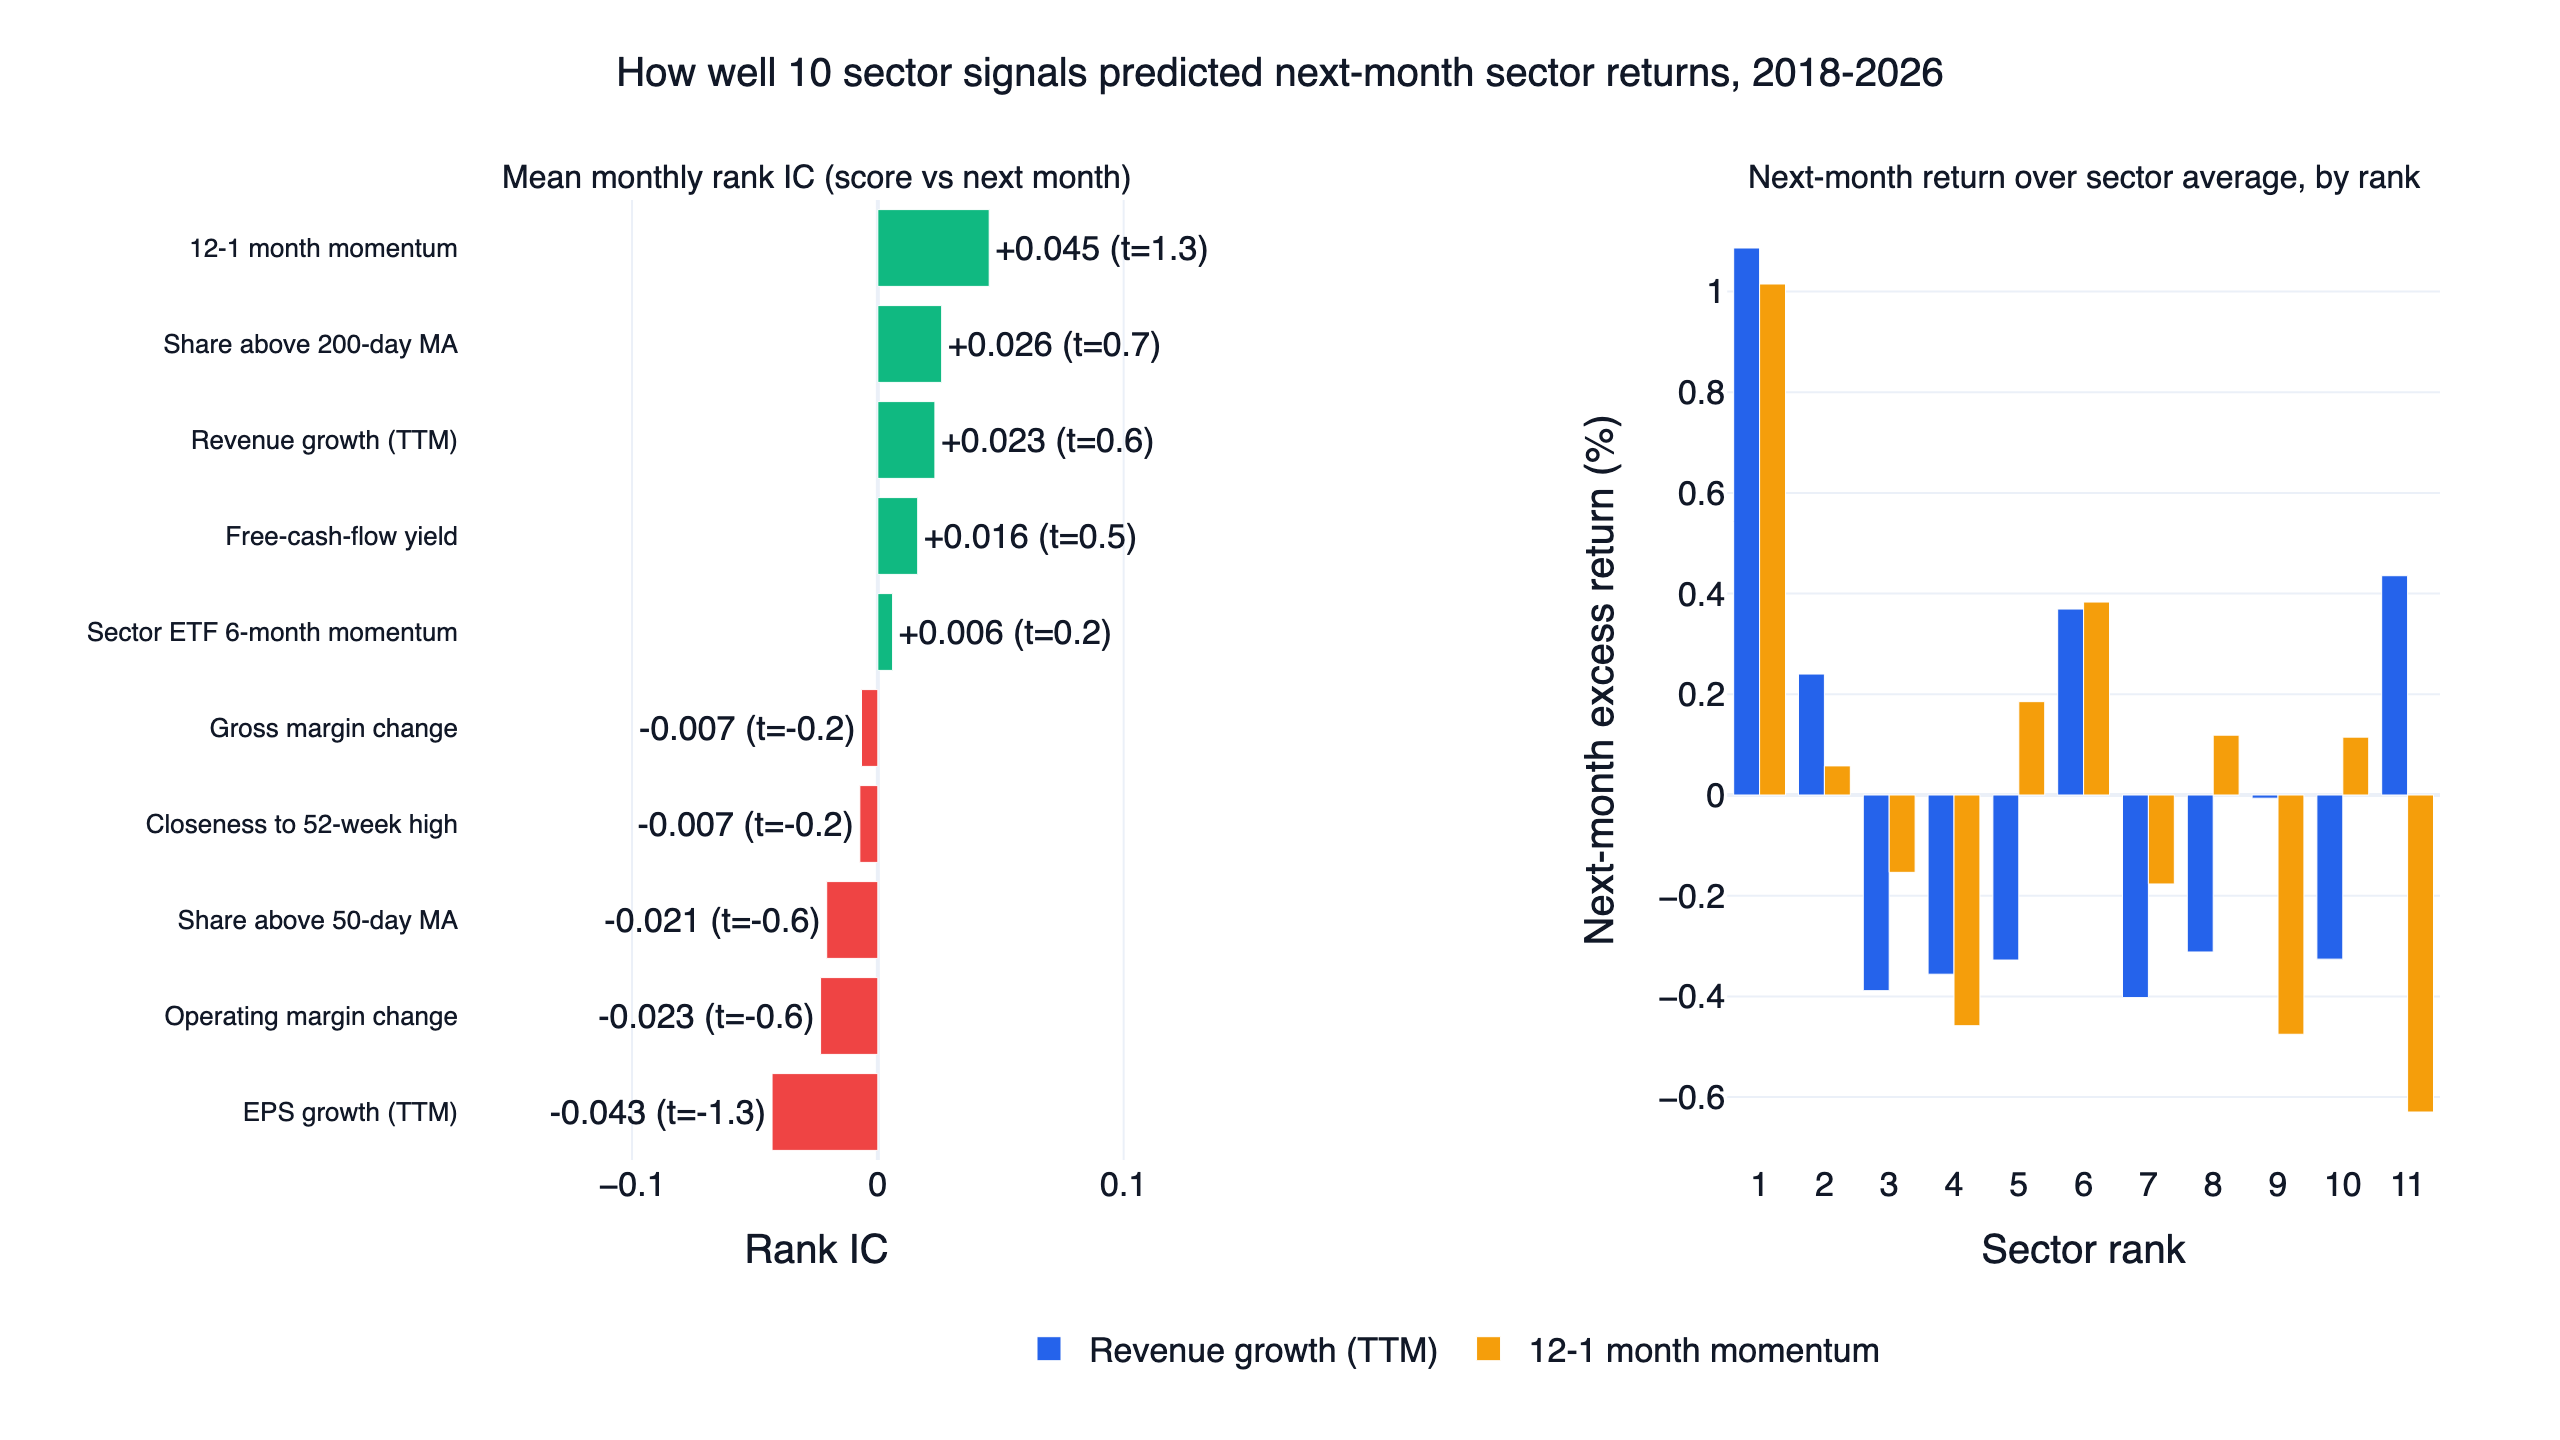
If a signal ranks sectors well, its rank correlation with the next month's sector returns (the rank IC) should be positive month after month. None of the ten came close. The highest average was 0.045 for 12-1 momentum, with a t-statistic of 1.3; revenue growth averaged 0.023 (t = 0.6) and was positive in 51.5% of months. EPS growth was the most negative at -0.043, which matches its last place among the fundamental signals (0.40 and 0.57).
The right panel shows where the little information there was sat. The sector ranked first by revenue growth beat the average sector by 1.09% the following month, the second by 0.24%, and the third lost 0.39%; ranks 4 to 11 scattered between -0.4% and +0.4%. Momentum looks the same: +1.01% for the first sector, then between -0.6% and +0.4%. Each extra sector diluted the one useful pick with average ones, which is the slope in the heatmap.
That raises the obvious question about holding only the top sector, which scored 1.05 to 1.20. We do not count it, for three reasons. Choosing it after seeing the grid is the selection problem Harvey, Liu & Zhu (2016) warn about: with 20 designs and their grids tried, one cell well above QQQ can appear by chance alone. It is a single-sector bet, with a 31% to 38% maximum drawdown. And its record rests on a few long holdings: the latest-quarter version held XLE for 33 months, returned 64.2% in 2022, and dropped to 0.86 with XLE removed from its choices.
Notes on the other signals
Free-cash-flow yield (0.82 and 0.74) had a weak first half (0.66 and 0.54). Share above the 200-day average had the most even halves (0.78 and 0.75 with two sectors) but traded about four times a year and lost to QQQ over the full window (second half 0.75 against 1.15). Sector ETF 6-month momentum, the classic sector-fund rotation, scored 0.67 and 0.70, below the equal-weight basket; its rank IC was 0.006. Closeness to the 52-week high scored 0.61 and 0.71. The margin-change signals and EPS growth had very weak first halves (0.06 to 0.50, against QQQ's 0.70) and much stronger second halves (0.87 to 1.36), the opposite of a stable effect.
Limits of the sector data
- XLC starts in June 2018. Communication services could only be held from 2018-06-19. In September 2018 S&P and MSCI moved Alphabet and Meta out of information technology and Netflix and Disney out of consumer discretionary into the new sector, and in March 2023 Visa and Mastercard moved from technology to financials. Our scores use today's profile sector for every past month, so Alphabet counts as communication services throughout and Visa as a financial stock, even in months when XLK held them. That is a small look-ahead in how stocks are grouped.
- The scored stocks are not the ETF holdings. The SPDR funds hold S&P 500 members by market value; our score is the median of up to 1,000 traded stocks, most of them smaller. In October 2026 the technology group had 206 stocks and communication services 28.
- Statements start in 2016. FinLab's quarterly US statements cover few companies before 2016 (581 filers for the fourth quarter of 2015 against 3,634 for the first quarter of 2016), so the twelve-month revenue growth and margin-change signals cover 50 stocks in August 2017 and reach 800 only at the end of March 2018, which is why the window starts on 2018-04-02. EPS growth, which skips companies with a loss a year earlier, covers fewer. Starting in August 2017 instead, with fewer sectors scored in the first months, gives the same verdicts: revenue growth 1.02 against 0.90 with 6 of 9 settings ahead, momentum 2 of 9.
- Profiles change daily. The sector and security-type fields are refreshed every day, so rerunning
research.pylater can change the results slightly.
The code
The core of the revenue growth rotation fits in five steps: compute each stock's growth, keep the most traded stocks, take each sector's median, hold the top two sector ETFs, and compare with QQQ.
Show Code
import finlab
import pandas as pd
from finlab import data
from finlab.backtest import sim

finlab.login()  # finlab guides you through login automatically
data.set_market("us")

SECTOR_ETF = {
    "Technology": "XLK", "Financial Services": "XLF", "Healthcare": "XLV",
    "Consumer Cyclical": "XLY", "Consumer Defensive": "XLP", "Energy": "XLE",
    "Industrials": "XLI", "Basic Materials": "XLB", "Utilities": "XLU",
    "Real Estate": "XLRE", "Communication Services": "XLC",
}

# 1. Trailing-12-month revenue growth, dated by SEC filing date
revenue = data.get("us_income_statement:revenue").rolling(4).sum()
growth = (revenue / revenue.shift(4) - 1).index_str_to_date()

# 2. The 1,000 most traded stocks priced above $5; only common stocks get a sector
close = data.get("us_price:close")
dollar_volume = (close * data.get("us_price:volume")).rolling(60).mean()
liquid = dollar_volume[close > 5].rank(axis=1, ascending=False) <= 1000
profile = data.get("us_company_profile")
common = profile[(profile["security_type"] == "common_stock") & ~profile["is_etf"].fillna(False)]
sector = common.set_index("stock_id")["sector"]

# 3. Median growth of each sector on the last trading day of every month
growth = growth.reindex(close.index, method="ffill").reindex(columns=close.columns)
month_ends = close.index.to_series().resample("ME").last().loc["2018-04":]
scores = pd.DataFrame({
    day: growth.loc[day][liquid.loc[day]].groupby(sector).median()
    for day in month_ends
}).T.rename(columns=SECTOR_ETF)

# 4. Hold the two sectors with the fastest growth, equal weight, until next month
data.set_market("us_fund")
etf = data.get("us_fund_price:adj_close")
scores = scores.where(etf.reindex(scores.index)[scores.columns].notna())
position = (scores.rank(axis=1, ascending=False) <= 2).astype(float) / 2
days = etf.loc[month_ends.iloc[0]:].index
report = sim(position.reindex(days, method="ffill"), resample=position.index, upload=False)

# 5. Daily Sharpe against QQQ (dividends reinvested) over the same days
equity = report.creturn
qqq = etf["QQQ"].reindex(equity.index).ffill()
for name, curve in [("Sector rotation", equity), ("QQQ", qqq)]:
    daily = curve.pct_change().dropna()
    print(name, round(daily.mean() / daily.std() * 252 ** 0.5, 2))
With data through 2026-10-28 this prints 1.0 and 0.89. It starts at the end of April 2018, a month later than the study, and skips the ±50% filter, the five-stock minimum, the one-share-class rule and the ADR and fund exclusions. The full research.py adds those and all ten signals, and --grid reproduces every heatmap, half, cost run and XLK control in this article.
Install the FinLab skill for your AI agent
You do not need to write the code above yourself. Install the FinLab skill in Claude Code, Codex or Gemini CLI with one command:
Show Code
npx skills add https://github.com/koreal6803/finlab-ai --skill finlabThen ask your agent in plain language, for example "rank the SPDR sector ETFs by the median revenue growth of their stocks and hold the top two" or "rerun the sector rotation without XLK and compare it with an equal-weight sector basket". The AI agent setup page walks through each tool, the AI-assisted setup connects your FinLab account, and the same research runs in the browser at studio.finlab.finance.
Backtest method and limits
| Item | How it was handled |
|---|---|
| Window | 2018-04-02 to 2026-10-28, the first month the twelve-month revenue and margin signals cover 800 or more stocks. A 2017-08 start gives the same verdicts. |
| Universe | Common stocks from FinLab's US company profile, including later-delisted firms; one share class per company; no ADRs, ETFs or funds. Price above 5 million, no ±50% day in the prior year; the 1,000 highest by dollar volume each month. |
| Sectors | Today's profile sector, mapped to the 11 SPDR sector ETFs. XLC only from 2018-06-19. At least five stocks with a value to score a sector. |
| Look-ahead | Statement items enter on their SEC filing date; prices and market value are point-in-time. Sector labels are a current snapshot (see above). |
| Portfolio | Top 2 or 3 sector ETFs, equal weight, rebalanced on the last trading day of each month, traded at the next close. No leverage. |
| Costs | finlab sim() US defaults: zero commission, zero tax. Base settings rerun with 0.1% per side. Slippage not modelled. |
| Turnover | One-way, per year: revenue growth top 2 1.6, top 3 1.3; 12-1 momentum top 2 4.0; 50-day breadth about 8. |
| Benchmark | QQQ total return, buy and hold, no costs; XLK, SPY and the equal-weight sector basket for reference. Daily Sharpe without a risk-free rate. |
| Sample | All results are in-sample over about eight and a half years. The halves are a stability check, not out-of-sample validation. |
| Software | finlab 2.2.21 with pandas 3.1. Earlier finlab versions keep US market-holiday rows in the ETF prices; see Result 2. |
What this result does and does not say
It says that from 2018 to 2026, ranking US sectors by the typical fundamentals or price trends of their stocks did not reliably beat QQQ, and that the best-looking version worked mainly by holding technology, then leaving it for energy and materials in 2022, which happened to avoid that year's tech sell-off. It does not say sector signals carry no information: the top-ranked sector by revenue growth or momentum did beat the average sector by about 1% a month, but the edge stopped at the first pick, and eight years of monthly data is too short to tell that apart from a few lucky episodes.
For someone thinking of running a sector rotation with real money, the practical reading is that the benchmark matters more than the signal. Over this window technology was the strongest sector by a wide margin, QQQ already holds it, and most rotation rules spent long stretches out of it. The US strategies on FinLab that passed all three checks, such as the momentum study and the ETF rotation backtest, switch between Nasdaq exposure and defence rather than between sectors, and they use leveraged ETFs, which adds its own risk. The factor investing overview tests ten classic stock-level factors on the same data, and other studies cover famous stock screens, leveraged ETF timing rules and lazy asset-allocation portfolios.
FAQ
What is a sector rotation strategy? A rule that moves money between sector funds, such as the 11 SPDR sector ETFs, based on a signal like momentum, earnings growth or the economic cycle, holding the sectors it ranks highest and selling the rest.
Does sector rotation beat the market? Not in this test. Over 2018-2026 none of 20 rule-based designs passed all three checks against QQQ, and 18 of 20 had a lower Sharpe than QQQ even at their base setting. Fourteen of 20 also trailed an equal-weight basket of all 11 sector ETFs.
Which SPDR sector ETF did best from 2018 to 2026? Technology. XLK returned 24.2% a year with a daily Sharpe of 0.95, ahead of QQQ (20.3%, 0.90). The next best Sharpe was health care (XLV, 0.72); real estate (XLRE) was lowest at 0.44.
Does sector momentum work? Weakly. The sector ETFs' own 6-month momentum scored 0.67 and 0.70, below the equal-weight basket. Using the median 12-1 month momentum of each sector's stocks did better (0.95 with two sectors), but only 2 of its 9 neighbouring settings beat QQQ.
Is market breadth a good sector rotation signal? Not on its own here. Holding the sectors with the highest share of stocks above their 200-day average scored 0.76 and 0.83; the 50-day version scored 0.43 and 0.47, the lowest of the price signals, and traded about eight times a year.
What are the 11 SPDR sector ETFs? XLK (technology), XLF (financials), XLV (health care), XLY (consumer discretionary), XLP (consumer staples), XLE (energy), XLI (industrials), XLB (materials), XLU (utilities), XLRE (real estate) and XLC (communication services, launched in June 2018).
Can I rerun this myself?
Yes. Install the FinLab skill through the AI-assisted setup, download research.py below, and run python research.py --grid.
Reproduce it yourself
- research.py: all ten signals and 20 designs, the parameter grids, both halves, the cost runs, the XLK controls and the rank IC.
- data.csv: daily equity curves of the main designs, the controls, QQQ, SPY and all 11 sector ETFs.
- metrics.json: every research.py statistic quoted in this article, including yearly returns and each month's holdings.
More US research is on the FinLab blog. The team behind it is on the about page, examples of what users build are on use cases, and metric definitions are in the glossary.
Last updated: 2026-10 | Backtest window: 2018-04 to 2026-10 | Benchmark: QQQ total return | Author: FinLab Quant Research (reviewed by a quantitative researcher)
Past performance does not represent future results, and every result here is an in-sample backtest. This content is for education only, is not investment advice, and does not constitute investment advice.
FinLab AI
Want to build your own strategy?
Describe your stock-picking ideas in natural language. AI automatically validates, backtests, and gives you answers
Start Free