Run this strategy
Copy the prompt to reproduce the evidence above with the article’s data, assumptions, and risk checks.
Tell your AI:
Set up FinLab and rerun the S&P 500 additions backtest. Please read: https://finlab.finance/en/setup?relatedUrl=/en/blog/sp-500-additions-backtest
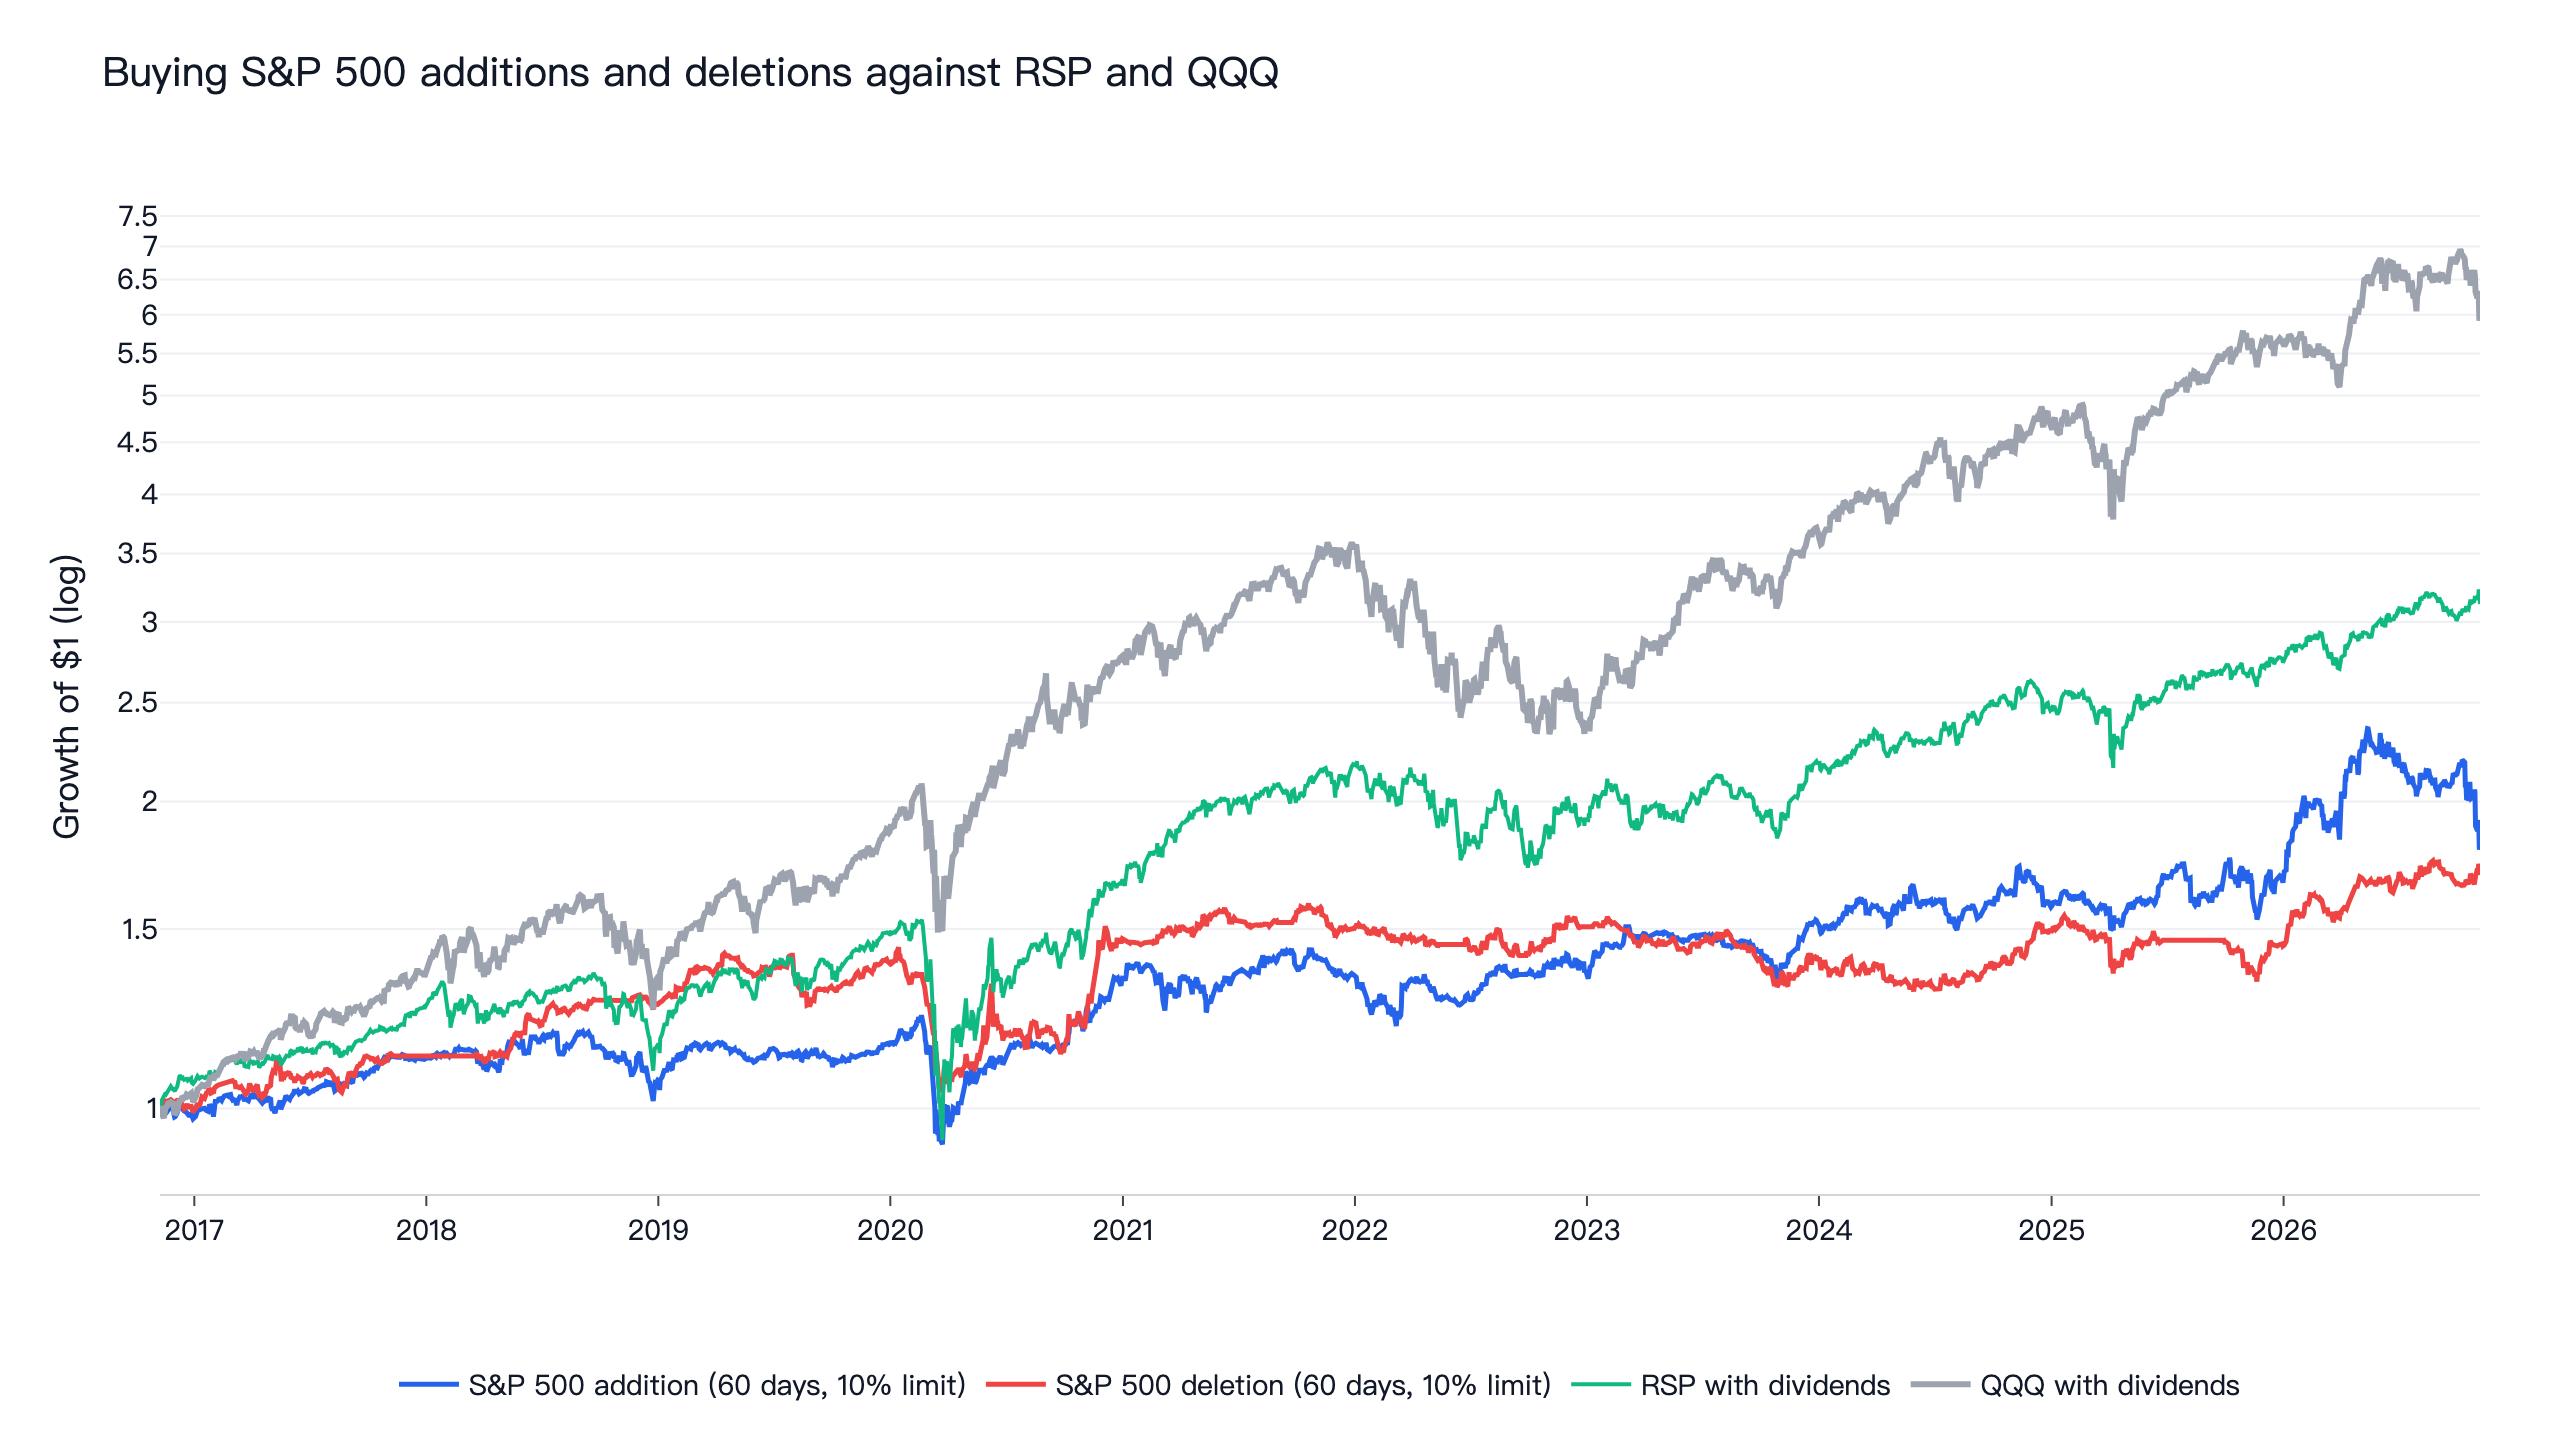
Do stocks rise after S&P 500 additions? From July 2016 to November 2026 we bought every stock the day after it appeared on the list, and held it for 20, 60 or 120 trading days. None of the 18 settings beat QQQ with dividends. Holding additions for 60 days with at most 10% in one stock returned 6.0% a year with a Sharpe ratio of 0.47. Deletions were worse in the second half. The path around the event explains part of it: additions had on average already gained 5.2 percentage points on QQQ in the 20 days before our list date, and most of that was gone by day 120. From November 2022, when the snapshots are daily, the average lead ended higher at day 120, but the median fell from +6.69 to -9.58 points and the rule scored 0.48 against QQQ's 1.20. Buying the announcement itself may be a different trade, and this study does not test it.
"S&P 500 additions" is a popular search because the mechanics are compelling: index funds must buy a stock when it joins, so its price should go up. The question this test can answer is what happens to a stock after the change is visible in a published list, because that is the date a model can actually use without knowing the future.
S&P 500 additions results at a glance
| Rule | Held | Max weight | Daily Sharpe | CAGR | Max drawdown | First / second half Sharpe | Sharpe at 0.1% per side | Average stocks held |
|---|---|---|---|---|---|---|---|---|
| S&P 500 addition | 60 days | 10% | 0.47 | 6.0% | -25.3% | 0.57 / 0.39 | 0.44 | 4.5 |
| S&P 500 deletion | 60 days | 10% | 0.52 | 5.4% | -27.9% | 0.79 / 0.20 | 0.50 | 2.7 |
| QQQ, total return | 0.93 | 20.0% | -35.1% | 1.27 / 0.60 | 0.92 | |||
| SPY, total return | 0.86 | 14.8% | -33.7% | |||||
| RSP, equal-weight S&P 500 | 0.72 | 12.0% | -39.0% |
The window runs from 2016-07-05 to 2026-11-06. The deletion rule starts 2016-11-08 and is compared with QQQ over its own dates (0.91 for QQQ there). Neither rule was fully invested: addition stocks averaged 45% of the account at the original setting and deletion stocks 27%, because there are few events at a time.
What the additions and deletions rules do
- Addition. A stock that was off the S&P 500 list on the previous snapshot and is on it now is bought the next trading day and held for 20, 60 or 120 trading days.
- Deletion. A stock that was on the list and is now off is bought the same way, using the same holding periods. A deleted stock has often fallen a long way, which is why the rule buys it rather than selling it short: some of the literature reports a rebound.
- Weighting. Equal weight across the stocks currently held, with at most 5%, 10% or 20% of the account in one stock, and the rest in cash.
- What is excluded. Ticker changes, same-company reorganisations and list edits reverted within a week are not additions or deletions, so 32 such pairs were removed. A stock has to have a price on the list date. Of the 205 deletions, 67 had already stopped trading by then, 10 have no price history in FinLab and 9 had no price that day, so only 119 could be traded, against 201 of the 204 additions. The deletion results cover only stocks still trading when the list changed.
The list date is the date a snapshot of Wikipedia's S&P 500 constituents page showed the change, and that is the main limit of this study. S&P Dow Jones Indices announces changes in advance, and the snapshots come after. Tesla is a good example: S&P announced its inclusion on November 16, 2020, it took effect on December 21, 2020, and our dataset shows the addition on December 28, 2020. FinLab's dataset description says that before November 8, 2022 the snapshots are a median of 8 days apart and up to 36 days apart, so the dates are often later than the announcement or even the effective date. From that date on the snapshots are daily, but they are still observation dates: a change can appear more than a week late, or early when Wikipedia is edited ahead of time. In September 2025 three additions appeared two weeks early, were reverted a day later and came back after they took effect. The results for both periods are shown below.
The path around S&P 500 additions
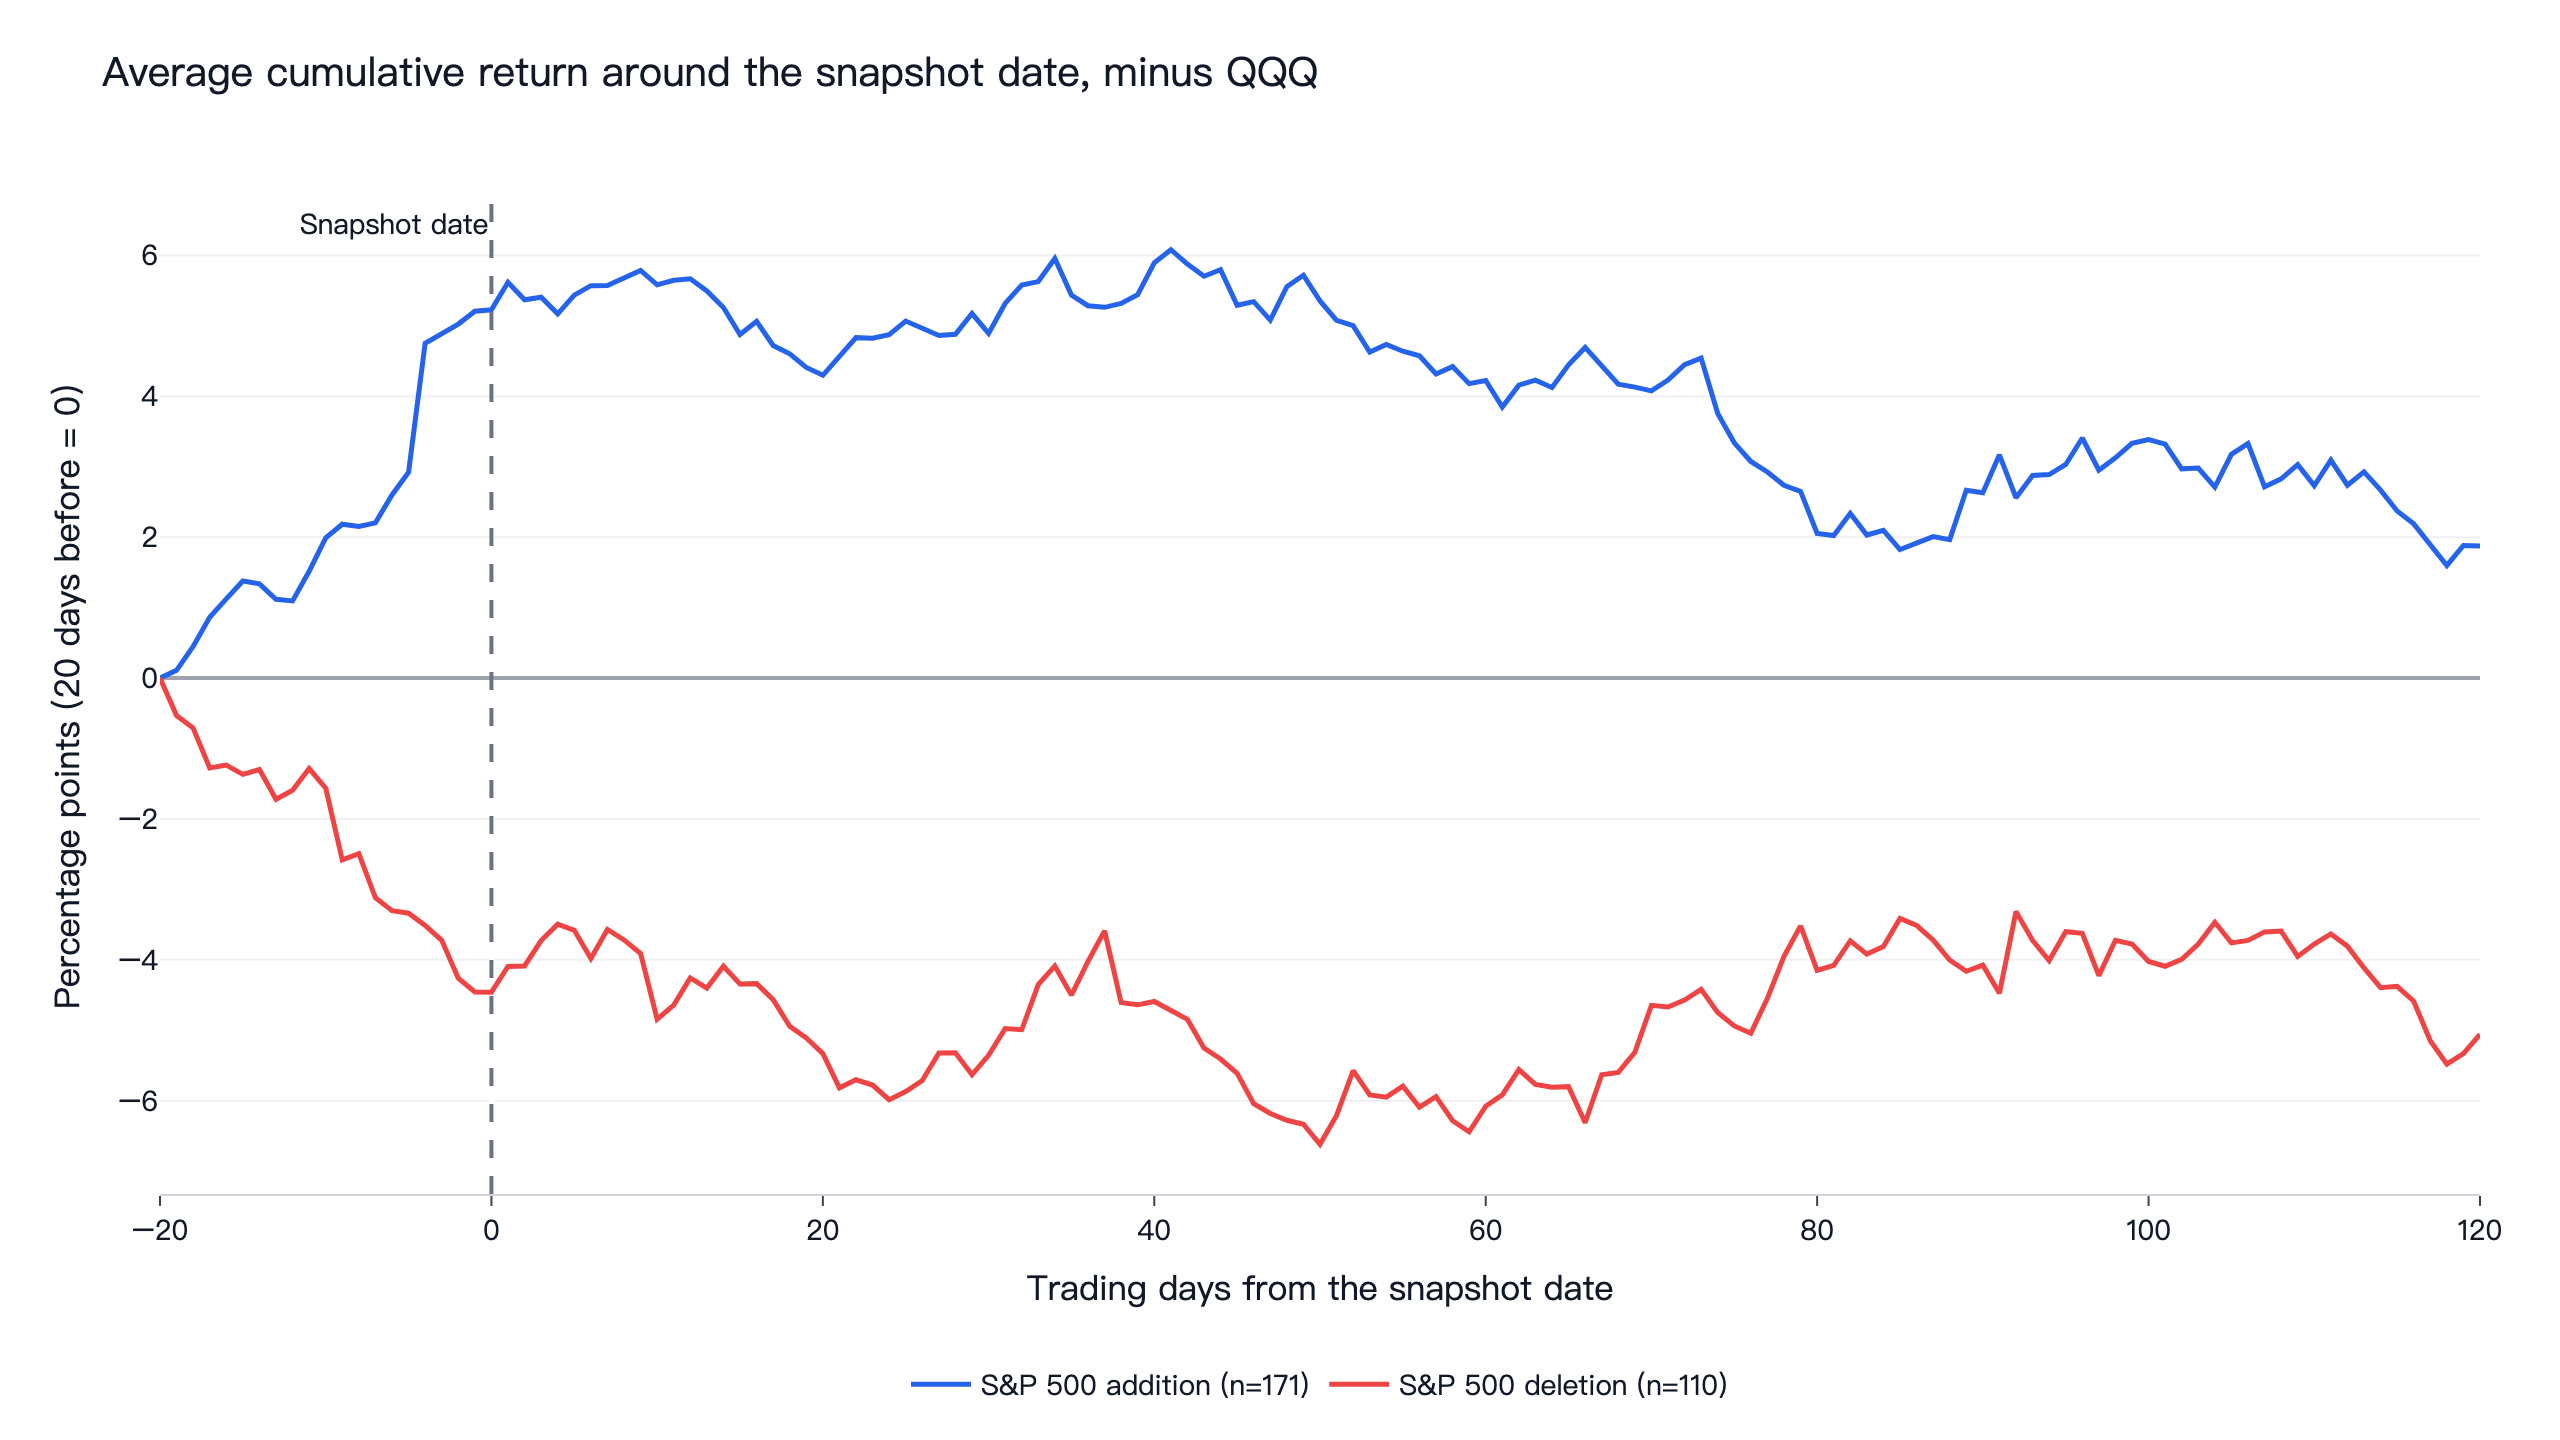
Additions gained 5.23 percentage points on QQQ during the 20 trading days up to the list date. After it, they stayed about 4.2 to 6.1 points ahead for 60 days and fell back to 1.88 points ahead at 120 days. Against RSP they were 7.13 points ahead at 120 days, because QQQ itself ran well ahead of the equal-weight index in this decade, and the lead over QQQ peaked at 6.08 points 41 days after the list date and then shrank.
Deletions fell 4.46 points against QQQ in the 20 days before the list date. Against RSP they had lost 3.72 points and were roughly flat at 120 days (-0.04 points), which is a rebound against the equal-weight index but not against QQQ, where they ended 5.06 points behind.
Windows with a price 20 days before and 120 days after the event, 171 additions and 110 deletions, are used here, which is why the counts are lower than the 201 and 119 tradable events.
| Period | Events | QQQ, day 0 | QQQ, day 20 | QQQ, day 60 | QQQ, day 120 | RSP, day 120 |
|---|---|---|---|---|---|---|
| Additions, all | 171 | +5.23 | +4.30 | +4.23 | +1.88 | +7.13 |
| Additions, snapshots days apart (to 2022-11-07) | 117 | +4.15 | +3.96 | +1.38 | -3.00 | +1.00 |
| Additions, daily snapshots (from 2022-11-08) | 54 | +7.57 | +5.03 | +10.39 | +12.44 | +20.41 |
| Deletions, all | 110 | -4.46 | -5.33 | -6.08 | -5.06 | -0.04 |
| Deletions, snapshots days apart | 67 | -5.00 | -4.86 | -5.03 | -1.71 | +1.99 |
| Deletions, daily snapshots | 43 | -3.61 | -6.06 | -7.71 | -10.27 | -3.20 |
Values are percentage points from 20 days before the list date. On the daily snapshots the mean addition ended higher against QQQ, at +12.44 points on day 120 against +7.57 at the list date, after dipping to +5.03 on day 20. The median fell from +6.69 to -9.58 and the share ahead of QQQ from 72% to 41%, so a few large winners carry the average. The addition rule scored 0.48 from 2022-11-08 on, against QQQ's 1.20, and 0.48 before that date, against 0.77. The later period has only 54 additions and 43 deletions, so treat it as an observation rather than a change of regime.
Harris and Gurel (1986) found that the price effect of being added to the index was large and temporary, consistent with buying pressure from index funds that reverses, and Shleifer (1986) argued the same pressure showed that demand curves for stocks slope down. Chen, Noronha and Singal (2004) found an asymmetry: additions gain permanently and deletions rebound. Greenwood and Sammon (2022) measured the addition effect falling from 3.4% in the 1980s and 7.6% in the 1990s to 0.8% over the past decade, and the deletion effect to -0.6% between 2010 and 2020. Our dates are later than theirs, so the numbers are not directly comparable. In our sample, the share of additions ahead of QQQ fell from 60% on the list date to 40% at day 120.
Returns after the trade date
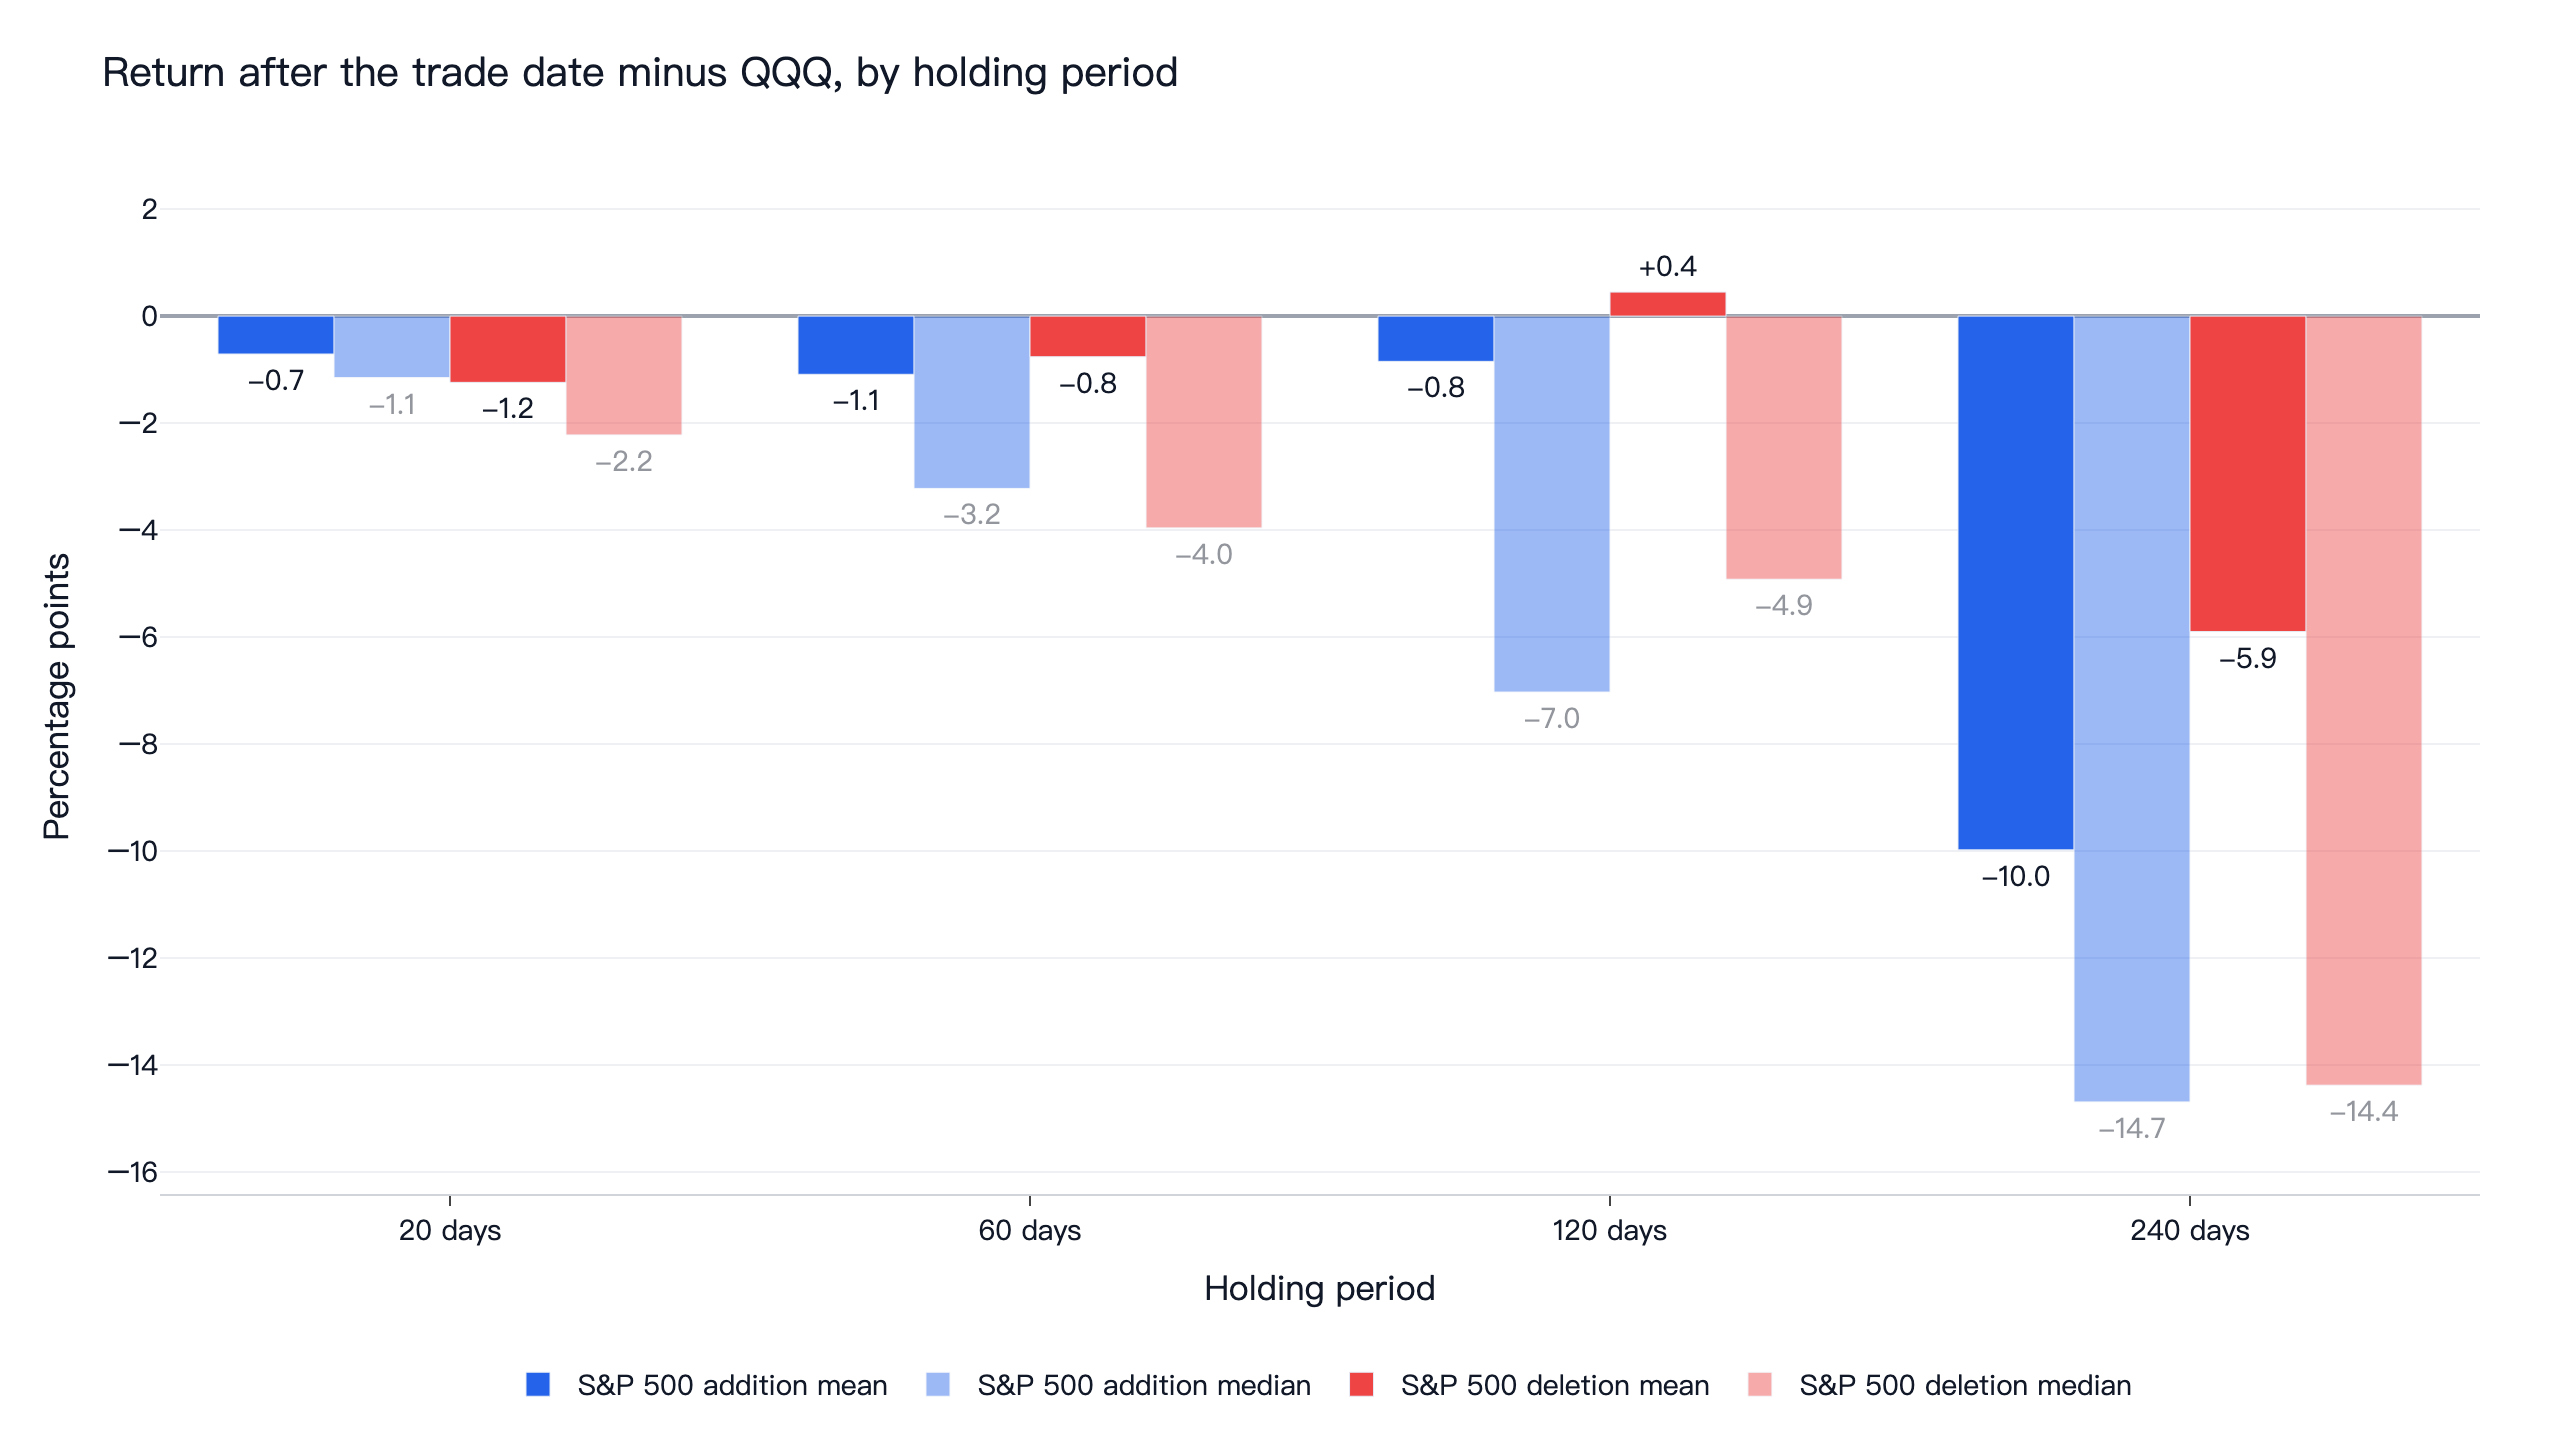
The bars start at the trade date, the day after the signal, so they answer the question the rule actually faces.
- Additions. The mean return against QQQ was -0.71 points over 20 days, -1.09 over 60, -0.85 over 120 and -9.98 over 240. The median additions were much further behind, at -1.15, -3.22, -7.03 and -14.69 points over the same periods. Only 36.4% of additions were ahead of QQQ after 120 days.
- Deletions. The mean was -1.24 points over 20 days, -0.76 over 60, +0.45 over 120 and -5.90 over 240, with medians of -2.22, -3.96, -4.92 and -14.38. Deletions have a similar profile: the mean is held up by a few large rebounds.
Since the mean is above the median in both rules, a few winners account for much of the average gain, and most stocks lose ground to QQQ.
Why every setting failed
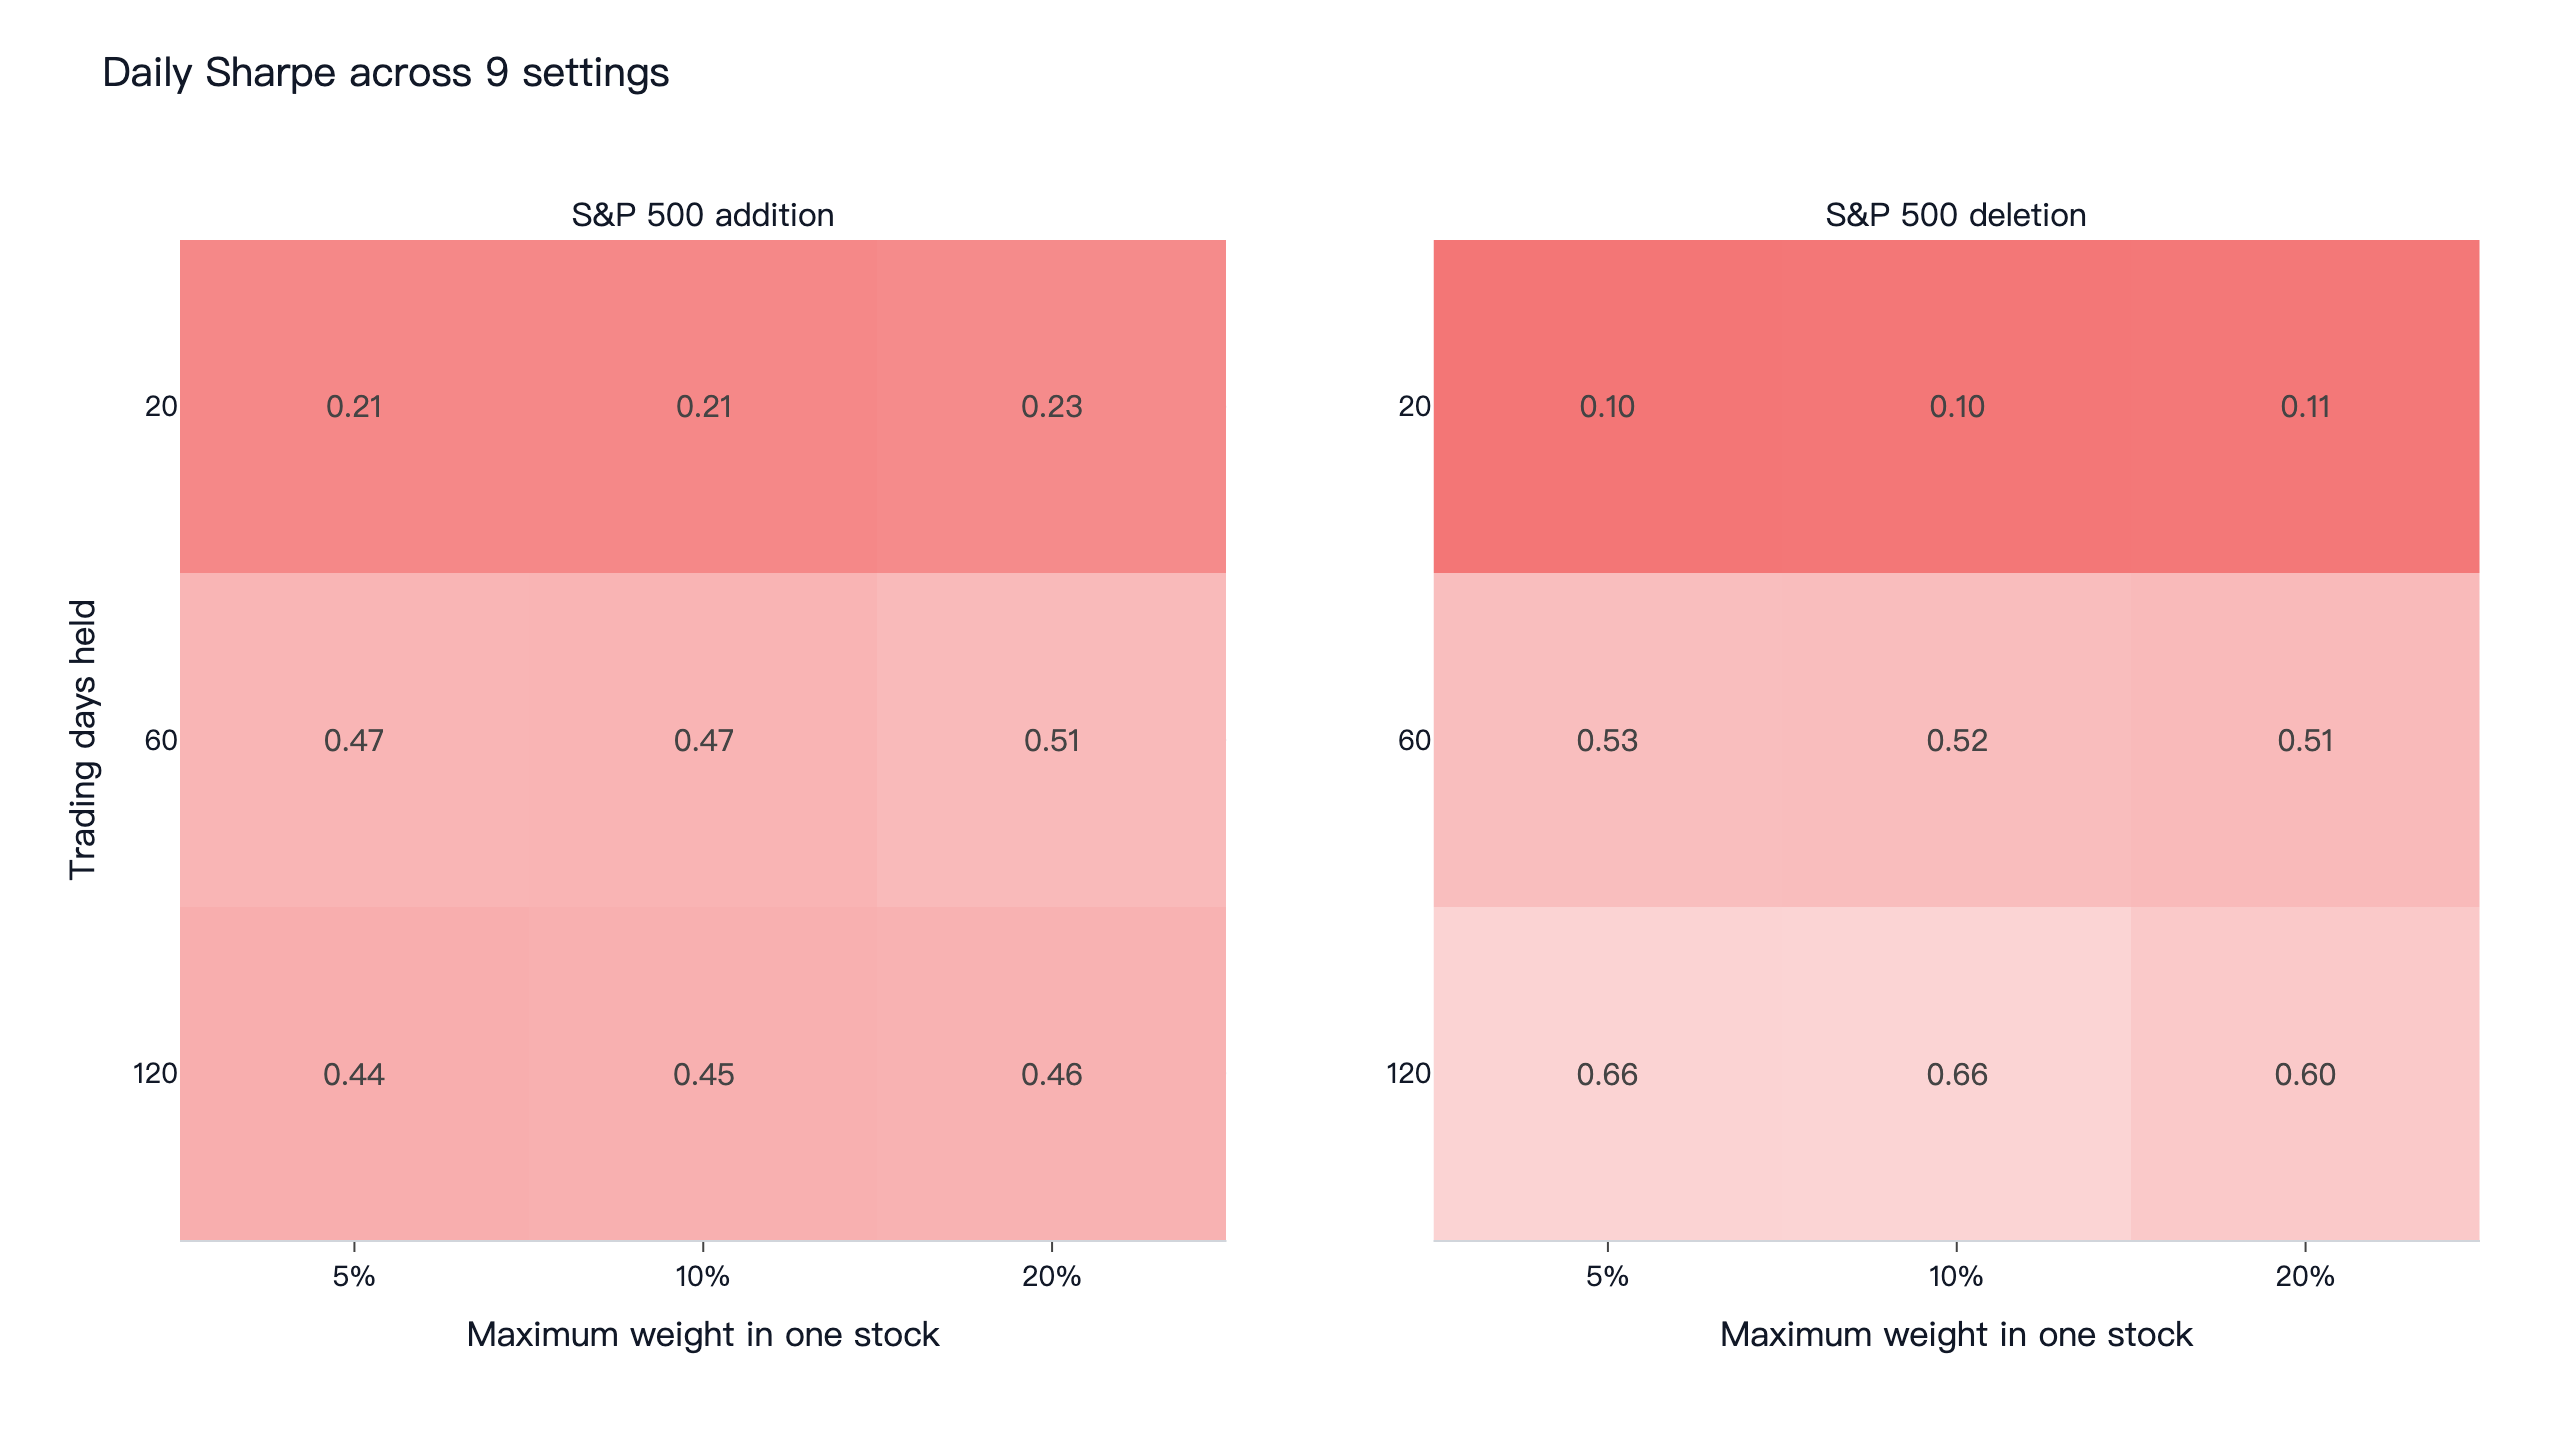
All 18 settings are below QQQ's 0.91 to 0.93. Short holding periods are the worst: holding for 20 days scored 0.21 to 0.23 for additions and 0.10 to 0.11 for deletions. Going from 20 to 60 days helps both rules. Going to 120 days makes no difference for additions (0.44 to 0.46, against 0.47 to 0.51 at 60 days) and helps deletions, which reach 0.66, still 0.25 short of QQQ's 0.91.
The maximum weight does much less than it appears to. Since the addition rule holds only 1.5 to 8.9 stocks on average, a higher limit mostly changes how much of the account is invested. At a 60-day holding period the Sharpe ratio moves only from 0.47 to 0.51 across a 5% to 20% limit, while the average invested share moves from 23% to 80%. Costs matter little too, because trades are few: 0.47 fell to 0.44 at 0.1% per side.
The conditions we fixed before the results were the same as for the other rules in this study, and every condition failed:
- At least 7 of 9 settings beating QQQ.
- Winning both halves. Additions scored 0.57 and 0.39 against QQQ's 1.27 and 0.60. Deletions scored 0.79 and 0.20 against 1.26 and 0.57.
- Winning at 0.1% per side. Additions scored 0.44 and deletions 0.50.
- Winning above T-bills. Both scored 0.32, against QQQ's 0.83 and 0.80.
- Winning without the best year. In 2022, additions led QQQ by 33.7 points and deletions by 32.9 points. Without that year additions scored 0.50 and deletions 0.56, against QQQ's 1.26 and 1.25.
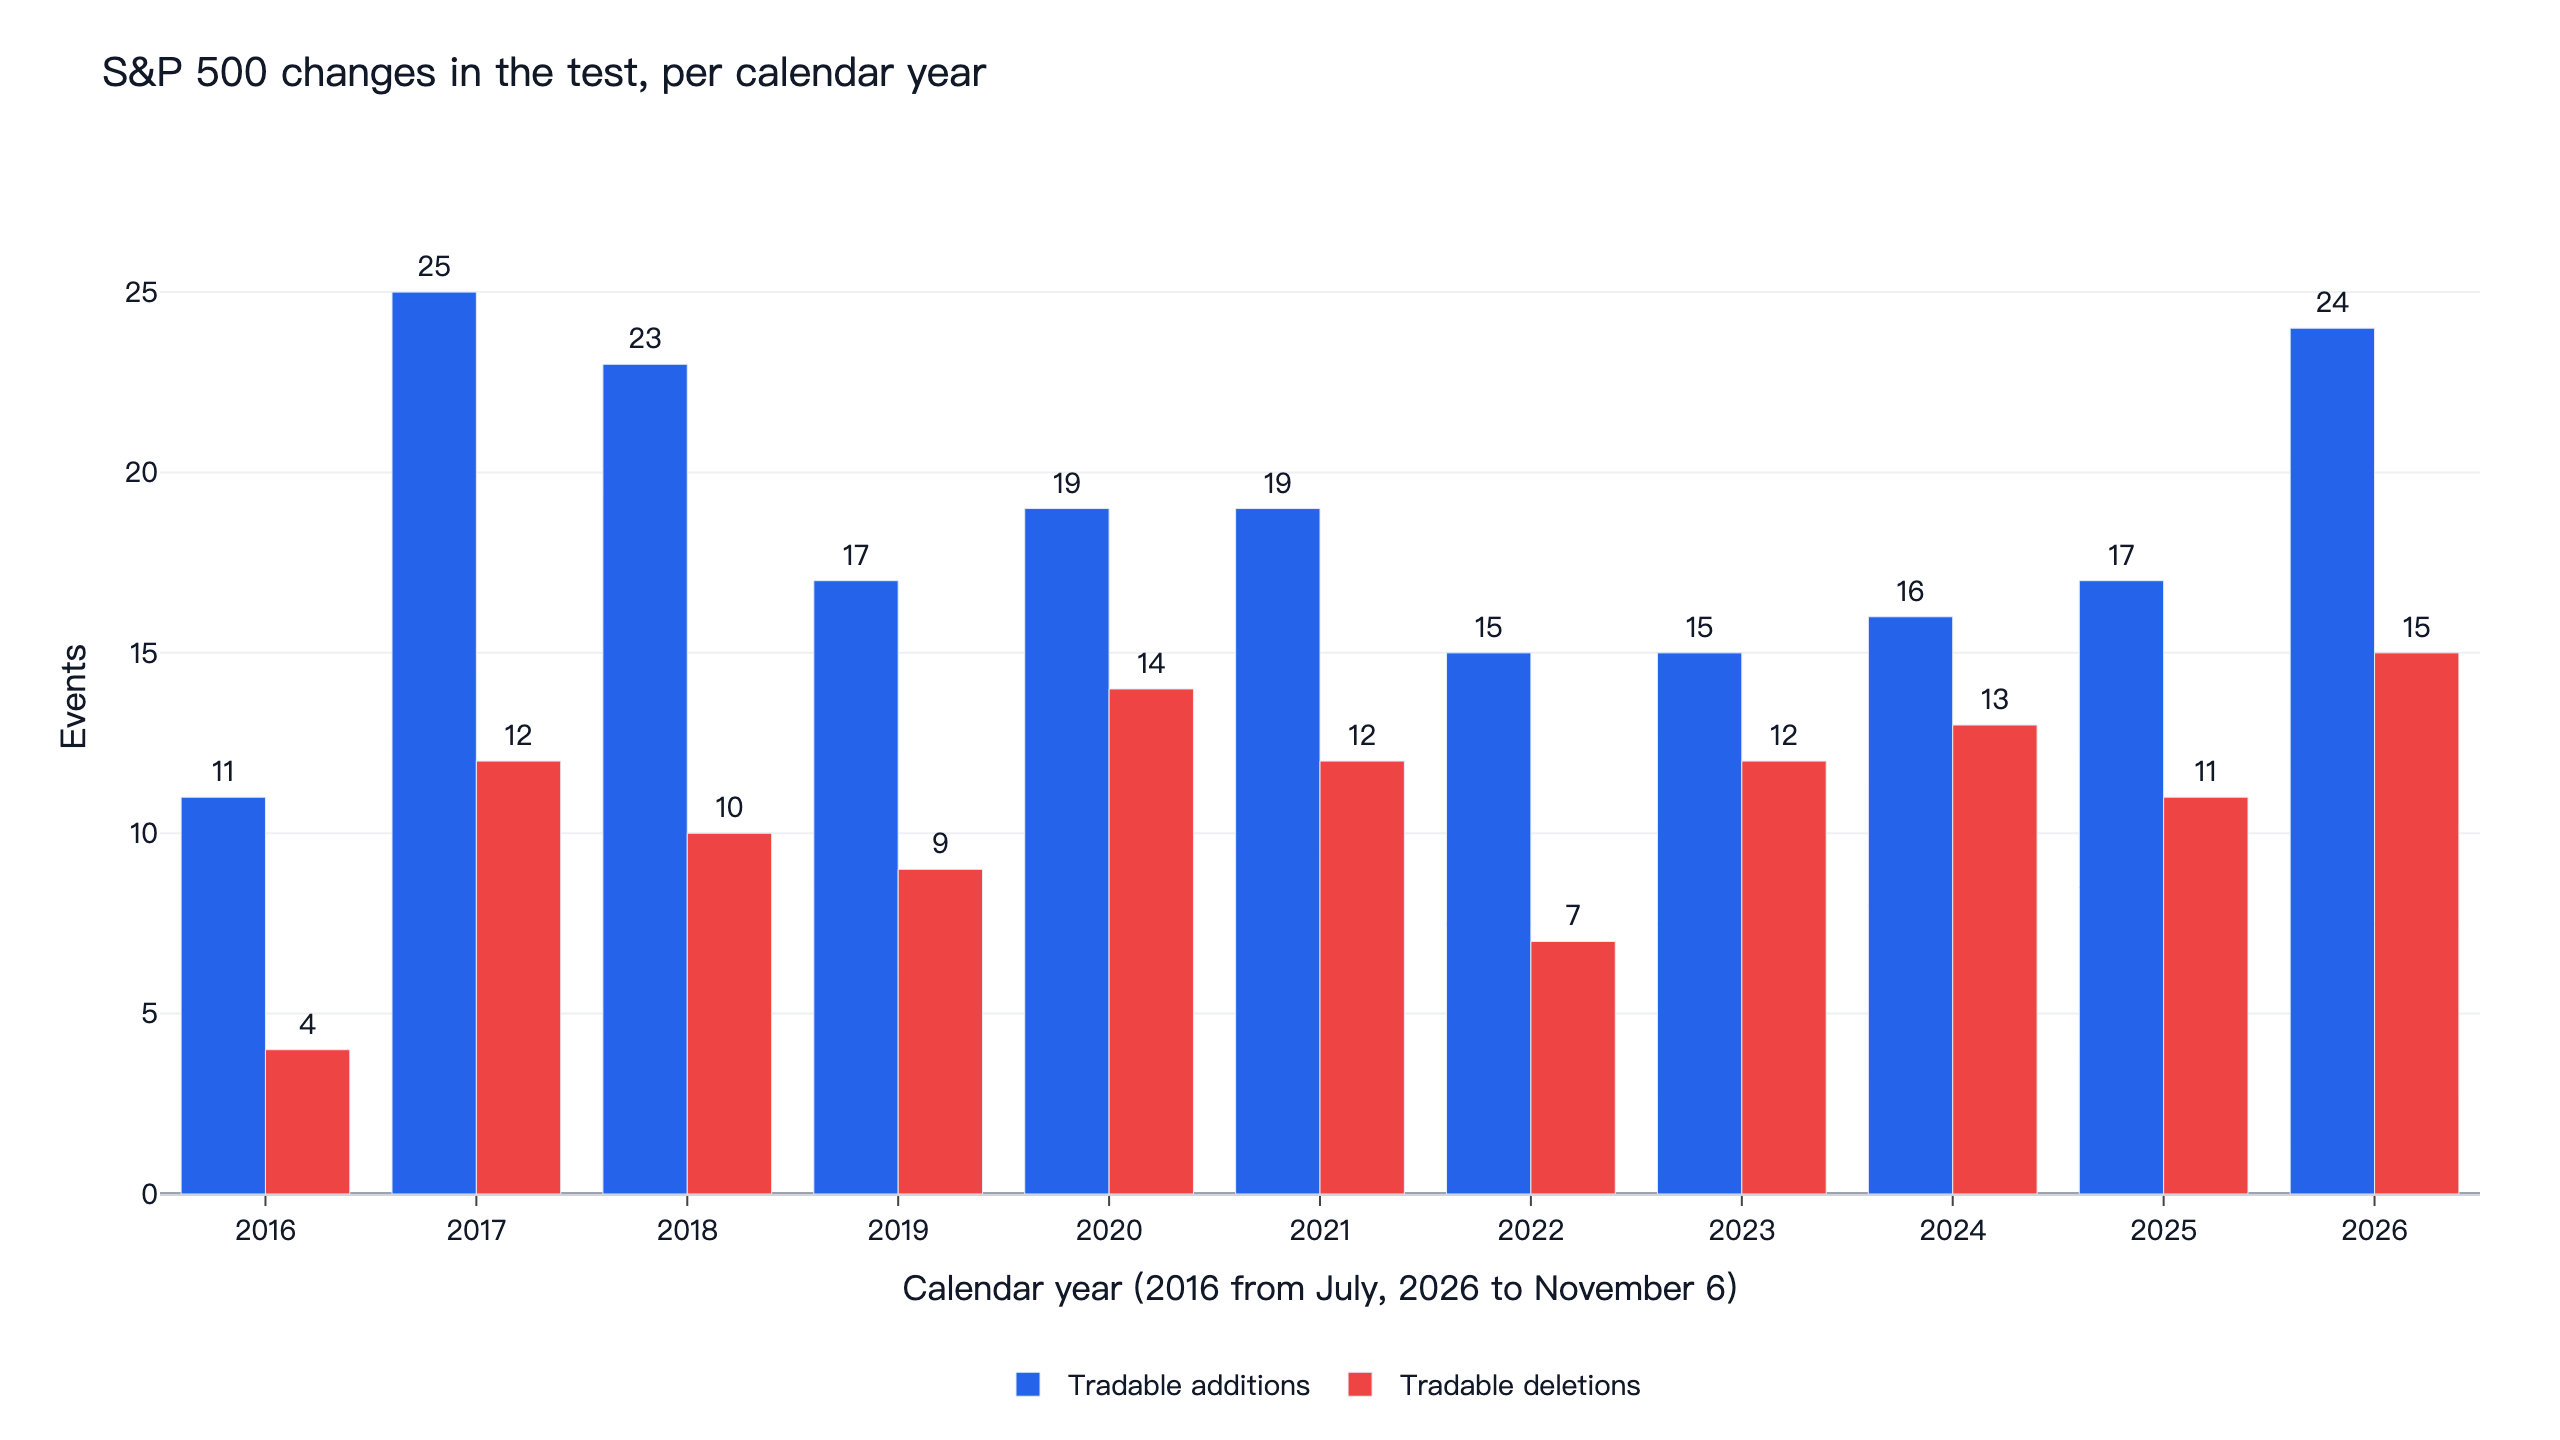
The events are also too few to spread out risk. Over the whole test, there are about 20 additions and 12 deletions a year that we can actually trade, as the chart below shows.
The code
This is the addition rule at its original setting, written for readability. It keeps every list change, so it treats a ticker change such as FISV to FI as an addition. On data through 2026-11-06 it prints a daily Sharpe ratio of 0.41 and an annual return of 5.2%. The research.py file drops ticker changes and same-company reorganisations, and scores 0.47, so the cleanup moves the result visibly and is worth doing in your own tests.
Show Code
import finlab
import numpy as np
import pandas as pd
from finlab import data
from finlab.backtest import sim

finlab.login()
data.set_market("us")
data.truncate_end = "2026-11-06"

close = data.get("us_price:adj_close")
days = close.index

# Index membership on each snapshot day
members = data.get("us_index_constituents:sp500").fillna(False).astype(bool)
members = members.loc[:, members.columns.isin(close.columns)]

# An addition is a stock that was out of the list on the previous snapshot and is in it now
change = members.astype(int).diff().loc["2016-07-01":"2026-11-06"]
additions = change == 1

# Move each snapshot to the next trading day; a position read at that close trades a day later
rows = np.searchsorted(days.values, additions.index.values)
events = pd.DataFrame(False, index=days, columns=additions.columns)
for row, stocks in zip(rows, additions.values):
    if row < len(days):
        events.iloc[row] = events.iloc[row].values | stocks

# Hold each addition for 60 trading days, at most 10% in one stock
position = (events & pd.DataFrame(close[additions.columns].notna()).reindex(index=days).fillna(False))
position = position.astype(float).rolling(60, min_periods=1).max() > 0
position = position.loc["2016-07-01":"2026-11-06"]
position = position.loc[:, position.any()]

report = sim(position, resample=None, position_limit=0.10, upload=False)
returns = report.creturn.pct_change().dropna()
print("Daily Sharpe:", round(returns.mean() / returns.std() * 252 ** 0.5, 2))
print("Annual return:", round(report.creturn.iloc[-1] ** (252 / len(report.creturn)) - 1, 3))
Install the FinLab skill for your AI agent
You do not need to write this yourself. Install the FinLab skill in Claude Code, Codex or Gemini CLI with one command:
Show Code
npx skills add koreal6803/finlab-ai --skill finlab -g -yThen ask your agent in plain language, for example "test S&P 500 additions held for 5 days from the announcement date" or "only buy S&P 500 deletions that fell more than 20% in the prior 60 days". The agent setup page has the details, and FinLab Studio runs the same research in a browser.
Backtest method and limits
| Item | How it was handled |
|---|---|
| Window | 2016-07-01 to 2026-11-06. FinLab's US prices start in January 2016 and the S&P 500 list in January 2015 |
| Universe | Stocks that joined or left the S&P 500 list after removing ticker changes and same-company reorganisations, with a price on the list date |
| Liquidity | S&P 500 membership replaces a dollar-volume filter. Capacity is not estimated |
| Signals | The observed list date, which is known by its date (look-ahead bias control). It can lag the true announcement, particularly before November 8, 2022 |
| Execution | Signal read at a close, traded at the next close, on adjusted prices |
| Weights | Equal weight across current holdings, at most 5%, 10% or 20% in one stock, rest in cash. Turnover was about 1.9 times a year for additions and 1.1 for deletions, one way on target weights |
| Cost | finlab sim() default US cost of zero, plus a rerun at 0.1% per side. Slippage is not estimated separately |
| Taxes | None |
| Sample | Whole window in-sample. The halves only check stability; no out-of-sample test was run |
What this result does and does not say
The rule tests what you can do with the published list, and on that date, buying additions or deletions and holding them did not beat QQQ in any of the 18 settings, and none reached RSP's 0.72. It does not test buying at the announcement. Part of the 5.2-point run-up may fall after the real announcement and part before it, and these dates cannot separate the two. Greenwood and Sammon's estimates above, measured around the announcement, are far smaller than that run-up.
Deletions had fallen about 4.5 points against QQQ by the time the list changed, and they did not close that gap over the next 120 days.
For other results, see the US corporate actions backtest, the dividend capture strategy backtest, the QQQ vs SPY, VOO and VTI backtest, the golden cross stocks backtest and the US quant trading strategies overview. If you are new to rule-based investing, start with our quant trading guide.
FAQ
Do stocks go up after being added to the S&P 500?
Many had already gone up. In this sample, additions gained 5.23 points on QQQ in the 20 days before the list date and were 1.88 points ahead 120 days after. Buying the day after the list changed and holding for 60 days earned a Sharpe ratio of 0.47 against QQQ's 0.93. Since November 2022 the average addition ended higher by day 120, but the median fell behind QQQ.
What happens to stocks removed from the S&P 500?
They fell about 4.5 points against QQQ in the 20 days before the list date and stayed behind QQQ afterward, finishing 5.06 points behind after 120 days. Against the equal-weight RSP, they were about flat by 120 days.
Is the S&P 500 index effect gone?
The academic evidence says it is much smaller than it was. Greenwood and Sammon (2022) put the average addition return at 0.8% over the decade to 2020, down from 7.6% in the 1990s. Our test uses later and less precise dates and covers only 2016 to 2026, so it cannot confirm or refute that decline.
How often does the S&P 500 change?
In the test, 201 additions and 119 deletions were tradable over about 10 years, or about 20 additions and 12 deletions a year. The raw list has more changes, but ticker changes and stocks with no price on the list date are excluded.
Why does the code print 0.41 and the article say 0.47?
The code in the article keeps all list changes, including ticker changes such as FISV to FI, for readability. research.py removes 32 such pairs, which is why it scores 0.47.
Does this mean index funds don't matter?
No. The size of index ownership is a separate question. This test only measures what you could earn by buying the additions after they were publicly visible on a dated list, and that was not better than holding QQQ.
Can I rerun this?
Yes. Install the FinLab skill through the AI-assisted setup, download research.py below and run python research.py.
Reproduce it yourself
- research.py: the full study, including the additions and deletions rules, 18 settings, both halves, the cost runs and the paths around the event.
- data.csv: daily equity curves of both rules at their original settings, plus QQQ, SPY and RSP.
- metrics.json: the statistics behind this article, including the 18 settings and the return paths.
Disclaimer: this article is for education only and does not constitute investment advice. Past performance does not guarantee future results, and investing involves risk. Nothing here recommends any individual stock. All results are in-sample, and the two halves were not validated out of sample.
Last updated: 2026-11 | Backtest window: 2016-07 to 2026-11 | Data through 2026-11-06, run 2026-11-09 | Benchmark: QQQ total return | Author: FinLab Quant Research (reviewed by a quantitative researcher)
FinLab AI
Want to build your own strategy?
Describe your stock-picking ideas in natural language. AI automatically validates, backtests, and gives you answers
Start Free