Run this strategy
Copy the prompt to reproduce the evidence above with the article’s data, assumptions, and risk checks.
Tell your AI:
Set up FinLab and rerun the ROE, net income growth and PEG ratio screens on the 200 largest US companies against QQQ. Please read: https://finlab.finance/en/setup?relatedUrl=/en/blog/us-large-cap-factors-backtest
Did picking growth stocks, high-ROE companies or cash-rich businesses among US large caps beat simply holding QQQ over the past nine years? We rebuilt 17 factors that FinLab's fundamentals cover and ran them on point-in-time data: net income and revenue growth, ROE and ROIC, free cash flow yield, the PEG ratio, price to sales, EV/EBITDA, earnings yield, plus momentum, low volatility and two composites. From August 2017 to October 2026, none of 85 portfolios beat QQQ with dividends reinvested in both halves of the window. Among the 85, the only one with a higher full-window daily Sharpe was the 10 stocks with the best growth-plus-momentum score among the 100 largest companies (0.98 against 0.90), but it scored 0.76 in 2017-2022 and only 2 of 9 neighbouring settings beat QQQ. High ROE and net income growth both reached 0.89 and also lost the first half. Adding a "hold only when QQQ is above its 200-day average" market filter made 34 of 40 portfolios worse, and cut QQQ's own Sharpe from 0.90 to 0.85. So no portfolio in this study counts as a working strategy.
Key numbers: the closest portfolios and the valuation and cash-flow factors
| Portfolio (universe, stocks held) | Daily Sharpe | First / second half | CAGR | Max drawdown | Neighbouring settings beating QQQ |
|---|---|---|---|---|---|
| Growth + momentum (top 100 by market value, 10) | 0.98 | 0.76 / 1.18 | 29.1% | -33.8% | 2 / 9 |
| Net income growth (top 200, 20) | 0.89 | 0.78 / 1.00 | 18.4% | -29.9% | 2 / 9 |
| ROE (top 200, 20) | 0.89 | 0.81 / 1.01 | 15.3% | -35.8% | 3 / 9 |
| Operating margin change (top 200, 20) | 0.87 | 0.67 / 1.07 | 19.8% | -32.2% | failed screen |
| Low price to sales (top 200, 20) | 0.76 | 0.56 / 1.08 | 13.7% | -43.0% | failed screen |
| Low PEG ratio (top 200, 20) | 0.75 | 0.67 / 0.84 | 13.1% | -35.0% | failed screen |
| Free cash flow yield (top 200, 20) | 0.75 | 0.55 / 1.01 | 13.3% | -39.0% | failed screen |
| Low EV/EBITDA (top 200, 20) | 0.74 | 0.54 / 0.99 | 14.6% | -43.7% | failed screen |
| Earnings yield (top 200, 20) | 0.60 | 0.51 / 0.72 | 10.4% | -39.8% | failed screen |
| Top 200, equal weight | 0.74 | 0.62 / 0.90 | 12.1% | -34.9% | control |
| QQQ, total return | 0.90 | 0.93 / 0.87 | 20.0% | -35.1% | benchmark |
| SPY, total return | 0.84 | 14.9% | -33.7% | reference |
Every portfolio runs from 2017-08-01 to 2026-10-28; QQQ and SPY are buy and hold with dividends reinvested over the same days. The other 31 portfolios and the filtered versions are in the full table further down.
How a portfolio had to pass
"Beat" means one thing here: a higher daily Sharpe ratio than QQQ total return over exactly the same trading days. Sharpe is the mean daily return over its standard deviation, annualised with √252, with no risk-free rate subtracted. These are the same rules as in our 10 academic factors study and the six famous stock screens:
- Both halves (used as the first screen). The window splits at its midpoint, 2022-03-16, where QQQ scored 0.93 in the first half and 0.87 in the second. A portfolio passed the screen only if its full-window, first-half and second-half Sharpe all beat QQQ.
- Neighbouring settings must win too. A portfolio that passed would get a grid: universe size and number of holdings, each at its base value and one neighbour either side (about ±50%), nine settings in all, at least 70% of which had to beat QQQ. Nothing passed the screen, so we also ran the grid for the three portfolios with the highest full-window Sharpe, to check whether they had missed by a parameter choice.
- Costs included. Every run uses finlab
sim()with its default US cost model (USMarket: zero commission, no transfer tax), the norm at commission-free brokers. The three closest portfolios were rerun with 0.1% cost per side.
The 17 factors and the universe
All fundamentals come from FinLab's us_income_statement, us_balance_sheet and us_cash_flow tables, which date each number by its SEC filing date, so nothing enters a score before the 10-Q or 10-K is public. Market value comes from etl:us_market_value, which already accounts for share count changes and splits.
Universe. US-headquartered common stocks, including firms later acquired or delisted, one share class per company, with no ADRs, ETFs, funds or financials (bank and insurer revenue and debt do not compare with other companies). We keep US companies only because the valuation factors divide statement items by market value, and foreign filers such as Canadian companies report in their home currency while their market value is in dollars. Stocks must trade above 5 million a day of volume over 60 days, and a stock is dropped for a year after any ±50% day (usually a data error or a reused ticker). Each day we take two large-cap universes: the 200 largest by market value, and the 500 most traded by dollar volume, which adds some actively traded mid caps.
Selection. At each month end the stocks are ranked by the factor and the top 20 are held at equal weight, trading at the next day's close. Among the 100 largest companies we also tested net income growth, ROIC and the growth-plus-momentum composite with 10 and 30 holdings.
The 17 factors fall into six groups (TTM = trailing twelve months):
- Growth: net income growth (TTM year over year, last year positive), revenue growth, operating margin change (TTM operating margin minus a year earlier), and R&D intensity (TTM R&D over revenue).
- Profitability: ROIC (TTM operating income over total debt plus equity), return on equity (TTM net income over latest positive equity; Hou, Xue & Zhang (2015) make ROE one of the four factors in their q-factor model), and gross profitability (TTM gross profit over total assets, Novy-Marx (2013)).
- Cash flow and payouts: free cash flow yield (TTM free cash flow over market value) and shareholder yield (TTM net buybacks plus dividends over market value).
- Valuation: low PEG ratio (P/E divided by net income growth in percent, only where both are positive; popularised by Lynch (1989), who treated a PEG below 1 as cheap), low price to sales (market value over TTM revenue; Barbee, Mukherji & Raines (1996) found it explained returns better than book to market), low EV/EBITDA (the enterprise multiple of Loughran & Wellman (2011)), and earnings yield (TTM net income over market value, the inverse of P/E, as in Basu (1977)).
- Price: 12-1 month momentum (the past 12 months' return skipping the latest month, Jegadeesh & Titman (1993)) and low volatility (lowest 126-day standard deviation of returns).
- Composites: growth + momentum (the average percentile rank of momentum, revenue growth and operating margin change within the universe) and quality + momentum (momentum, gross profitability and ROIC).
Valuation factors are ranked so that higher means cheaper (revenue over market value instead of price to sales, for example), so companies with negative earnings or EBITDA are never treated as bargains.
Result 1: none of 85 portfolios beat QQQ in both halves
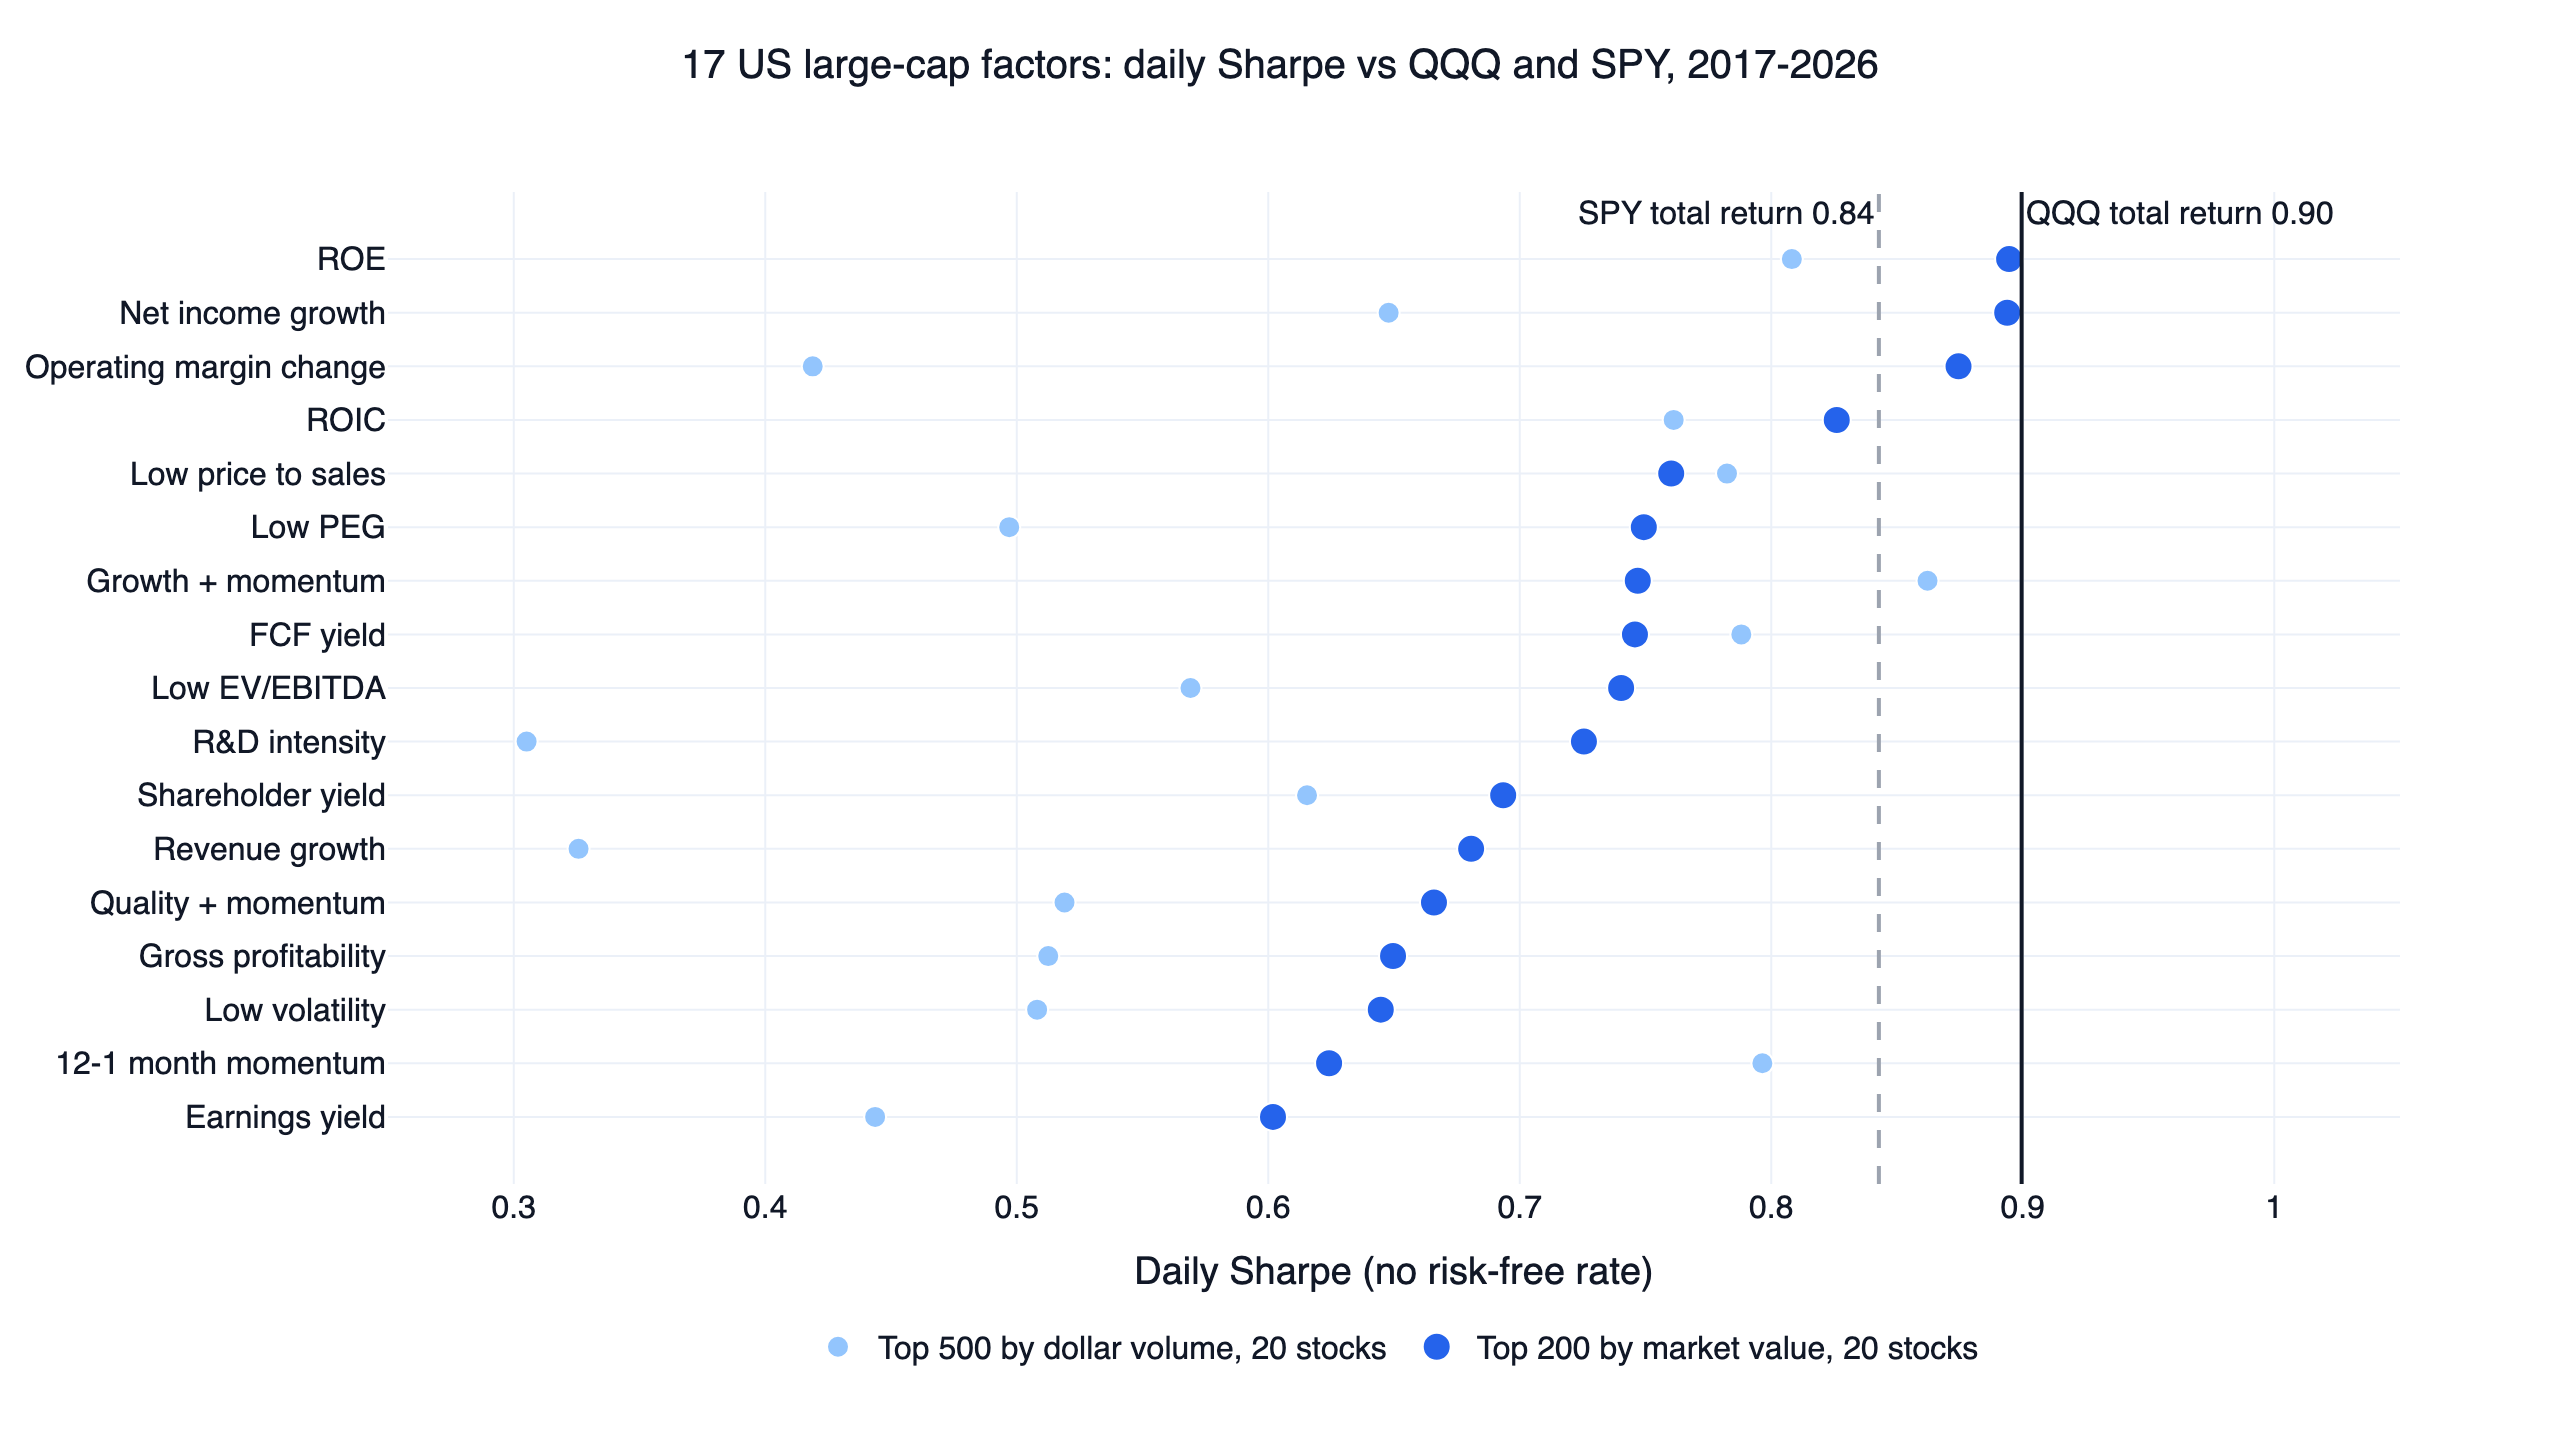
The chart at the top shows each factor's daily Sharpe holding 20 stocks in both universes. Among the 200 largest companies the best were ROE and net income growth at 0.89, against 0.90 for QQQ, followed by operating margin change at 0.87 and ROIC at 0.83. The weakest were earnings yield at 0.60 and 12-1 month momentum at 0.62. The 500-most-traded universe was generally lower: 13 of the 17 factors scored worse there than among the 200 largest, and its best was growth + momentum at 0.86.
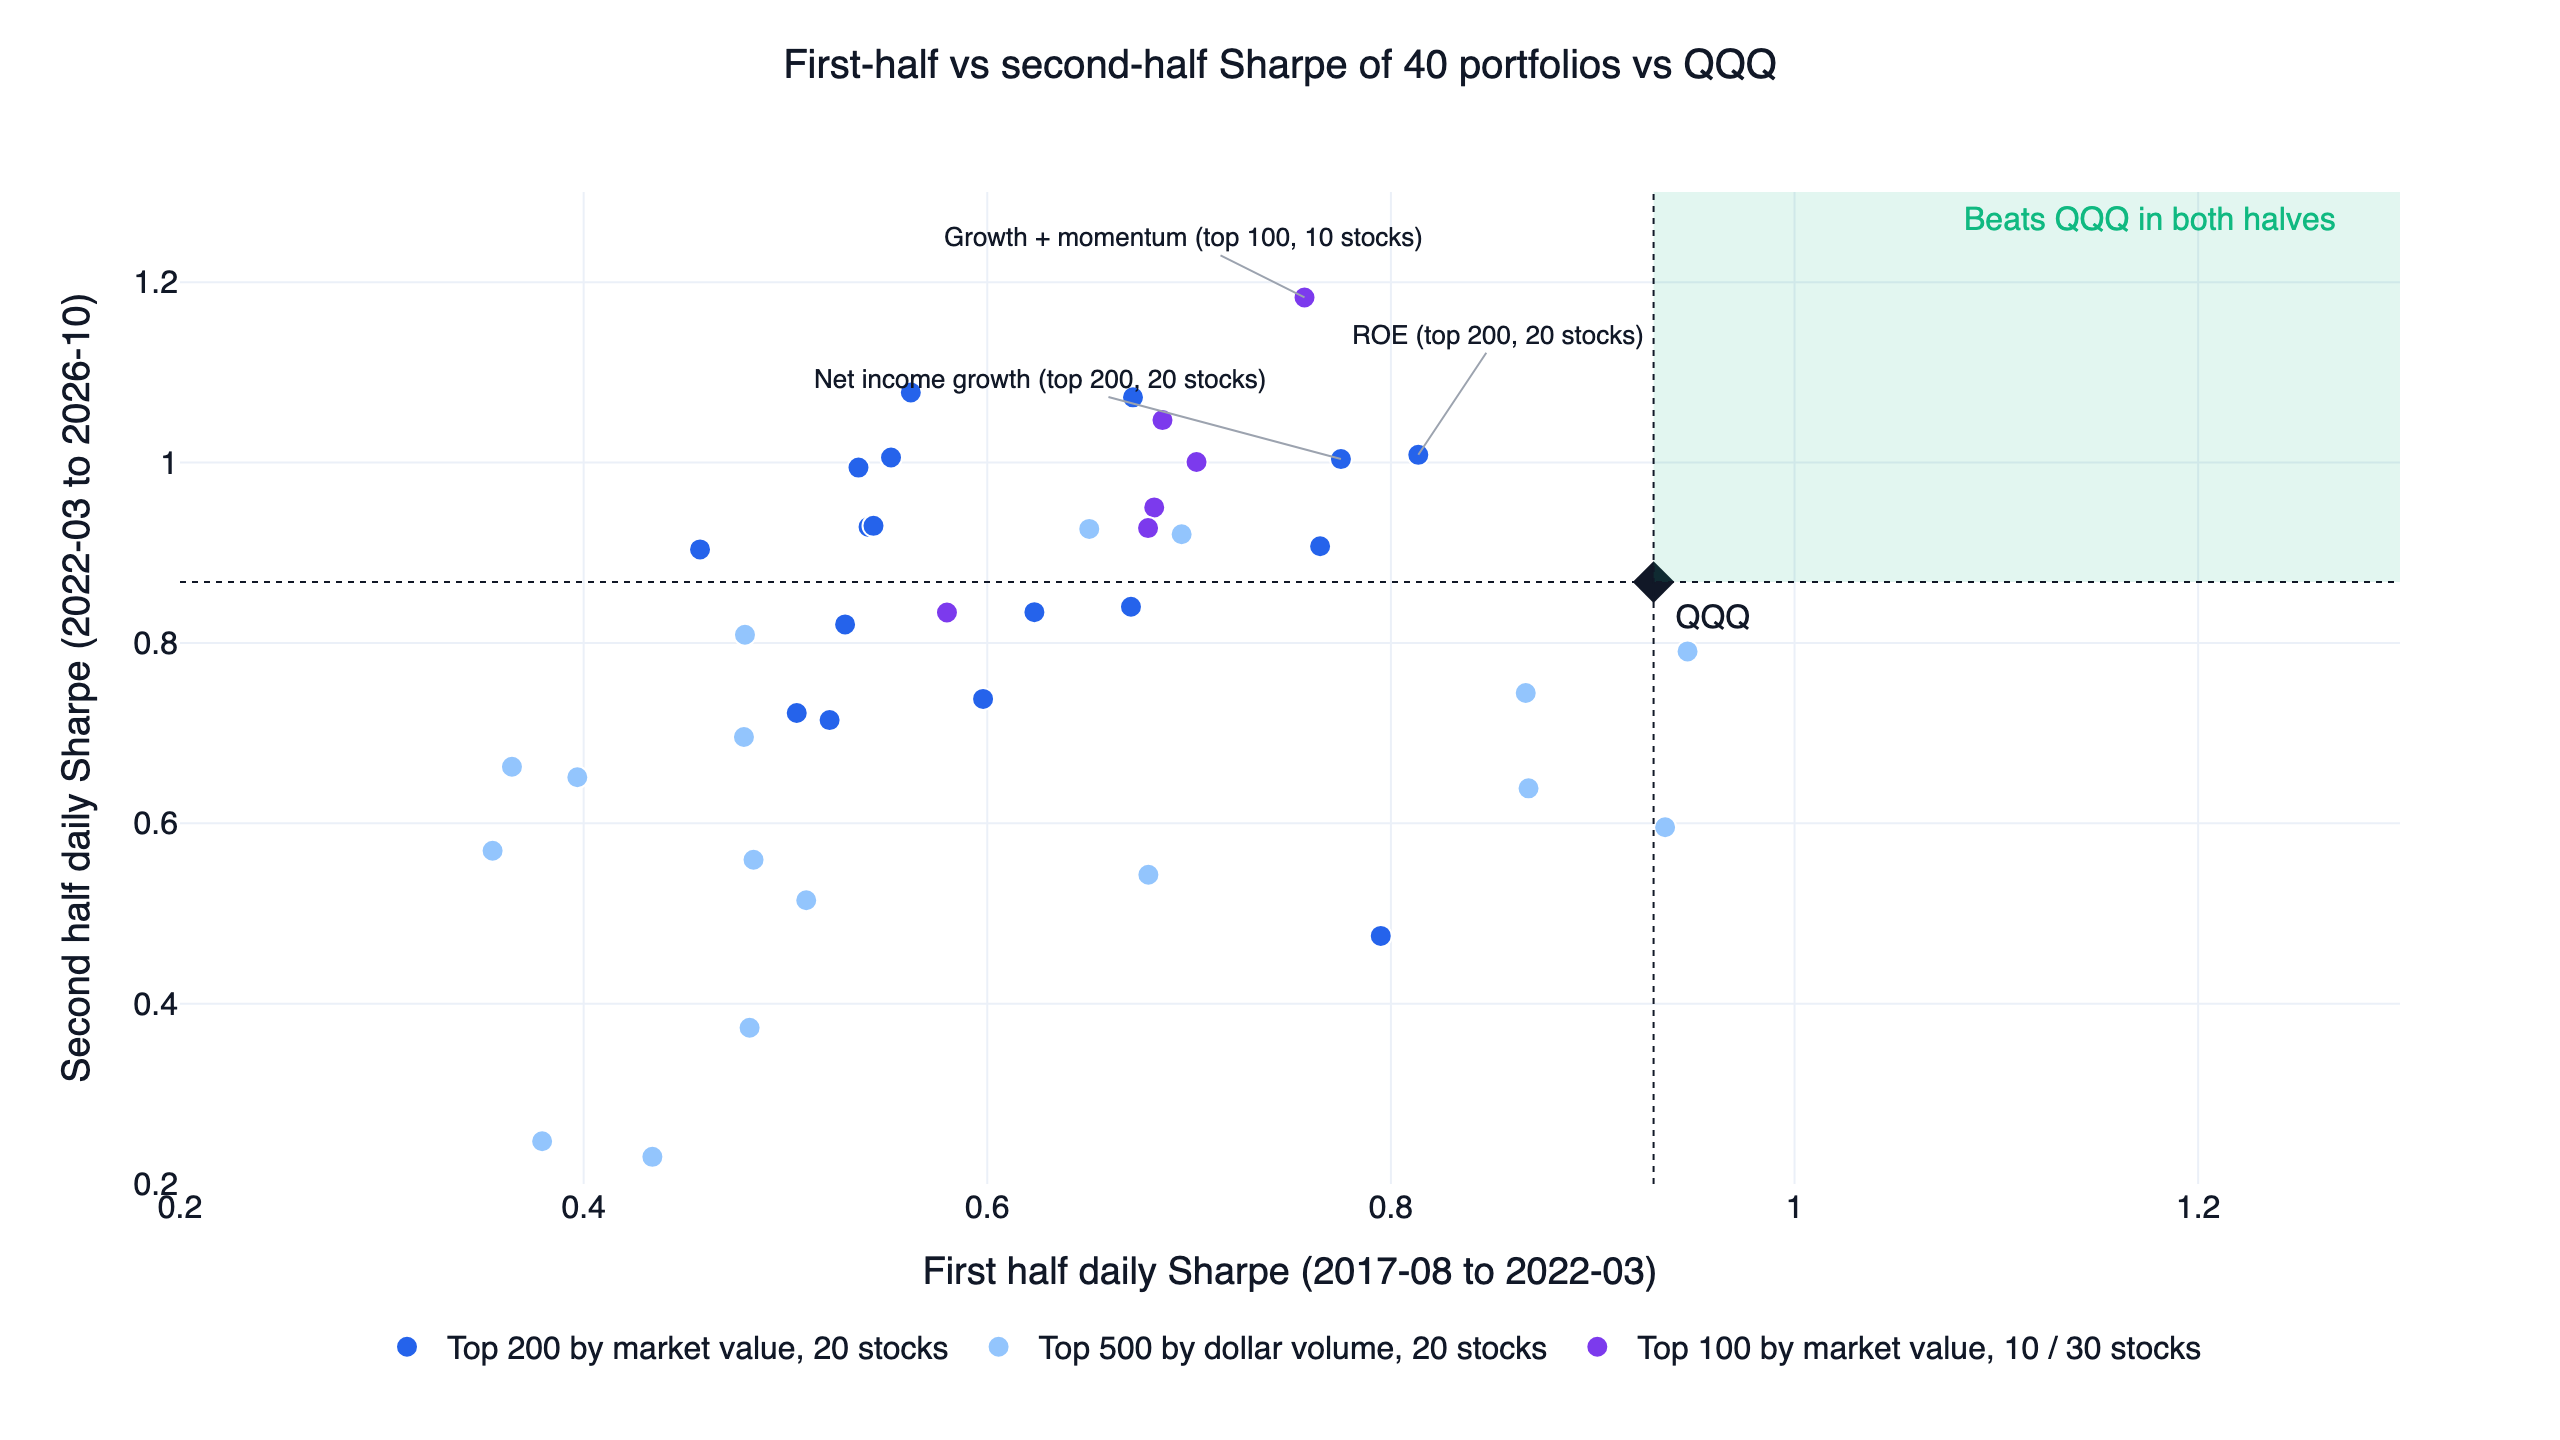
Plotting each of the 40 stock portfolios by first-half and second-half Sharpe leaves the green corner, where both halves beat QQQ, empty. In the second half (March 2022 to October 2026) 17 portfolios beat QQQ's 0.87; in the first half (August 2017 to March 2022) only two beat QQQ's 0.93: low price to sales (0.94) and growth + momentum (0.95), both in the 500-most-traded universe, and their second halves fell to 0.60 and 0.79. The winners of the two halves barely overlap, so no single way of picking large caps held an edge over QQQ through this window.
We also tried five designs that are not a plain factor ranking (see "Other designs we tried" below), and none passed the screen either. Across all 85 portfolios (40 stock portfolios, the same 40 with a market filter, and five others), zero passed the screen and zero passed all three checks.
Result 2: the three closest portfolios lose with neighbouring settings
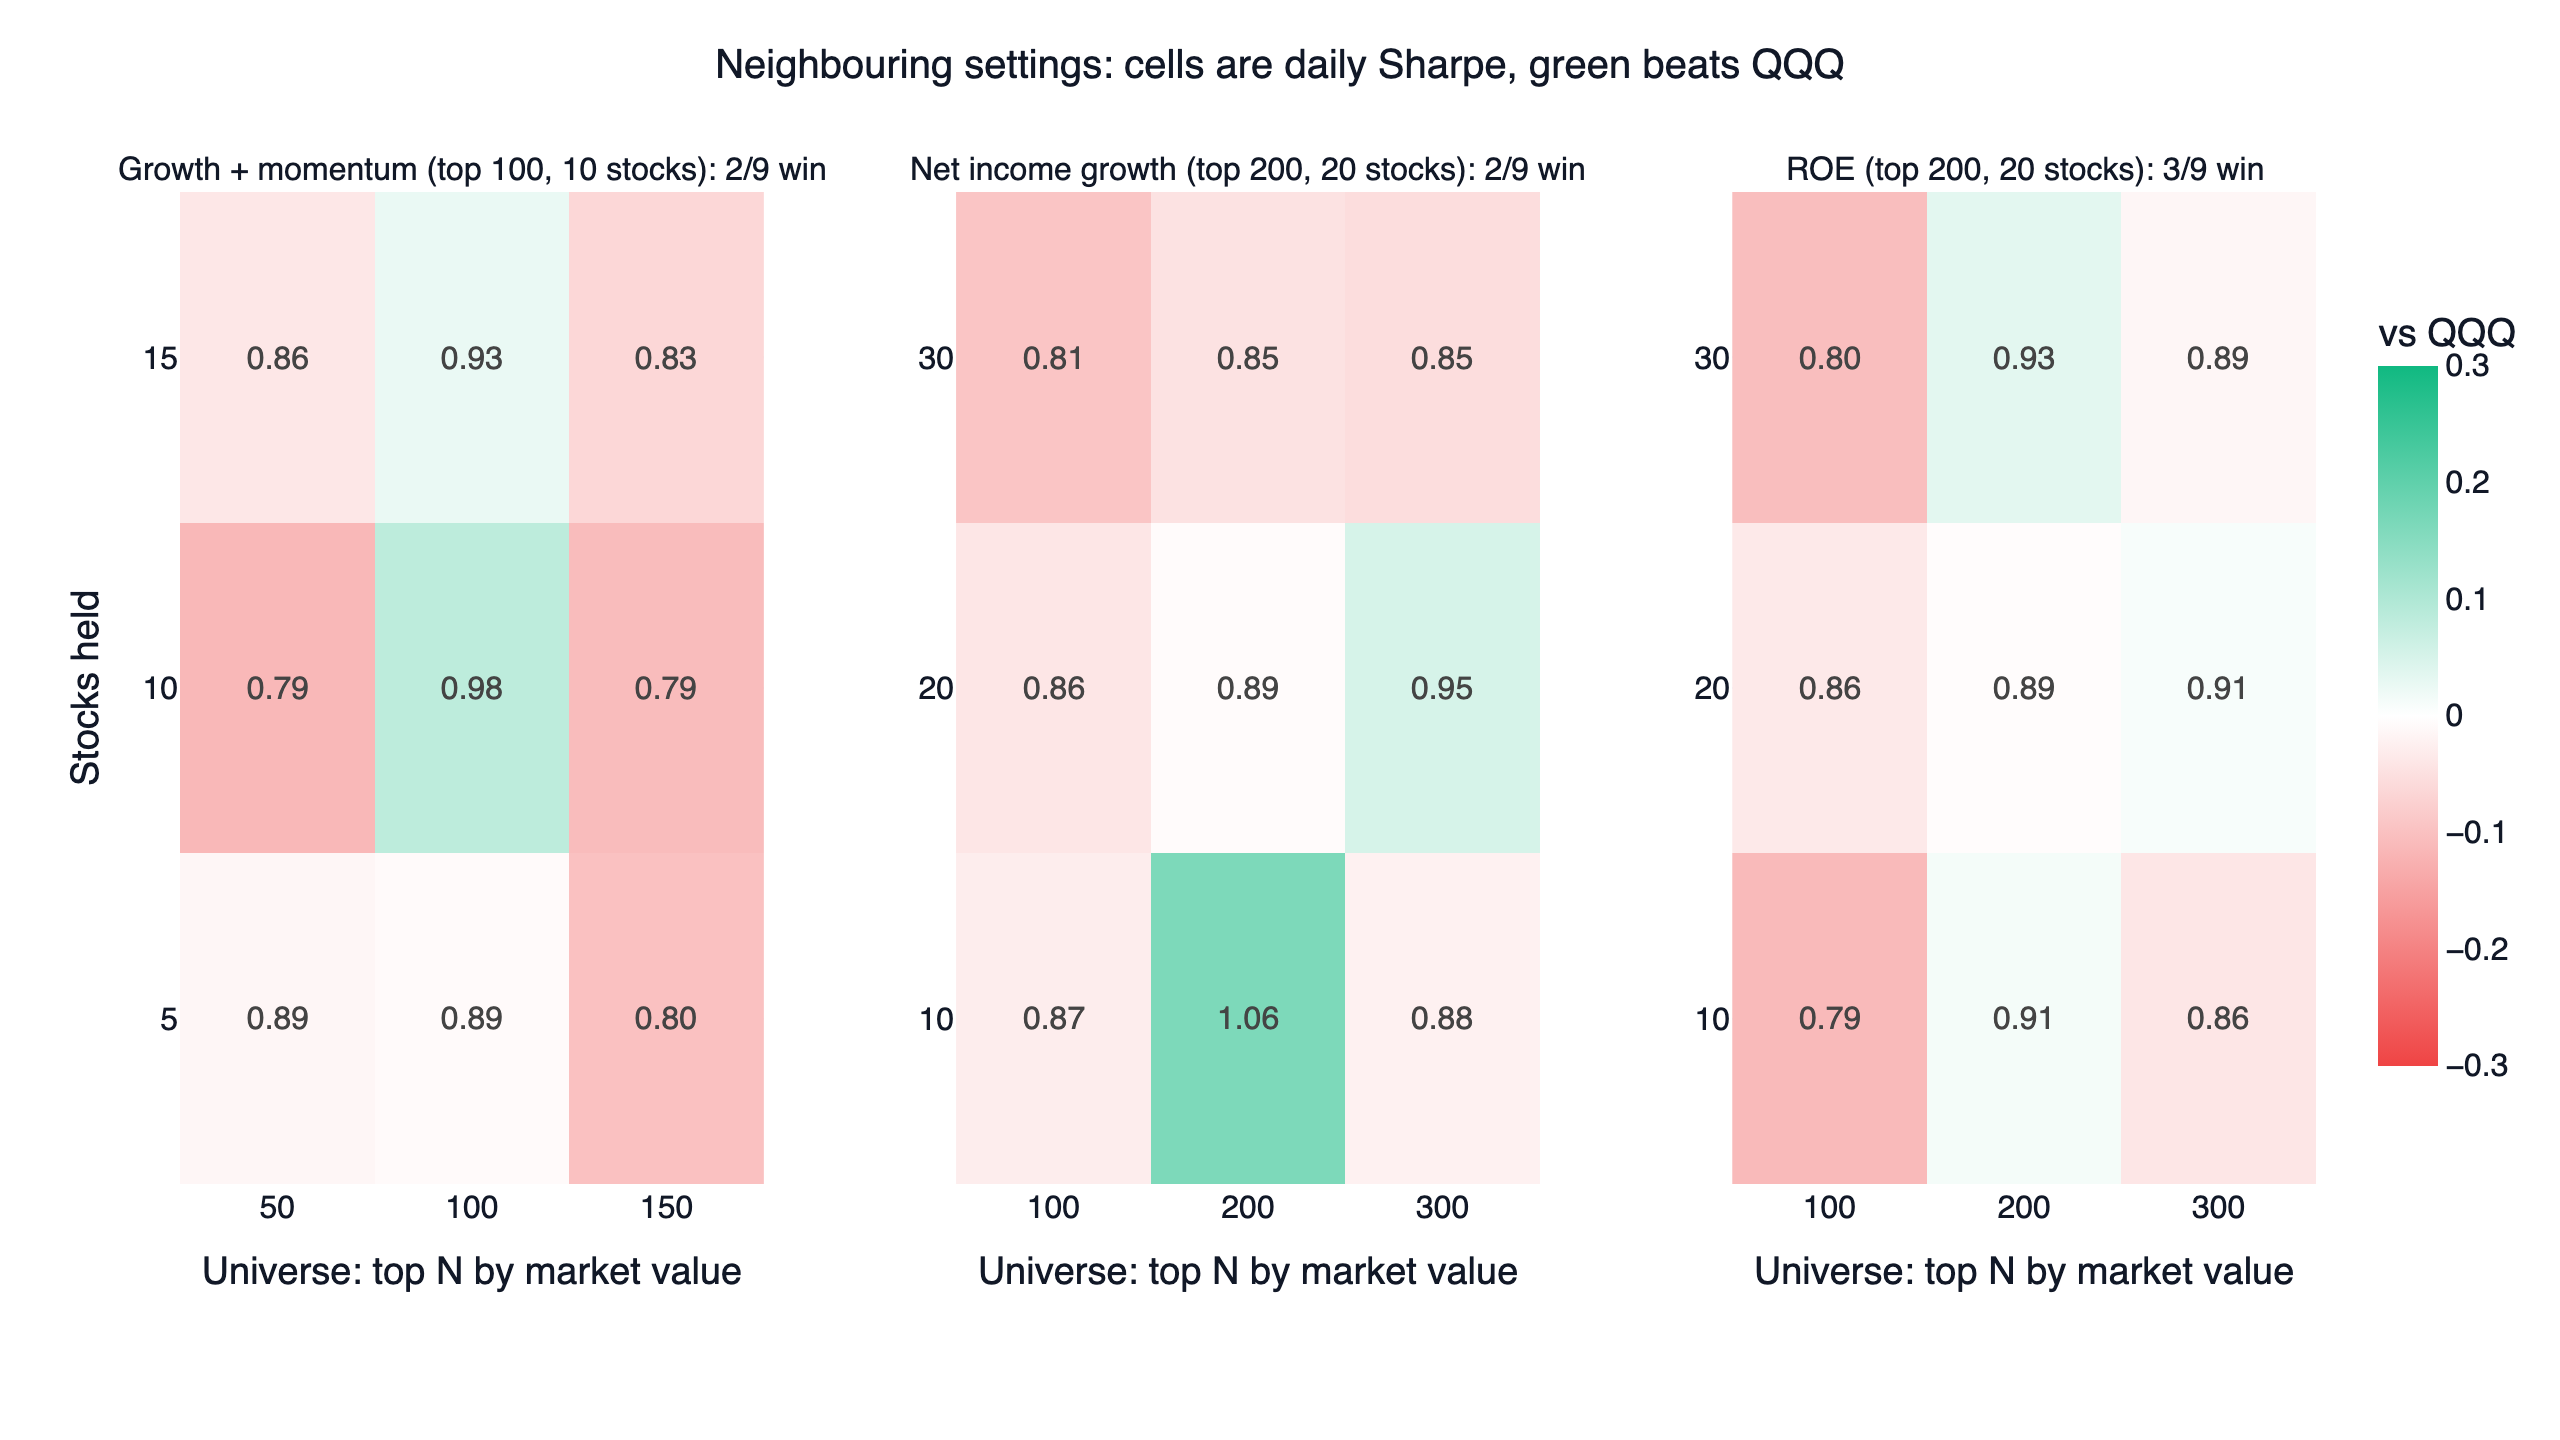
Nothing passed the screen, but we still ran nine neighbouring settings for the three portfolios with the highest full-window Sharpe, to see whether they had only just missed:
- Growth + momentum (top 100, 10 stocks): 2 of 9 win. Only the base setting (0.98) and 15 stocks in the same universe (0.93) beat QQQ. Changing the universe to the 50 or 150 largest with 10 stocks drops it to 0.79. It is an isolated peak with lower ground on every side.
- Net income growth (top 200, 20 stocks): 2 of 9 win (10 stocks at 1.06, and 20 stocks from the 300 largest at 0.95). Ten stocks scored highest, but ten stocks from the 100 or 300 largest scored 0.87 and 0.88.
- ROE (top 200, 20 stocks): 3 of 9 win (10 stocks at 0.91, 30 stocks at 0.93, and 20 stocks from the 300 largest at 0.91). It is the most even of the three but well short of 70%, and none of its nine settings beat QQQ in both halves.
Costs are not the problem: with 0.1% per side the three scored 0.96, 0.87 and 0.88, almost unchanged. They trail QQQ because of what they pick.
Result 3: the growth + momentum lead comes almost entirely after 2024
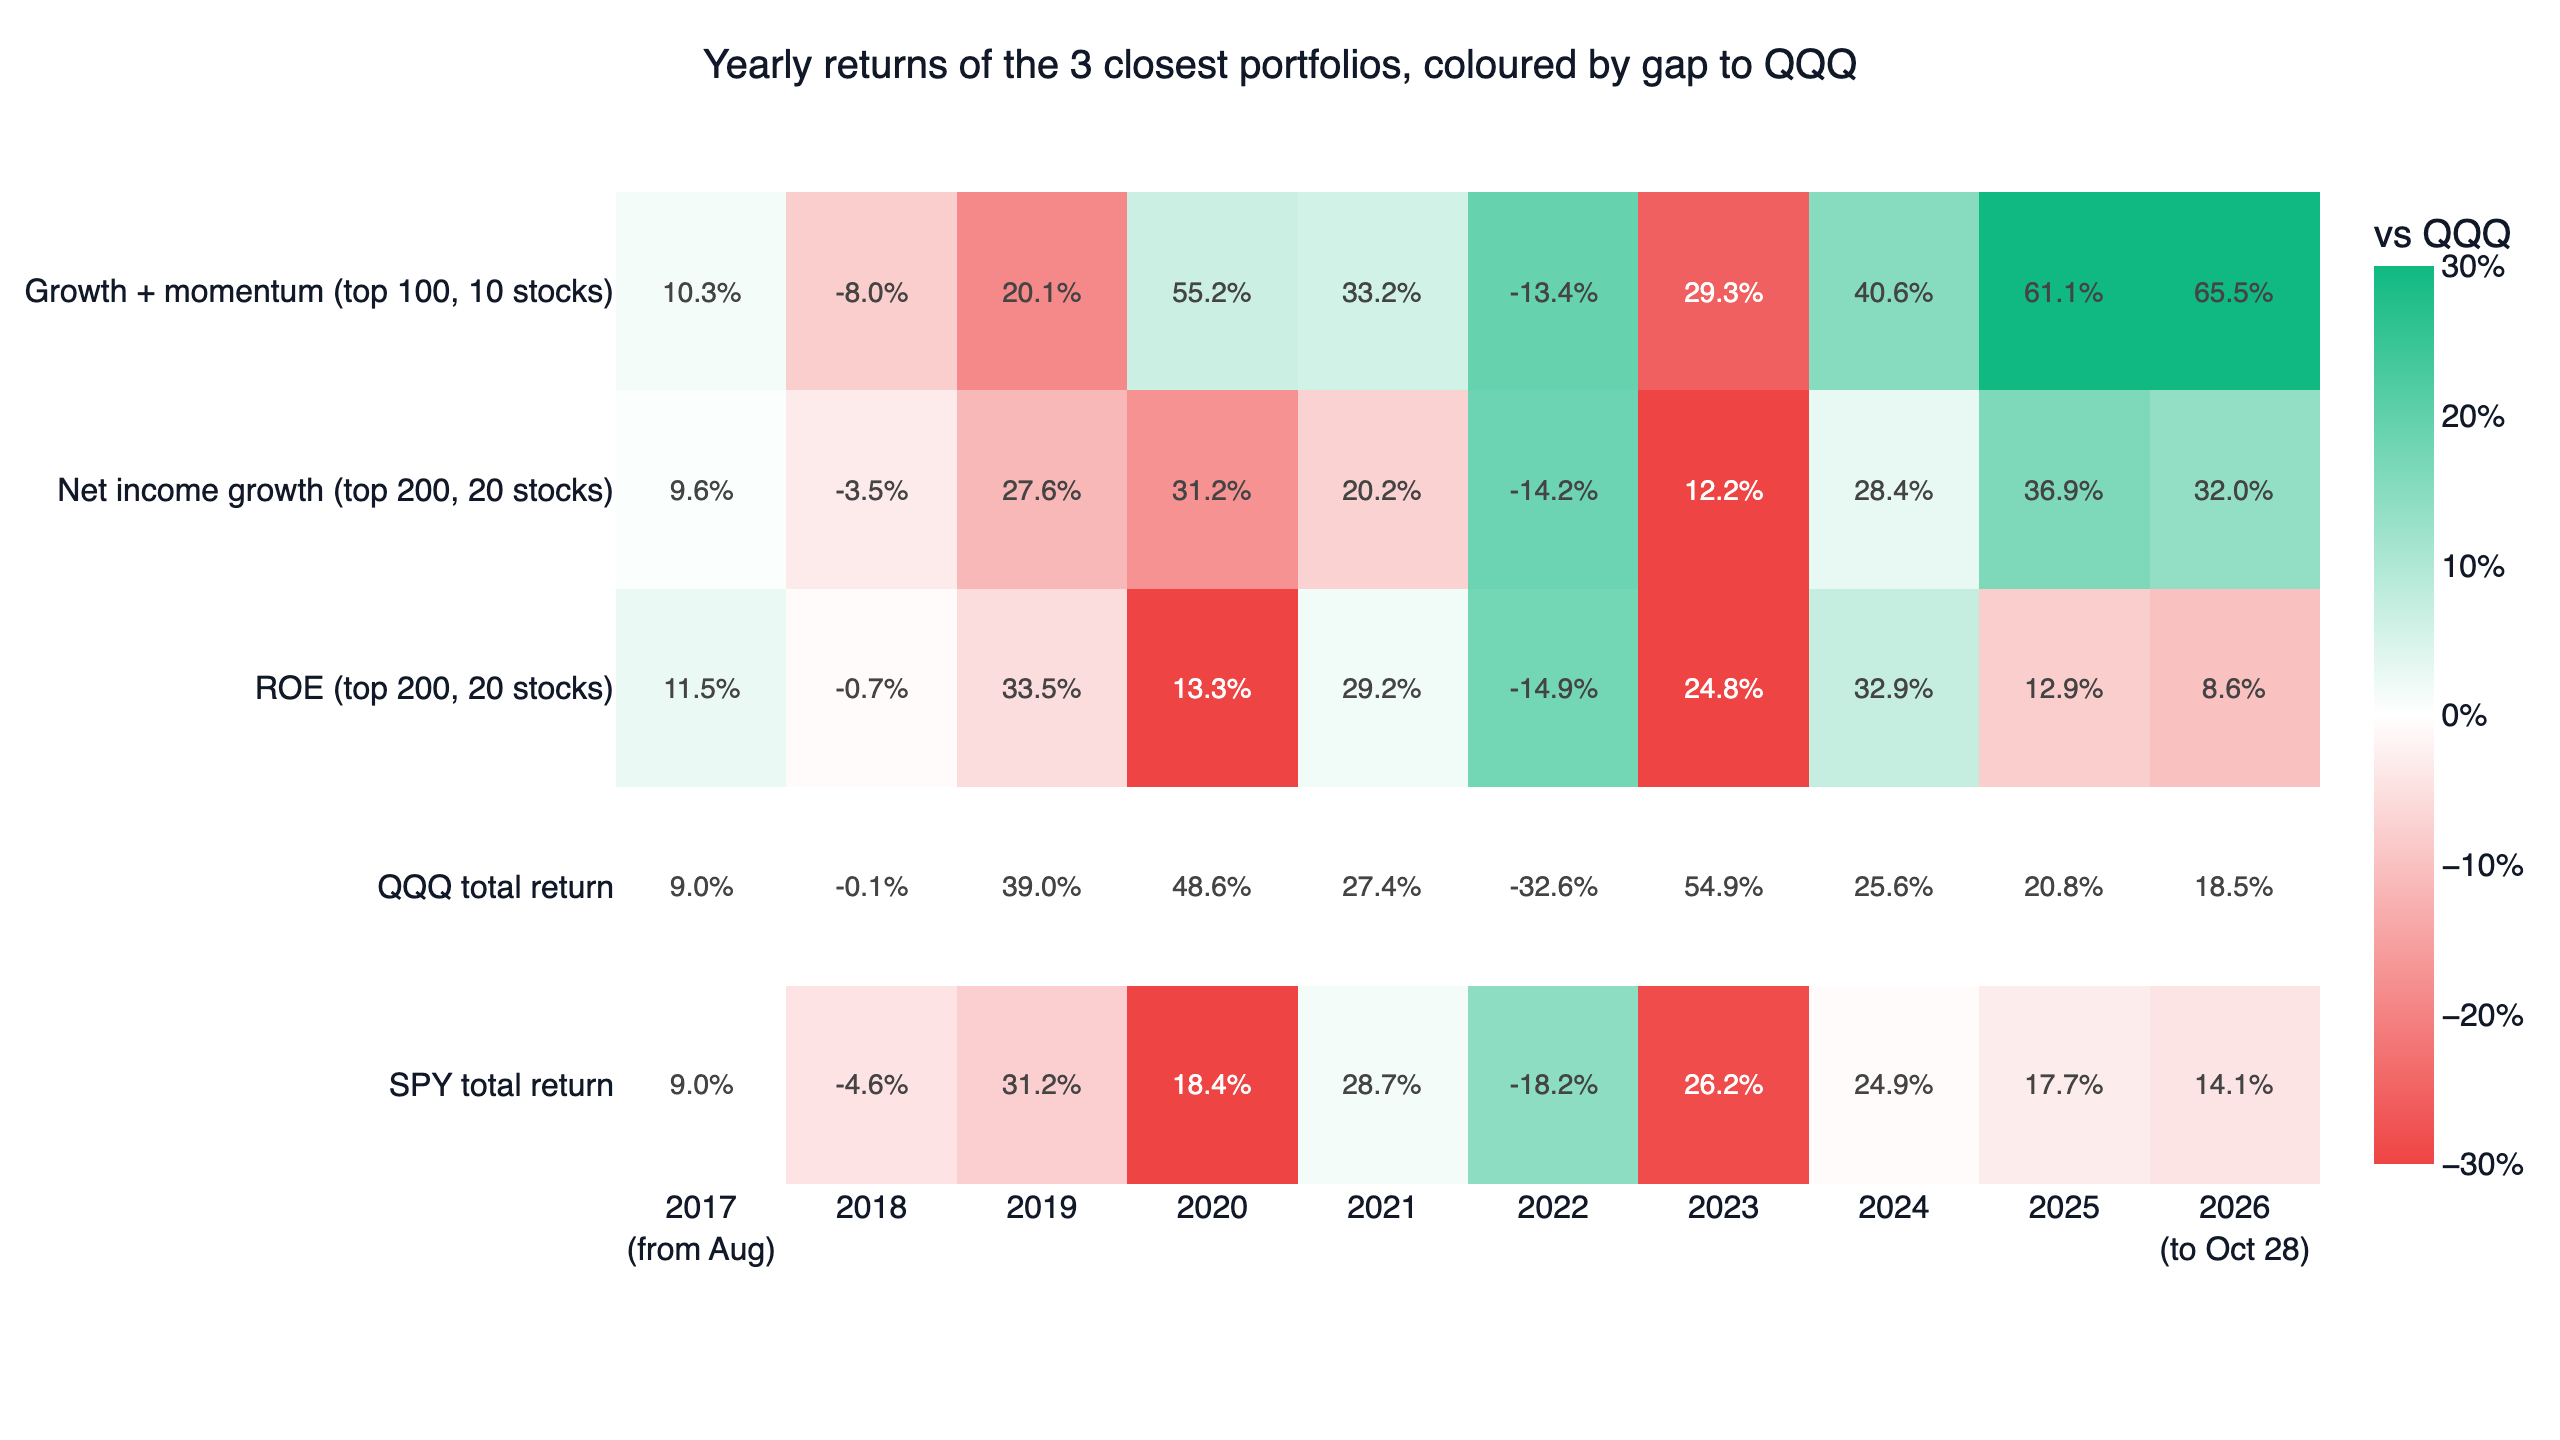
The one portfolio of the 85 that beat QQQ over the full window looks different year by year. From 2017 to 2024 its daily Sharpe was 0.82 against 0.88 for QQQ, and it trailed by 19 percentage points in 2019 and 26 in 2023. It then rose 61.1% in 2025 and 65.5% in 2026 to the end of October, against 20.8% and 18.5% for QQQ, and those two years lifted it to 0.98 for the whole window. Half of its weight on average sat in technology. A concentrated 10-stock portfolio that wins big in one industry rally does not show that the rule itself is reliable.
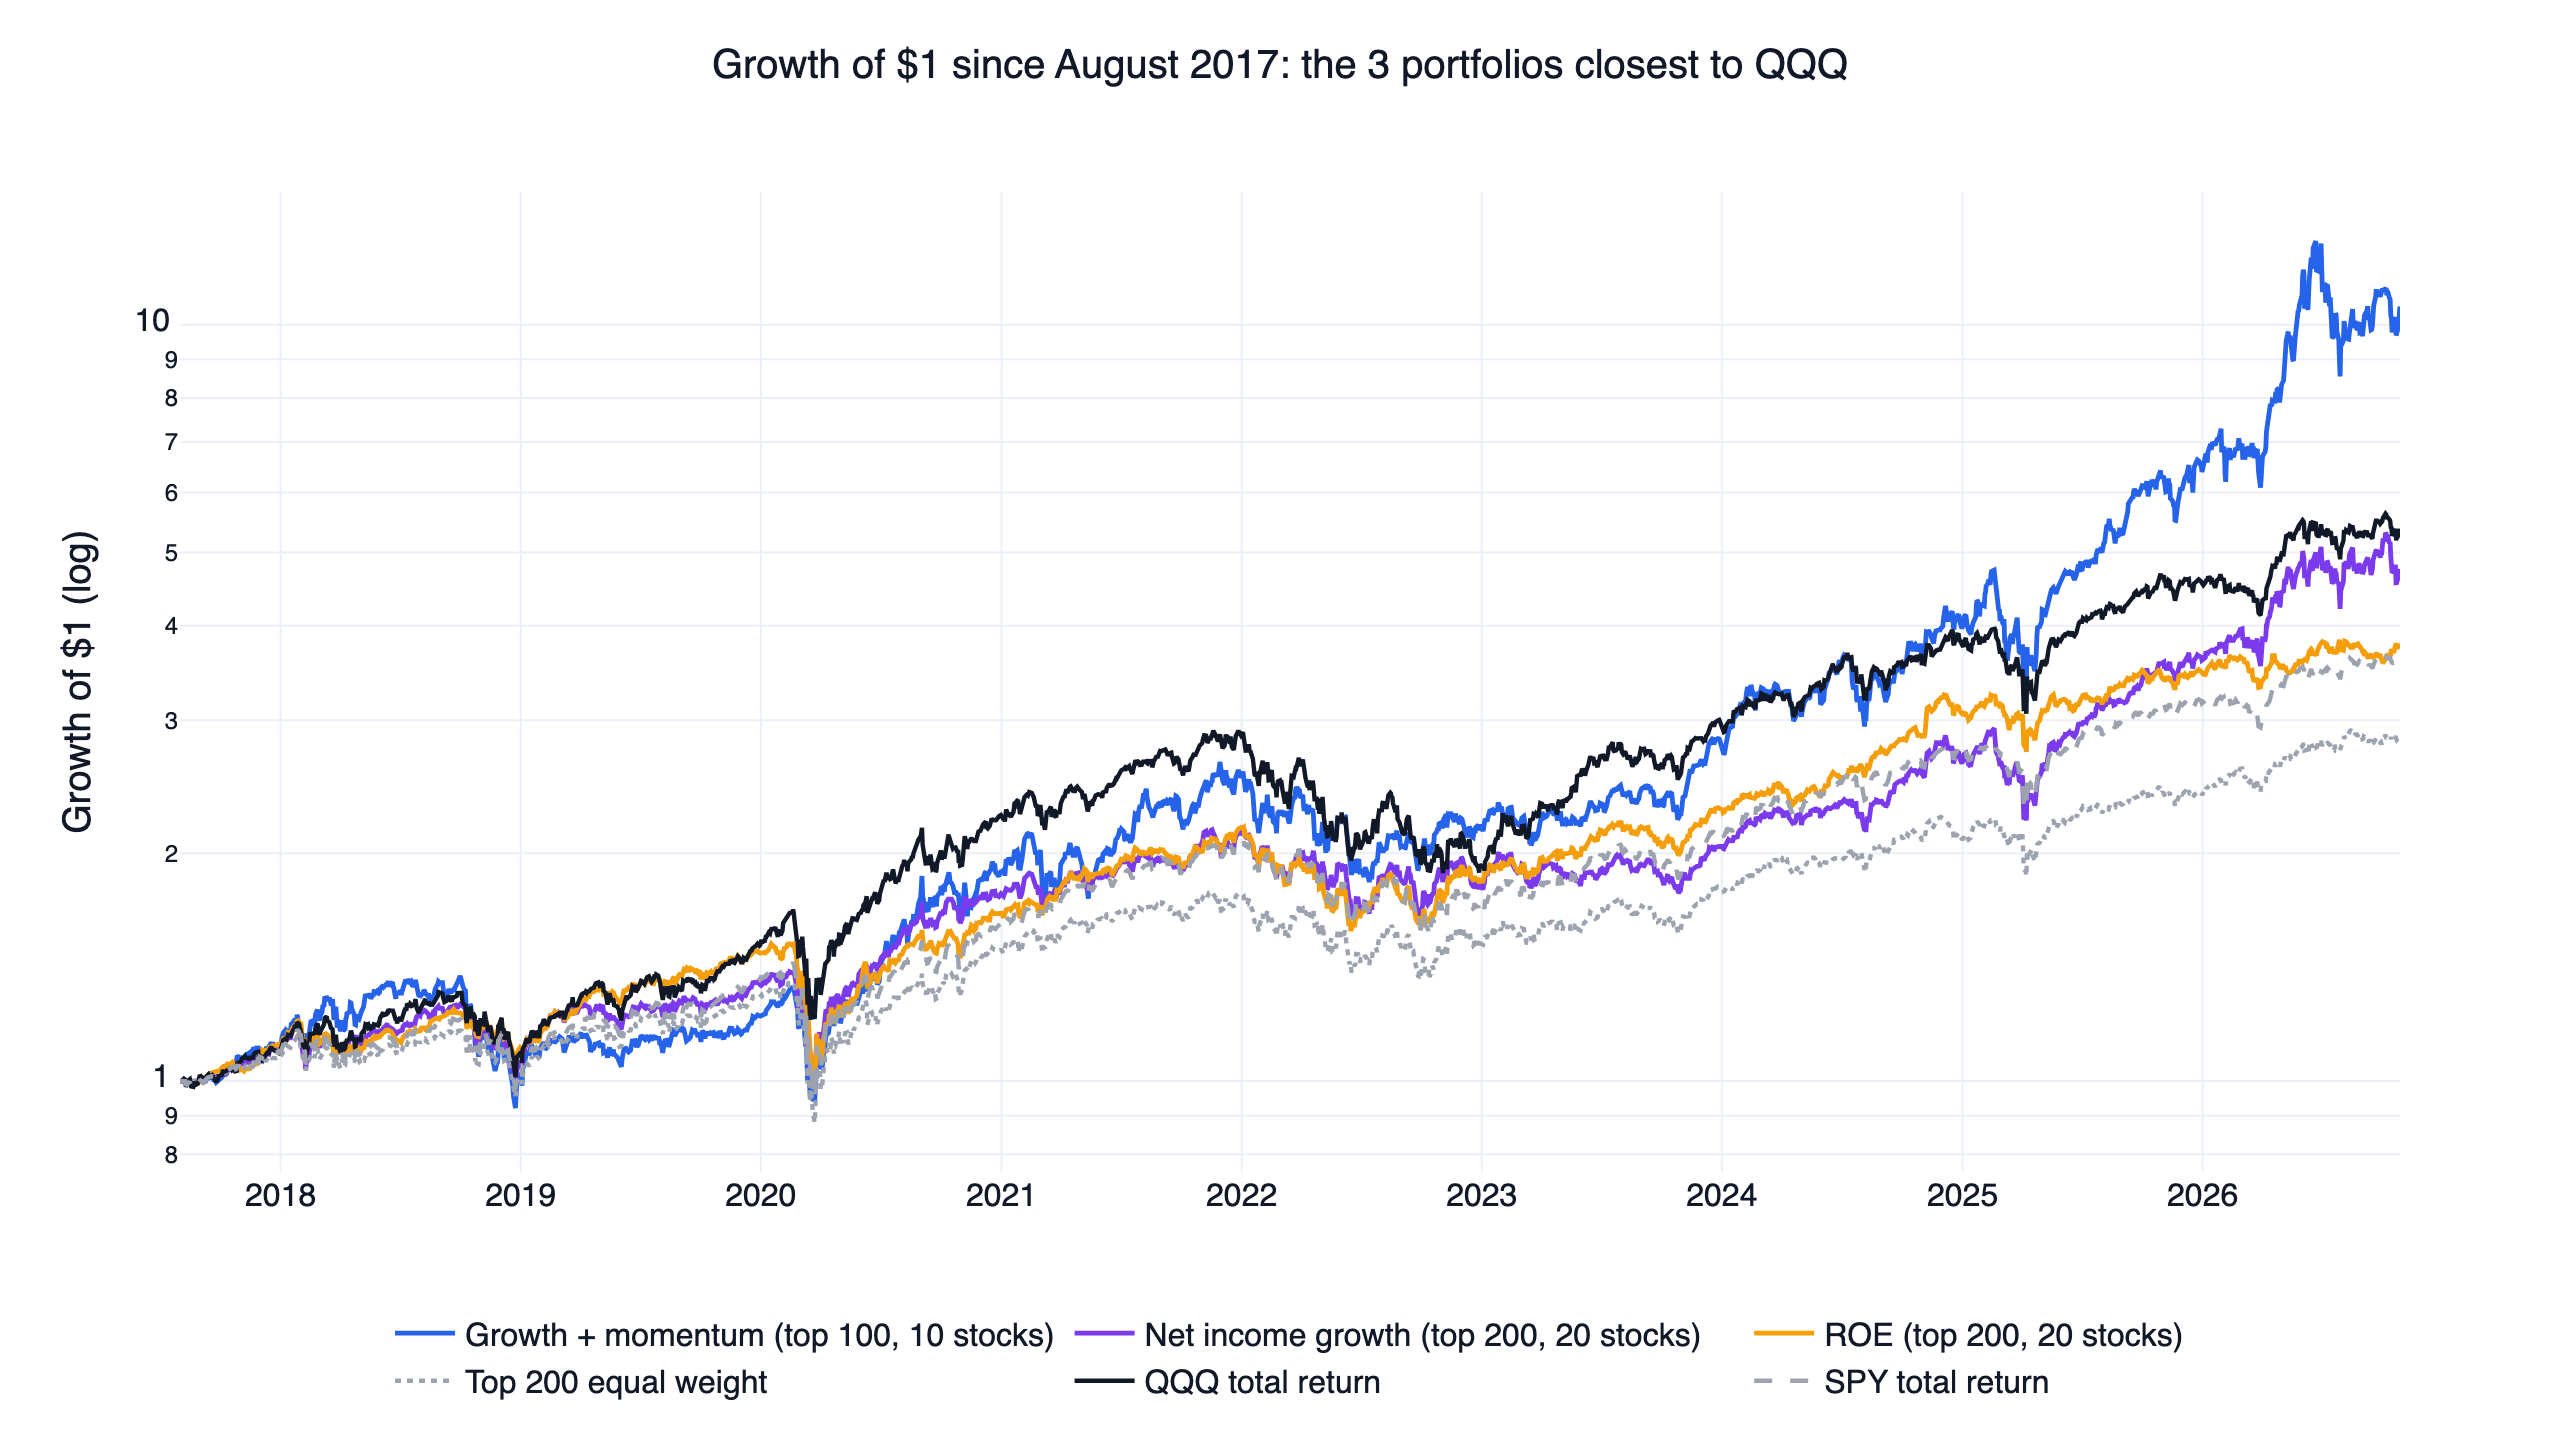
ROE and net income growth have the opposite shape. ROE scored 0.91 from 2017 to 2024, slightly above QQQ's 0.88, then rose only 12.9% in 2025 and 8.6% in 2026 to October, which pulled it back to 0.89. Its portfolio averaged 30% consumer cyclical and only 20% technology, so it missed those two years of tech gains. Net income growth rose just 12.2% in 2023 while QQQ gained 54.9%, and never made up that year. On the growth-of-a-dollar chart all three spend most of the window below QQQ; only growth + momentum breaks away after 2024.
The PEG ratio, price to sales, EV/EBITDA, earnings yield and ROE
None of these five factors was covered in our earlier academic factors and famous screens studies. Each was screened at its base setting (20 stocks among the 200 largest and among the 500 most traded):
- ROE: 0.89 and 0.81. Its first half, 0.81, trailed QQQ's 0.93. High ROE was the closest of the 17 factors among large caps, but it lost the first half and won only 3 of 9 neighbouring settings.
- Low price to sales: 0.76 and 0.78. Its 0.94 first half in the most-traded universe is one of the few to beat QQQ's, but the second half fell to 0.60, and its drawdowns (-43.0% and -45.8%) were deeper than QQQ's.
- Low PEG ratio: 0.75 and 0.50. The PEG ratio uses last year's earnings growth, so a company recovering from a very low base shows huge growth and a tiny PEG, and that kind of growth often does not last.
- Low EV/EBITDA: 0.74 and 0.57. Its -65.1% drawdown in the most-traded universe is the deepest of the five.
- Earnings yield: 0.60 and 0.44, the lowest of the 17 factors among the 200 largest, and it lost to QQQ in both halves.
None of the five passed the screen, so by the rules none got a grid (ROE got one anyway as one of the three closest portfolios). Among the 200 largest, the four valuation factors trailed not only QQQ but also ROE and net income growth: over this window, buying cheap large caps did worse than buying large caps with growing profits.
Why they trail QQQ: equal-weight large caps start behind
A fair question is whether the factors pick better stocks than the pool they choose from. An equal-weight portfolio of all 200 largest companies scored 0.74 with a 12.1% CAGR. Nine of the 17 factors beat that, and ROE, net income growth, operating margin change and ROIC added 0.09 to 0.16. So the factors do find better-than-average stocks; the problem is the starting line. The equal-weight top 200 sits 0.16 below QQQ, and even the equal-weight top 100 (0.80) is 0.10 short.
Bessembinder (2018) found that the best-performing 4% of listed companies account for all of the net wealth the US stock market has created since 1926. QQQ weights by market value and puts most of its money in the largest technology companies. An equal-weight factor portfolio of 20 stocks gives each one 5%, so even when it holds one or two of the big winners, it holds less of them than QQQ does. Over this window that gap was larger than anything a factor added.
Why adding a market filter made things worse
If stock picking cannot beat QQQ, it seems reasonable to at least step aside when the market turns down. We tested a common trend filter: hold the portfolio only while QQQ is above its 200-day average and up over the past six months, otherwise hold cash. The 200-day (about 10-month) average comes from Faber (2007), a widely cited study of trend timing across asset classes. The filter is checked on rebalance days; from 2017-08 to 2026-10 it was on for 79.7% of trading days, and the portfolios sat in cash for 24 of 110 months.
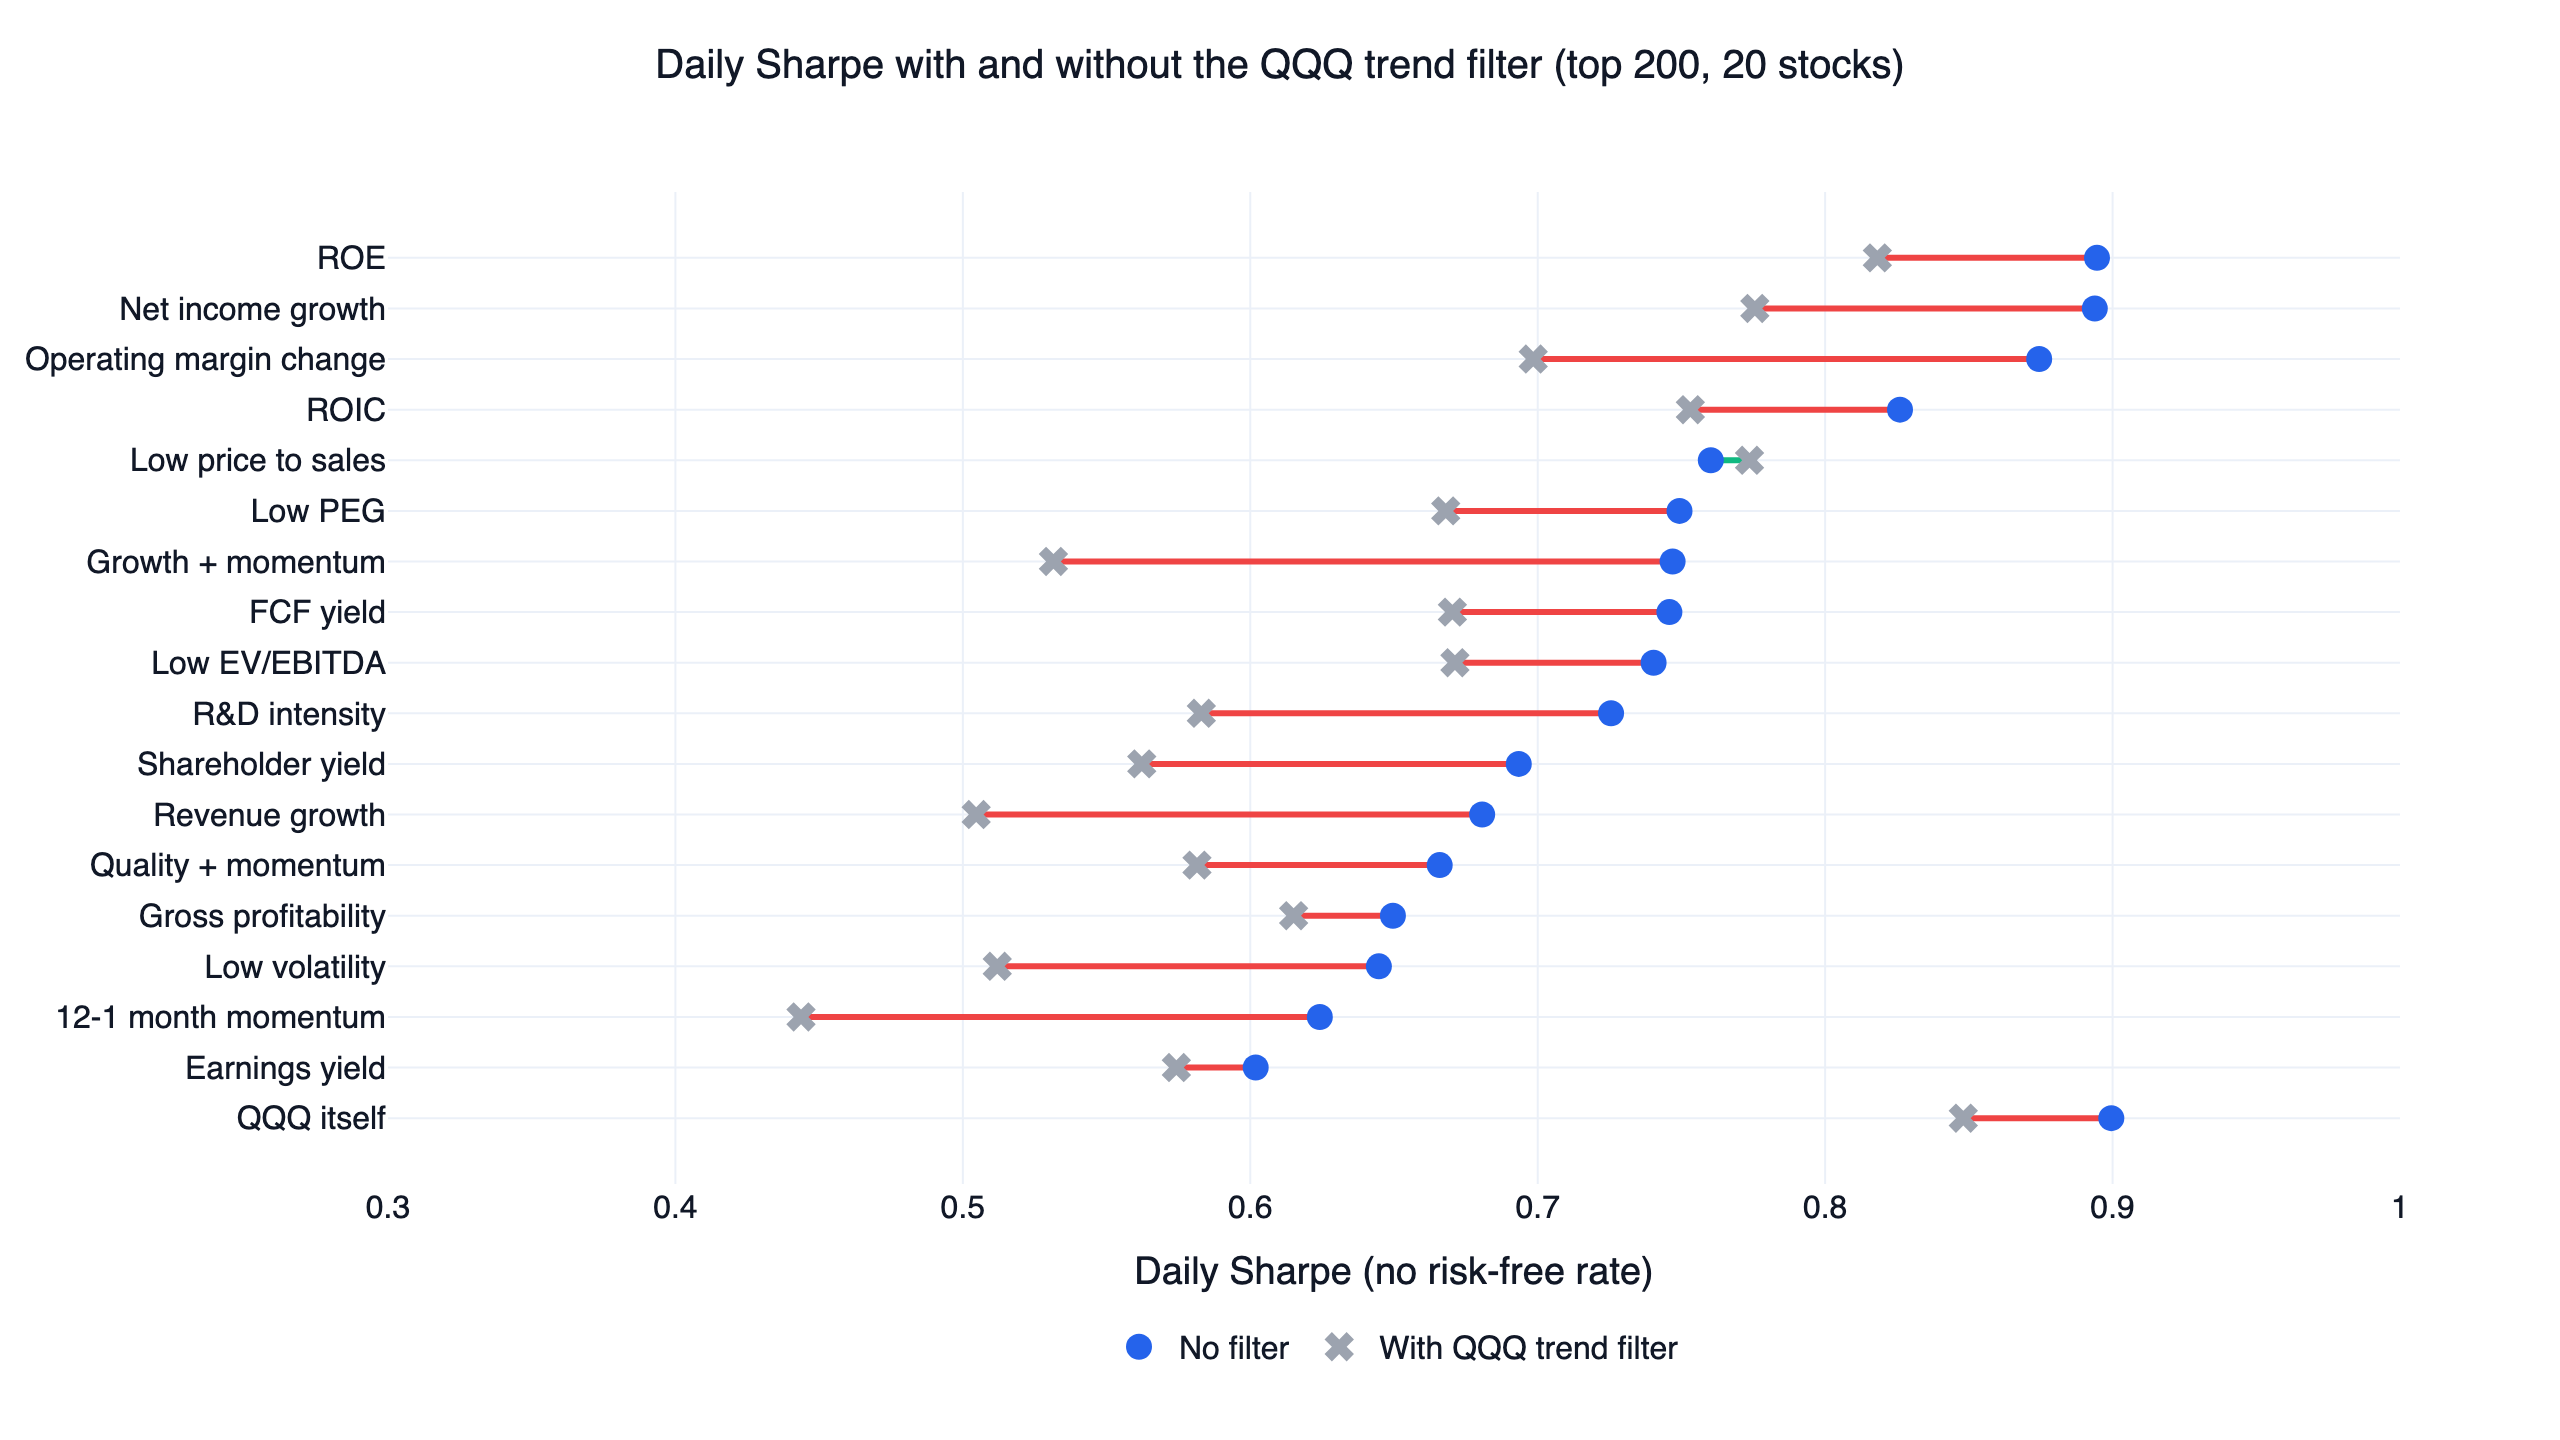
The filter made 34 of the 40 stock portfolios worse, by 0.08 on average, and none beat QQQ with it. Momentum-driven portfolios lost the most: growth + momentum fell from 0.75 to 0.53 and 12-1 month momentum from 0.62 to 0.44. QQQ itself, under the same filter, dropped from 0.90 to 0.85 and from a 20.0% to a 15.0% CAGR, while its maximum drawdown improved from -35.1% to -28.6%. The smaller drawdown did not make up for the lost return.
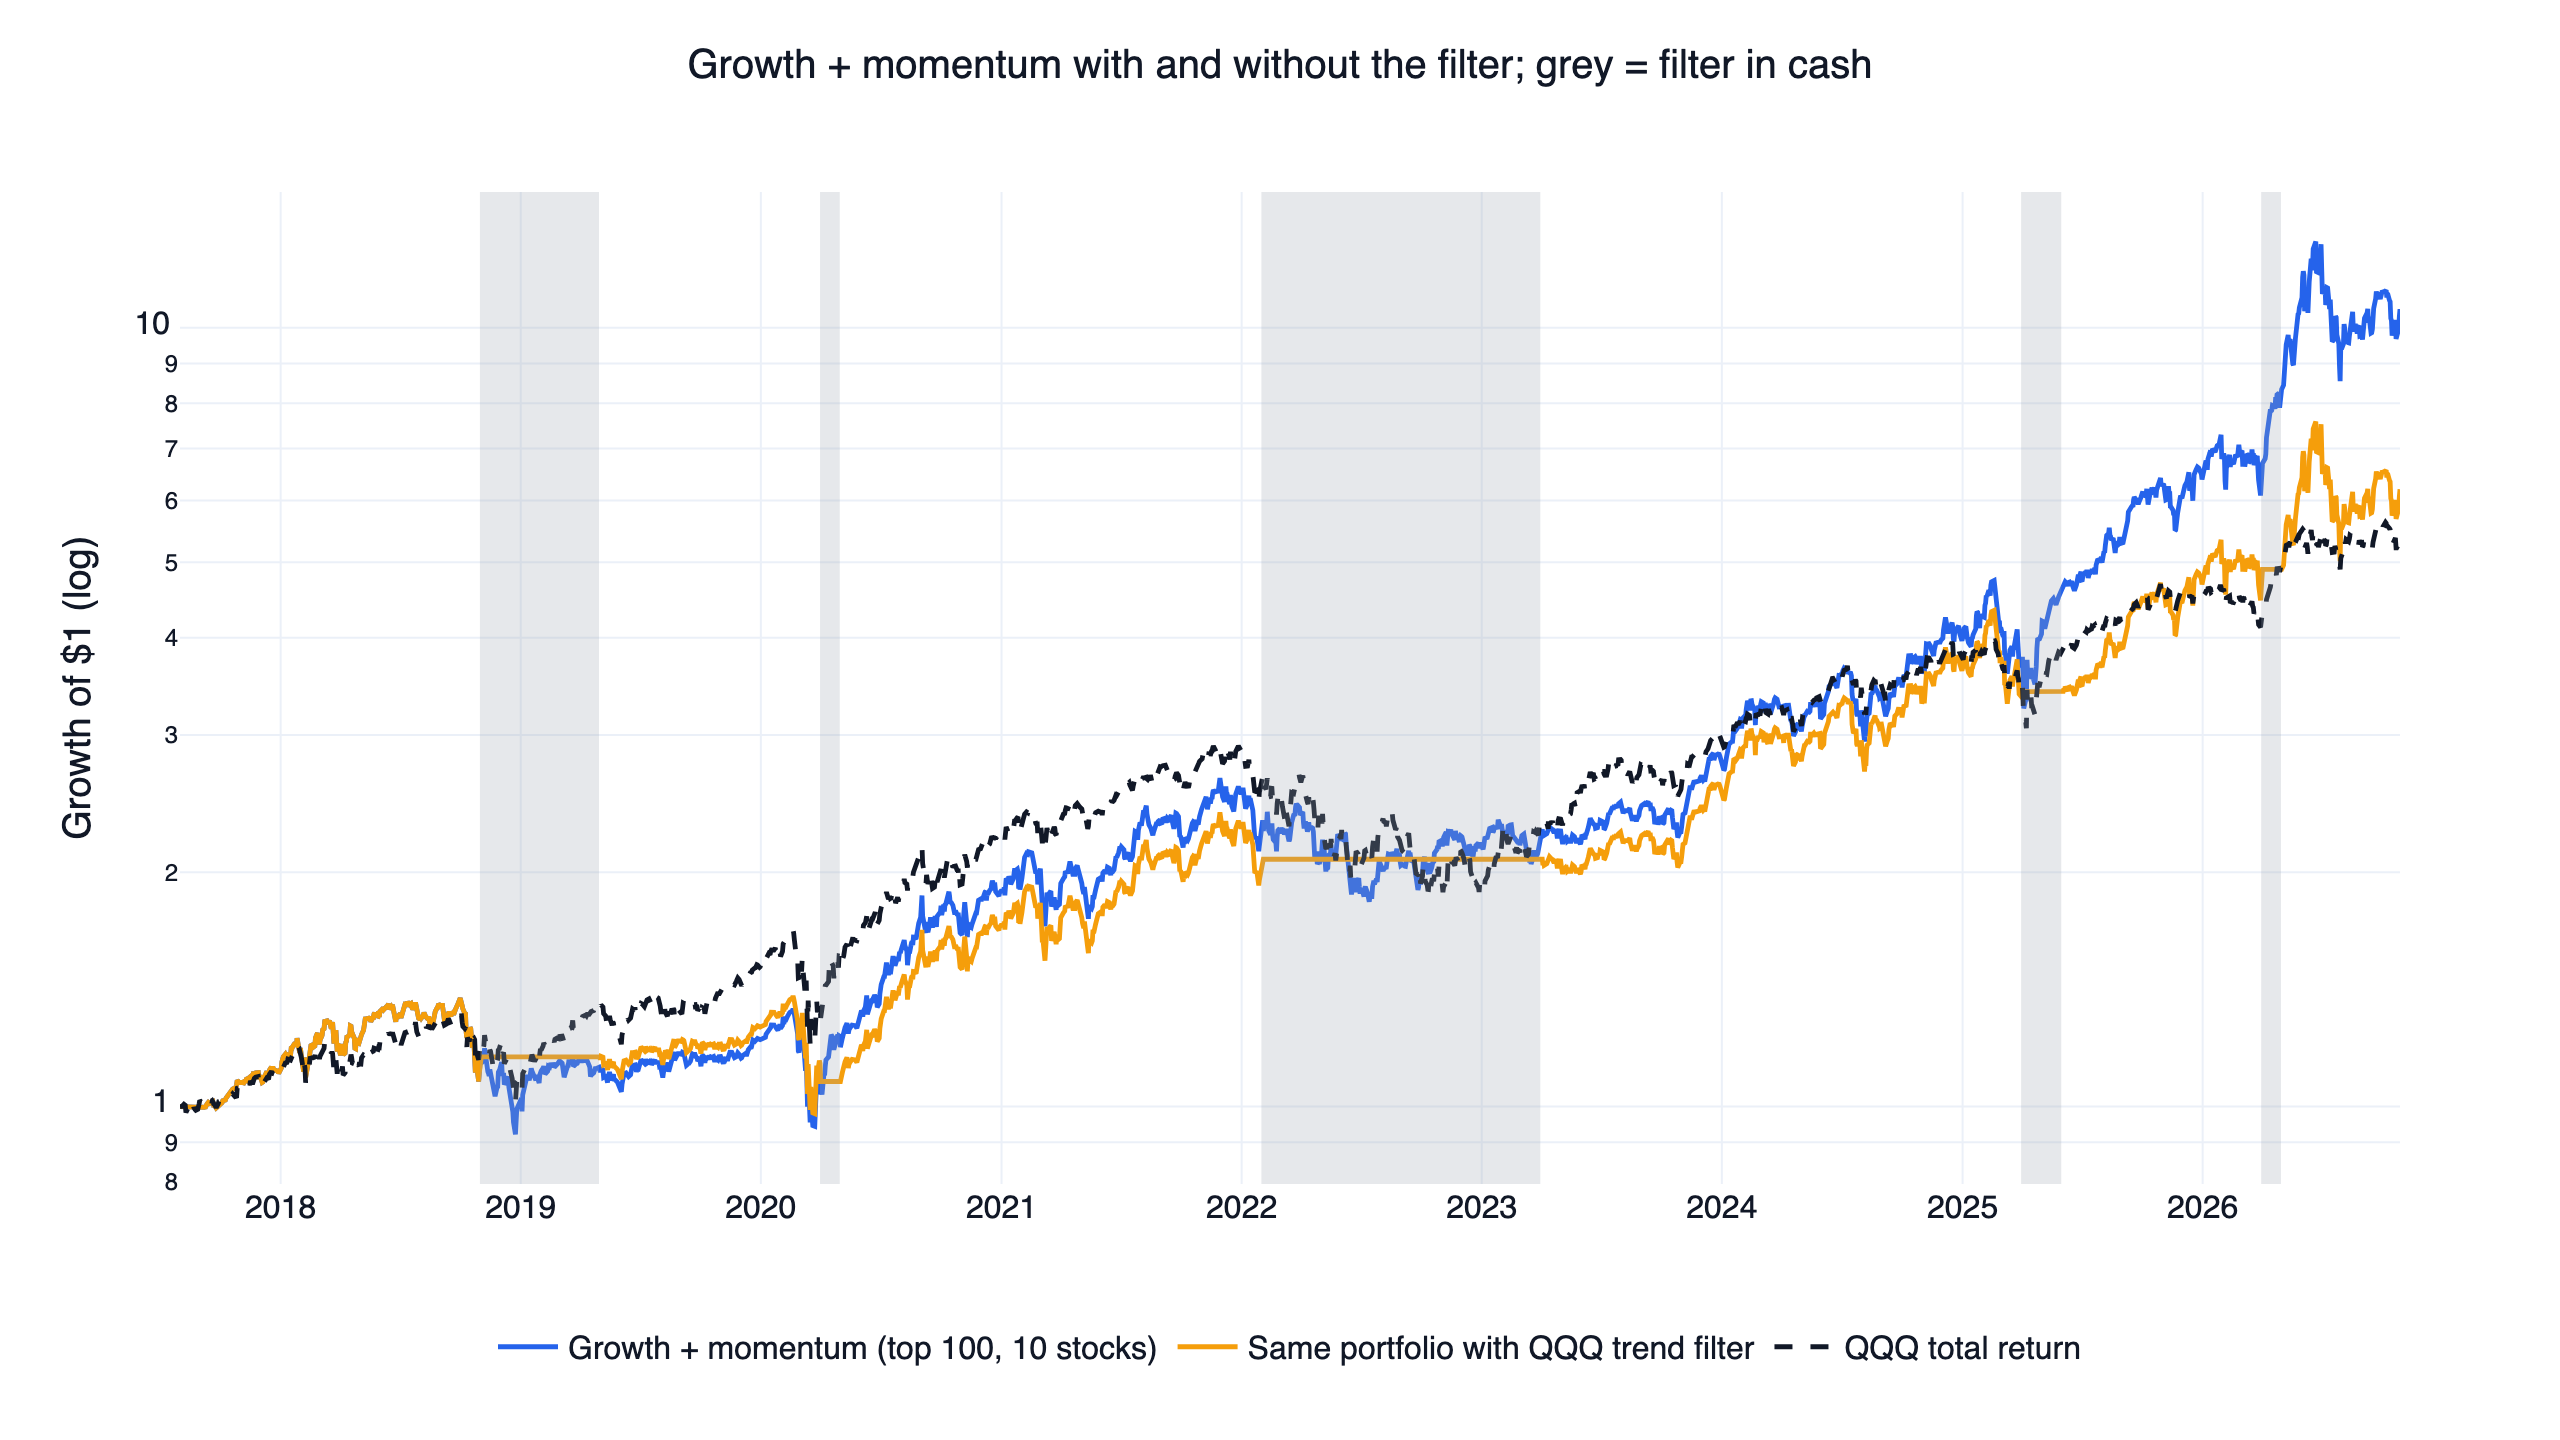
The months in cash explain why. The filter switches off as soon as QQQ is below its 200-day average or down over six months, by which point most of the fall has happened; it then waits for both to turn positive again, which is when the rebound is under way:
| Filter in cash | Months | QQQ | Growth + momentum (top 100, 10) | Net income growth (top 200) | ROE (top 200) |
|---|---|---|---|---|---|
| Nov 2018 to Apr 2019 | 6 | +12.1% | -0.6% | +9.8% | +14.7% |
| Apr 2020 | 1 | +15.0% | +12.5% | +12.3% | +12.0% |
| Feb 2022 to Mar 2023 | 14 | -10.8% | -3.0% | -5.4% | -1.8% |
| Apr to May 2025 | 2 | +10.7% | +24.7% | +13.0% | +5.1% |
| Apr 2026 | 1 | +15.7% | +27.6% | +18.5% | +4.8% |
Of the five cash spells, only the 2022 one avoided a decline, and QQQ fell just 10.8% across those 14 months because the filter switched off at the end of January 2022 and stayed out through the rebound in the first quarter of 2023. QQQ rose in all four of the others. On average QQQ gained 2.0% a month in the 24 months the filter was in cash and 1.6% in the 86 months it was invested; the growth + momentum portfolio made 2.7% and 2.4%. A trend filter earns its keep by sidestepping bear markets that last several quarters, such as 2000-2002 and 2008. Between 2017 and 2026 only 2022 was like that; the other declines (late 2018, the 2020 pandemic crash, the April 2025 tariff sell-off) fell fast and recovered fast, and by the time the filter confirmed weakness it was too late.
We also tested the filter checked daily, moving to cash the day after it turns off. Growth + momentum scored 0.93 and net income growth 0.82, both worse than with no filter. ROE rose to 0.99, but its first half (0.86) still trailed QQQ's 0.93 and its CAGR fell from 15.3% to 12.4%, so it does not pass either.
Other designs we tried
| Design | Daily Sharpe | First / second half | CAGR | Max drawdown |
|---|---|---|---|---|
| Pick the 3 strongest sectors (highest share of stocks above their 200-day average), then the top 20 by 12-1 month momentum | 0.48 | 0.52 / 0.44 | 11.4% | -45.1% |
| Pick the 3 strongest sectors, then the top 20 by ROIC | 0.55 | 0.55 / 0.56 | 10.7% | -32.4% |
| Hold QQQ while over half of the 1,000 most traded stocks are above their 200-day average, otherwise the strongest of IEF, SHY and GLD over 3 months | 0.85 | 1.10 / 0.58 | 14.5% | -24.6% |
| The 20 biggest 5-day losers among the top 200, rebalanced weekly | 0.54 | 0.47 / 0.63 | 11.4% | -46.1% |
| The 20 biggest 5-day losers among the 500 most traded, weekly | 0.46 | 0.50 / 0.41 | 10.7% | -67.5% |
The two sector-first portfolios scored 0.48 and 0.55, below the plain 12-1 momentum and ROIC portfolios in either universe (0.62 / 0.80 and 0.83 / 0.76). Market-breadth timing beat QQQ by a wide margin in the first half (1.10) and fell to 0.58 in the second, a signal that worked in one stretch only. Weekly short-term reversal trades every week, and 0.1% per side cut its Sharpe to 0.20 and 0.21.
All 40 stock portfolios
"Filtered" is the same portfolio with the QQQ trend filter from the previous section. QQQ scored 0.90 over the same dates, 0.93 in the first half and 0.87 in the second.
| Factor | Top 200 | First / second half | Filtered | Most traded 500 | First / second half | Filtered |
|---|---|---|---|---|---|---|
| ROE | 0.89 | 0.81 / 1.01 | 0.82 | 0.81 | 0.87 / 0.74 | 0.74 |
| Net income growth | 0.89 | 0.78 / 1.00 | 0.78 | 0.65 | 0.48 / 0.81 | 0.65 |
| Operating margin change | 0.87 | 0.67 / 1.07 | 0.70 | 0.42 | 0.48 / 0.37 | 0.32 |
| ROIC | 0.83 | 0.76 / 0.91 | 0.75 | 0.76 | 0.87 / 0.64 | 0.80 |
| Low price to sales | 0.76 | 0.56 / 1.08 | 0.77 | 0.78 | 0.94 / 0.60 | 0.75 |
| Low PEG | 0.75 | 0.67 / 0.84 | 0.67 | 0.50 | 0.36 / 0.66 | 0.56 |
| Growth + momentum | 0.75 | 0.54 / 0.93 | 0.53 | 0.86 | 0.95 / 0.79 | 0.63 |
| FCF yield | 0.75 | 0.55 / 1.01 | 0.67 | 0.79 | 0.70 / 0.92 | 0.73 |
| Low EV/EBITDA | 0.74 | 0.54 / 0.99 | 0.67 | 0.57 | 0.48 / 0.70 | 0.52 |
| R&D intensity | 0.73 | 0.62 / 0.83 | 0.58 | 0.31 | 0.38 / 0.25 | 0.21 |
| Shareholder yield | 0.69 | 0.54 / 0.93 | 0.56 | 0.62 | 0.68 / 0.54 | 0.56 |
| Revenue growth | 0.68 | 0.46 / 0.90 | 0.50 | 0.33 | 0.43 / 0.23 | 0.26 |
| Quality + momentum | 0.67 | 0.53 / 0.82 | 0.58 | 0.52 | 0.40 / 0.65 | 0.46 |
| Gross profitability | 0.65 | 0.79 / 0.48 | 0.62 | 0.51 | 0.51 / 0.51 | 0.41 |
| Low volatility | 0.64 | 0.60 / 0.74 | 0.51 | 0.51 | 0.48 / 0.56 | 0.40 |
| 12-1 month momentum | 0.62 | 0.52 / 0.71 | 0.44 | 0.80 | 0.65 / 0.93 | 0.52 |
| Earnings yield | 0.60 | 0.51 / 0.72 | 0.57 | 0.44 | 0.35 / 0.57 | 0.40 |
The six concentrated portfolios in the 100 largest companies:
| Portfolio | Daily Sharpe | First / second half | Filtered |
|---|---|---|---|
| Growth + momentum, 10 stocks | 0.98 | 0.76 / 1.18 | 0.86 |
| Growth + momentum, 30 stocks | 0.85 | 0.70 / 1.00 | 0.80 |
| Net income growth, 10 stocks | 0.87 | 0.69 / 1.05 | 0.74 |
| Net income growth, 30 stocks | 0.81 | 0.68 / 0.95 | 0.81 |
| ROIC, 10 stocks | 0.70 | 0.58 / 0.83 | 0.73 |
| ROIC, 30 stocks | 0.79 | 0.68 / 0.93 | 0.77 |
The code
The core of the ROE test takes a few steps: divide trailing net income by equity, pick the 20 highest among the 200 largest companies, and compare with QQQ.
Show Code
import finlab
from finlab import data
from finlab.backtest import sim

finlab.login()  # finlab guides you through login automatically
data.set_market("us")

# 1. Trailing-twelve-month net income over latest equity (dated by SEC filing date)
net_income = data.get("us_income_statement:net_income").rolling(4).sum()
book_equity = data.get("us_balance_sheet:total_stockholders_equity")
roe = net_income / book_equity[book_equity > 0]

# 2. Universe: US-based common stocks, no financials, the 200 largest each day
profile = data.get("us_company_profile")
eligible = profile.loc[
    (profile["security_type"] == "common_stock")
    & (profile["country"] == "US")
    & (profile["sector"] != "Financial Services"),
    "stock_id",
]
market_value = data.get("etl:us_market_value")
market_value = market_value[market_value.columns.intersection(eligible)]
close = data.get("us_price:close")
top_200 = market_value[close > 5].is_largest(200)

# 3. The 20 highest-ROE stocks among the top 200, equal weight, monthly
position = roe[top_200].is_largest(20)
report = sim(position.loc["2017-08-01":], resample="M", upload=False)

# 4. Daily Sharpe against QQQ (dividends reinvested) over the same days
curve = report.creturn
qqq = data.get("us_fund_price:adj_close")["QQQ"].reindex(curve.index).ffill()
for name, series in [("ROE top 20", curve), ("QQQ", qqq)]:
    daily = series.pct_change().dropna()
    sharpe = daily.mean() / daily.std() * 252 ** 0.5
    print(name, f"{sharpe:.2f}")
With data through 2026-10-28 this prints 0.89 and 0.90, matching the table. Note the roe[top_200].is_largest(20) pattern: stocks outside the universe become blank before ranking, so exactly 20 are chosen from inside it. The full strategy.py adds the $5 million volume floor, the ±50% filter and one share class per company, and covers all 17 factors, both universes, the market filter and the other designs; --grid and --extras reproduce every heatmap, half, cost run and filter test in this article.
Install the FinLab skill for your AI agent
You do not need to write the code above yourself. Install the FinLab skill in Claude Code, Codex or Gemini CLI with one command:
Show Code
npx skills add https://github.com/koreal6803/finlab-ai --skill finlabThen ask your agent in plain language, for example "pick the 20 highest-ROE stocks among the 200 largest US companies and compare both halves with QQQ" or "rerun the PEG ratio screen on the 500 largest companies and add a 200-day moving average filter". The AI agent setup page walks through each tool, the AI-assisted setup connects your FinLab account, and the same research runs in the browser in FinLab Studio.
Backtest method and limits
| Item | How it was handled |
|---|---|
| Window | 2017-08-01 to 2026-10-28, the first month with a year of filings and prices. Halves split on 2022-03-16. |
| Universe | US-headquartered common stocks from FinLab's company profile, including later-delisted firms; one share class per company; no ADRs, ETFs, funds or financials. Price above 5 million a day, no ±50% day in the prior year. Each day: the 200 (or 100) largest by market value and the 500 most traded by dollar volume. |
| Look-ahead | Statement items enter on their SEC filing date; market value is point-in-time. Sector, country and security-type flags come from today's company profile, a small look-ahead for the financials exclusion and the US-only rule. The profile is refreshed daily, so rerunning strategy.py later can move a Sharpe ratio by 0.01 to 0.02. |
| Weighting | Equal weight, 5% per stock (10% with 10 holdings), no sector cap. |
| Rebalancing | Ranked on the last trading day of each month, traded at the next day's close; short-term reversal weekly. |
| Costs | finlab USMarket defaults: zero commission, zero tax. The three closest portfolios were rerun with 0.1% per side. Slippage was not modelled. |
| Turnover | One-way, per year: ROE 0.7, net income growth 2.0, growth + momentum (10 stocks) 2.6, 12-1 momentum 3.5. |
| Benchmark | QQQ total return, buy and hold, no costs; SPY for reference. Daily Sharpe without a risk-free rate. |
| Sample | All results are in-sample over about nine years. The halves are a stability check, not out-of-sample validation, and capacity was not estimated. With 85 portfolios, plus the grid, cost and filter checks (over 100 backtests in all), a few would look good in some stretch even if none worked, which is why a single winner has to pass all three checks. |
What this result does and does not say
It says that from 2017 to 2026, picking US large caps by growth, ROE, ROIC, cash flow or valuation and holding them at equal weight did not beat QQQ in both halves in any of the 85 portfolios we tried, and a market trend filter only made things worse. It does not say these factors are useless: among the 200 largest, 9 of the 17 picked better stocks than an equal-weight portfolio of that universe, but QQQ's lead over this window came from a handful of the largest technology companies, which an equal-weight factor portfolio could not keep up with. McLean & Pontiff (2016) also found that published stock-picking signals earned 58% less after publication.
For someone deciding whether to run one of these factors with real money, the practical reading is: among US large caps, buying growth or high ROE roughly tied QQQ over nine years, with more concentration and more trading; and a portfolio that wins over the full window should be checked for whether one or two years in one industry did the work. The US strategies on FinLab that did pass all three checks, such as the momentum study and the quality value backtest, use stock-level signals to decide when to hold leveraged Nasdaq ETFs rather than holding the picks, which adds leverage risk. How a 200-day average works on leveraged ETFs is in the leveraged ETF timing backtest.
FAQ
Do growth stocks beat the market?
Among US large caps over 2017-2026, roughly a tie, and not a stable one. The 20 fastest net income growers among the 200 largest companies scored a daily Sharpe of 0.89 against 0.90 for QQQ and beat SPY's 0.84, but their first half (0.78) trailed QQQ's 0.93. Revenue growth did worse, at 0.68.
Does a high ROE strategy work?
It was the closest of the 17 factors among large caps: 20 stocks from the 200 largest scored 0.89, and from 2017 to 2024 it slightly beat QQQ (0.91 against 0.88) before falling behind in 2025-2026. Only 3 of 9 neighbouring settings won and it lost the first half, so it is not reliable.
Does the PEG ratio work for US stocks?
Not in this window. The 20 lowest-PEG stocks among the 200 largest scored 0.75, and among the 500 most traded only 0.50, below QQQ (0.90) and SPY (0.84). The PEG ratio uses last year's earnings growth, so a rebound from a low base shows up as very high growth and a very low PEG.
Do low price-to-sales or low EV/EBITDA stocks beat QQQ?
No. Low price to sales scored 0.76 and 0.78, low EV/EBITDA 0.74 and 0.57, with maximum drawdowns of 43% or more. Among the 200 largest, both also trailed ROE and net income growth.
Are high free cash flow yield stocks worth buying?
Among the 200 largest they scored 0.75; among the 500 most traded 0.79 with a 19.0% CAGR, but a -50.8% maximum drawdown, much deeper than QQQ's -35.1%.
Does a 200-day moving average filter help avoid bear markets?
Over 2017-2026 it hurt. It made 34 of 40 portfolios worse and cut QQQ's own Sharpe from 0.90 to 0.85. The declines in this window rebounded quickly, so by the time the filter confirmed weakness most of the fall had happened, and the months it spent in cash earned more on average than the months it was invested.
Why compare with QQQ instead of the S&P 500?
QQQ is the benchmark FinLab uses for every US strategy, so results are comparable across the site. SPY is in the key-numbers table: 7 of the 40 stock portfolios beat its 0.84, but none beat QQQ in both halves.
Can I rerun this myself?
Yes. Install the FinLab skill through the AI-assisted setup, download strategy.py below, and run python strategy.py --grid --extras; once the data is downloaded it finishes in about 10 minutes.
Reproduce it yourself
- strategy.py: all 17 factors, both universes, the parameter grids, both halves, the cost runs, the market filter and the other designs.
- data.csv: daily equity curves of the 17 factors among the 200 largest, the three closest portfolios with and without the filter, the equal-weight top 200, QQQ and SPY.
- metrics.json: every statistic quoted in this article, including all 85 portfolios, the 27 grid settings and the filter's cash spells.
More US research is on the FinLab blog, including the overview of US quant strategies and an introduction to factor investing. The team behind it is on the about page, examples of what users build are on use cases, and metric definitions are in the glossary.
Last updated: 2026-10 | Backtest window: 2017-08 to 2026-10 | Benchmark: QQQ total return | Author: FinLab Quant Research (reviewed by a quantitative researcher)
Past performance does not represent future results, and every result here is an in-sample backtest. This content is for education only, is not investment advice, and does not constitute investment advice.
FinLab AI
Want to build your own strategy?
Describe your stock-picking ideas in natural language. AI automatically validates, backtests, and gives you answers
Start Free