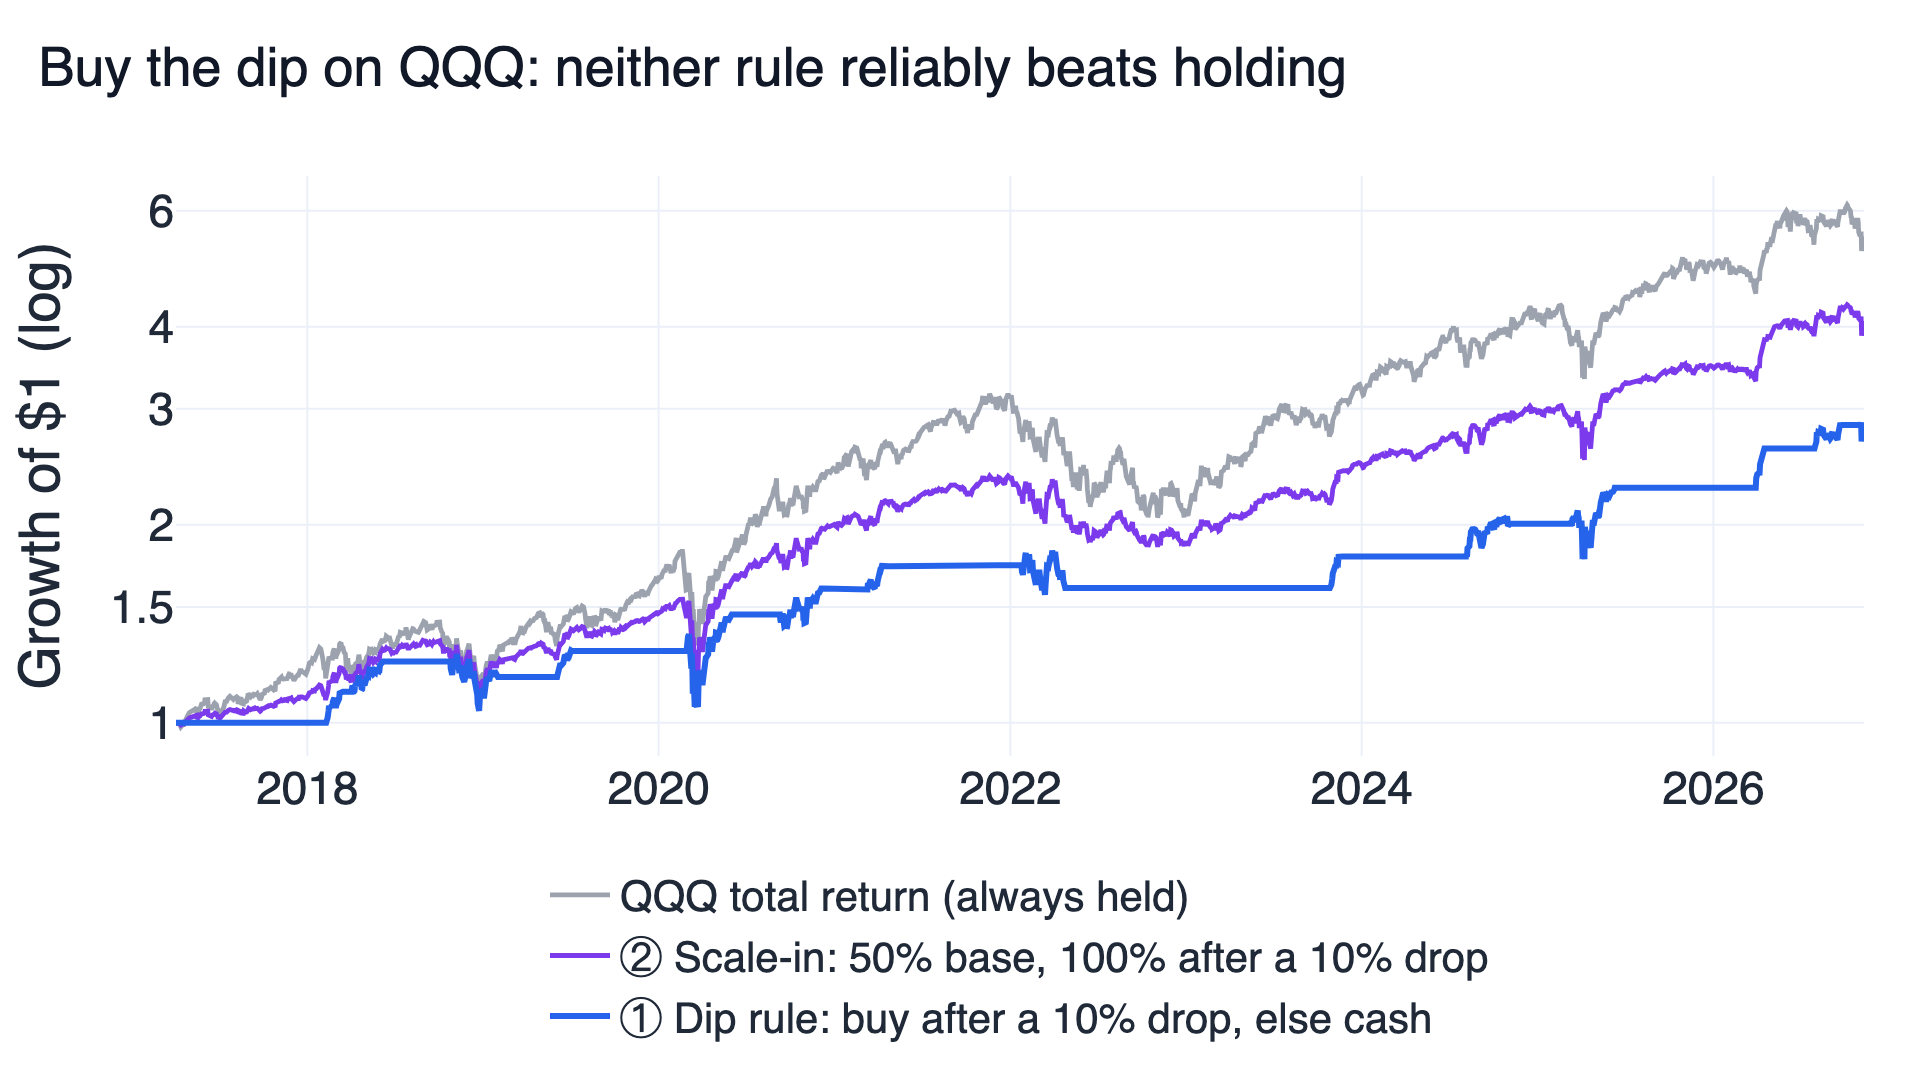
Neither buy-the-dip rule passes validation. Buying QQQ only after a 10% fall from its six-month high returned 11.3% a year, against 19.3% for simply holding QQQ (the Nasdaq-100 ETF, mostly large US technology companies) from 2017-04-03 to 2026-11-10, and it lost in all 27 parameter settings. Keeping 50% in QQQ and topping up to 100% after a dip came closer (15.7% a year) but won in only 3 of 9 settings and needed 2022 to stay ahead.
The dips themselves were good buys. Across the 13 entries with three months of data afterwards, QQQ was higher 63 trading days later 11 times, by 11.1% on average. The rule failed for a different reason: it sat in cash on 77% of trading days, so most of QQQ's gains happened while it was waiting.
What "buy the dip" means in this test
"Buy the dip" is market advice, not an academic strategy, so it has no single definition. People use it for two different habits. Some wait in cash and buy only after a fall. Others stay invested and add more after a fall. Both are tested here, and every number below comes from the same downloadable program.
The first rule, the dip rule, waits for QQQ to close at least 10% below its highest close of the previous 126 trading days (about six months). It buys the next day, then sells when the close gets back to that earlier high or after 63 trading days (about three months), whichever comes first. Only the first close past the threshold counts as a signal. If QQQ stays below the line after a time exit, the rule waits for it to recover and fall through the line again. Outside a trade it holds cash earning nothing.
The second rule, the scale-in rule, never leaves the market. It holds 50% QQQ and 50% cash, and moves to 100% QQQ while the first rule's signal is on. It rebalances back to the target at every month end and whenever the signal switches. This is closer to what most investors mean when they say they "keep some dry powder."
| Design | What varies | Settings tested (original in bold) |
|---|---|---|
| ① Dip rule | High lookback N, drop X, maximum hold H | N 63 / 126 / 252 days × X 5% / 10% / 15% × H 21 / 63 / 126 days (27) |
| ② Scale-in | Base weight w, drop X (N 126, H 63) | w 25% / 50% / 75% × X 5% / 10% / 15% (9) |
The grid and the pass rules were fixed before any return was calculated, and they were not changed afterwards. The original settings sit in the middle of each grid, so a good result cannot come from picking the best corner.
Where the signals fell
These trading rules are research results. To rerun the experiment, set up FinLab and download the research program (.py). Other files are in the research downloads.
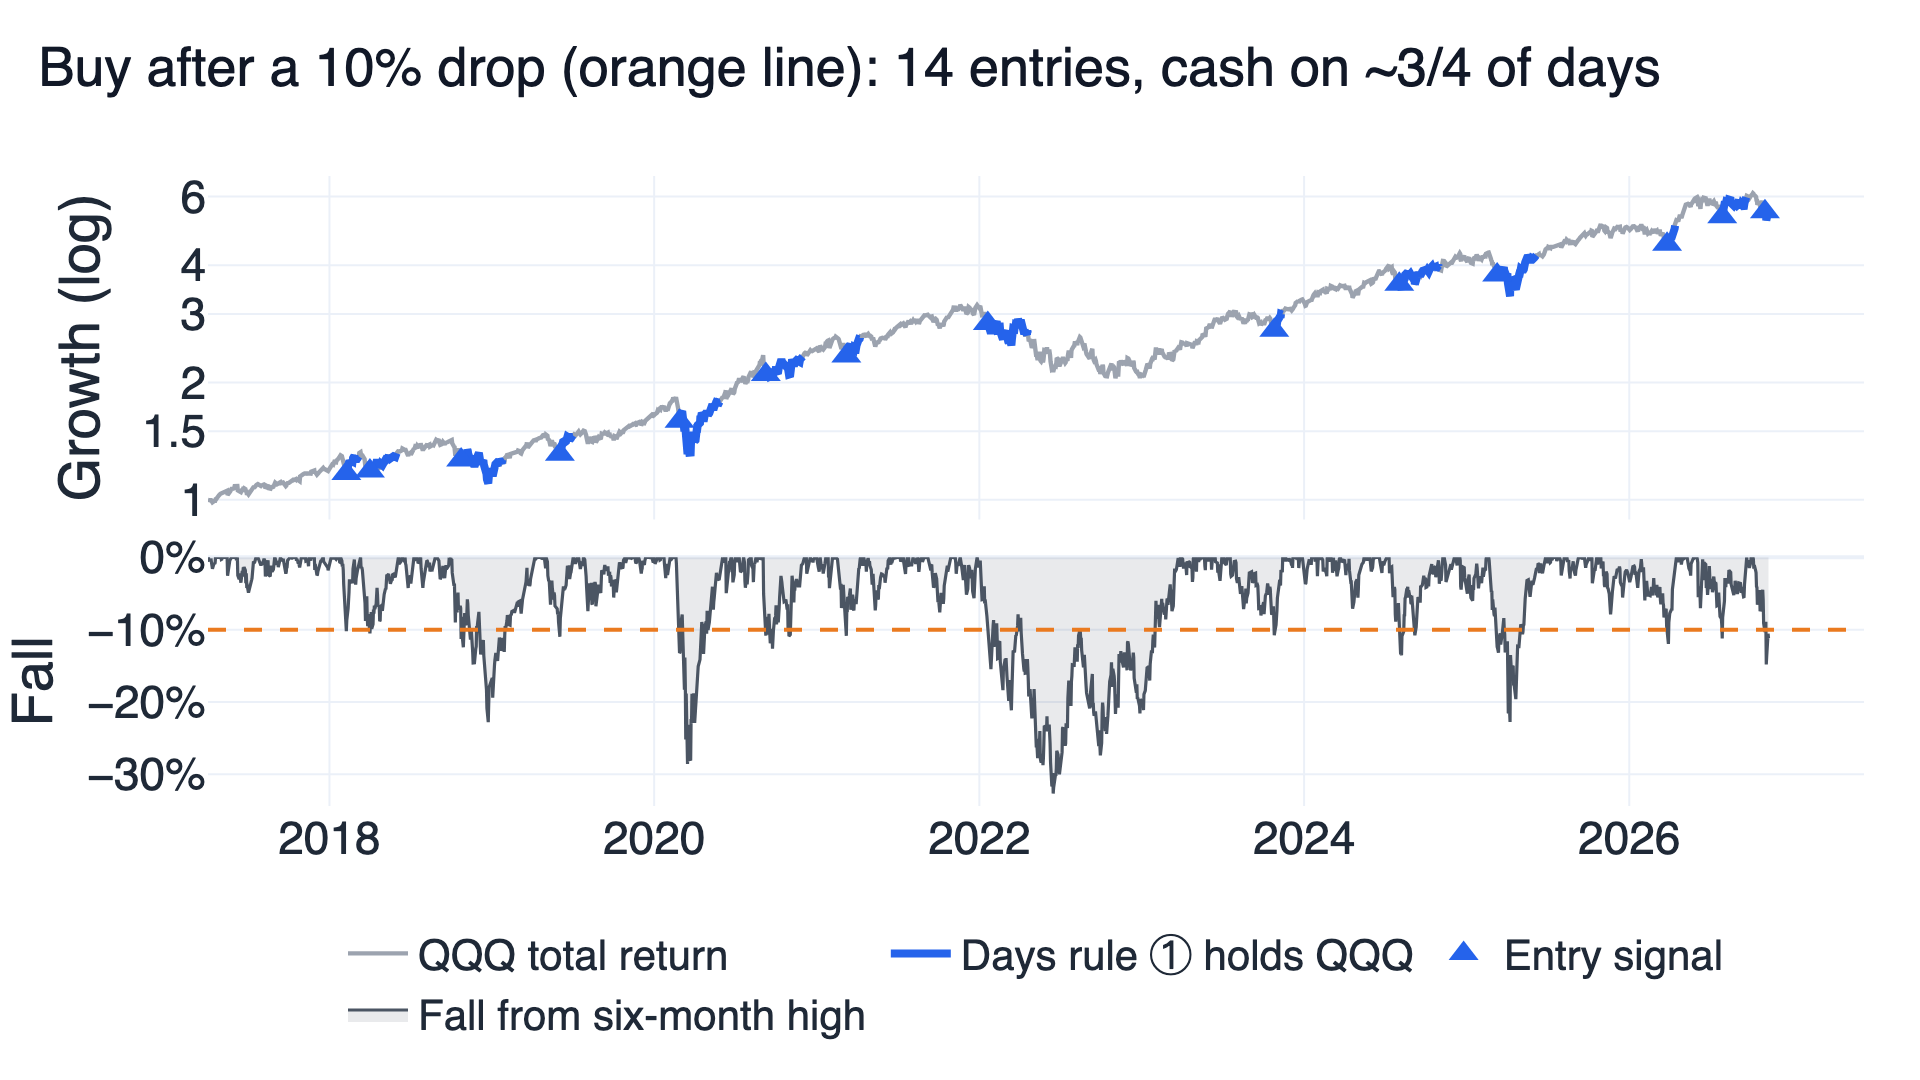
The rule triggered 14 times in nine and a half years, marked by triangles: three times in 2018, three in 2026 and about once a year in between. The last one, on 2026-11-02, was still open when the data end. The lower panel shows how rarely QQQ is 10% below its six-month high. Most of the time the line sits above -5%, and on those days the rule holds nothing.
| What happened after the 14 entries | Result |
|---|---|
| Exited because QQQ recovered to the earlier high | 8 entries, after 29 trading days on average |
| Exited after the 63-day limit | 5 entries (Oct 2018, Feb 2020, Jan 2022, Aug 2024, Mar 2025) |
| Still open on 2026-11-10 | 1 entry |
| Closed trades that made money | 11 of 13, +8.6% per trade on average |
| QQQ 21 days after the signal | +4.3% on average (any day: +1.7%), higher in 9 of 13 |
| QQQ 63 days after the signal | +11.1% on average (any day: +5.1%), higher in 11 of 13 |
| QQQ 126 days after the signal | +20.3% on average (any day: +10.6%), higher in 11 of 12 |
The forward returns are what dip buyers hope for: a 10% fall in QQQ was usually followed by a rebound, and the trades themselves mostly made money. The two losers were October 2018 (-5.3%) and January 2022 (-7.4%), both closed by the 63-day limit. The problem is what happens between trades. In February 2020 the rule bought into the COVID crash, gained 13.6% and was sold by the time limit at the 2020-05-29 close, three trading days before QQQ closed above its February high on 2020-06-03. It then held cash until the September 2020 signal while QQQ kept rising.
Results of the two original settings
| Original setting | ① Dip rule | ② Scale-in | QQQ, always held |
|---|---|---|---|
| Verdict | ✗ Failed | ✗ Failed | Benchmark |
| Annual return (CAGR) | 11.3% | 15.7% | 19.3% |
| Daily Sharpe (return per unit of risk) | 0.783 | 0.922 | 0.880 |
| Worst fall (max drawdown) | -22.4% | -23.3% | -35.1% |
| Settings beating QQQ | 0 of 27 | 3 of 9 | — |
| Average weight in QQQ | 22.8% | 61.5% | 100% |
CAGR is the average yearly growth rate. Daily Sharpe measures return per unit of day-to-day volatility: the mean daily return divided by its standard deviation, times the square root of 252, with no risk-free rate subtracted, following the ratio's definition in Sharpe (1994) with a zero rate. The first half runs to 2022-01-18 and the second half starts on 2022-01-19, splitting the trading days in two.
The embedded FinLab report is rule ①, the original dip rule. Its comparison line is the S&P 500 without dividends, an easier hurdle than the QQQ total return used in this article; the report's own grades are measured against that line and do not mean the rule passed the checks here. The report starts at the first trade in February 2018 and uses its own Sharpe convention, so its figures differ slightly from the table.
Nearby settings: no plateau
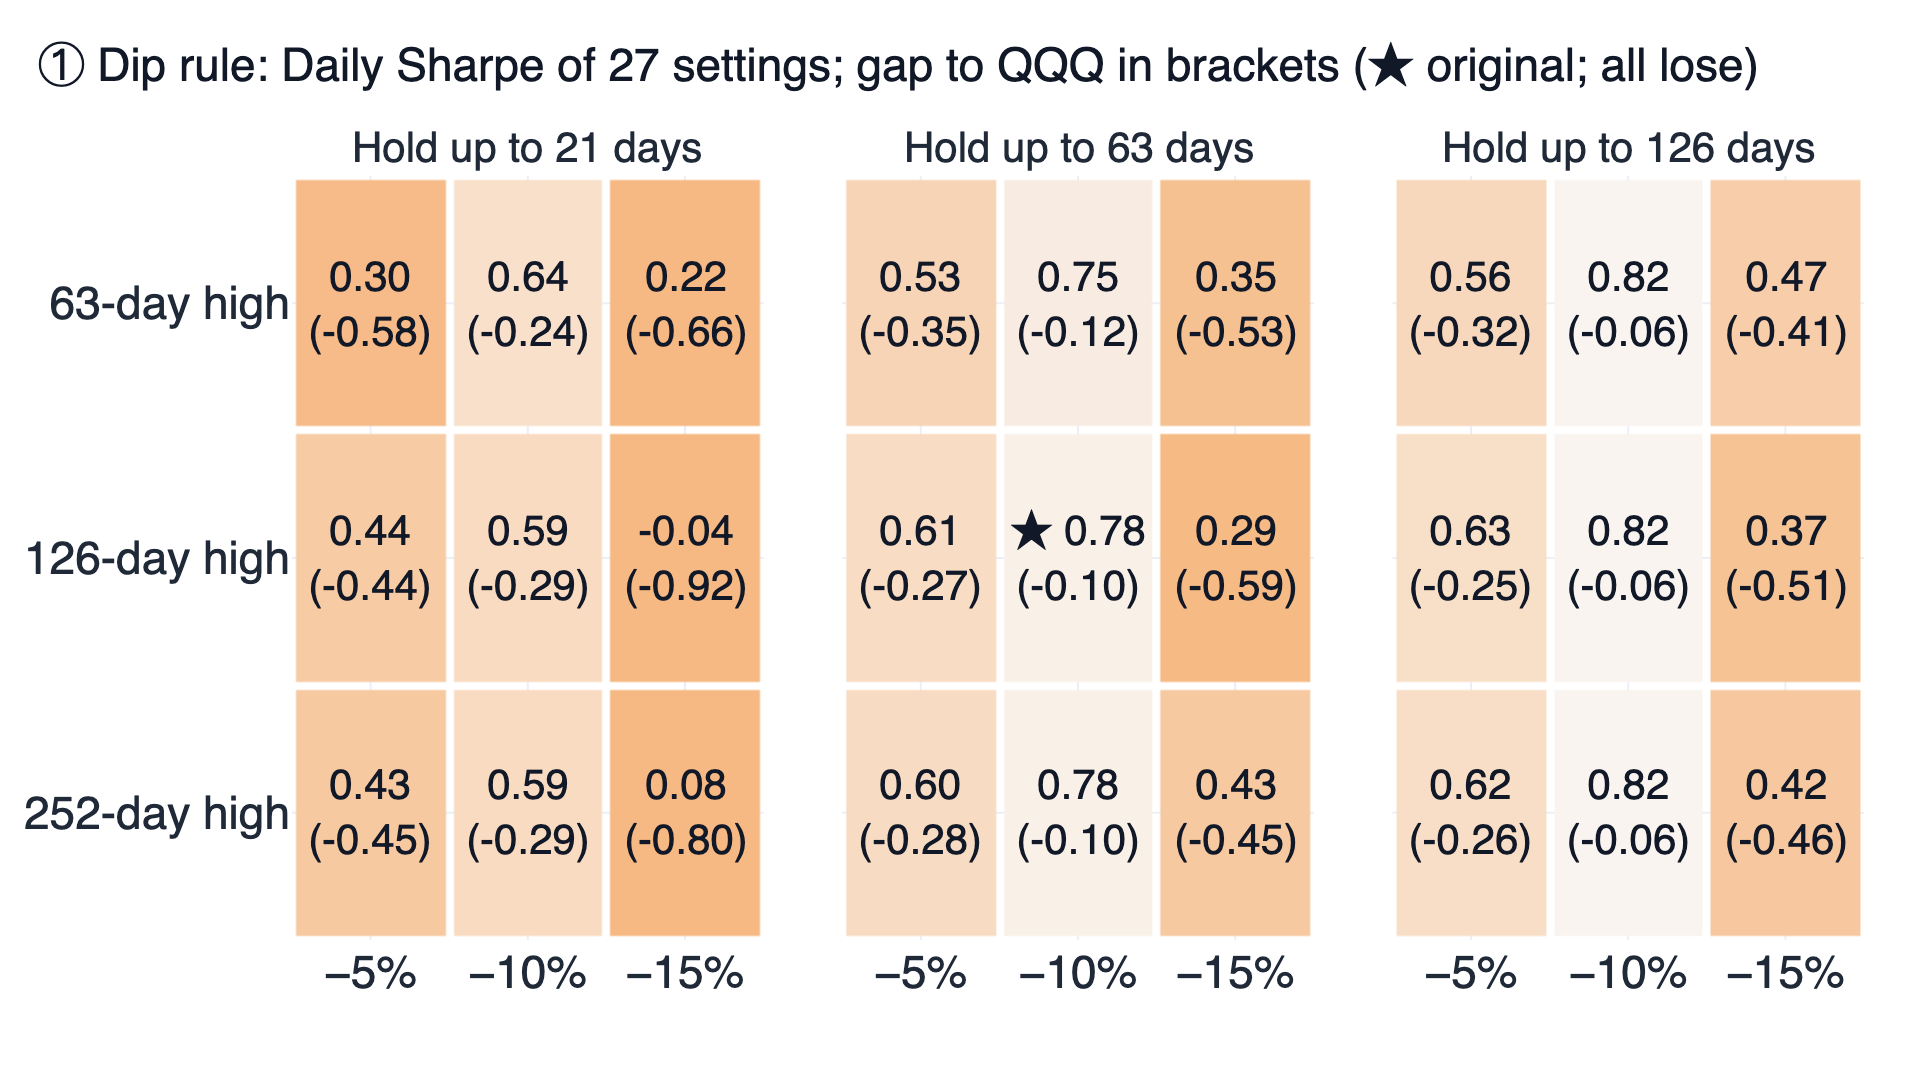
Every cell of rule ① is orange, meaning it trails QQQ. The best ones, a 10% drop with up to 126 days of holding, reach a Sharpe of 0.82, still 0.06 below QQQ. A 15% threshold is much worse: such falls are rare, so the rule holds QQQ on only 5% to 19% of days, and with a 21-day hold its Sharpe drops to between -0.04 and 0.22. At a 10% drop, the 126-day and 252-day lookbacks give identical results because they pick the same peak.
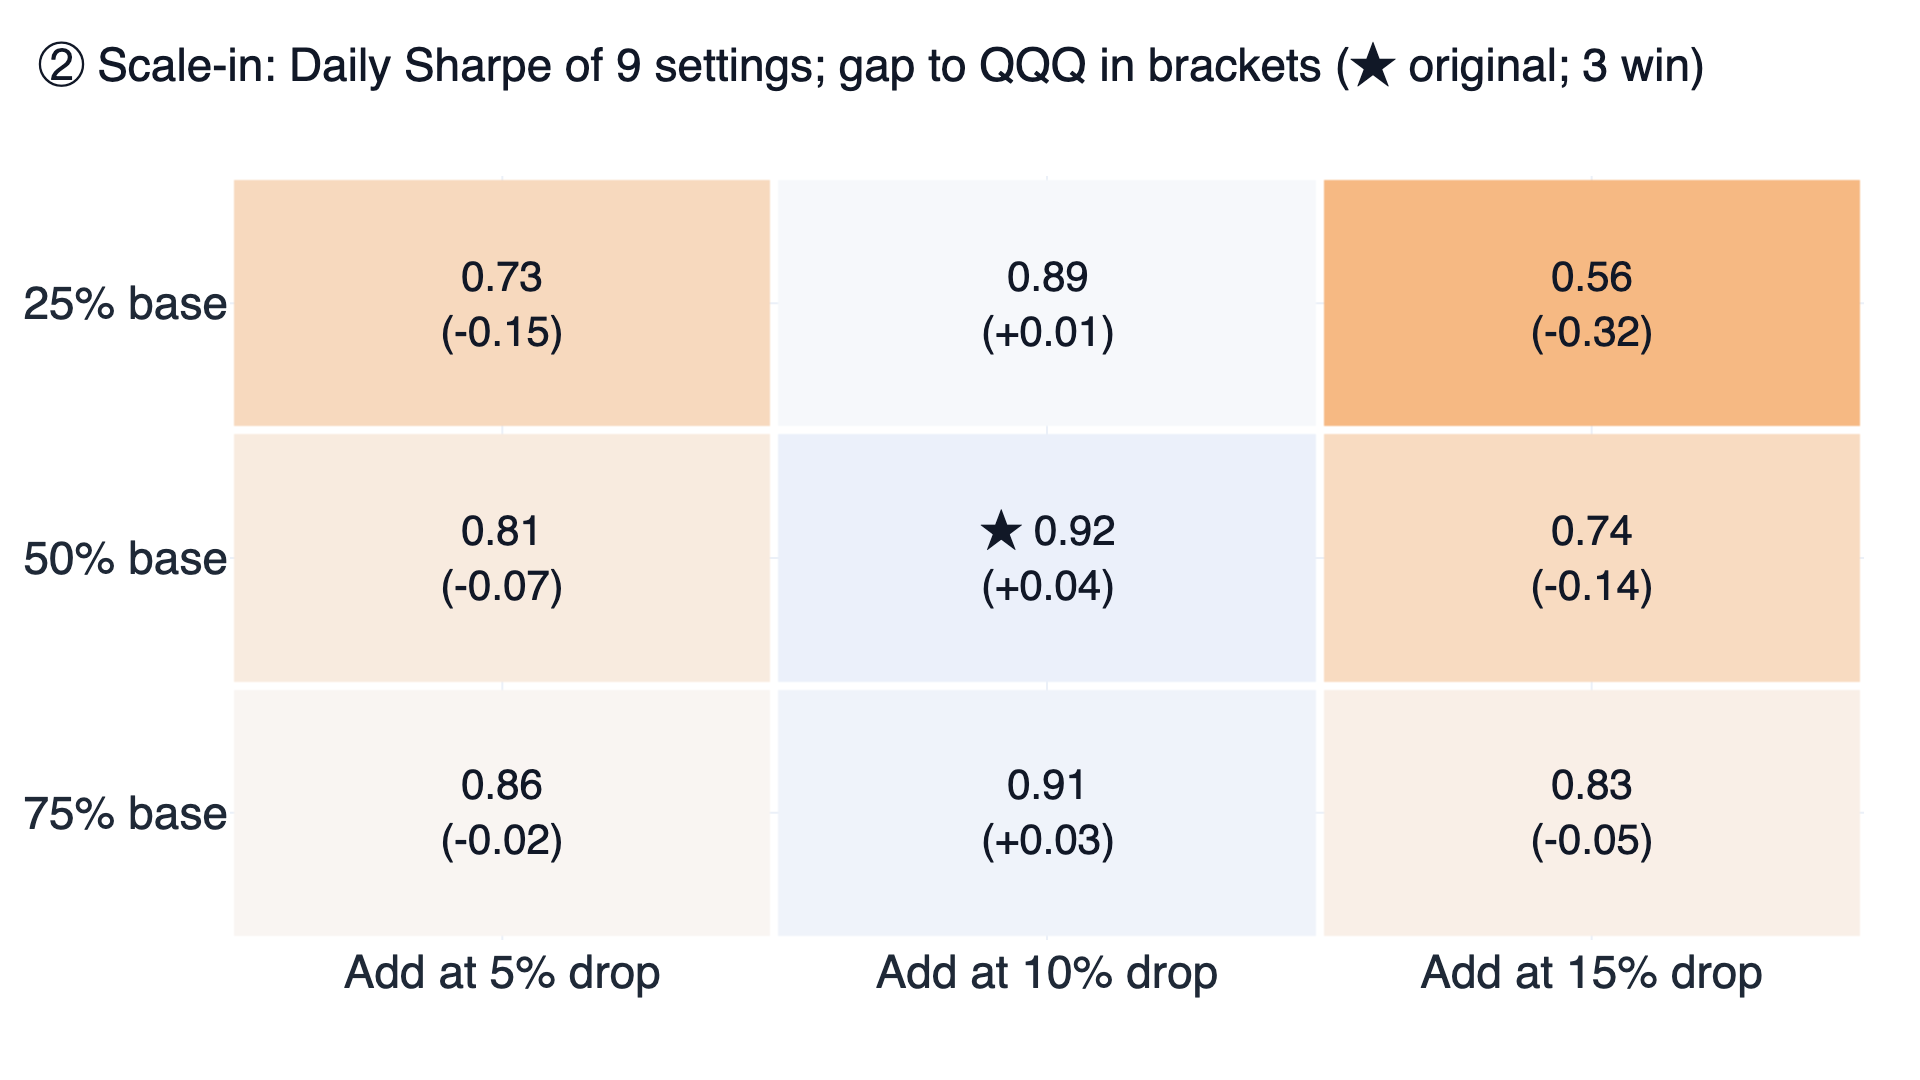
Rule ② beats QQQ in three cells, and all three use the 10% threshold. With 5% or 15% it loses at every base weight. A result that holds for one threshold and disappears on either side of it is the single-point outcome this grid was built to catch. The pass rule needed seven of nine.
The validation checks
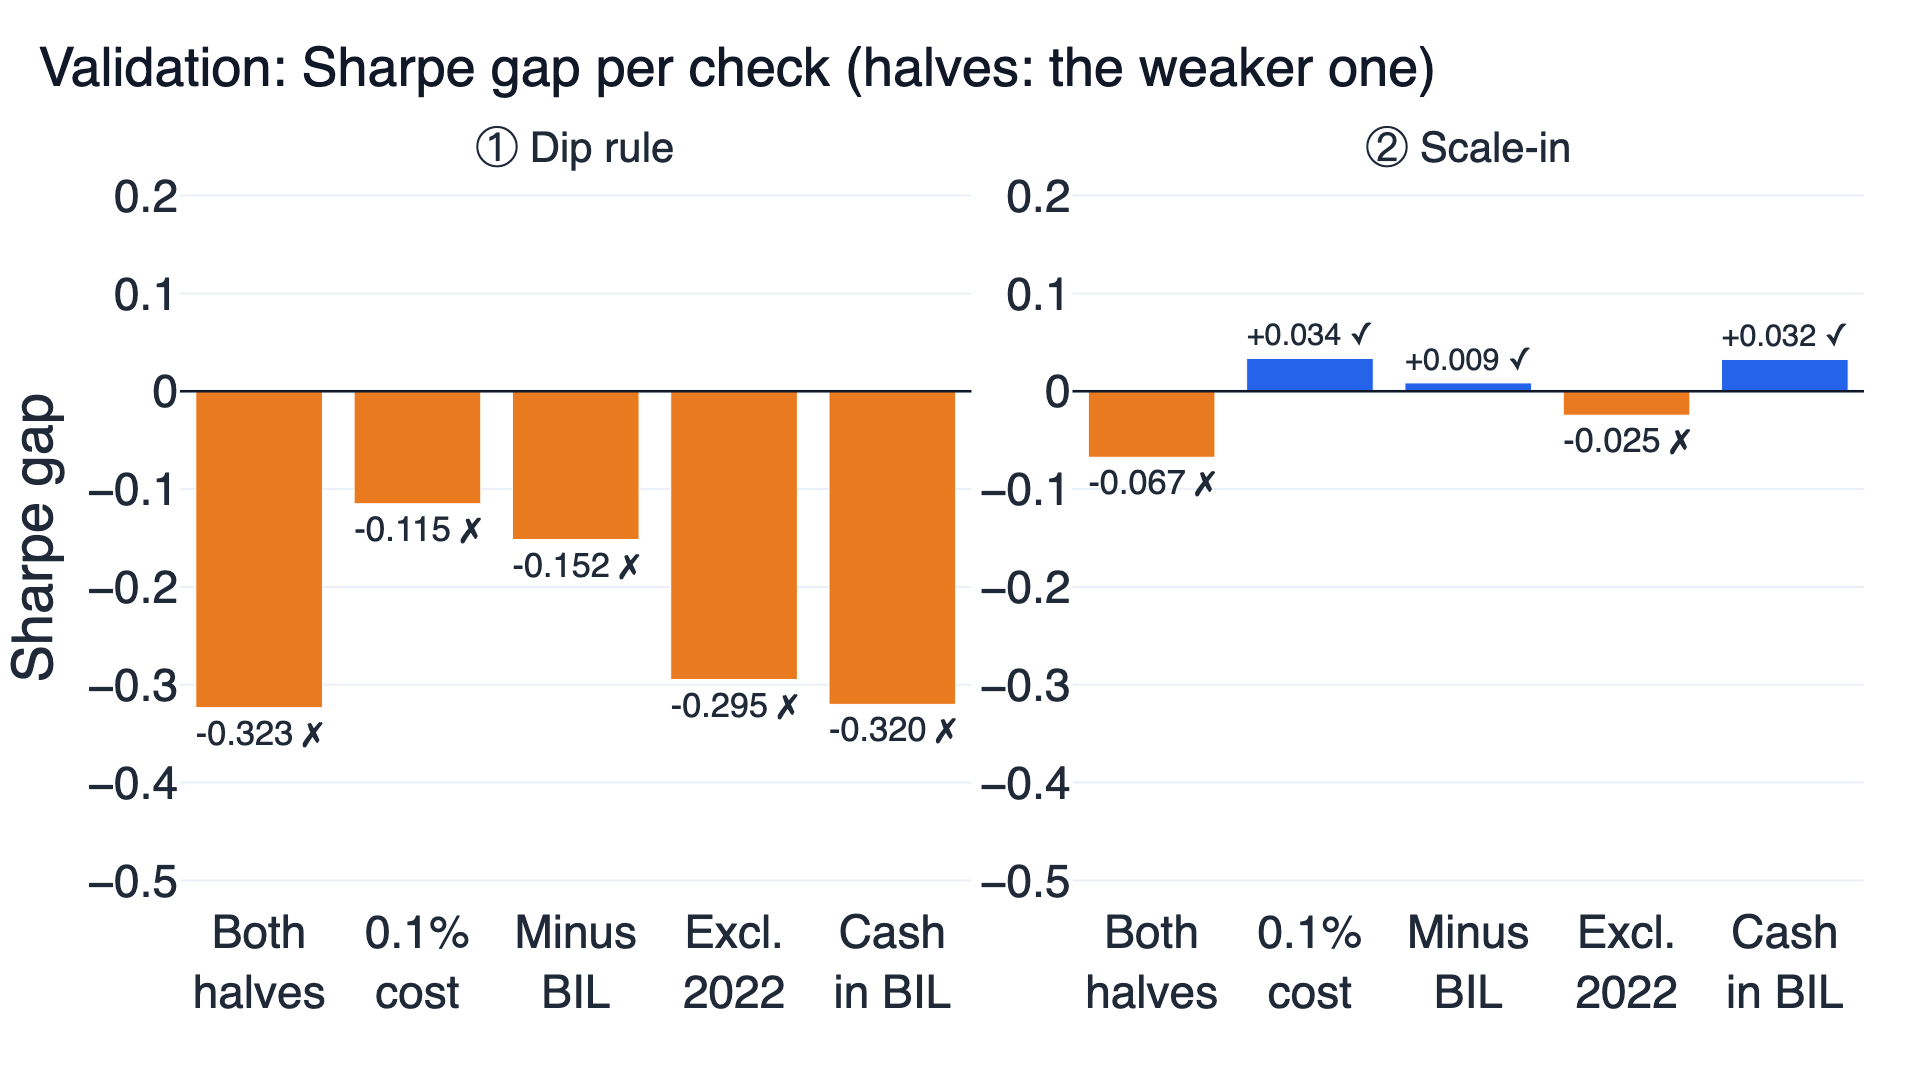
A design passes only if every check below holds. Rule ① fails all six. Rule ② passes three and fails three. BIL is an ETF of 1–3 month US Treasury bills; subtracting its return shows what a rule earned above cash.
| Check | ① Dip rule | ② Scale-in | QQQ or control |
|---|---|---|---|
| 70% of settings beat QQQ | 0 of 27 ✗ | 3 of 9 ✗ | — |
| Both halves beat QQQ (first / second) | 0.763 / 0.822 ✗ | 1.019 / 0.816 ✗ | 1.087 / 0.677 |
| 0.1% cost per side, Sharpe | 0.765 ✗ | 0.913 ✓ | 0.880 |
| Returns minus BIL, Sharpe | 0.624 ✗ | 0.784 ✓ | 0.776 |
| Without the year of largest lead (2022) | 0.929 ✗ | 1.199 ✗ | 1.223 |
| Idle cash in BIL, against the same average QQQ weight plus BIL | 0.911 ✗ | 0.977 ✓ | 1.231 / 0.945 |
US stocks and ETFs trade without commission at most brokers, so the default cost in FinLab's sim() for this market is zero. The 0.1%-per-side run is a separate allowance for spreads and slippage. It barely moves either rule: rule ① buys 14 times and sells 13 times in the whole period, and rule ②'s monthly rebalances trade only the drift back to its target, so its Sharpe slips from 0.922 to 0.913.
The BIL rows matter for any rule that holds cash. A 23% QQQ, 77% T-bill mix held every day has a Sharpe of 1.231, far above rule ①'s 0.911 with its cash in T-bills. The mix's high ratio comes from counting T-bill interest (BIL returned 2.4% a year here) as return with almost no volatility, which a Sharpe ratio without a risk-free rate rewards. A rule that is mostly in cash has to beat this mix, not just QQQ. Rule ② does beat its own mix (0.977 against 0.945), but that is not enough when the parameter grid and the first half fail.
Why waiting for dips cost more than it saved
The drawdown chart shows what the dip rules do well. Rule ① never fell more than 22.4%, and in 2022 it lost 7.4% while QQQ lost 32.6%. That single year is its largest lead over QQQ, 25 percentage points. Remove 2022 and rule ①'s Sharpe is 0.93 against QQQ's 1.22.
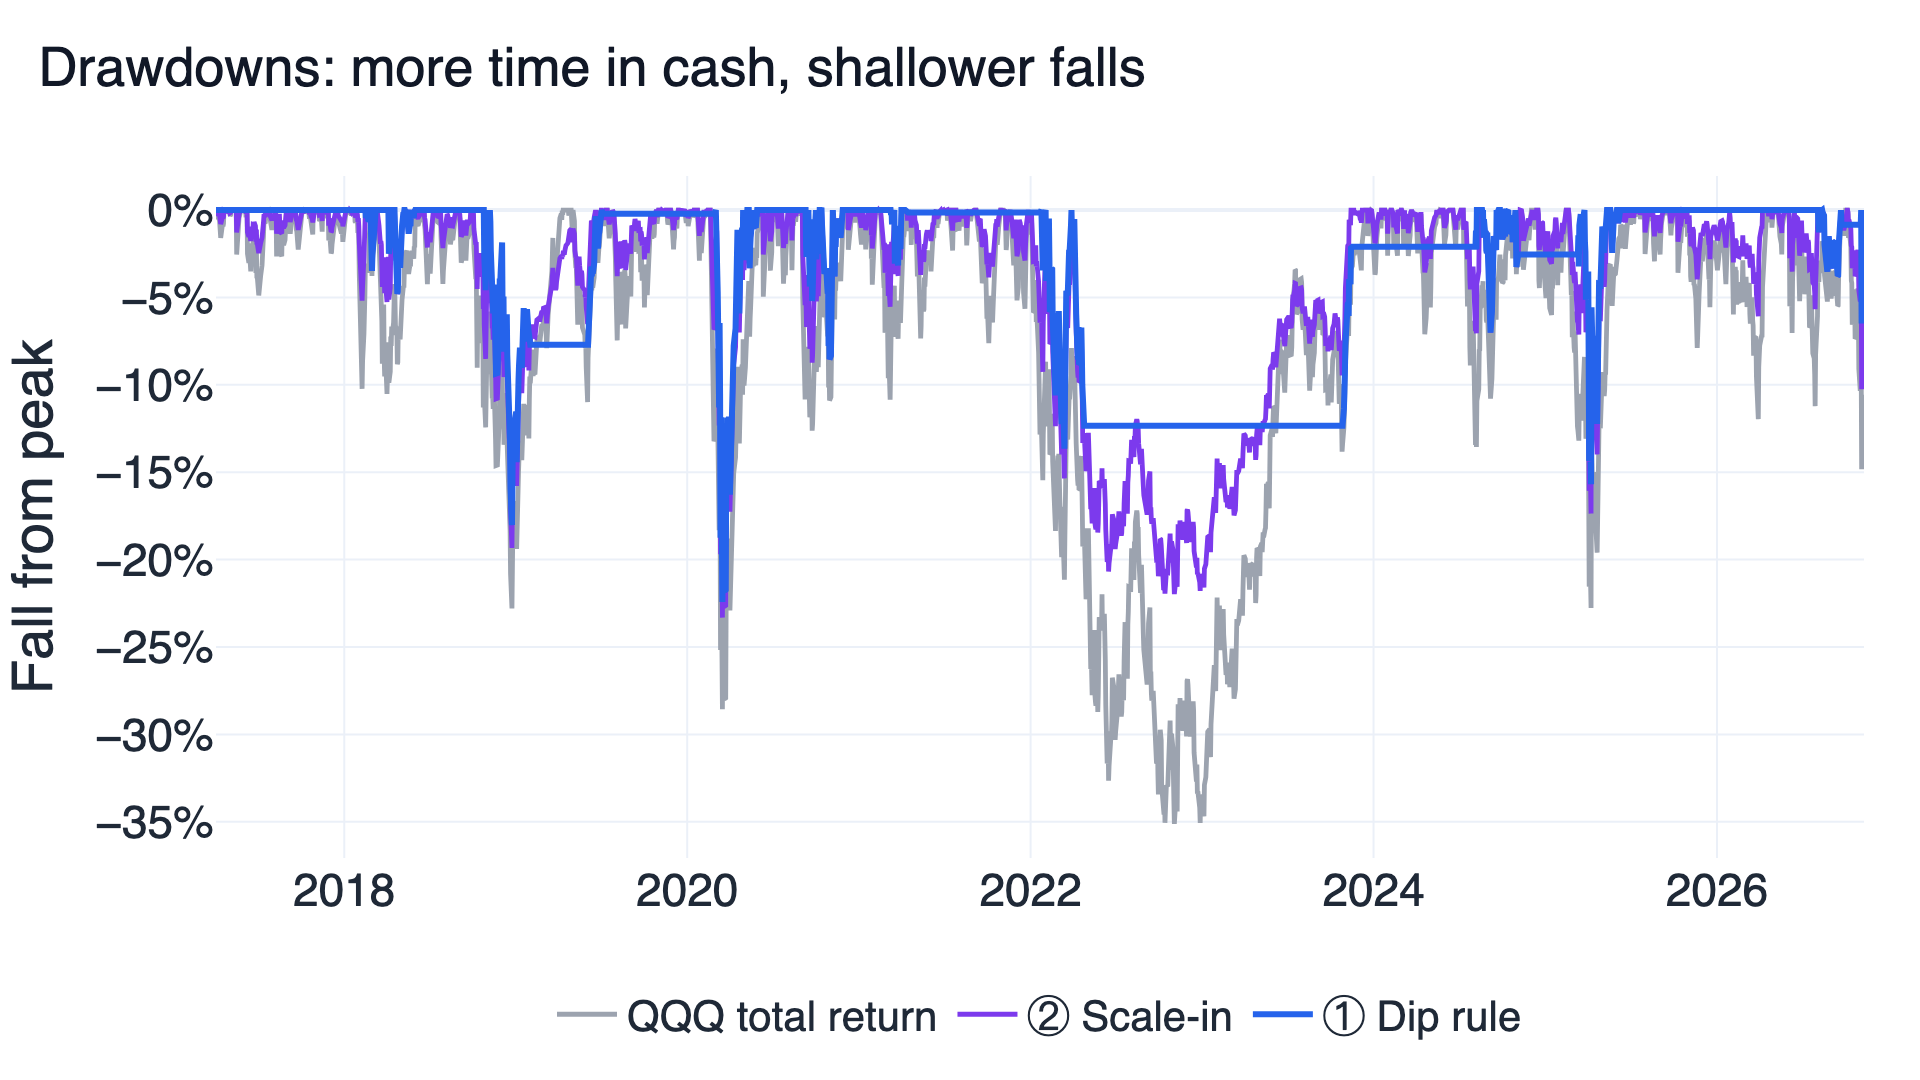
The cost is the rest of the time. In 2019, 2020, 2021, 2023 and 2024 QQQ returned between 25% and 55% a year. Rule ① made 8% to 24% in those years, because most of the advance happened while it held cash. Waiting for a 10% fall means being out of the market whenever prices are near their highs, and over this decade QQQ spent most of its time near its highs.
The dips themselves did rebound: 63 days after a signal QQQ was up 11.1% on average, against 5.1% for any 63-day stretch. The rule captured those rebounds only while it was invested, 23% of the time. This is the market-timing problem described by Sharpe (1975): a manager who moves between stocks and cash has to call the market correctly about three times out of four just to keep up with buying and holding, because time out of the market gives up its long-run premium. A dip rule makes one kind of call, "buy now", and spends the rest of the time out.
Rule ② gives up less because it is never more than half in cash. Its Sharpe lead over QQQ depends on 2022, when staying mostly at its 50% base cut the loss to 20.3%. In the strong years it trailed, by 22.6 percentage points in 2023 alone. Without 2022 its Sharpe is 1.199 against QQQ's 1.223.
How the test was run
- Data: QQQ and BIL adjusted closes (dividends included) from FinLab's
us_fund_pricetable. Prices from 2016 warm up the 252-day lookback; results run from 2017-04-03 to 2026-11-10. The run was completed on 2026-11-12 with finlab 2.3.8. - Timing: each signal is read at a close and traded at the next trading day's close, the
sim()default. The drop is measured on adjusted closes, so a dividend does not count as a fall. - Weights: rule ① holds 100% QQQ or 100% cash. Rule ② targets 50% or 100% QQQ and rebalances at each month end and at every signal change; the weight drifts between rebalances.
- Costs and slippage: zero commission by default; a separate run charges 0.1% per side to stand in for spreads and slippage. No taxes on capital gains, no margin and no market-impact model.
- Turnover and liquidity: rule ① makes 27 trades in the whole window. QQQ is one of the most heavily traded US ETFs, but the capacity of the rule was not estimated.
- Look-ahead and survivorship: the 126-day high and the drop use closes up to the signal day only, and the trade happens one close later. A single ETF that existed for the whole window has no survivorship problem; choosing QQQ, a fund that did well in this decade, is itself a choice made with hindsight.
- Cash: earns nothing in the backtest. The BIL checks add T-bill returns to idle cash separately.
- Limits: this is an in-sample study of one ETF over one decade, which included a crash and a bear market; there is no out-of-sample period. Fixing the grid before the run limits choosing parameters after seeing results, but the idea itself comes from market experience. Bailey and colleagues (2017) explain why a single backtest overstates what a rule will do; no probability of overfitting is estimated here.
Reproduce the rule with an AI agent
Install the FinLab skill for your AI agent with the FinLab setup flow; it works with Claude Code, Codex and Gemini CLI, and the agent guide explains what the agent can do with FinLab data. The direct install command is:
Show Code
npx skills add koreal6803/finlab-ai --skill finlab -g -yFinLab Studio runs the same research in a browser. A useful first request is: "Download the buy-the-dip research program, run rule ① with its registered settings, and show me the entry dates and the BIL comparison." Asking for a new dip rule first would produce a different experiment, and its result would not be comparable with the table above.
The core of rule ① fits in a few lines. This version reproduces the original setting; login is handled by FinLab.
Show Code
import finlab
import numpy as np
import pandas as pd
from finlab import data
from finlab.backtest import sim

finlab.login()
data.set_market("us_fund")
qqq = data.get("us_fund_price:adj_close")["QQQ"].loc[:"2026-11-10"].dropna()

# Highest close of the last 126 trading days, and the days QQQ is 10% below it
high = qqq.rolling(126).max()
below = (qqq / high - 1 <= -0.10).to_numpy()

hold = np.zeros(len(qqq), dtype=bool)
inside, target, age = False, np.nan, 0
for i in range(1, len(qqq)):
    if inside:
        age += 1
        # Sell on recovery to the earlier high, or after 63 trading days
        inside = qqq.iloc[i] < target and age < 63
    elif below[i] and not below[i - 1]:
        # First close 10% below the high: buy at the next close
        inside, target, age = True, high.iloc[i], 0
    hold[i] = inside

position = pd.DataFrame({"QQQ": hold}, index=qqq.index).loc["2017-04-03":]
report = sim(position, upload=False, end_date="2026-11-10")
The research program runs both grids and the cost and BIL checks, and writes the files listed below. The same program also runs this batch's stock buyback and Altman Z-score studies.
Questions about buying the dip
Does buying the dip work? In this test, buying QQQ only after a 10% fall earned less than holding QQQ, in every one of 27 settings. The dips were followed by rebounds, but the rule was in cash for most of the decade's gains.
Is buying the dip better than dollar-cost averaging? They answer different questions. Dollar-cost averaging spreads new money over time; the DCA versus lump sum study found investing at once beat spreading purchases in most start months. Waiting for a dip is a stricter version of waiting, so it has the same problem.
What about buying when the VIX spikes? That uses fear rather than price as the trigger. The VIX above 40 study looks at those rare panics, which happened far less often than a 10% fall in QQQ.
Should the rule sell on the recovery? The holding limit and the recovery exit are what make it a dip trade. Removing both would turn it into "buy once and hold", which is QQQ with a delay.
Why not use the 0.82 setting from the grid? It still trails QQQ, and choosing the best cell after the fact is the overfitting the grid is meant to expose.
Does a smaller drawdown make the rule safer? It is shallower because the rule is usually not invested. A fixed 23% QQQ with the rest in T-bills also falls less, and it had a higher Sharpe than rule ① (1.231 against 0.911 with idle cash in T-bills).
The US strategy overview separates validated rules from negative results like this one. Other cash-or-QQQ rules tested on this site include volatility targeting, the 200-day moving average filter and grid trading on QQQ. The backtesting guide explains execution timing and bias, and the glossary defines the terms used here.
Research downloads
| File | Contents |
|---|---|
| Open dip rule report (web) | Opens in your browser: daily balance, every trade and yearly returns of rule ① |
| Open scale-in report (web) | The same report for rule ② |
| Download daily balances (CSV) | Daily balances of both rules, QQQ and BIL; opens in a spreadsheet |
| Download complete test results (JSON) | Every setting, check and trade, for AI or coding tools |
| Download research program (Python) | For your AI agent or for programmers, after setting up FinLab |
Past performance does not guarantee future results. This material is for research and education and is not investment advice. It does not recommend buying or selling QQQ or any other security, and it does not promise that a historical pattern will continue.
Last updated: 2026-11 | Backtest window: 2017-04-03 to 2026-11-10 | Author: FinLab Quant Research. The team maintains reproducible Taiwan and US market studies using FinLab data.
FinLab AI
Want to build your own strategy?
Describe your stock-picking ideas in natural language. AI automatically validates, backtests, and gives you answers
Start Free