Run this strategy
Copy the prompt to reproduce the evidence above with the article’s data, assumptions, and risk checks.
Tell your AI:
Set up FinLab and compare a lump sum in QQQ with a 12-month DCA plan from every start month. Please read: https://finlab.finance/en/setup?relatedUrl=/en/blog/dca-vs-lump-sum-backtest
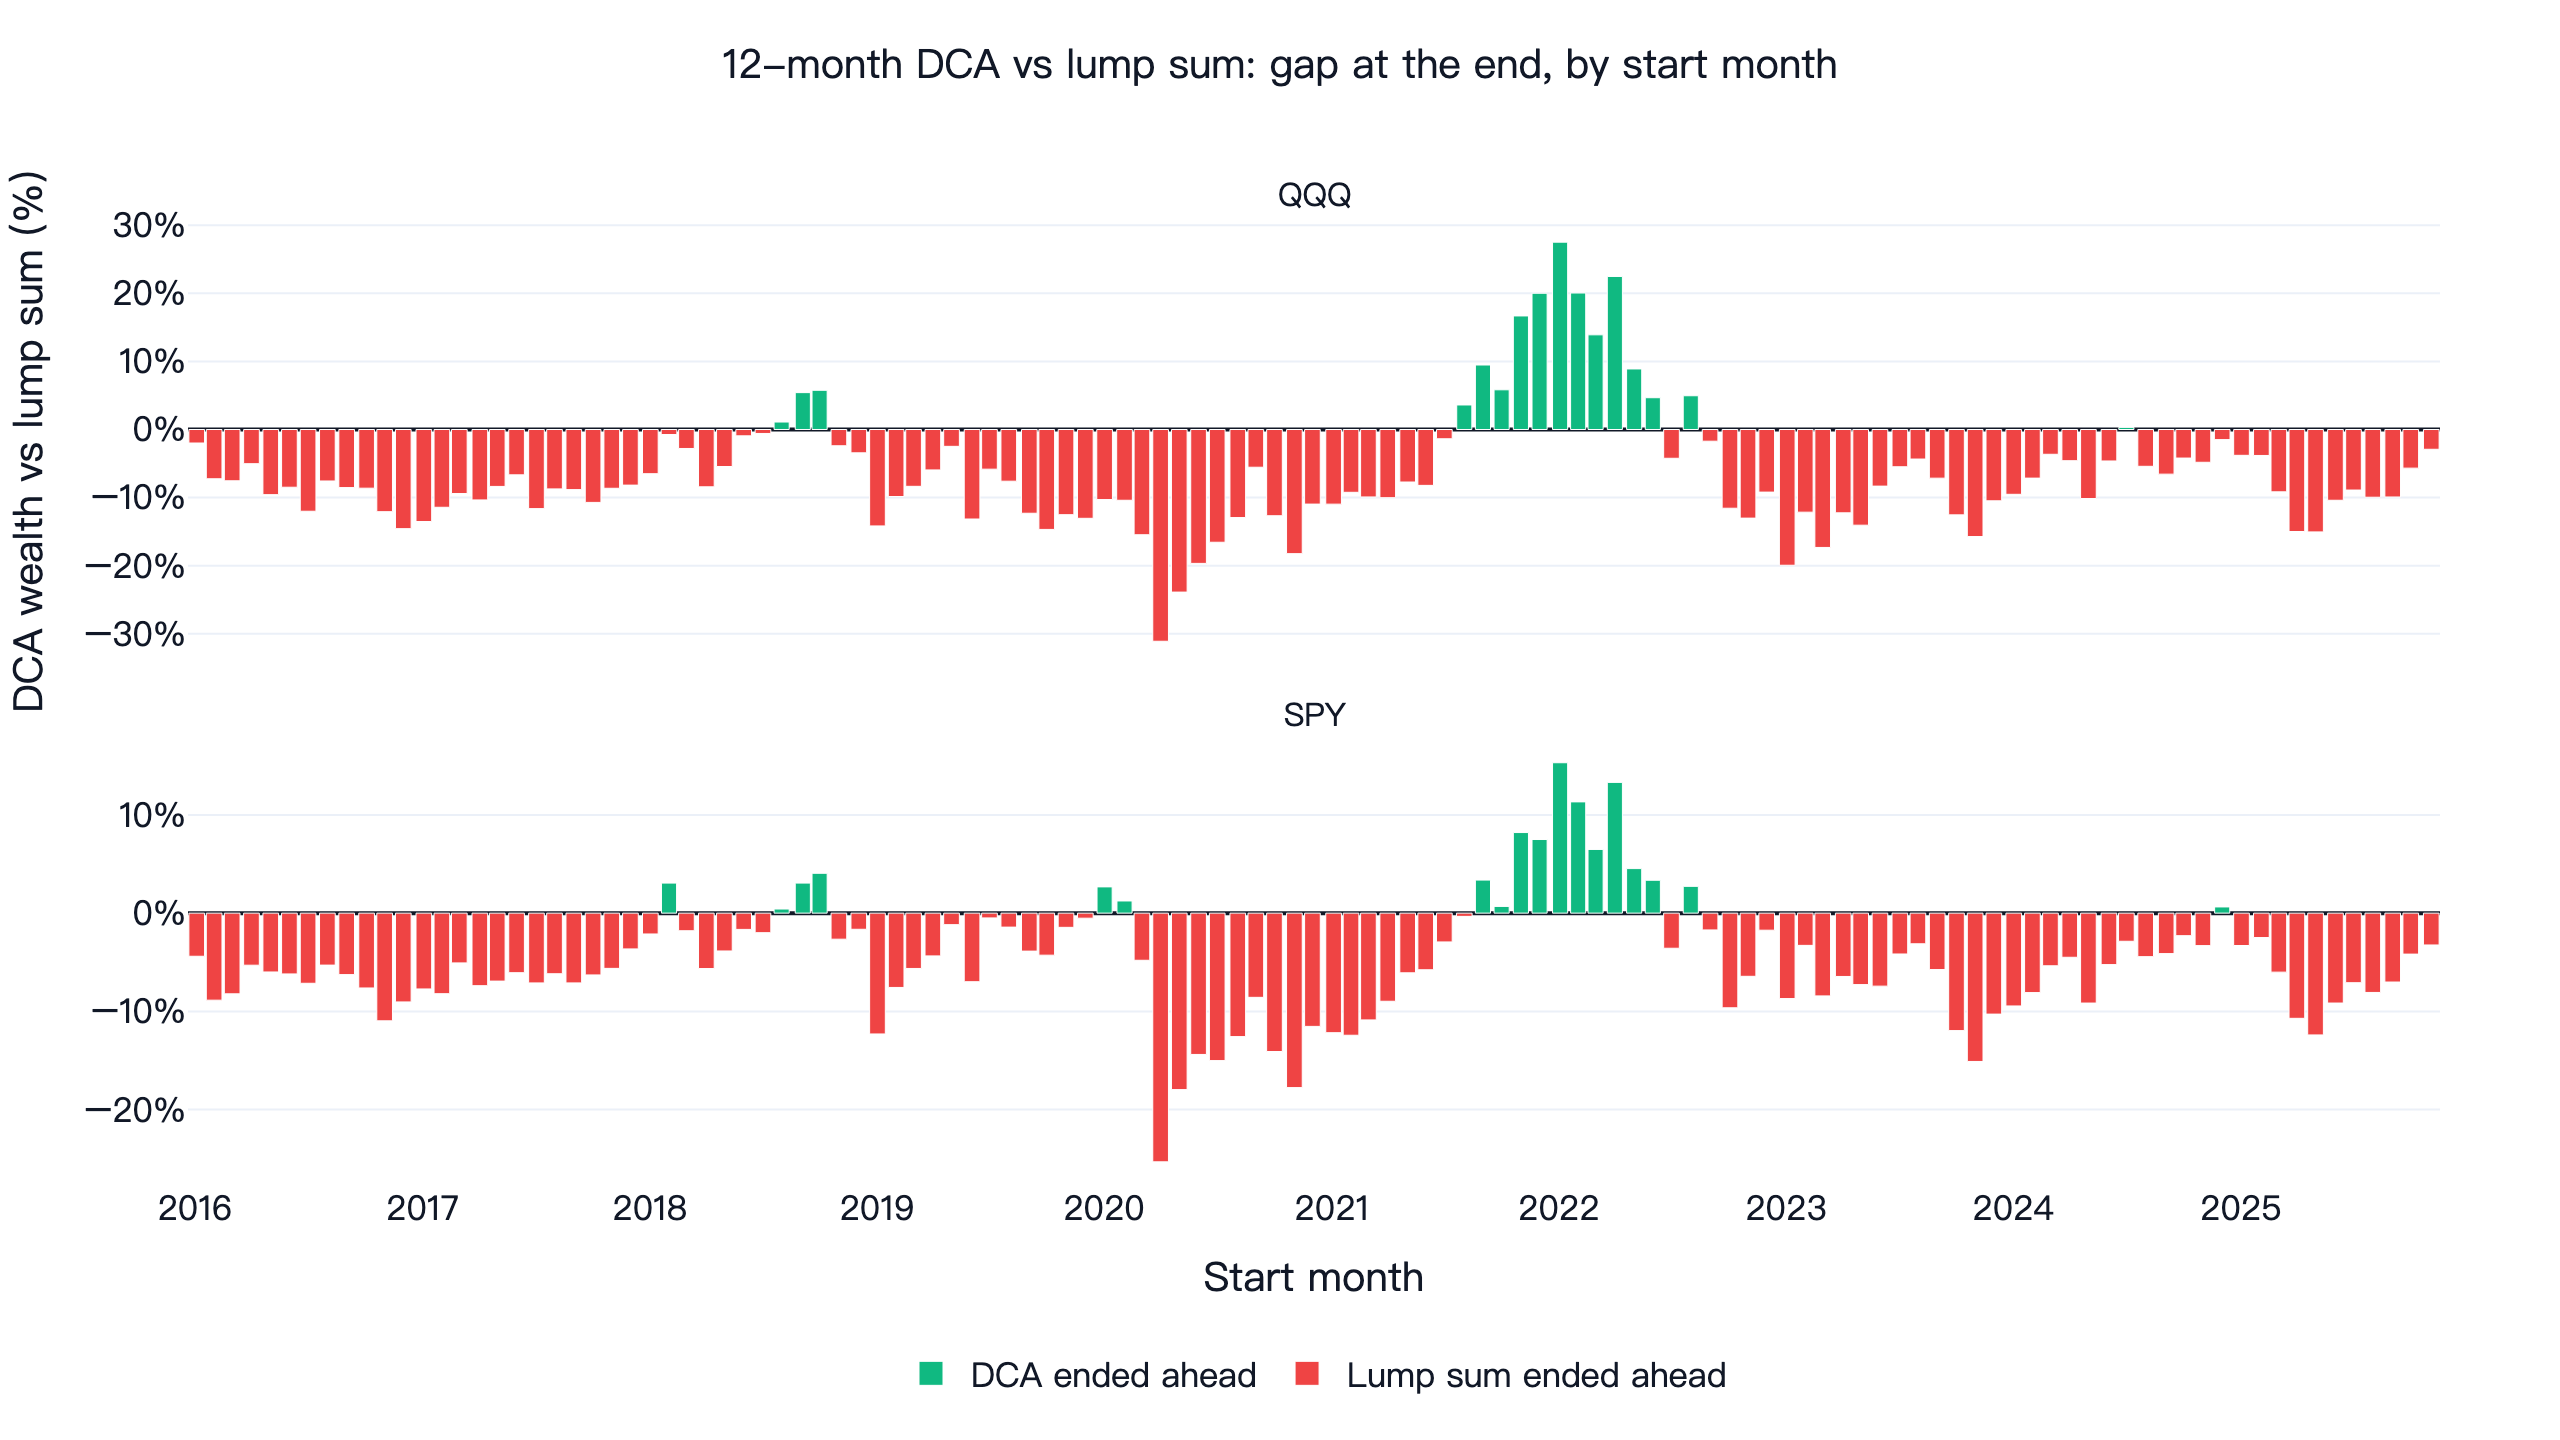
You have a sum of money. Should you invest it all today, or spread it over the next 12 months? We treated the first trading day of every month from January 2016 to November 2025 as a new start, 119 starts each for SPY and QQQ, with the money not yet invested held in BIL, a T-bill ETF. Investing the lump sum at once ended with more money in 84.9% of starts for SPY and 86.6% for QQQ, and DCA ended 5.0% and 6.6% behind on average. Dollar cost averaging (DCA) only won when the market fell before it was fully invested: starting in January 2022, DCA into QQQ ended 27.5% ahead.
What DCA bought was a smaller drawdown while it was buying. The average worst drop during the 12 months fell from 14.5% to 8.6% for SPY. But compared with simply holding a little over half the money in the fund and the rest in T-bills, DCA was no better: the difference came from owning less stock for a while.
Key numbers
DCA here means 12 monthly purchases on the first trading day of each month, with the rest in BIL (SPDR Bloomberg 1-3 Month T-Bill ETF).
| SPY | QQQ | |
|---|---|---|
| Start months | 2016-01 to 2025-11 | 2016-01 to 2025-11 |
| Starts | 119 | 119 |
| Lump sum ended ahead | 84.9% | 86.6% |
| Average DCA gap vs lump sum | -5.0% | -6.6% |
| Median gap | -5.6% | -8.4% |
| Best start for DCA | 2022-01, +15.3% | 2022-01, +27.5% |
| Worst start for DCA | 2020-04, -25.3% | 2020-04, -31.1% |
| Average 12-month return, lump sum / DCA | 16.0% / 9.5% | 22.3% / 12.9% |
| Average max drawdown in the 12 months, lump sum / DCA | -14.5% / -8.6% | -17.3% / -10.9% |
Gap = DCA ending wealth / lump-sum ending wealth - 1, so a negative number means DCA ended with less. Total-return prices through 2026-11-05.
How we compared them: one sum, a new start every month
A single comparison has a single start date, and the result depends on what the market did right after it. So we treated the first trading day of every month as the day the money arrived:
- Lump sum: buy the fund with everything at that day's close.
- DCA: buy it over N months. Money not yet invested sits in BIL. Each purchase uses the remaining balance divided by the purchases left, so the T-bill interest gets invested too.
- Comparison date: the first trading day of month N after the start. By then both hold only the fund, so the percentage gap stays the same from then on. Vanguard uses the same argument to show that the length of the holding period does not change the answer.
FinLab's U.S. fund prices start in January 2016, which sets the first start. Starts roll monthly and neighbours share 11 of their 12 months, so 119 starts are not 119 independent results. Read the percentages as a description of this decade.
Nine settings, two funds: the lump sum came out ahead in all of them
We varied how long DCA takes (6, 12 or 18 months) and how often it buys (every 5 trading days, monthly or quarterly). The chart shows, for each of the nine settings, the share of starts in which DCA ended ahead:
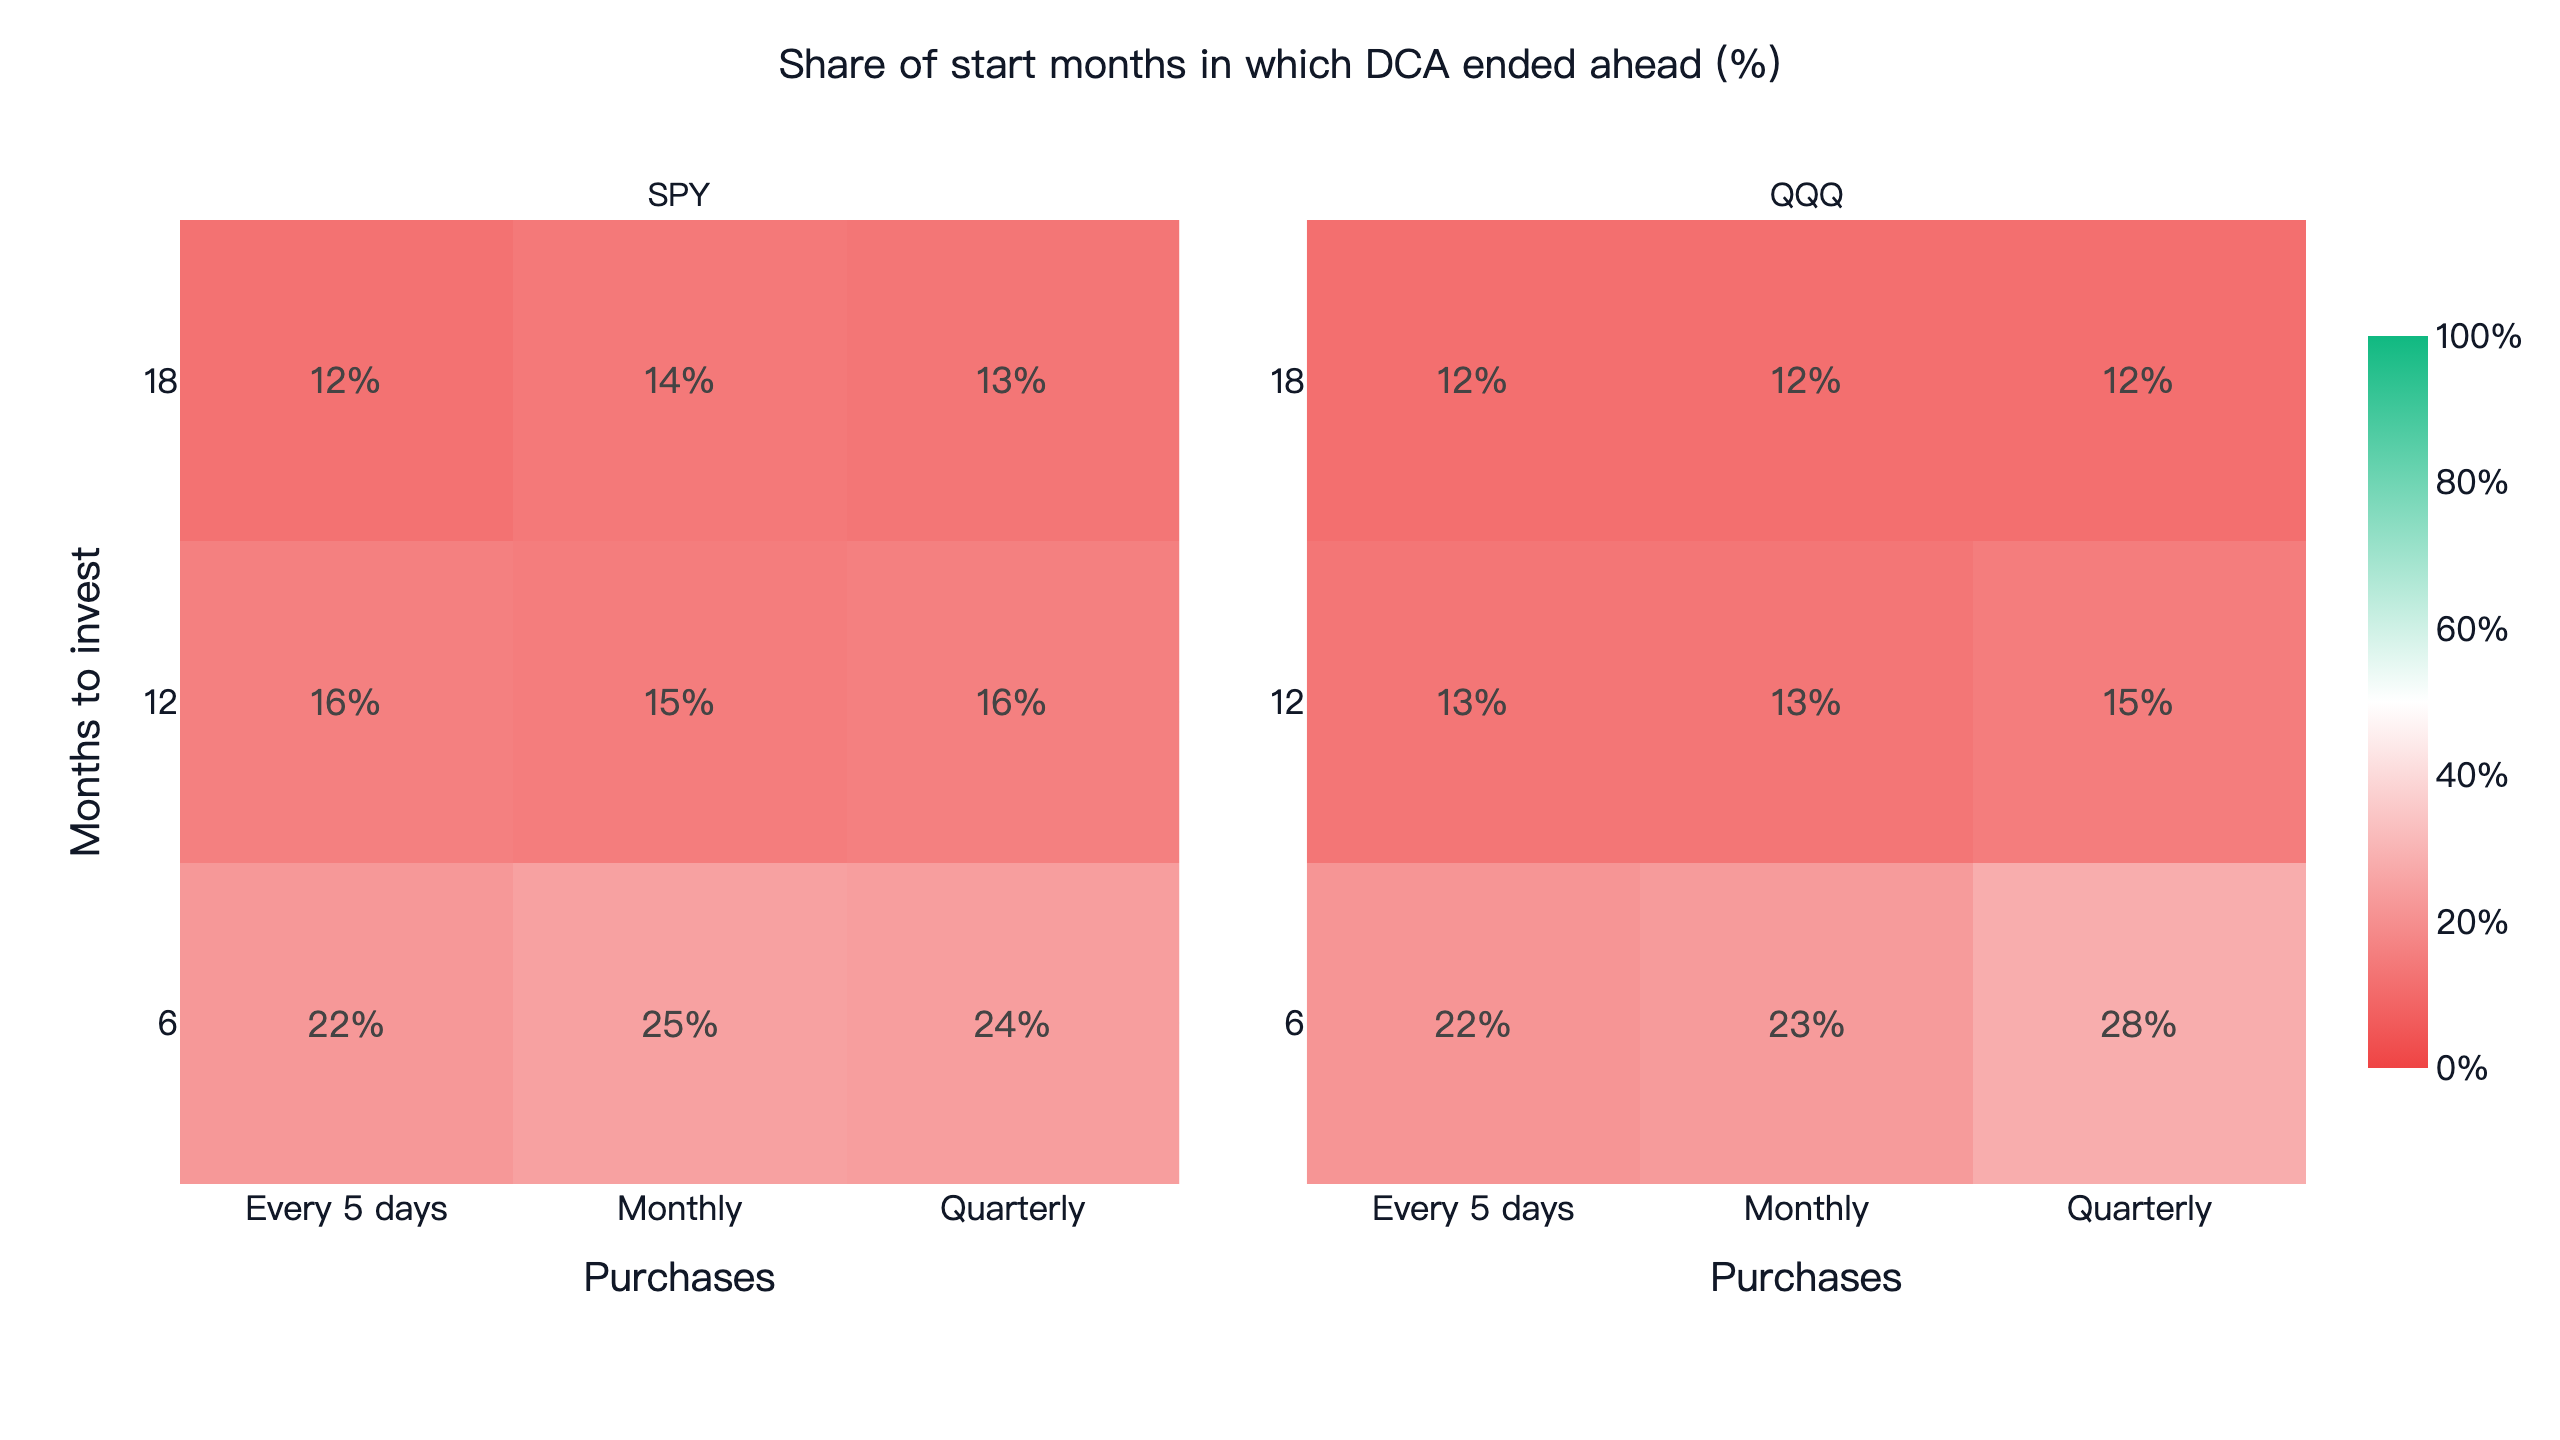
None of the 18 cells reaches 50%. The longer DCA takes, the more it costs:
| Months to invest (monthly purchases) | SPY average gap | QQQ average gap | Lump sum ahead, SPY | Lump sum ahead, QQQ |
|---|---|---|---|---|
| 6 | -2.3% | -3.1% | 75.2% | 76.8% |
| 12 | -5.0% | -6.6% | 84.9% | 86.6% |
| 18 | -7.5% | -9.8% | 85.8% | 88.5% |
How often you buy matters much less. Over 12 months into QQQ, buying every 5 trading days averaged -7.1%, monthly -6.6% and quarterly -5.4%. Quarterly lost the least because its first purchase puts a quarter of the money in on day one, so more of the money is invested on average.
On 122,300 after 12 months on average and the 12-month DCA plan 9,400 less; DCA was behind in 103 of 119 starts.
When DCA wins: the market falls before you finish buying
Each dot below is one start. It plots the gap against the fund's own return over those 12 months:
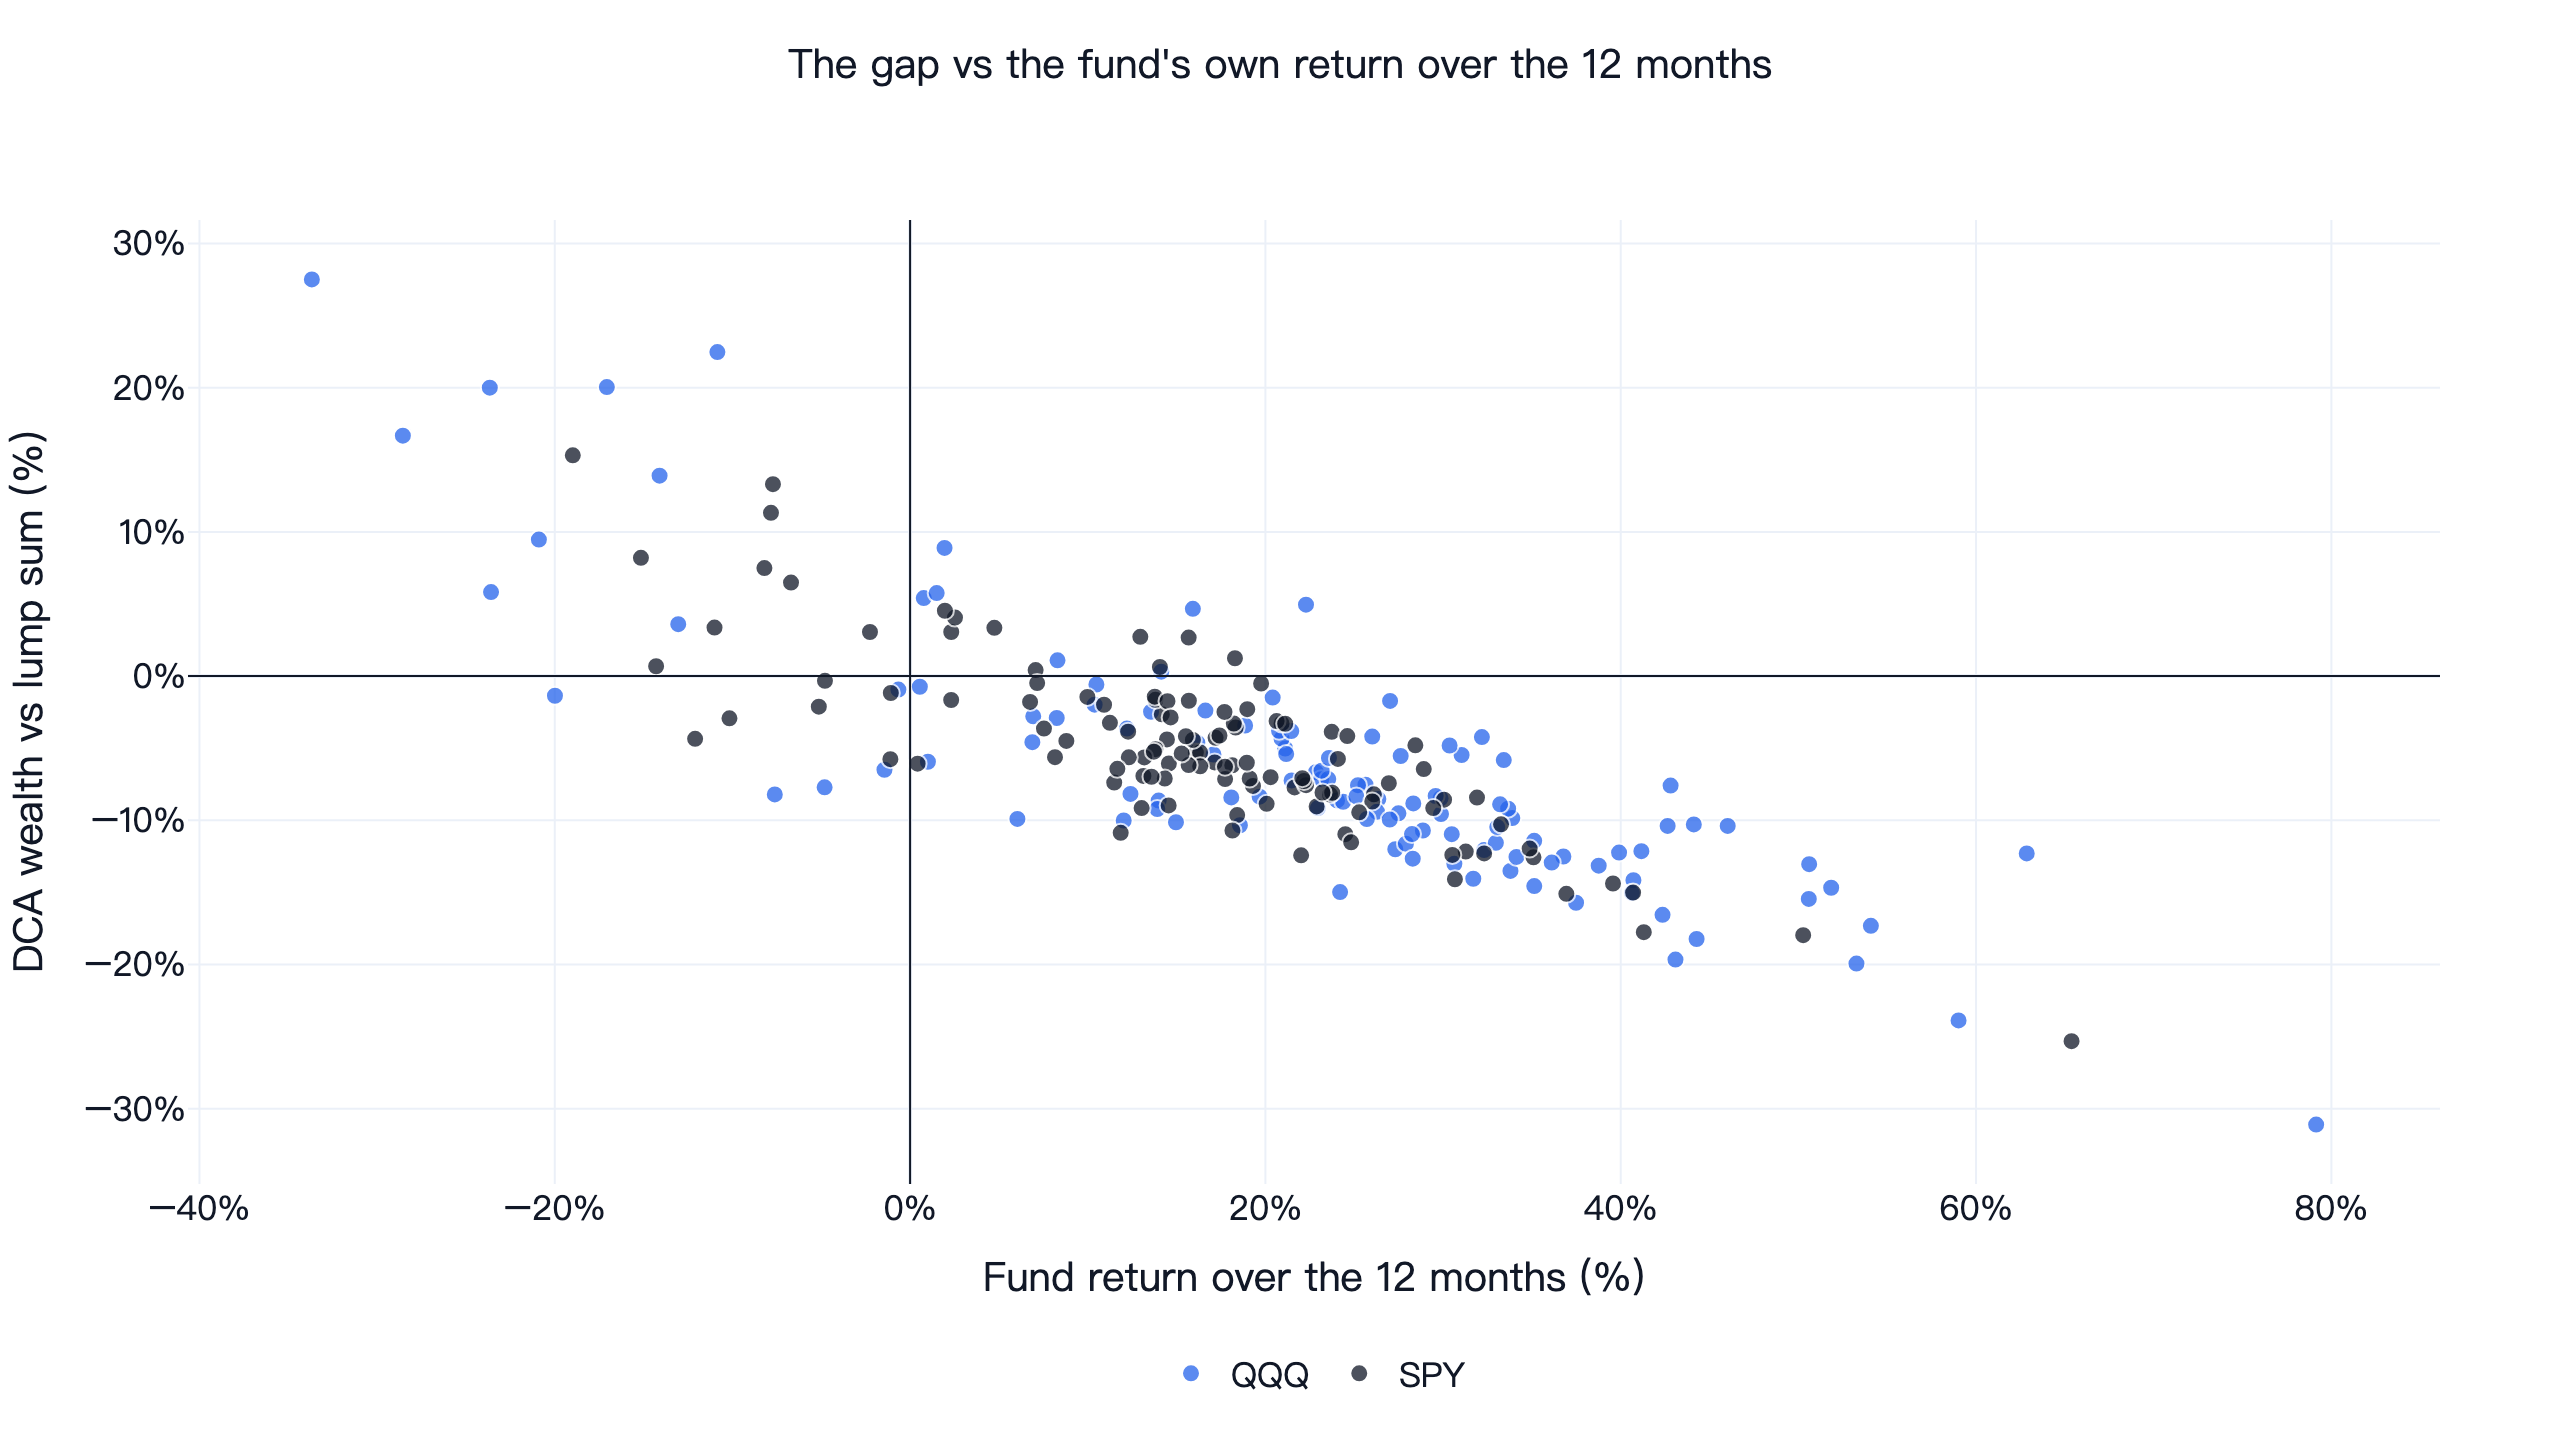
The dots form a line sloping down to the right; the correlation is -0.83 for SPY and -0.84 for QQQ. When the fund rose over the 12 months, DCA usually lost. When it fell, DCA usually won:
| SPY | QQQ | |
|---|---|---|
| Starts where the fund rose over 12 months | 104 (87.4%) | 105 (88.2%) |
| DCA ahead when the fund rose | 8.7% | 6.7% |
| Starts where the fund fell | 15 | 14 |
| DCA ahead when the fund fell | 60.0% | 64.3% |
DCA still won a few rising windows: those fell first and recovered later, so DCA bought more near the low. And it lost some falling windows: those rose first and fell later, so DCA's later purchases were made at higher prices.
So the lump sum wins mostly because stocks rise in most 12-month windows. Nearly nine in ten starts here were up a year later, and DCA keeps part of the money out of the market while that happens.
DCA's wins cluster in two stretches: August to October 2018, and August 2021 to August 2022, plus a handful of scattered months. Here are QQQ's best and worst starts for DCA:
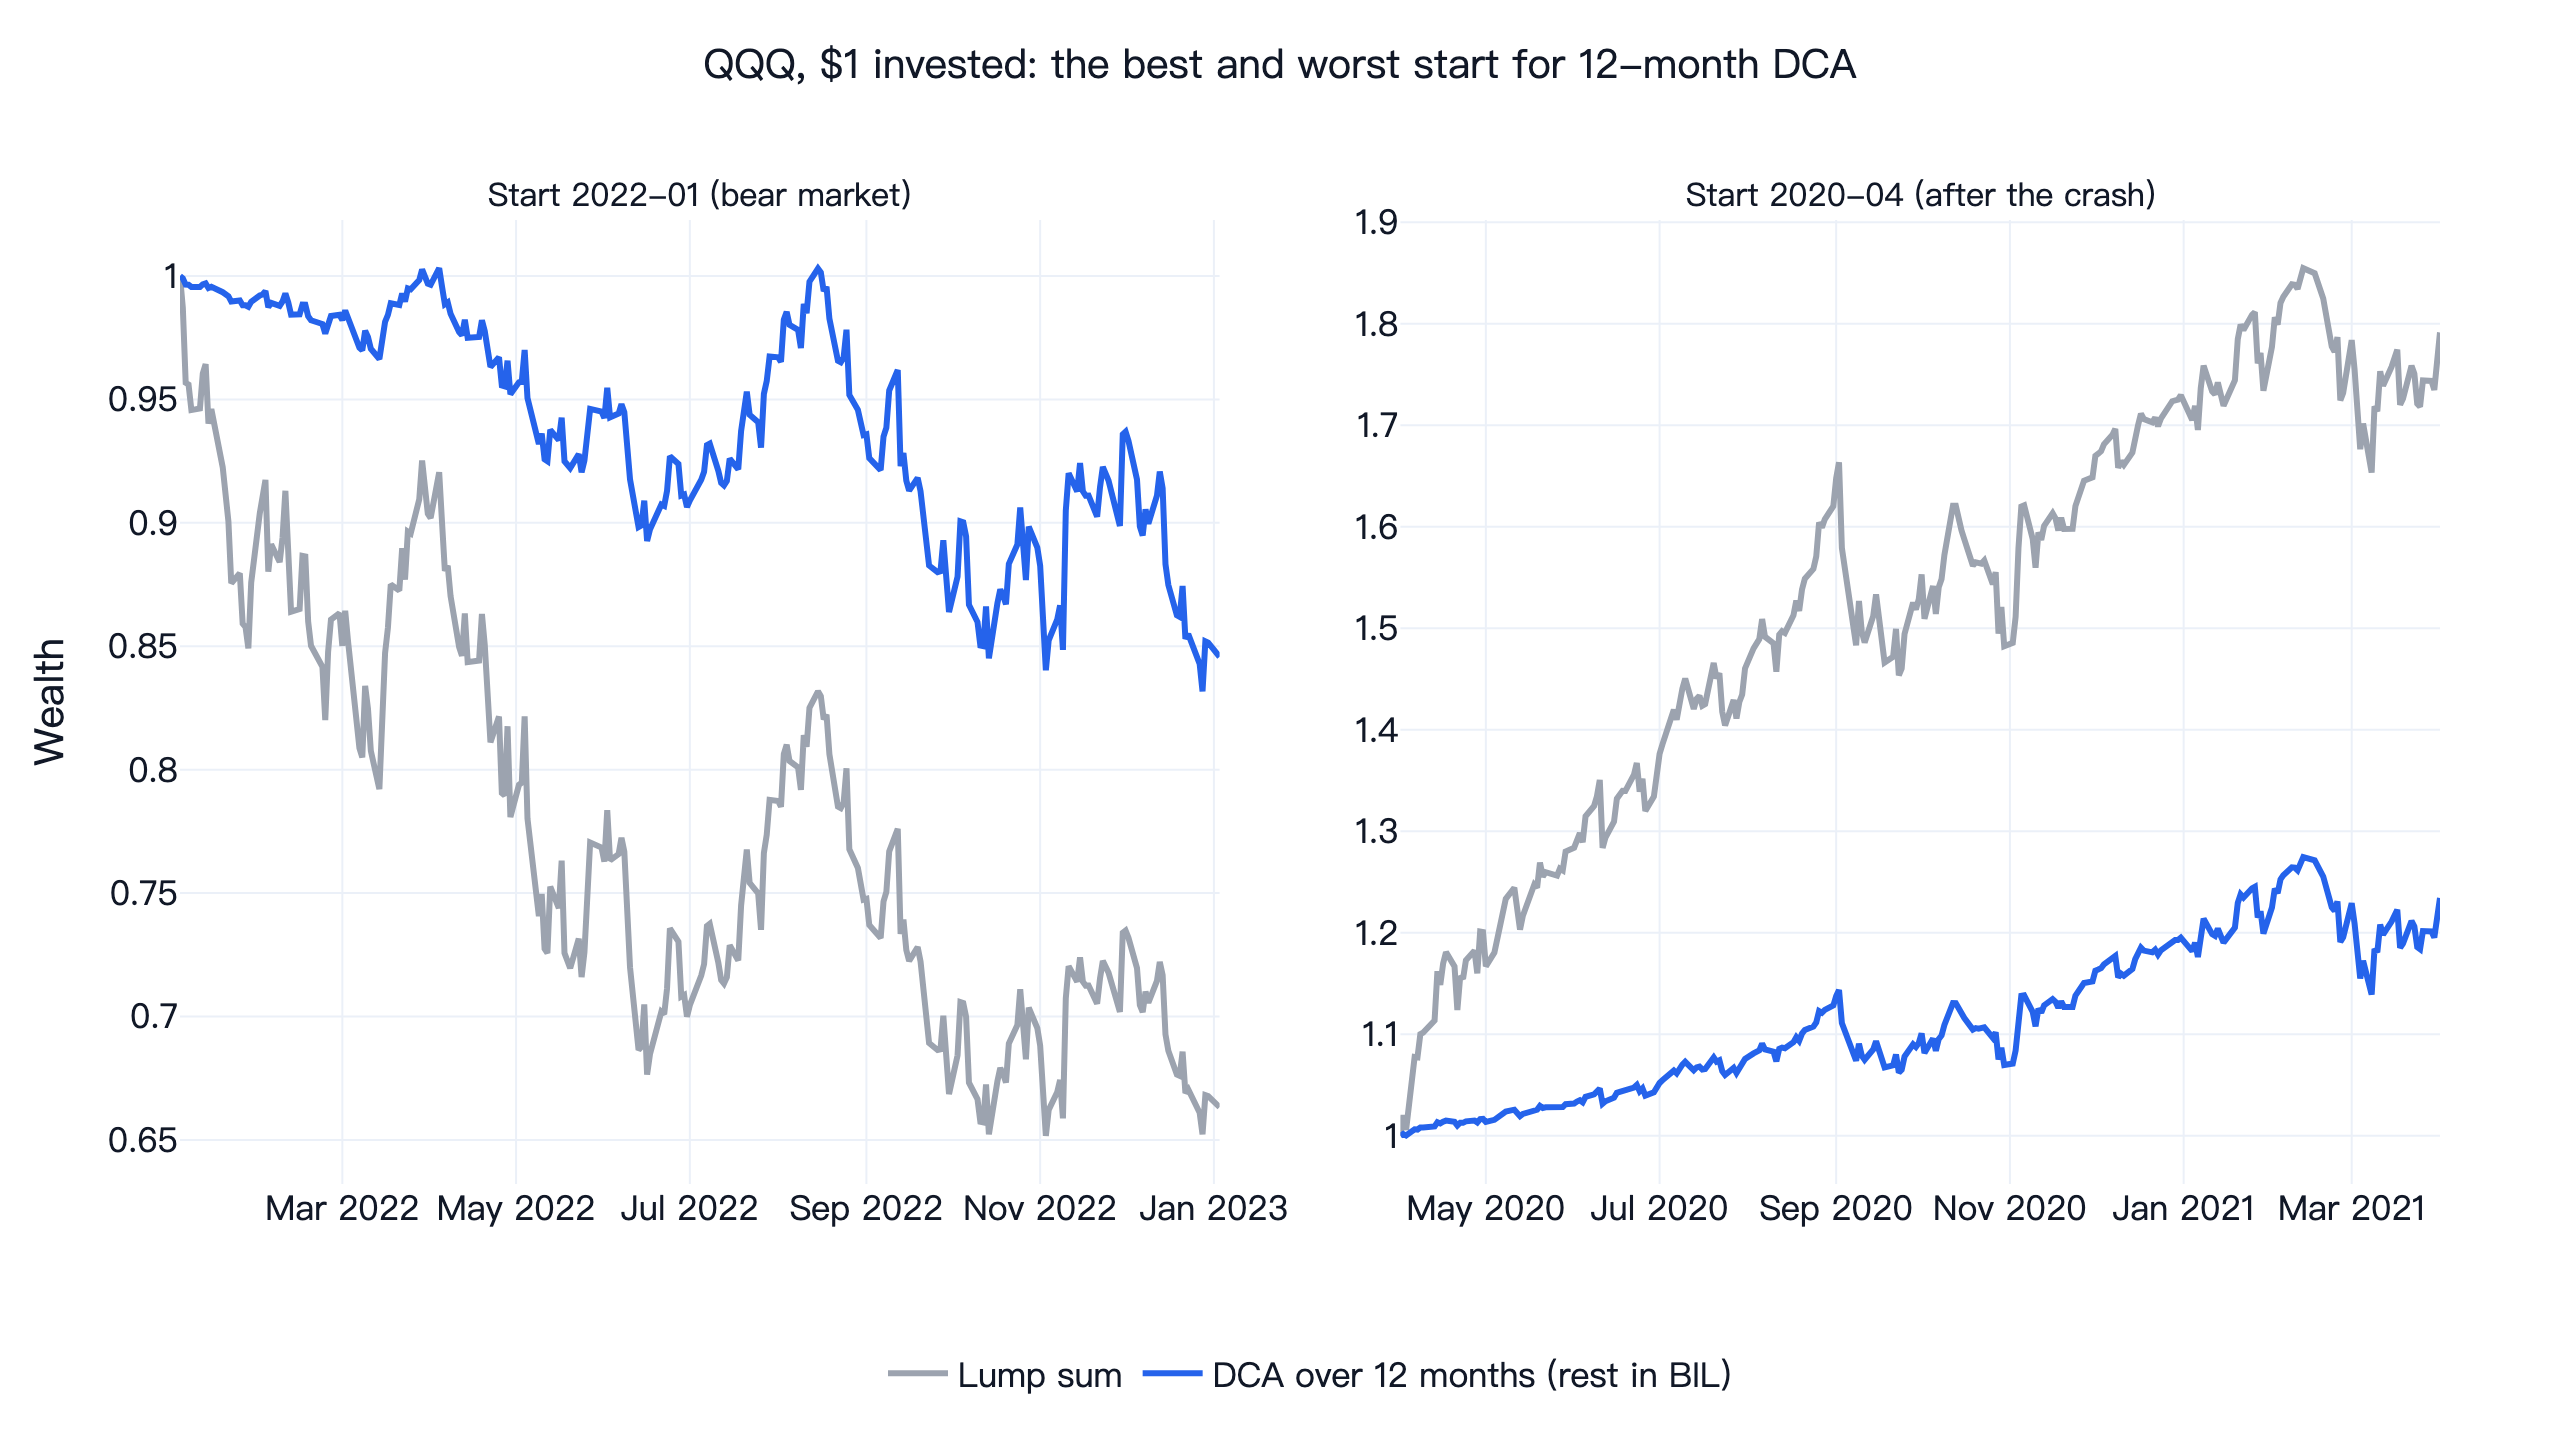
From January 2022, 0.66 a year later and the DCA plan 1.79 and DCA to $1.23.
What DCA buys: a smaller drawdown
DCA's benefit shows up in the drawdown. Its worst drop during the 12 months was shallower on average, and much shallower in the starts where the lump sum fell furthest:
| Start with the lump sum's deepest drawdown | Lump-sum max drawdown | DCA max drawdown |
|---|---|---|
| SPY, from 2020-02 | -33.7% | -6.6% |
| QQQ, from 2021-12 | -35.1% | -19.0% |
If you need the money within a year, or a 30% loss right after buying would make you sell, that difference is real. The cost is return: QQQ's average 12-month return fell from 22.3% to 12.9%.
Adjusting for risk does not rescue DCA. On the Sharpe ratio over each 12-month window, measured above BIL's return, DCA scored higher in only 40.3% of SPY starts and 37.0% of QQQ starts. Without subtracting the T-bill return, DCA scores higher in 51.3% of SPY starts, but that is an artifact: the money in BIL earns interest with almost no volatility, which lifts a Sharpe ratio that ignores the risk-free rate.
We also compared DCA with something simpler: holding 54.2% in the fund and the rest in BIL for the whole year, reset to that mix at the start of each month. 54.2% (13/24) is the average share of the money DCA has in the fund over its 12 months. DCA beat that fixed mix in 49.6% of SPY starts and 50.4% of QQQ starts, a coin flip. DCA's result is roughly the result of owning half as much stock for a year; spreading out the purchase dates added nothing on top.
The pre-registered checks
We wrote down the pass conditions before running anything and did not change them afterwards; they are also listed at the top of research.py. For DCA to count as better, the first row had to reach at least 7 of 9 and every other row had to exceed 50%:
| Check (original setting: 12 months, monthly) | SPY | QQQ |
|---|---|---|
| Settings out of 9 where DCA was ahead in more than half the starts | 0 / 9 | 0 / 9 |
| DCA ahead, first half of starts (2016-01 to 2020-11, 59 starts) | 10.2% | 5.1% |
| DCA ahead, second half (2020-12 to 2025-11, 60 starts) | 20.0% | 21.7% |
| DCA ahead with 0.1% per side on every trade, BIL included | 15.1% | 13.4% |
| DCA's Sharpe above T-bills higher than the lump sum's | 40.3% | 37.0% |
| DCA ahead of the fixed 54.2% mix | 49.6% | 50.4% |
| DCA ahead without 2022, its best start year | 10.3% | 8.4% |
Only QQQ's comparison with the fixed 54.2% mix, at 50.4%, cleared 50%; every other check failed, and all of them had to pass, so DCA is not the better way in for either fund. The lump sum passed its version of the first three: ahead in more than half the starts in all 9 settings, in both halves (SPY 89.8% and 80.0%, QQQ 94.9% and 78.3%) and after costs. Under the conditions we set in advance, the lump sum is the better way into both funds.
How this compares with Vanguard's research
None of this is new. Constantinides (1979) showed in theory that dollar cost averaging is not an optimal investment policy, and Rozeff (1994) found the same with historical U.S. stock returns. Shtekhman, Tasopoulos and Wimmer (2012) at Vanguard found a lump sum beat DCA about two-thirds of the time in U.S., U.K. and Australian history.
Finlay and Zorn (2023), also at Vanguard, used the Russell 3000 from 1979 to 2022: a lump sum beat a 3-month split 66.4% of the time and a 6-month split 73.7% of the time, with no interest on the uninvested cash. Their main analysis, on the MSCI World from 1976 to 2022, added T-bill interest to the waiting cash, and an all-stock lump sum still beat the 3-month split 65% of the time.
Our 6-month monthly result, lump sum ahead in 75.2% of SPY starts and 76.8% of QQQ starts, is close to Vanguard's 73.7%, even though our DCA earns T-bill interest on the waiting cash, which helps it. Over 12 months the lump sum wins more often (84.9% for SPY) because more money waits longer, and Vanguard also notes that a longer DCA period costs more. Our window starts in 2016, a decade of high U.S. stock returns, which is likely one reason our lump-sum win rates sit above Vanguard's long-history numbers.
Why people still choose DCA
Statman (1995) explains DCA's appeal with behavioral finance: if you invest everything and the market drops the next week, the regret is sharp, and DCA spreads that responsibility over many dates. If that regret would push someone to sell after a fall, it can cost more than DCA gives up: a lump sum in SPY from February 2020 was down as much as 33.7% within the year, while 12-month DCA averaged 5.0% behind.
What the numbers support:
- Lump sum: the highest chance of ending with more money. It fits investors who could watch a 30% drop right after buying without selling.
- Short DCA: if a lump sum would keep you awake in a downturn, a short plan is the cheaper compromise. Six months cost 2.3% on SPY and 3.1% on QQQ on average here, and Vanguard suggests about three months. The cost roughly doubles at 12 months and triples at 18.
- A lower stock allocation: if what you really want is less volatility, holding less stock is the direct way. DCA's effect matched temporarily owning less stock, and once DCA is done your volatility is back to 100% stock.
Investing from a paycheck is a different question
Most people who "dollar cost average" invest part of each paycheck. That money arrives monthly, so there is no lump sum to compare with: investing each paycheck when it arrives already is investing everything you have. This article is about the other case, when the money is already in hand.
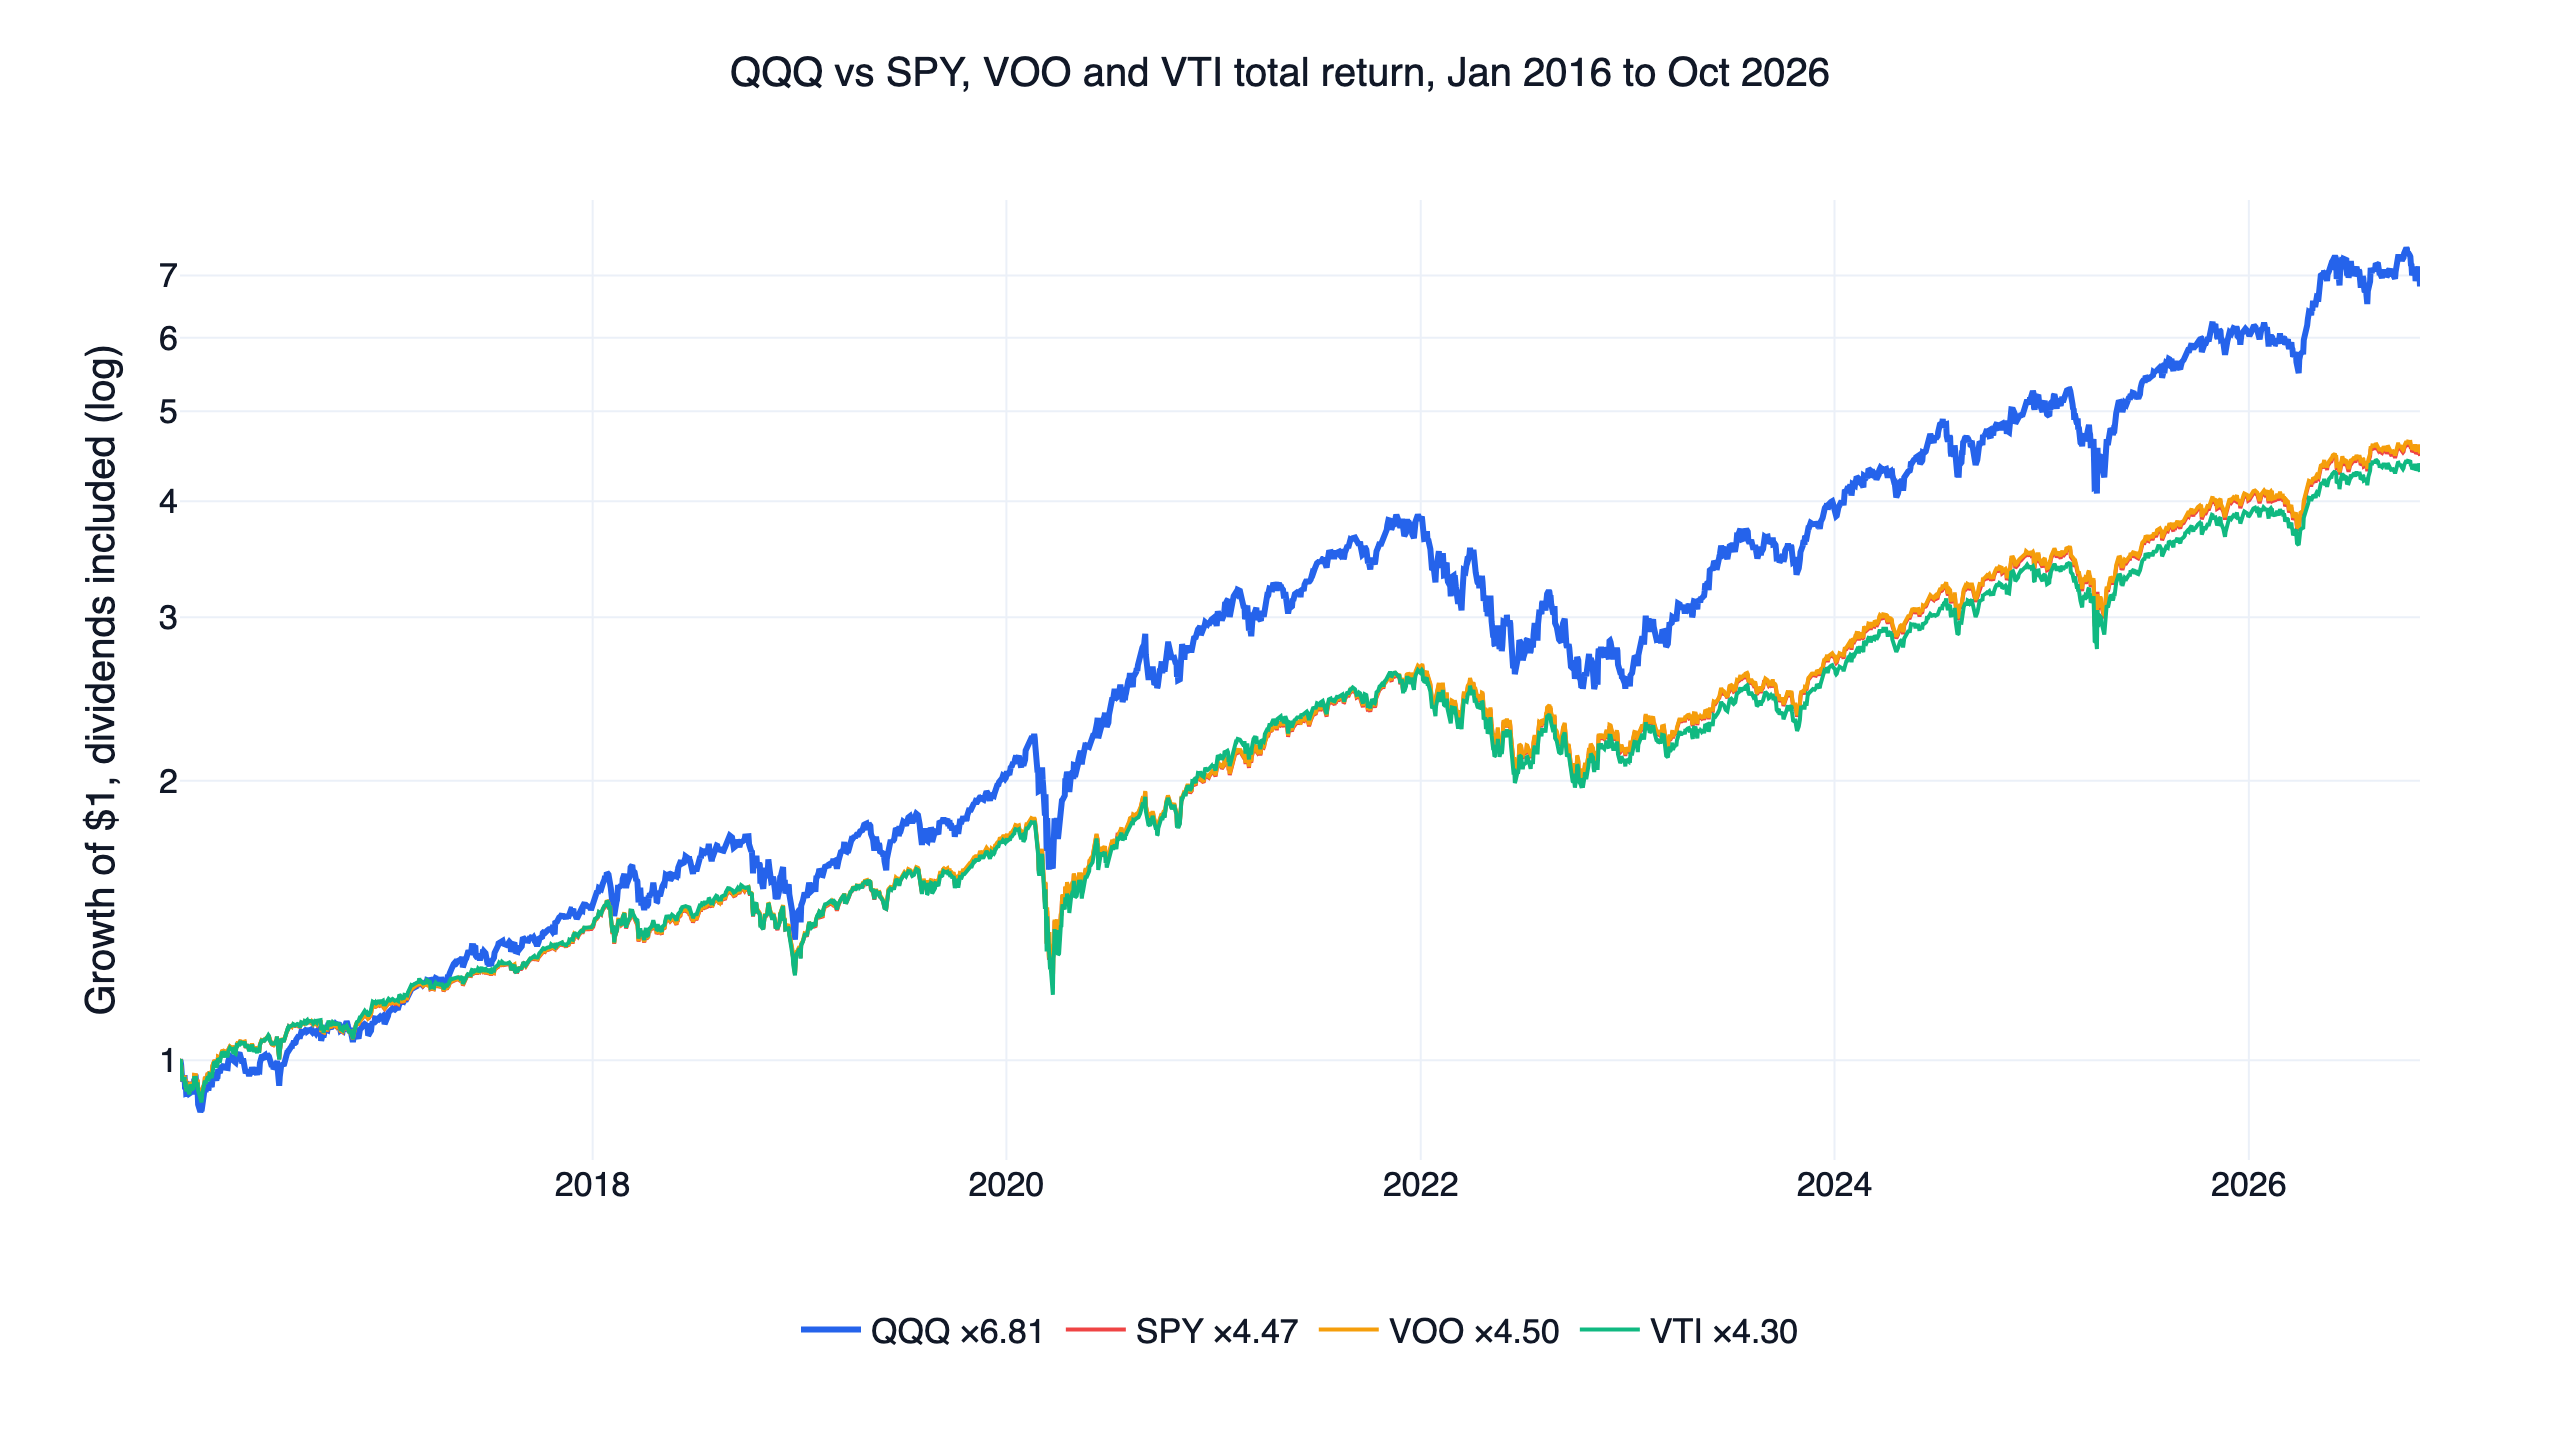
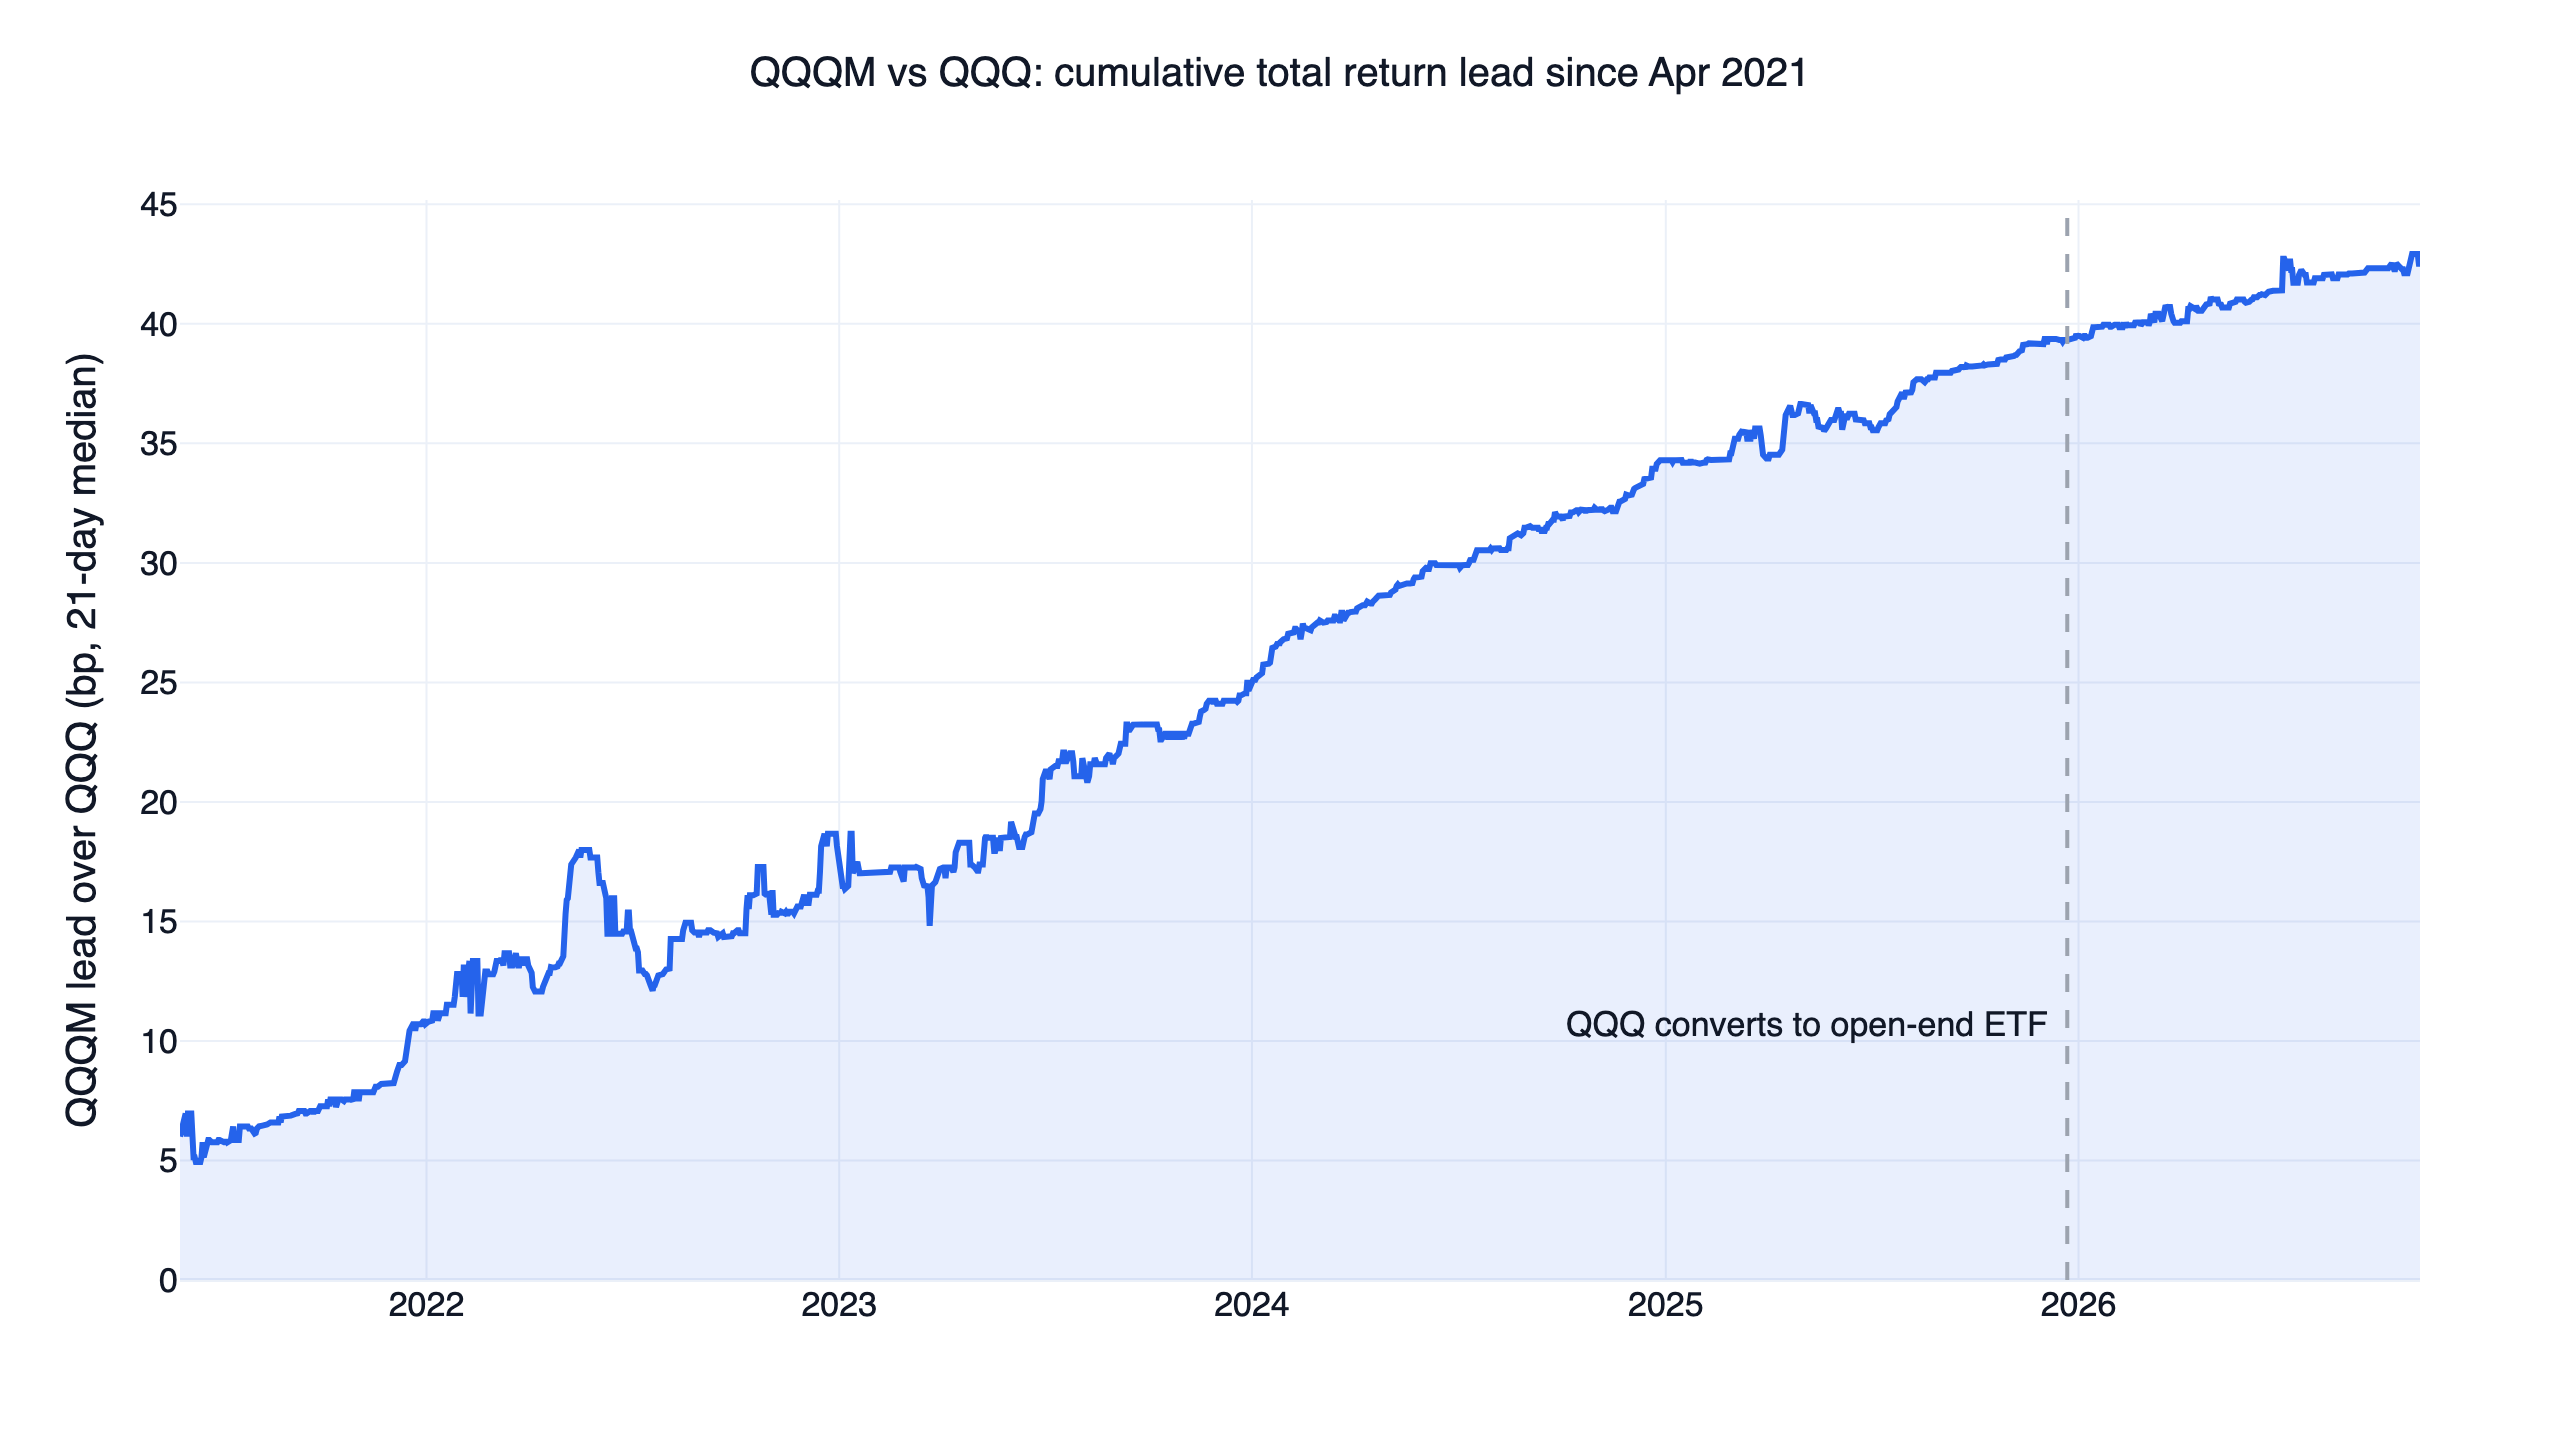
To choose the fund itself, see QQQ vs SPY, VOO and VTI over ten years, and for the same Nasdaq-100 index at a lower fee, QQQM vs QQQ. For buying after a crash, see the VIX crash-buying backtest; for controlling drawdowns with allocation, the lazy portfolio backtest and the risk parity backtest; and for cutting exposure when volatility rises, QQQ volatility targeting.
The code
This recomputes the gap for every start with QQQ and BIL:
Show Code
import finlab
from finlab import data

finlab.login()  # finlab walks you through logging in
data.set_market("us")
data.truncate_end = "2026-11-05"

prices = data.get("us_fund_price:adj_close")[["QQQ", "BIL"]].dropna()
days = prices.index
month_starts = days.to_series().groupby(days.to_period("M")).min()


def dca_vs_lump_sum(start, months=12):
    """One sum: all in at the start, or monthly purchases over `months`, the rest in BIL."""
    window = month_starts.loc[start:].iloc[:months + 1]
    buy_days, end = window.iloc[:months], window.iloc[months]
    qqq, bil = prices["QQQ"], prices["BIL"]

    # Lump sum: buy everything at the first close, hold to the comparison date
    lump_sum = qqq[end] / qqq[buy_days.iloc[0]]

    # DCA: each purchase uses the remaining balance / purchases left
    shares, cash, last = 0.0, 1.0, buy_days.iloc[0]
    for i, day in enumerate(buy_days):
        cash *= bil[day] / bil[last]  # money waiting in BIL still earns interest
        spend = cash / (months - i)
        cash -= spend
        shares += spend / qqq[day]
        last = day
    averaged = shares * qqq[end]

    return averaged / lump_sum - 1


starts = month_starts.index[:-12]
gaps = [dca_vs_lump_sum(period) for period in starts]
dca_wins = sum(gap > 0 for gap in gaps)

print(len(gaps), "starts, DCA ahead in", dca_wins)
print("average gap", round(sum(gaps) / len(gaps), 4))
print("from 2022-01", round(dca_vs_lump_sum("2022-01"), 4))
With data through 2026-11-05 it prints 119 starts, DCA ahead in 16, an average gap of -0.0656 and 0.2751 from 2022-01. Replace "QQQ" with "SPY" to rerun SPY. The full research.py adds the nine settings, costs, drawdowns, Sharpe ratios and the fixed-mix comparison.
Install the FinLab skill for your AI agent
You do not need to write the code yourself. Install the FinLab skill in Claude Code, Codex or Gemini CLI with one command:
Show Code
npx skills add koreal6803/finlab-ai --skill finlab -g -yThen ask your agent in plain language, for example "run the same DCA test on VTI over 6 months" or "what if the uninvested cash earned nothing?". The AI agent setup page walks through each tool, the AI-assisted setup connects your FinLab account, and the same research runs in the browser at studio.finlab.finance. For the basics, see the backtesting guide and the quant trading overview; more U.S. research is collected in the U.S. quant strategy overview.
Backtest method and limits
| Item | Approach |
|---|---|
| Data | us_fund_price:adj_close (dividends reinvested) for SPY, QQQ and BIL, market-holiday rows removed; data through 2026-11-05 |
| Period | Starts from 2016-01 to 2025-11, about ten years and mostly a bull market |
| Starts | First trading day of each month; neighbouring starts overlap, so the shares are not independent samples |
| Fills | All trades at the close; no slippage modelled |
| Costs | Zero by default for U.S. funds; stress test at 0.1% per side on every trade, including buying and selling BIL |
| Uninvested cash | BIL, whose expense ratio is already in its price |
| Taxes | No dividend, capital-gains or withholding tax; total-return prices assume dividends are reinvested in full |
| Look-ahead | Purchase dates depend only on the calendar, never on prices |
| In or out of sample | Entirely in sample. The only parameters are how many months and how often, and all nine settings are shown |
What this result does and does not say
- From 2016 to 2026, investing a sum in SPY or QQQ at once ended with more money than a 12-month DCA plan in 85% to 87% of start months, and DCA ended 5% to 7% behind on average; on risk-adjusted terms it was no better.
- The longer DCA takes, the more it costs.
- These results describe this period. If the market falls before a DCA plan finishes buying and does not recover quickly, DCA usually wins, and there is no reliable way to know that in advance.
FAQ
Is lump sum or dollar cost averaging better?
With money already in hand, the lump sum has won more often historically. Here, against a 12-month DCA plan, it ended ahead in 84.9% of SPY starts and 86.6% of QQQ starts; Vanguard found about two-thirds over much longer U.S. history. DCA's benefit is a smaller loss while it is buying.
How long should a DCA plan be?
Longer costs more. Over 6 months with monthly purchases, DCA averaged 2.3% behind on SPY and 3.1% on QQQ; over 18 months, 7.5% and 9.8%. Vanguard's suggestion for investors who do want to spread a purchase is a short period such as three months.
Is it better to dollar cost average weekly or monthly?
The difference is small. Over 12 months into QQQ, buying every 5 trading days averaged 7.1% behind the lump sum and monthly 6.6%. Buying weekly does not help; it only means more trades.
Why does the lump sum usually win?
Because stocks rise in most periods. Nearly nine in ten 12-month windows here ended higher, and DCA keeps part of the money out of the market during that rise. DCA mostly won only when the fund fell over the 12 months.
Should I still invest a lump sum if the market just dropped?
A recent drop does not tell you whether the market will keep falling. Investors who started a DCA plan in April 2020, right after the COVID crash, ended 25% to 31% behind the lump sum a year later. This test picked purchase dates by calendar only and did not test rules that time purchases by price.
Does it matter that the cash earns interest?
Yes, a little, and we included it: the waiting money sits in BIL and earns T-bill interest, which is reinvested with each purchase. Vanguard ran its comparison with and without cash interest; with T-bill interest, an all-stock lump sum still beat a 3-month split 65% of the time.
Can I rerun this myself?
Yes. Install FinLab through the AI-assisted setup and run research.py, or ask the same question in FinLab Studio with another fund or period.
Reproduce it yourself
- research.py: every start, all nine settings, both halves, costs, drawdowns, Sharpe ratios and the fixed-mix comparison.
- data.csv: the DCA gap for every start month and setting, plus the drawdowns during each 12-month window. The files also include Taiwan's 0050 ETF, covered in the Chinese version of this study.
- metrics.json: every statistic quoted here.
Last updated: 2026-11 | Backtest window: 2016-01 to 2026-11 | Benchmark: lump sum in the same fund, total return | Author: FinLab Quant Research (reviewed by a quantitative researcher)
Past performance does not represent future results, and every result here is an in-sample backtest. The funds named are used to describe research results, not as recommendations. Consult a professional about your own taxes. This content is for education only and does not constitute investment advice.
FinLab AI
Want to build your own strategy?
Describe your stock-picking ideas in natural language. AI automatically validates, backtests, and gives you answers
Start Free