Run this strategy
Copy the prompt to reproduce the evidence above with the article’s data, assumptions, and risk checks.
Tell your AI:
Set up FinLab and reproduce the momentum ETF comparison. Please read: https://finlab.finance/en/setup?relatedUrl=/en/blog/momentum-etf-spmo-mtum-vs-qqq
SPMO earned 18.9% a year against QQQ's 20.0% from September 2016 to October 2026, with a slightly higher daily Sharpe, 0.93 against 0.92. That small full-period advantage did not hold in both halves. MTUM returned 15.2% with a 0.76 Sharpe. Rotating among six momentum ETFs, adding a QQQ trend filter, and switching SPMO to Treasury bills were three separate tests: none passed all three robustness checks. This is research on rules that failed the stated tests, rather than a recommended trading strategy.
A momentum ETF buys stocks that rank strongly on a momentum measure, but the label covers different stock universes, scoring rules and rebalance schedules. A fund can change its own holdings while an investor simply holds its shares. Our rotation rules add a second decision above that internal process: which ETF to own, and when. The distinction matters when comparing an ETF with QQQ or interpreting a backtest of “momentum.”
Six momentum ETFs on the same dates
| ETF | Total return | CAGR | Daily Sharpe | Max drawdown | First / second half Sharpe |
|---|---|---|---|---|---|
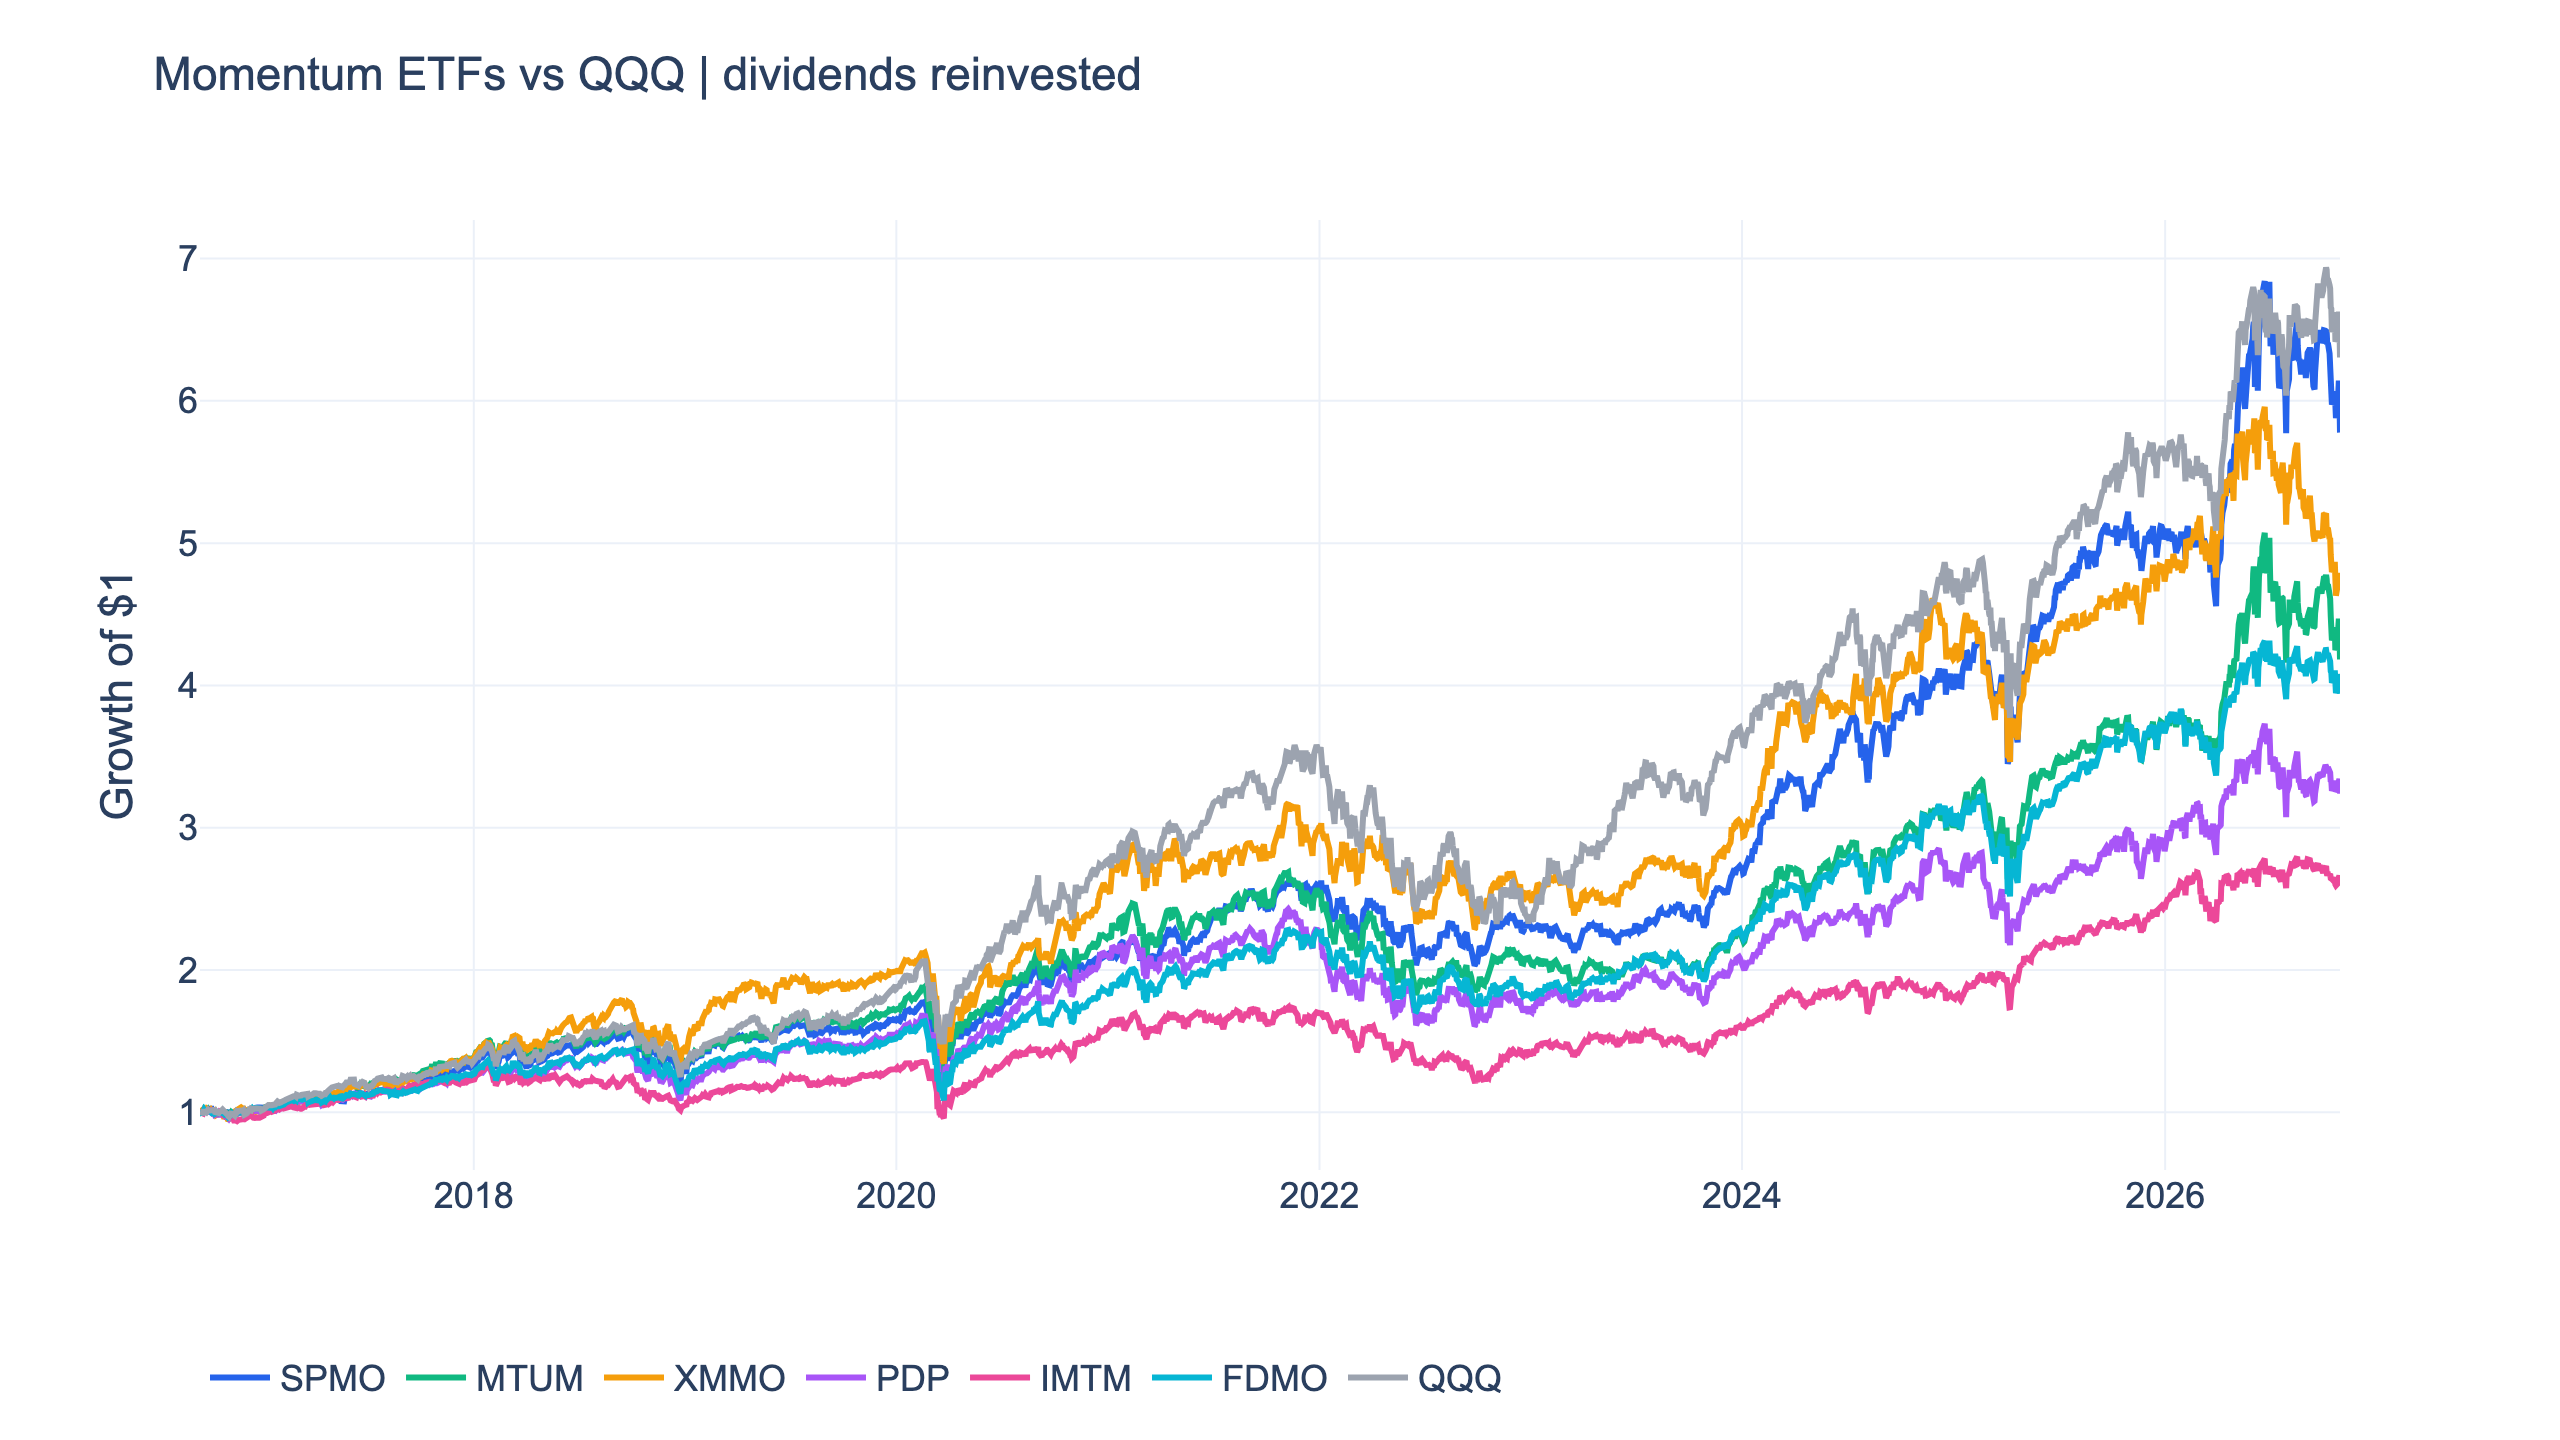
| SPMO | 477.7% | 18.9% | 0.93 | -30.9% | 0.94 / 0.92 |
| MTUM | 318.3% | 15.2% | 0.76 | -34.1% | 0.94 / 0.58 |
| XMMO | 367.4% | 16.5% | 0.79 | -36.7% | 1.00 / 0.58 |
| PDP | 223.9% | 12.3% | 0.64 | -34.7% | 0.82 / 0.47 |
| IMTM | 160.9% | 9.9% | 0.63 | -30.6% | 0.63 / 0.63 |
| FDMO | 294.1% | 14.5% | 0.79 | -33.9% | 0.83 / 0.75 |
| QQQ | 530.5% | 20.0% | 0.92 | -35.1% | 1.15 / 0.70 |
All rows use 2016-09-15 to 2026-10-30, starting with FDMO's first available price. Returns reinvest distributions through FinLab's adjusted prices. SPMO had the strongest full-window Sharpe among these six funds, but QQQ had the highest return. XMMO's 16.5% CAGR came with a deeper drawdown than QQQ. IMTM had a shallower drawdown and the lowest annual return in the group; its international exposure makes it a different geographical allocation, not a direct US replacement.
The common window avoids comparing a new fund's short record with another fund's entire life. It also means that these figures are not since-inception performance for SPMO or MTUM. FinLab prices start in January 2016 for five of these funds and September 2016 for FDMO. We do not extrapolate any pre-launch history or substitute an index for a fund. The downloadable metrics also include each fund's available-history figures with its matching QQQ dates.
SPMO vs MTUM: the rules differ
| Fund | Main distinction | Scheduled review |
|---|---|---|
| SPMO | S&P 500 momentum selection | Semiannual, March and September |
| MTUM | MSCI USA Momentum SR Variant | Quarterly |
| XMMO | S&P MidCap 400 momentum today | Semiannual; earlier history used another strategy |
| PDP | Dorsey Wright relative-strength selection | Quarterly |
| IMTM | Developed markets outside the US | MSCI momentum methodology |
| FDMO | Fidelity's proprietary US momentum index | Quarterly in the cited methodology |
Invesco's momentum explanation describes SPMO's twice-yearly schedule. MTUM's MSCI SR Variant methodology already specified quarterly reviews in 2024. Calling MTUM semiannual would misdescribe that index. PDP's issuer factsheet describes quarterly relative-strength selection, while Fidelity's methodology documents its own schedule.
XMMO needs a further qualification. Its June 2019 SEC supplement records a change from Russell Midcap Pure Growth to S&P MidCap 400 Momentum. We retain the actual fund return history, as preregistered, including that earlier mandate. The long record therefore tests owning those fund shares across an index change; it cannot establish that today's mid-cap momentum methodology worked throughout the whole window. We do not use the later methodology to manufacture earlier holdings.
Rebalance frequency alone cannot explain the performance gap. The candidate stocks, position limits and weighting rules differ too. More frequent review may react faster to leadership changes and may also trade more. This experiment measures the funds' combined realised results, without trying to attribute a precise amount of return to any single index feature.
Three designs fixed before seeing results
A, relative-strength rotation: every month, hold the top k of the six funds by their trailing L-month adjusted-price return, equal weight. The original is L=12 and k=2; neighbours are L=9/12/15 and k=1/2/3.
B, SPMO trend: hold SPMO above its L-day simple moving average, otherwise BIL Treasury bills. The original is 200 days, checked monthly; neighbours are 150/200/250 days and weekly/monthly/quarterly checks. It must also beat SPMO held alone, so a better underlying fund cannot be mistaken for a useful switch.
C, rotation with a trend gate: use A's top two funds only while QQQ is above its D-day average; otherwise hold BIL. The original is L=12 and D=200, with L=9/12/15 and D=150/200/250. It must improve on A without the gate, on the same dates. Months mean 21 trading days throughout, matching the earlier factor-rotation experiment.
| Design | Daily Sharpe | Same-window QQQ | CAGR | Max drawdown | Winning settings | Sharpe after 0.1% per side |
|---|---|---|---|---|---|---|
| A | 0.66 | 0.86 | 13.1% | -34.4% | 0/9 | 0.64 |
| B | 1.01 | 0.93 | 16.1% | -15.6% | 3/9 | 0.99 |
| C | 0.58 | 0.86 | 9.8% | -34.4% | 0/9 | 0.55 |
A and C start on 2017-12-29, the first month end with the full 15-month history for all six funds. B starts on 2016-12-30, after 250 SPMO observations. Signals use information known at a close and fill at the following close. Each QQQ comparison uses the corresponding strategy dates, including the initial cash observation; the different QQQ values in the table are intentional.
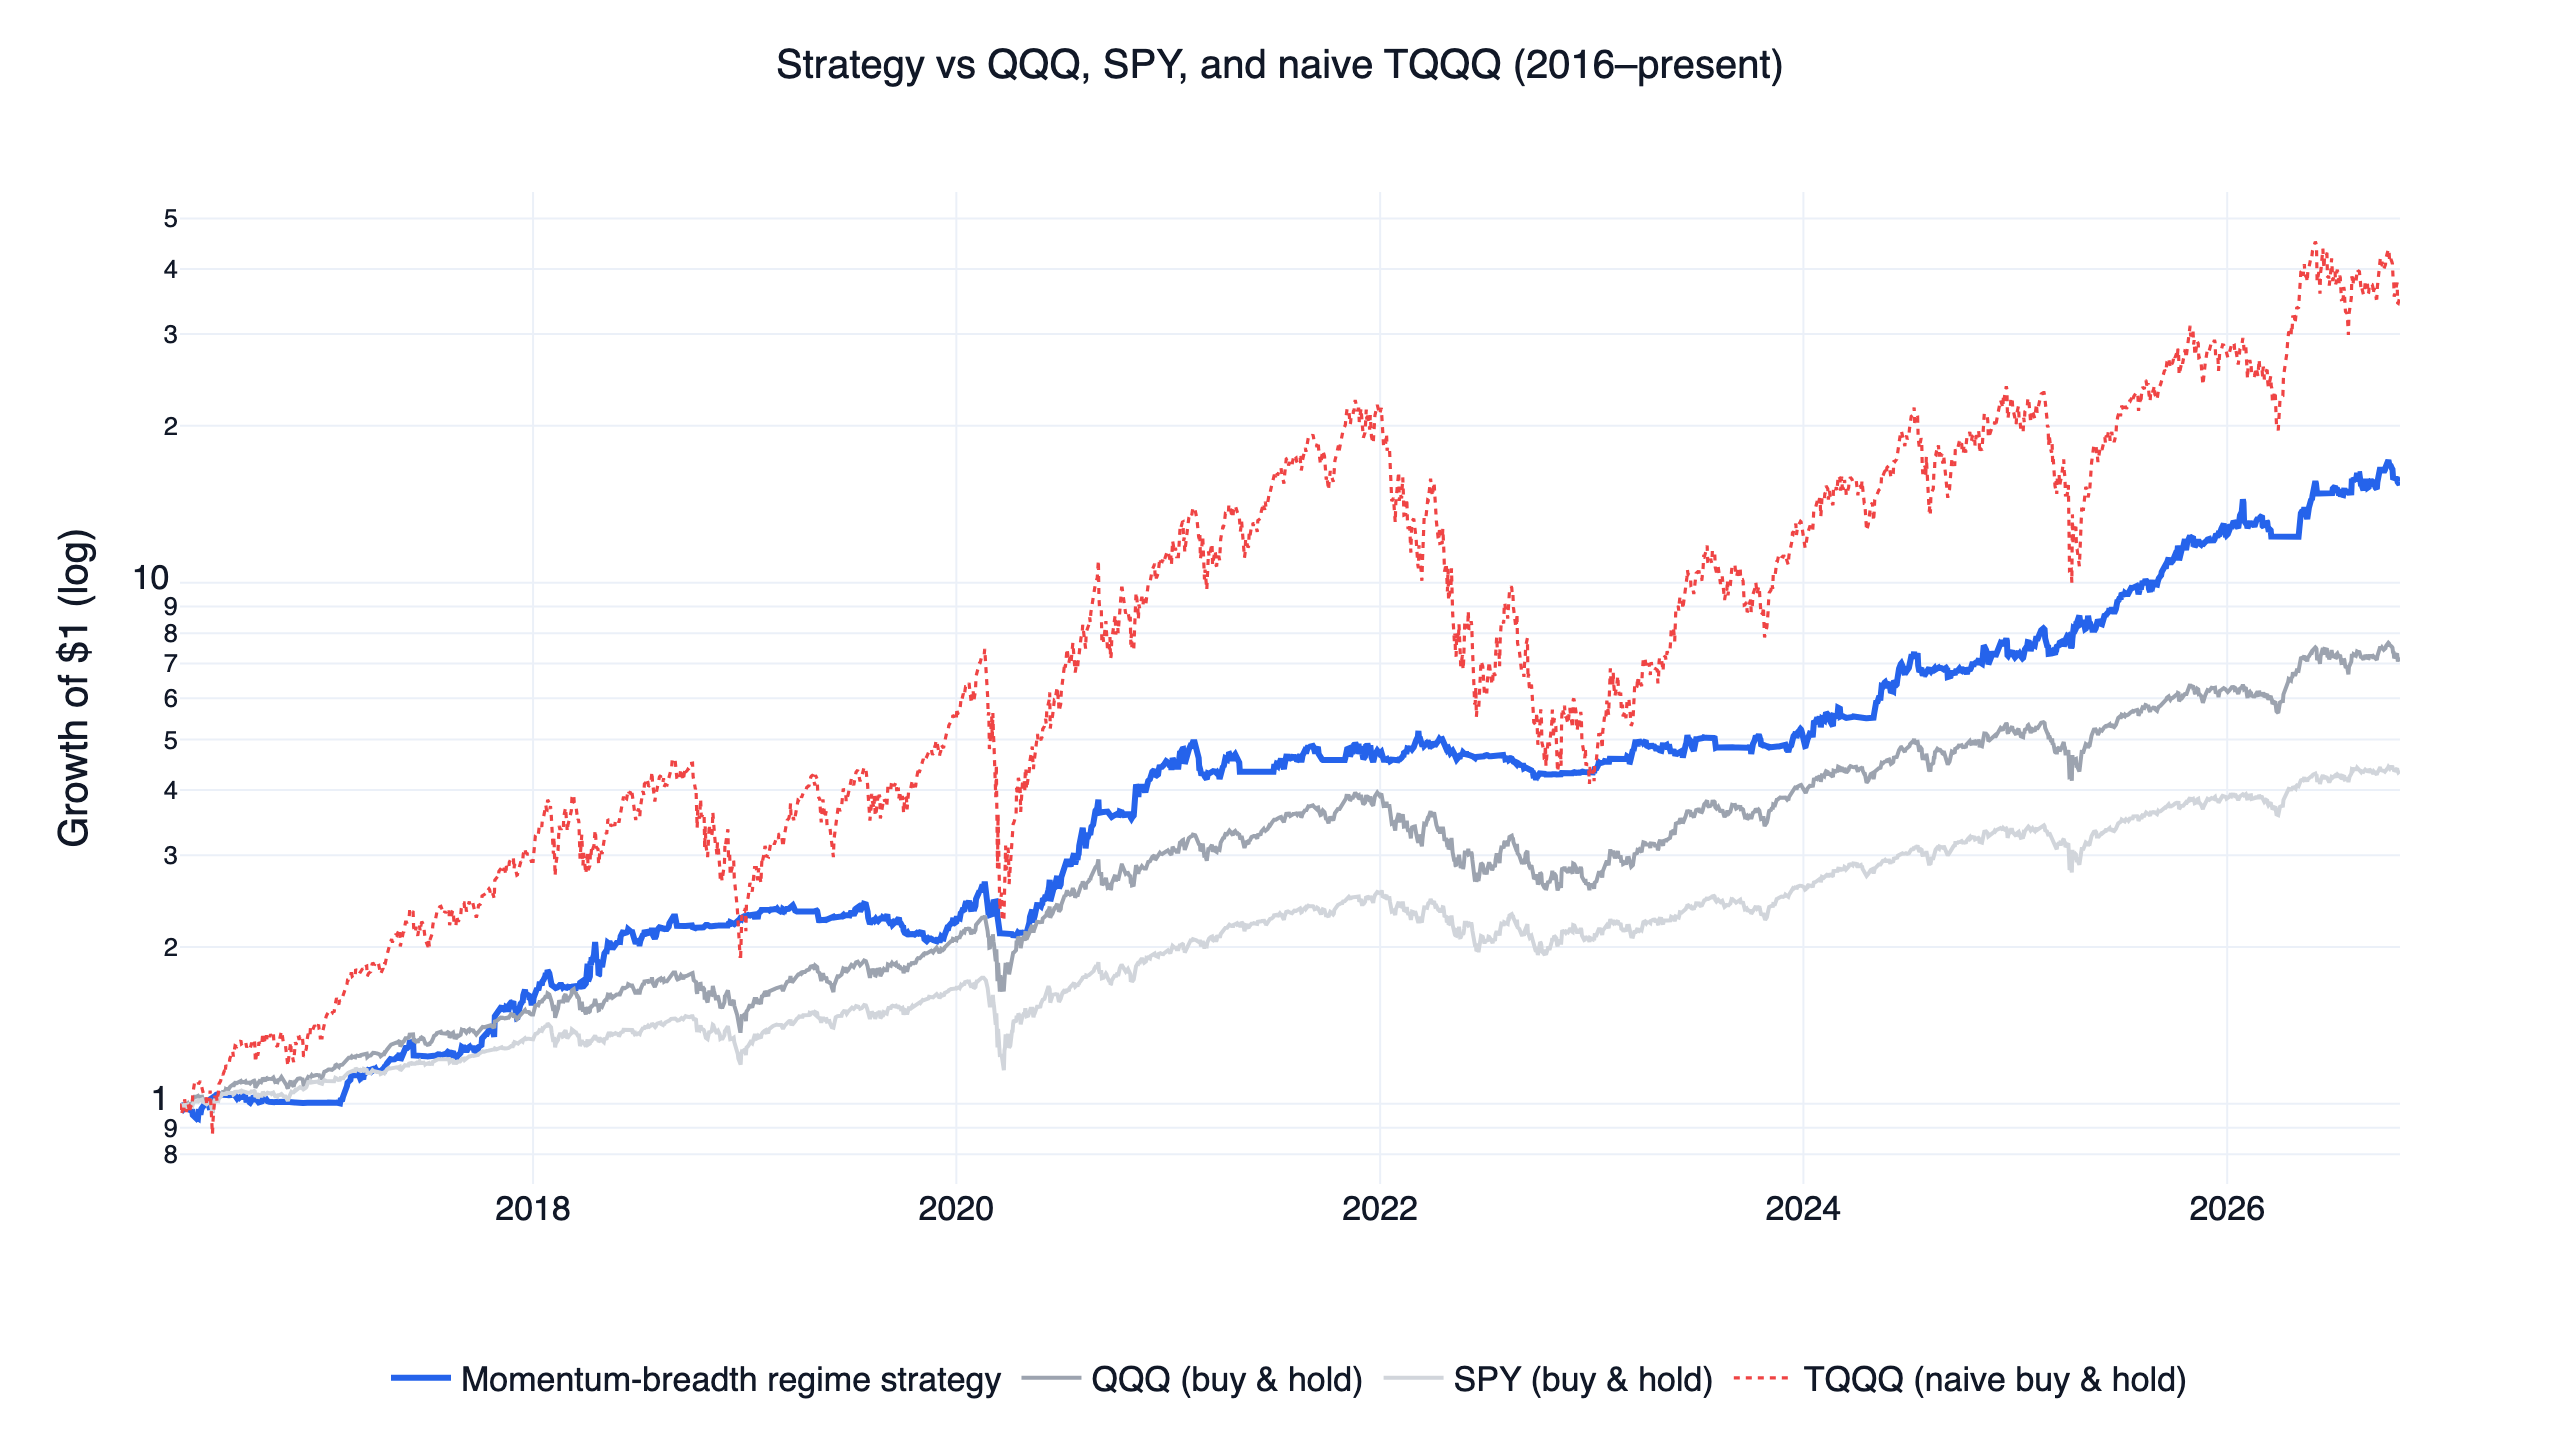
The embedded report is A at its original setting, which returned 13.1% a year and had a -34.4% maximum drawdown. It is included for inspection of an unsuccessful rule, not presented as a validated allocation. The fixed-weight report below holds the same assets at A's average weights and returned 15.0% with a 0.76 Sharpe, above A's 0.66. Those average weights are calculated afterwards for attribution; they are not an independently investable forecast.
Robustness: the higher full-period Sharpe was not enough
To pass, at least seven of nine settings had to beat same-window QQQ on daily Sharpe, the original had to win in both halves, and it had to keep winning after 0.1% per buy and per sell. US default commission and tax in sim are zero; the separate stress run therefore matters. BIL-adjusted Sharpe and fixed-average-weight controls add checks for Treasury-bill exposure and for the value of switching itself.
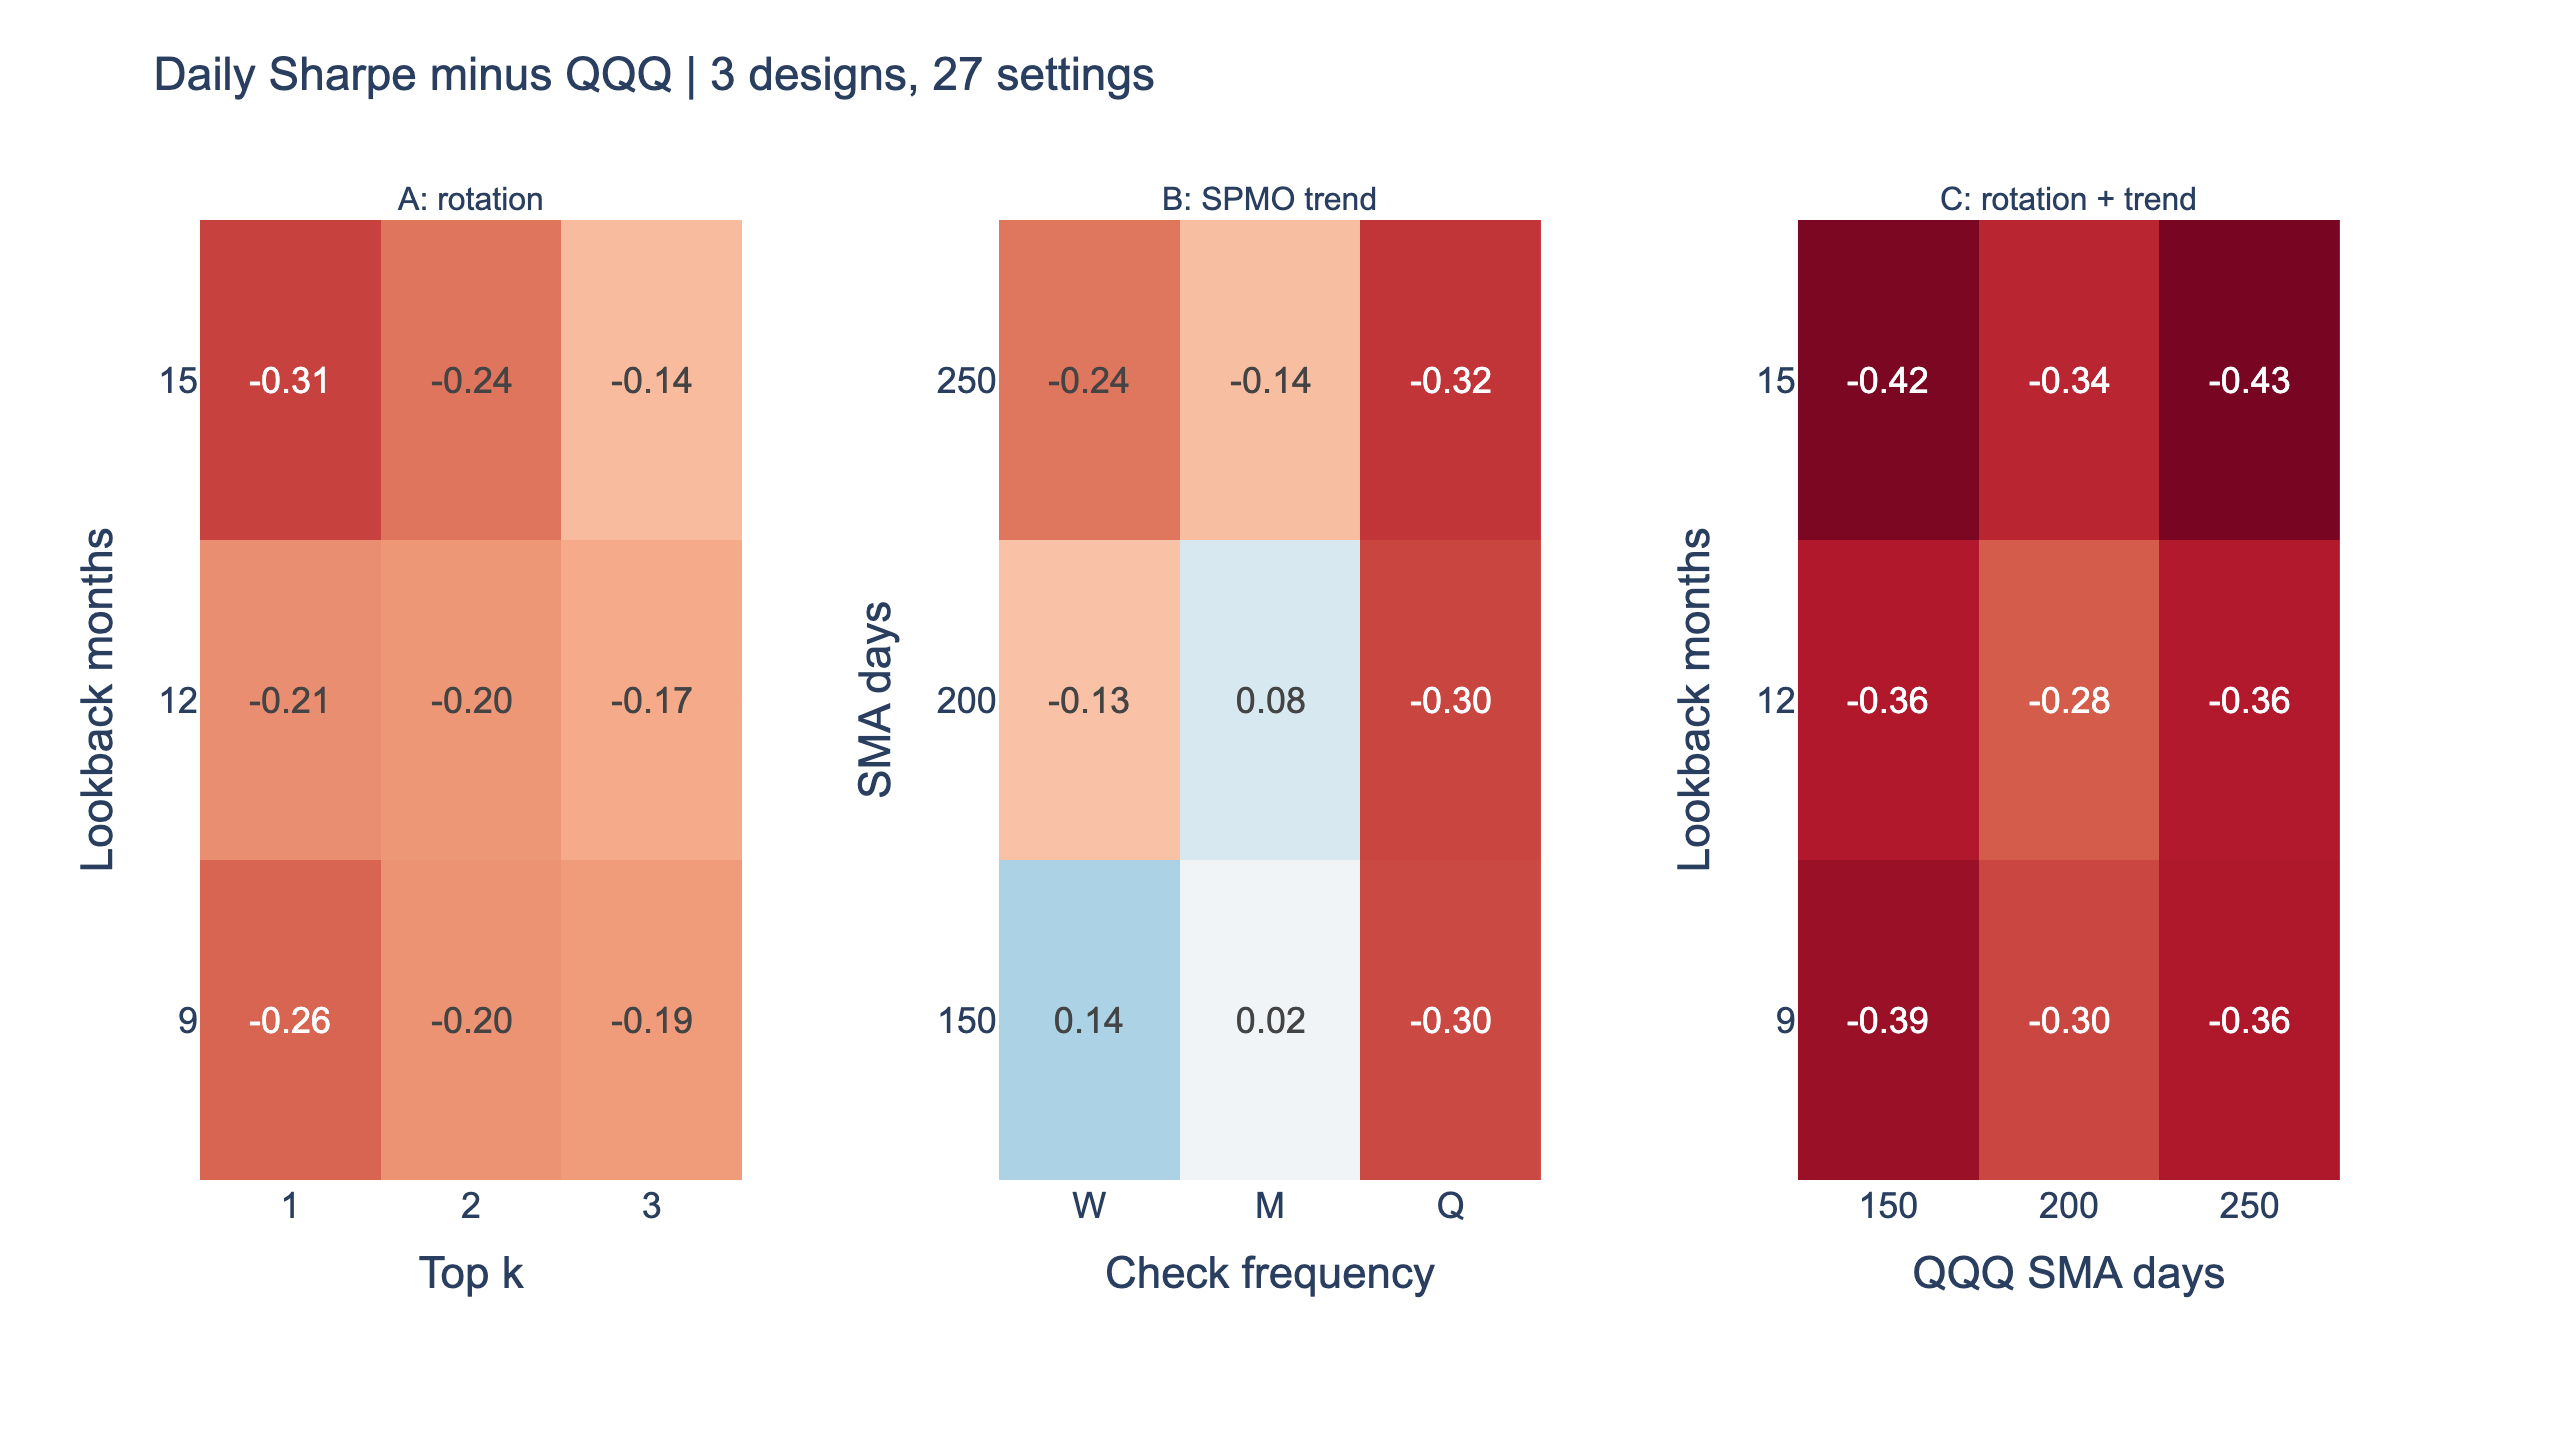
A won in 0/9 settings and C in 0/9. Their original first/second-half Sharpes were 0.62/0.71 and 0.52/0.67, against QQQ's 0.76/0.97. Adding the QQQ trend gate lowered A's full-window Sharpe from 0.66 to 0.58. The extra condition did not add value in this test, even though it spent part of the time in bills.
B was more interesting: its full-window Sharpe was 1.01 against QQQ's 0.93, and its drawdown was -15.6% against -35.1%. With the cost stress it still scored 0.99. But only 3/9 settings won; in the first half it scored 1.23 against QQQ's 1.26, then won the second half 0.82 to 0.62. Rounding the first half to one decimal would hide the failure, so the decision uses unrounded statistics. A narrow full-period success is not a passing design under the fixed rules.
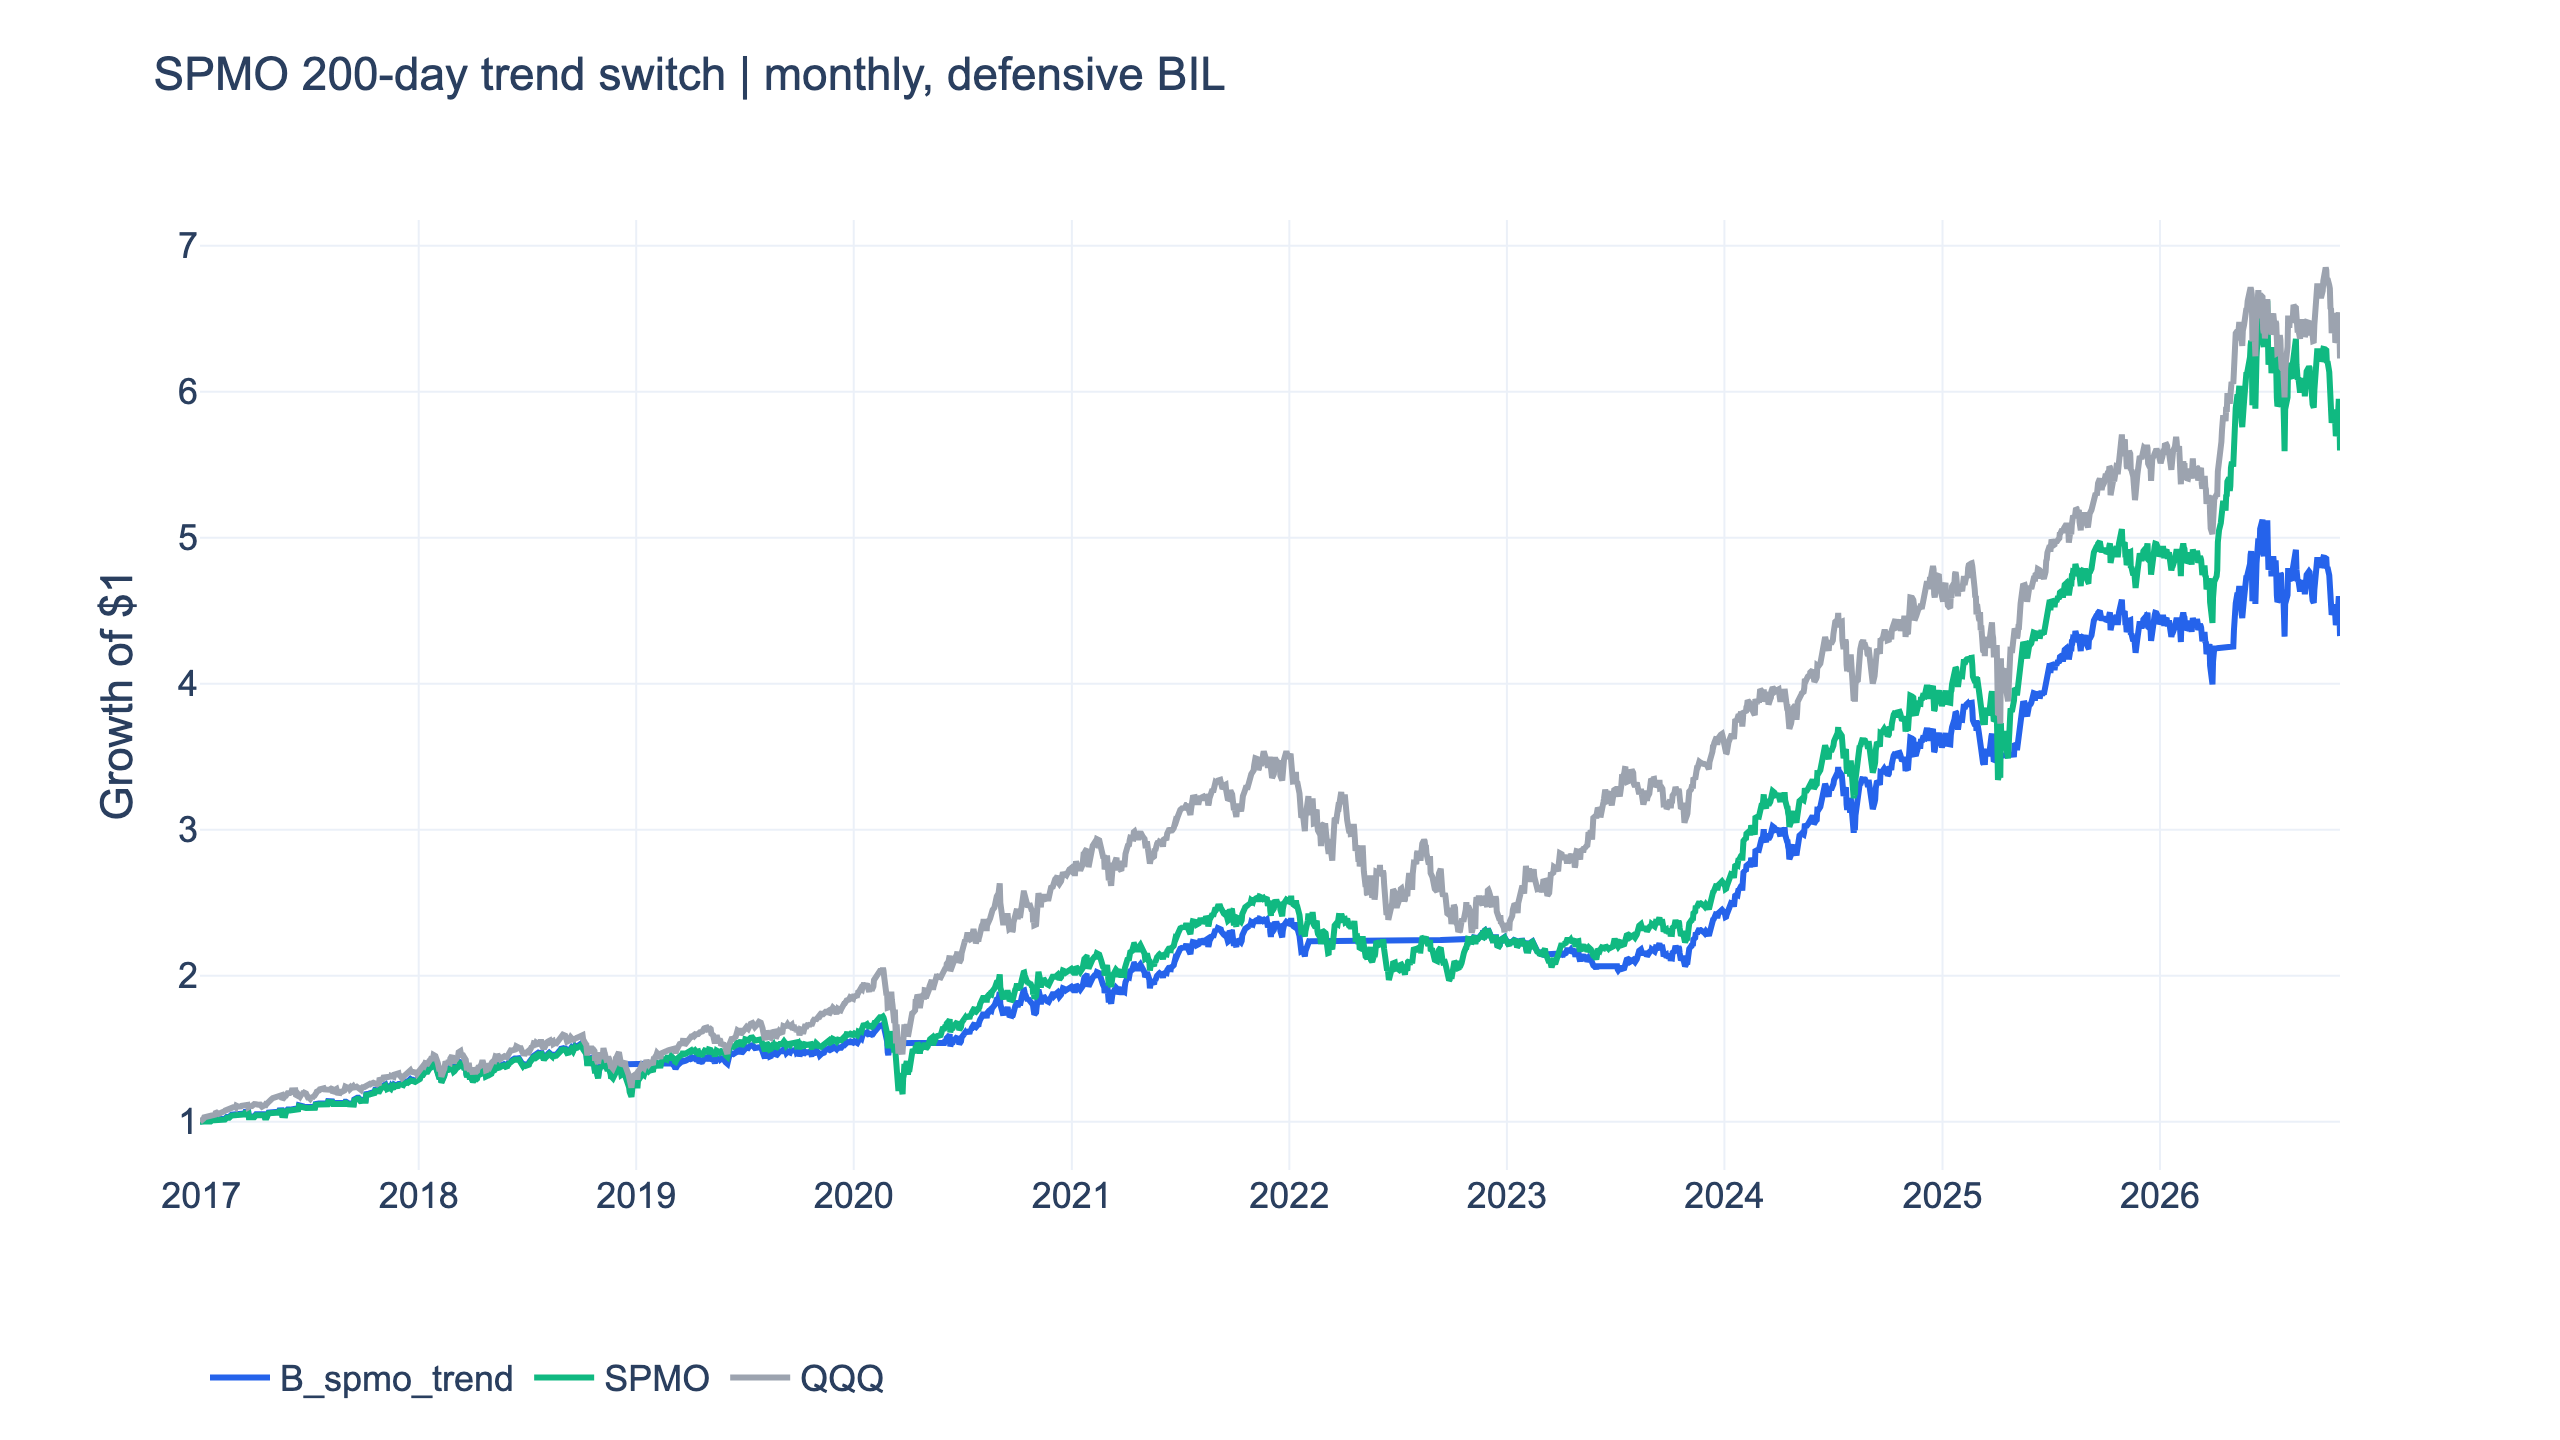
On B's dates SPMO held alone returned 19.1% a year with a 0.93 Sharpe; B returned 16.1%. Its Treasury-bill-adjusted Sharpe was 0.86 against QQQ's 0.83, and the average-weight SPMO/BIL control scored 0.96 before deducting bills. B clears those controls but still fails the parameter and first-half tests. We retain that mixed result without changing the original setting or selecting one of the winning neighbours.
The fund comparisons also changed between halves
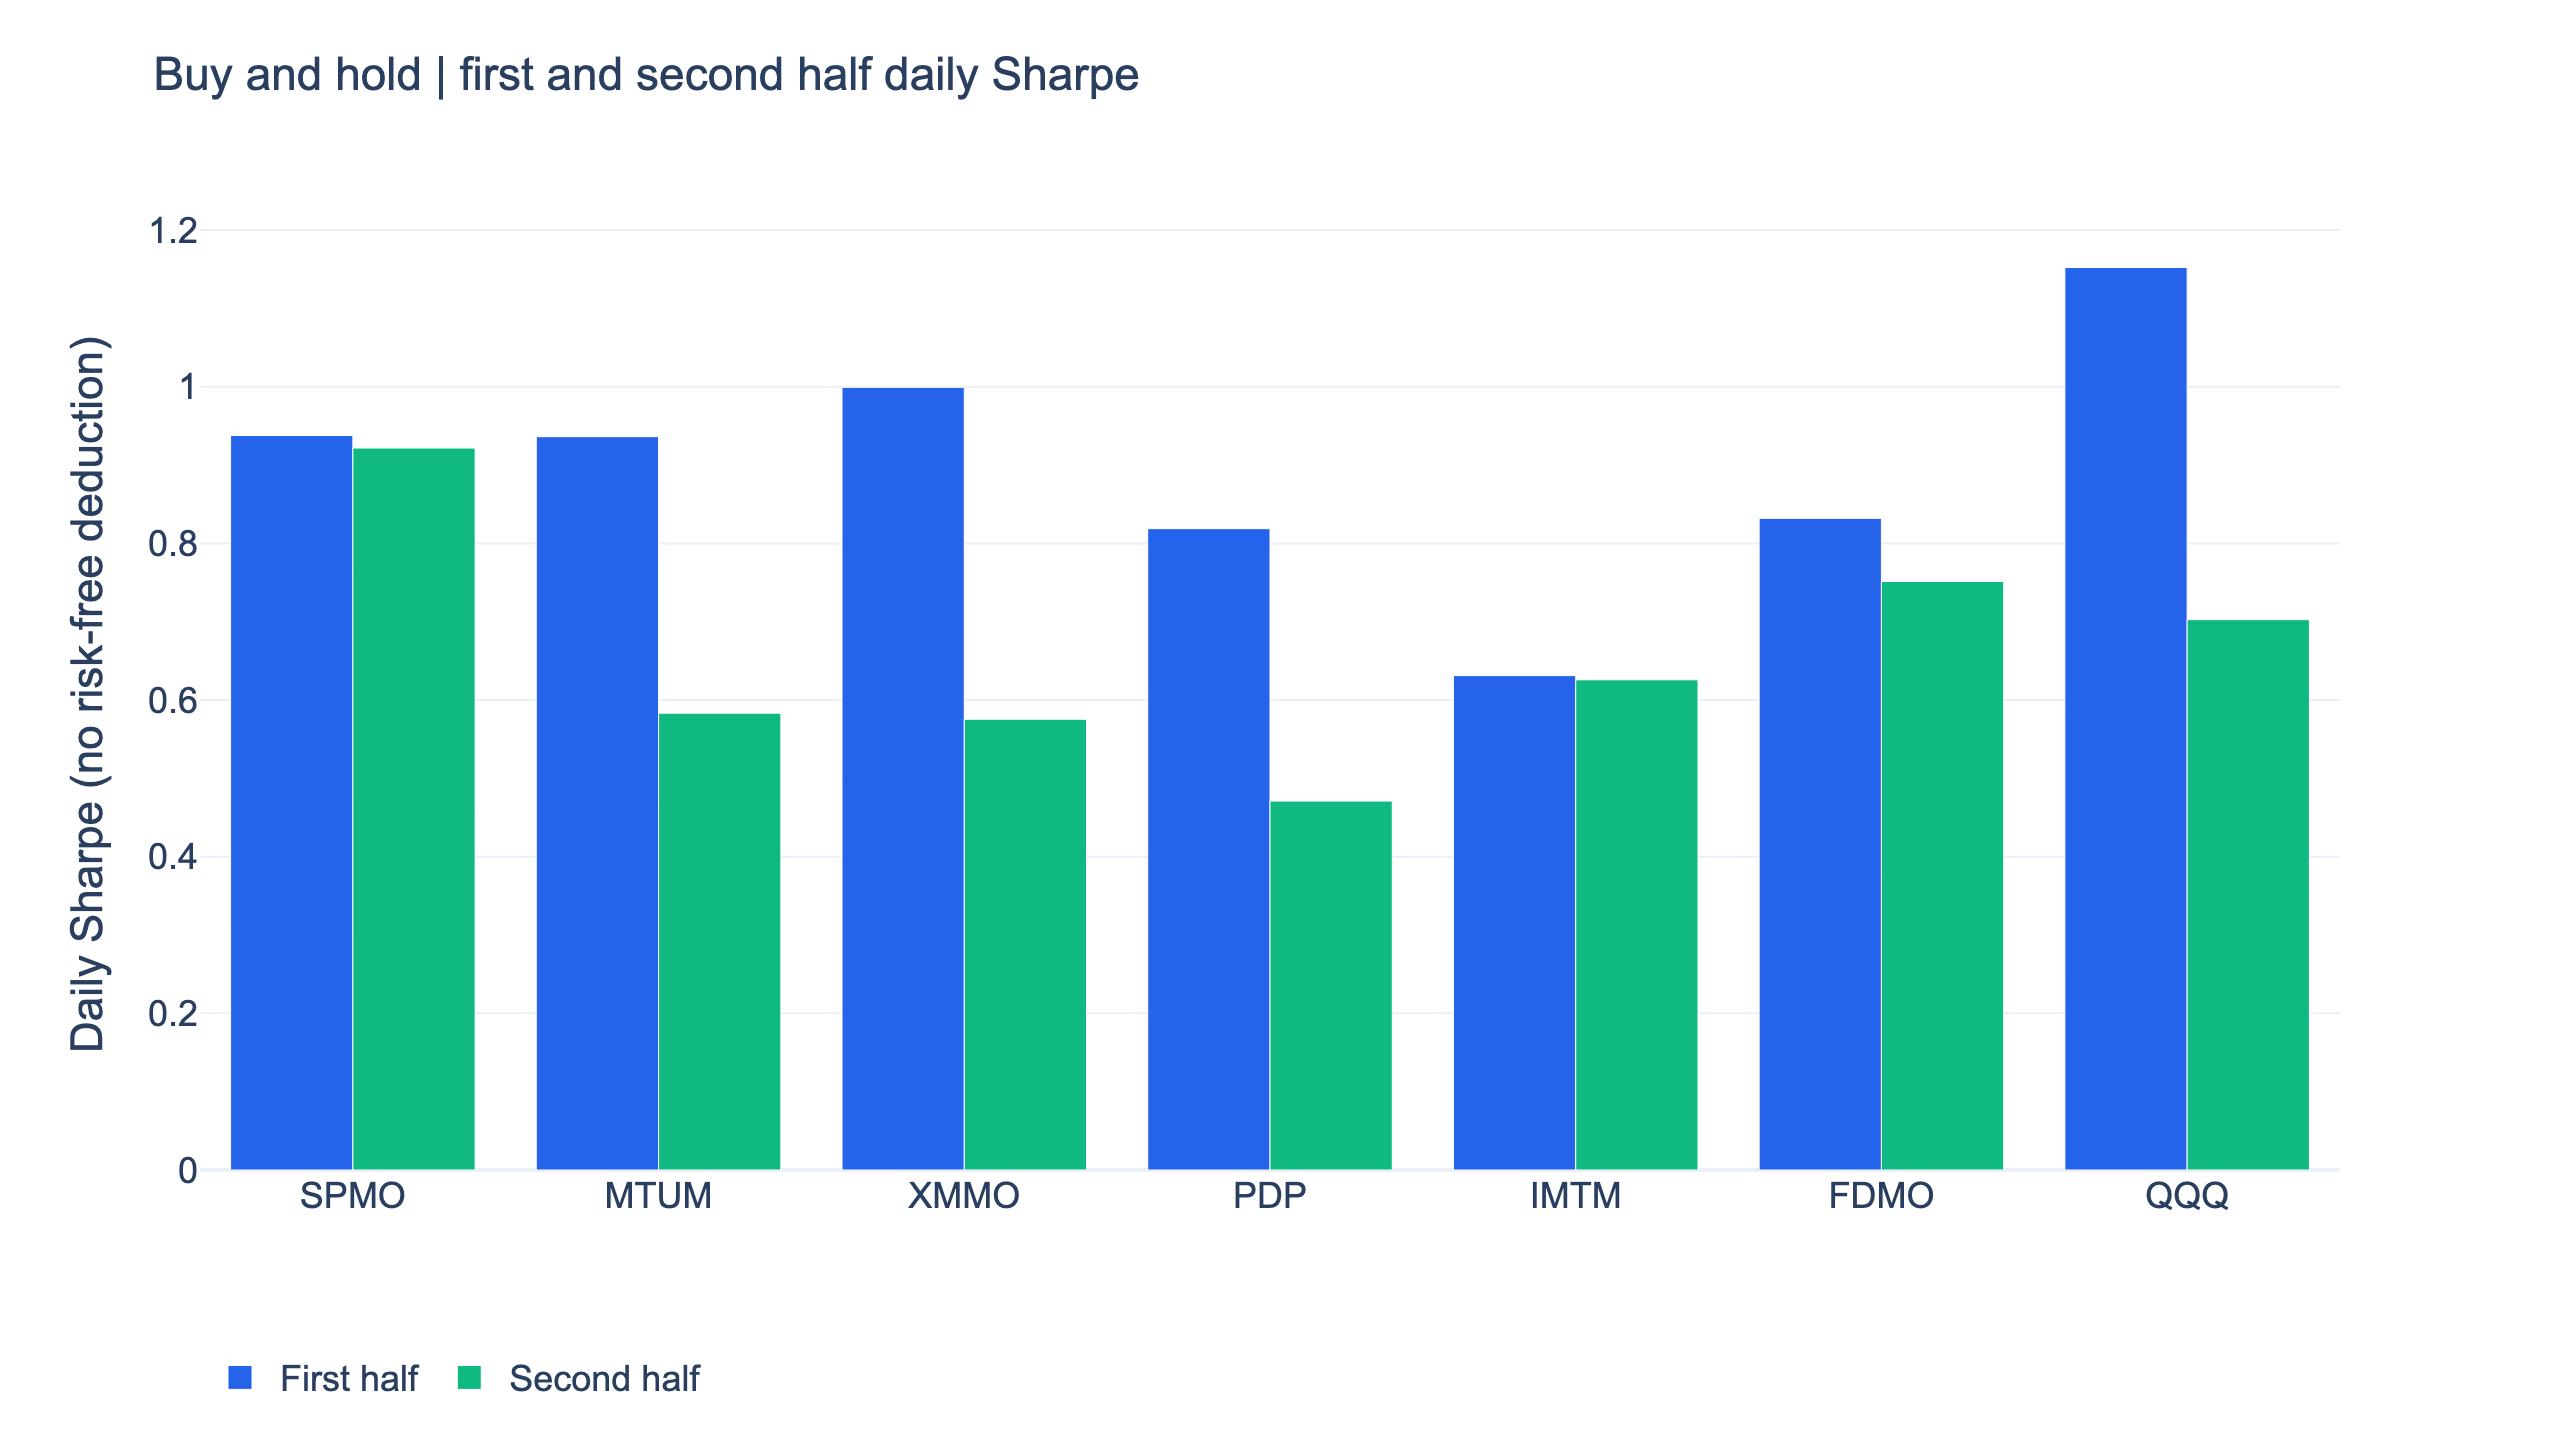
On the common fund window, QQQ scored 1.15 in the first half and 0.70 in the second. SPMO went from 0.94 to 0.92: it lost the first and won the second. FDMO also won only the second, 0.75 against 0.70. MTUM, XMMO, PDP and IMTM trailed QQQ in both halves. The table and chart make a “best momentum ETF” ranking conditional on period and metric; they do not establish a permanent ordering.
What the academic evidence does support
Jegadeesh and Titman (1993) studied buying recent stock winners and selling losers. That motivates testing relative strength, but a long-only selection among six packaged ETFs is not their long-short stock portfolio. Asness, Moskowitz and Pedersen (2013) documented value and momentum across markets; it does not imply that rotating among already similar momentum funds must beat QQQ. Moskowitz, Ooi and Pedersen (2012) studied time-series momentum across futures markets. That is a rationale for testing a trend rule, rather than evidence for this specific SPMO/BIL switch. These distinctions prevent an academic premium from being treated as a guarantee for an ETF implementation.
The interactive report uses QQQ as its market benchmark. Its display starts at the first simulated fill; the tables retain the preceding signal-date cash observation to include initial trading costs. That one-session difference can slightly change the displayed benchmark CAGR.
Method, costs and limits
| Item | Choice |
|---|---|
| Data | FinLab adjusted fund closes through 2026-10-30; rerun 2026-11-02 Taipei, finlab 2.3.0, pandas 3.1.0 |
| Dates | Stock-market trading calendar; isolated missing closes carried forward after the first quote; no fill before fund availability |
| Universe | Six named funds selected for this research, including today's surviving funds; no claim of a survivorship-free universe of every historical ETF |
| Portfolio | No leverage or shorts; equal weights among selected funds; B and C switch the entire allocation to BIL |
| Costs | sim US defaults, plus 0.1% each side; prices already reflect fund operating expenses; investor taxes and actual spread/impact are not separately modelled |
| Turnover | Mean/maximum target-weight change at monthly decisions: A 18.9%/50.0%, B 12.7%/100.0%, C 24.1%/100.0%; half the absolute weight changes, excluding initial allocation and between-date price drift |
| Liquidity and capacity | No dollar-volume screen, capacity estimate or market-impact model; actual execution depends on account size and each ETF's liquidity |
| Validation | All in sample; chronological halves are a stability check, not an untouched out-of-sample test; no conditional rules added after seeing results |
| Sharpe | Mean daily return divided by sample standard deviation, times √252; no risk-free deduction, with a separate BIL excess-return calculation |
Reproduce the original rotation
The core rule is short enough to inspect. Ask your agent to run the full research script for the stock-market calendar, all 27 settings, the cost checks and the shared start dates; this excerpt shows A's original selection:
Show Code
import finlab
from finlab import data
from finlab.backtest import sim
from finlab.markets.us import USFundMarket

finlab.login()
data.set_market("us_fund")
data.truncate_end = "2026-10-30"
calendar = data.get("us_price:adj_close").index
price = data.get("us_fund_price:adj_close").reindex(calendar).ffill()
etfs = ["SPMO", "MTUM", "XMMO", "PDP", "IMTM", "FDMO"]
score = price[etfs] / price[etfs].shift(252) - 1
selected = score.rank(axis=1, ascending=False, method="first") <= 2
weights = selected.astype(float) / 2
class QQQMarket(USFundMarket):
    @staticmethod
    def get_benchmark():
        return price["QQQ"]

report = sim(weights.loc["2017-12-29":], resample="M", market=QQQMarket(), upload=False)
report.to_html("momentum_rotation.html")
Install the FinLab skill for your AI agent
Start with the AI-assisted setup. The FinLab skill works with Claude Code, Codex and Gemini CLI; the agent setup guide explains the choices. Install it with:
Show Code
npx skills add koreal6803/finlab-ai --skill finlab -g -yThen ask your agent to reproduce this study using the downloaded research.py and the fixed end date. You can inspect the same code in the browser at FinLab Studio. Reproduction comes before experimenting with a new rule: confirm the original output, save a copy, and label any later change as a new experiment. Changing the rule after seeing these figures would remove the meaning of the original nine-setting check.
FAQ
Is SPMO better than QQQ?
It had a slightly higher daily Sharpe on our common window, 0.93 against 0.92, but a lower CAGR, 18.9% against 20.0%. It did not beat QQQ in both halves. A statement that it simply “beats QQQ” would omit the return and period trade-offs.
Is MTUM the same as SPMO?
No. They use different index providers, eligible universes and maintenance rules. MTUM's cited SR Variant methodology specifies quarterly reviews, while SPMO reviews semiannually. These differences are consistent with different returns but do not isolate their causal contributions.
Did momentum ETF rotation work?
The tested six-fund rotation did not: 0/9 settings beat QQQ. This is evidence about that pool and those lookbacks, not every possible momentum strategy.
Does a moving-average filter solve the problem?
B reduced drawdown and improved full-window Sharpe, but failed our parameter and first-half tests. C lowered Sharpe relative to the rotation alone. A protective-sounding rule still needs testing against the unfiltered allocation.
Why hold BIL instead of cash?
BIL includes short Treasury-bill returns. It avoids assuming that defensive capital earns zero during periods when bills pay interest. We also subtract BIL returns when comparing Sharpe so that a low-volatility cash-like allocation does not win solely from the level of interest rates.
Can I choose one of the successful parameter settings?
You can run a new experiment, but selecting the best setting after this test is parameter selection on the same sample. It would need a fresh future observation period, and would not make this preregistered design pass.
Research files and related comparisons
- strategy.py: the same complete research program for this article.
- research.py: all four designs in the shared study, including the factor ETF rerun.
- data.csv and metrics.json: daily equity, every parameter result, halves and controls.
- Rotation report, fixed-weight baseline, and SPMO trend report.
More comparisons are in the US quant trading strategies overview, the US factor investing overview, the sector rotation study, the lazy portfolio test, and the covered call and dividend study. The definitions of look-ahead bias and turnover explain two common reasons for overstating a trading rule's return. The companion QUAL, USMV and factor ETF comparison tests different factor exposures rather than rotating only among momentum funds.
Last updated: 2026-11 | Data through: 2026-10-30 | Rerun: 2026-11-02 (Taipei) | Author: FinLab Quant Research. We publish reproducible rules, sensitivity tests and the underlying data so readers can inspect the research method.
Past performance does not represent future results. All results are in-sample backtests. Named ETFs describe research instruments and are not recommendations. This educational content does not constitute investment advice.
FinLab AI
Want to build your own strategy?
Describe your stock-picking ideas in natural language. AI automatically validates, backtests, and gives you answers
Start Free