Run this strategy
Copy the prompt to reproduce the evidence above with the article’s data, assumptions, and risk checks.
Tell your AI:
Set up FinLab and compare QQQM with QQQ on total return, tracking gap and daily dollar volume. Please read: https://finlab.finance/en/setup?relatedUrl=/en/blog/qqqm-vs-qqq-backtest
QQQM and QQQ track the same Nasdaq-100 index. From October 2020 to October 2026 QQQM had a higher daily Sharpe than QQQ in all nine holding windows we tested and earned about 0.04% to 0.10% more a year, mainly because of its lower fee. QQQ's median daily dollar volume over the last year was about $29.5 billion, 28 times QQQM's $1.05 billion. For someone who already owns QQQ, a 0.2% round trip to switch takes about 6.7 years to recover at today's 0.03 point fee gap, before any capital gains tax.
Over these six years QQQM's total return was slightly higher, by a small amount: $3 a year in fees on every $10,000. For short-term trading, large orders or options, the liquidity gap in QQQ's favour is larger.
Key numbers
| Item | QQQM | QQQ |
|---|---|---|
| Index | Nasdaq-100 | Nasdaq-100 |
| Listed | 2020-10-13 | 1999-03-10 |
| Expense ratio | 0.15% | 0.18% (0.20% before 2025-12-22) |
| Structure | Open-end ETF | Open-end ETF since 2025-12-22, unit investment trust before |
| Total return, 2020-10-30 to 2026-10-30 | 166.1% | 165.5% |
| Annual return | 17.72% | 17.68% |
| Daily Sharpe (no risk-free rate) | 0.849 | 0.843 |
| Maximum drawdown | -35.05% | -35.12% |
| Median daily dollar volume, last year | $1.05 billion | $29.5 billion |
| Lowest day, last year | $412 million | $11.5 billion |
| Close on 2026-10-30 | $284.34 | $690.49 |
| One cent as a share of price | 0.35 bp | 0.14 bp |
| Trailing 12-month yield | 0.46% | 0.45% |
| Ex-date to payment (median) | 4 days | 17 days (three payments in 2026; 38 days before) |
A basis point (bp) is 0.01%. Data through 2026-10-30, rerun 2026-11-01.
Why the same index gives two different returns
Fees are the source we can confirm. Fund structure may also play a part, but our data cannot separate it.
Fees. Until December 2025 QQQ charged 0.20% against QQQM's 0.15%, a 5 bp gap. After QQQ converted to an open-end fund its expense ratio fell to 0.18%, leaving 3 bp. Sharpe (1991) set out the arithmetic for active and passive investing as a whole, and the same logic applies here: with the same gross return, the difference investors keep is the difference in cost. Elton, Gruber and Busse (2004) found the same among S&P 500 index funds, where performance gaps came mainly from expenses.
Structure. From 1999 to December 2025 QQQ was a unit investment trust (UIT). A UIT cannot reinvest dividends it receives during the quarter or lend out its holdings, so that cash waits until the distribution date. Elton, Gruber, Comer and Li (2002) studied SPY, also a UIT, and found that it lagged its index because of its management fee and the income lost by not reinvesting dividends.
Distribution timing shows the difference. From October 2020 to December 2025 QQQ's median time from ex-date to payment was 38 days, against 4 days for QQQM. In its three quarterly distributions of 2026 QQQ took 4, 18 and 17 days. In theory that idle cash holds back returns in rising markets, but the numbers below cannot confirm the effect.
QQQM vs QQQ: tracking difference, measured
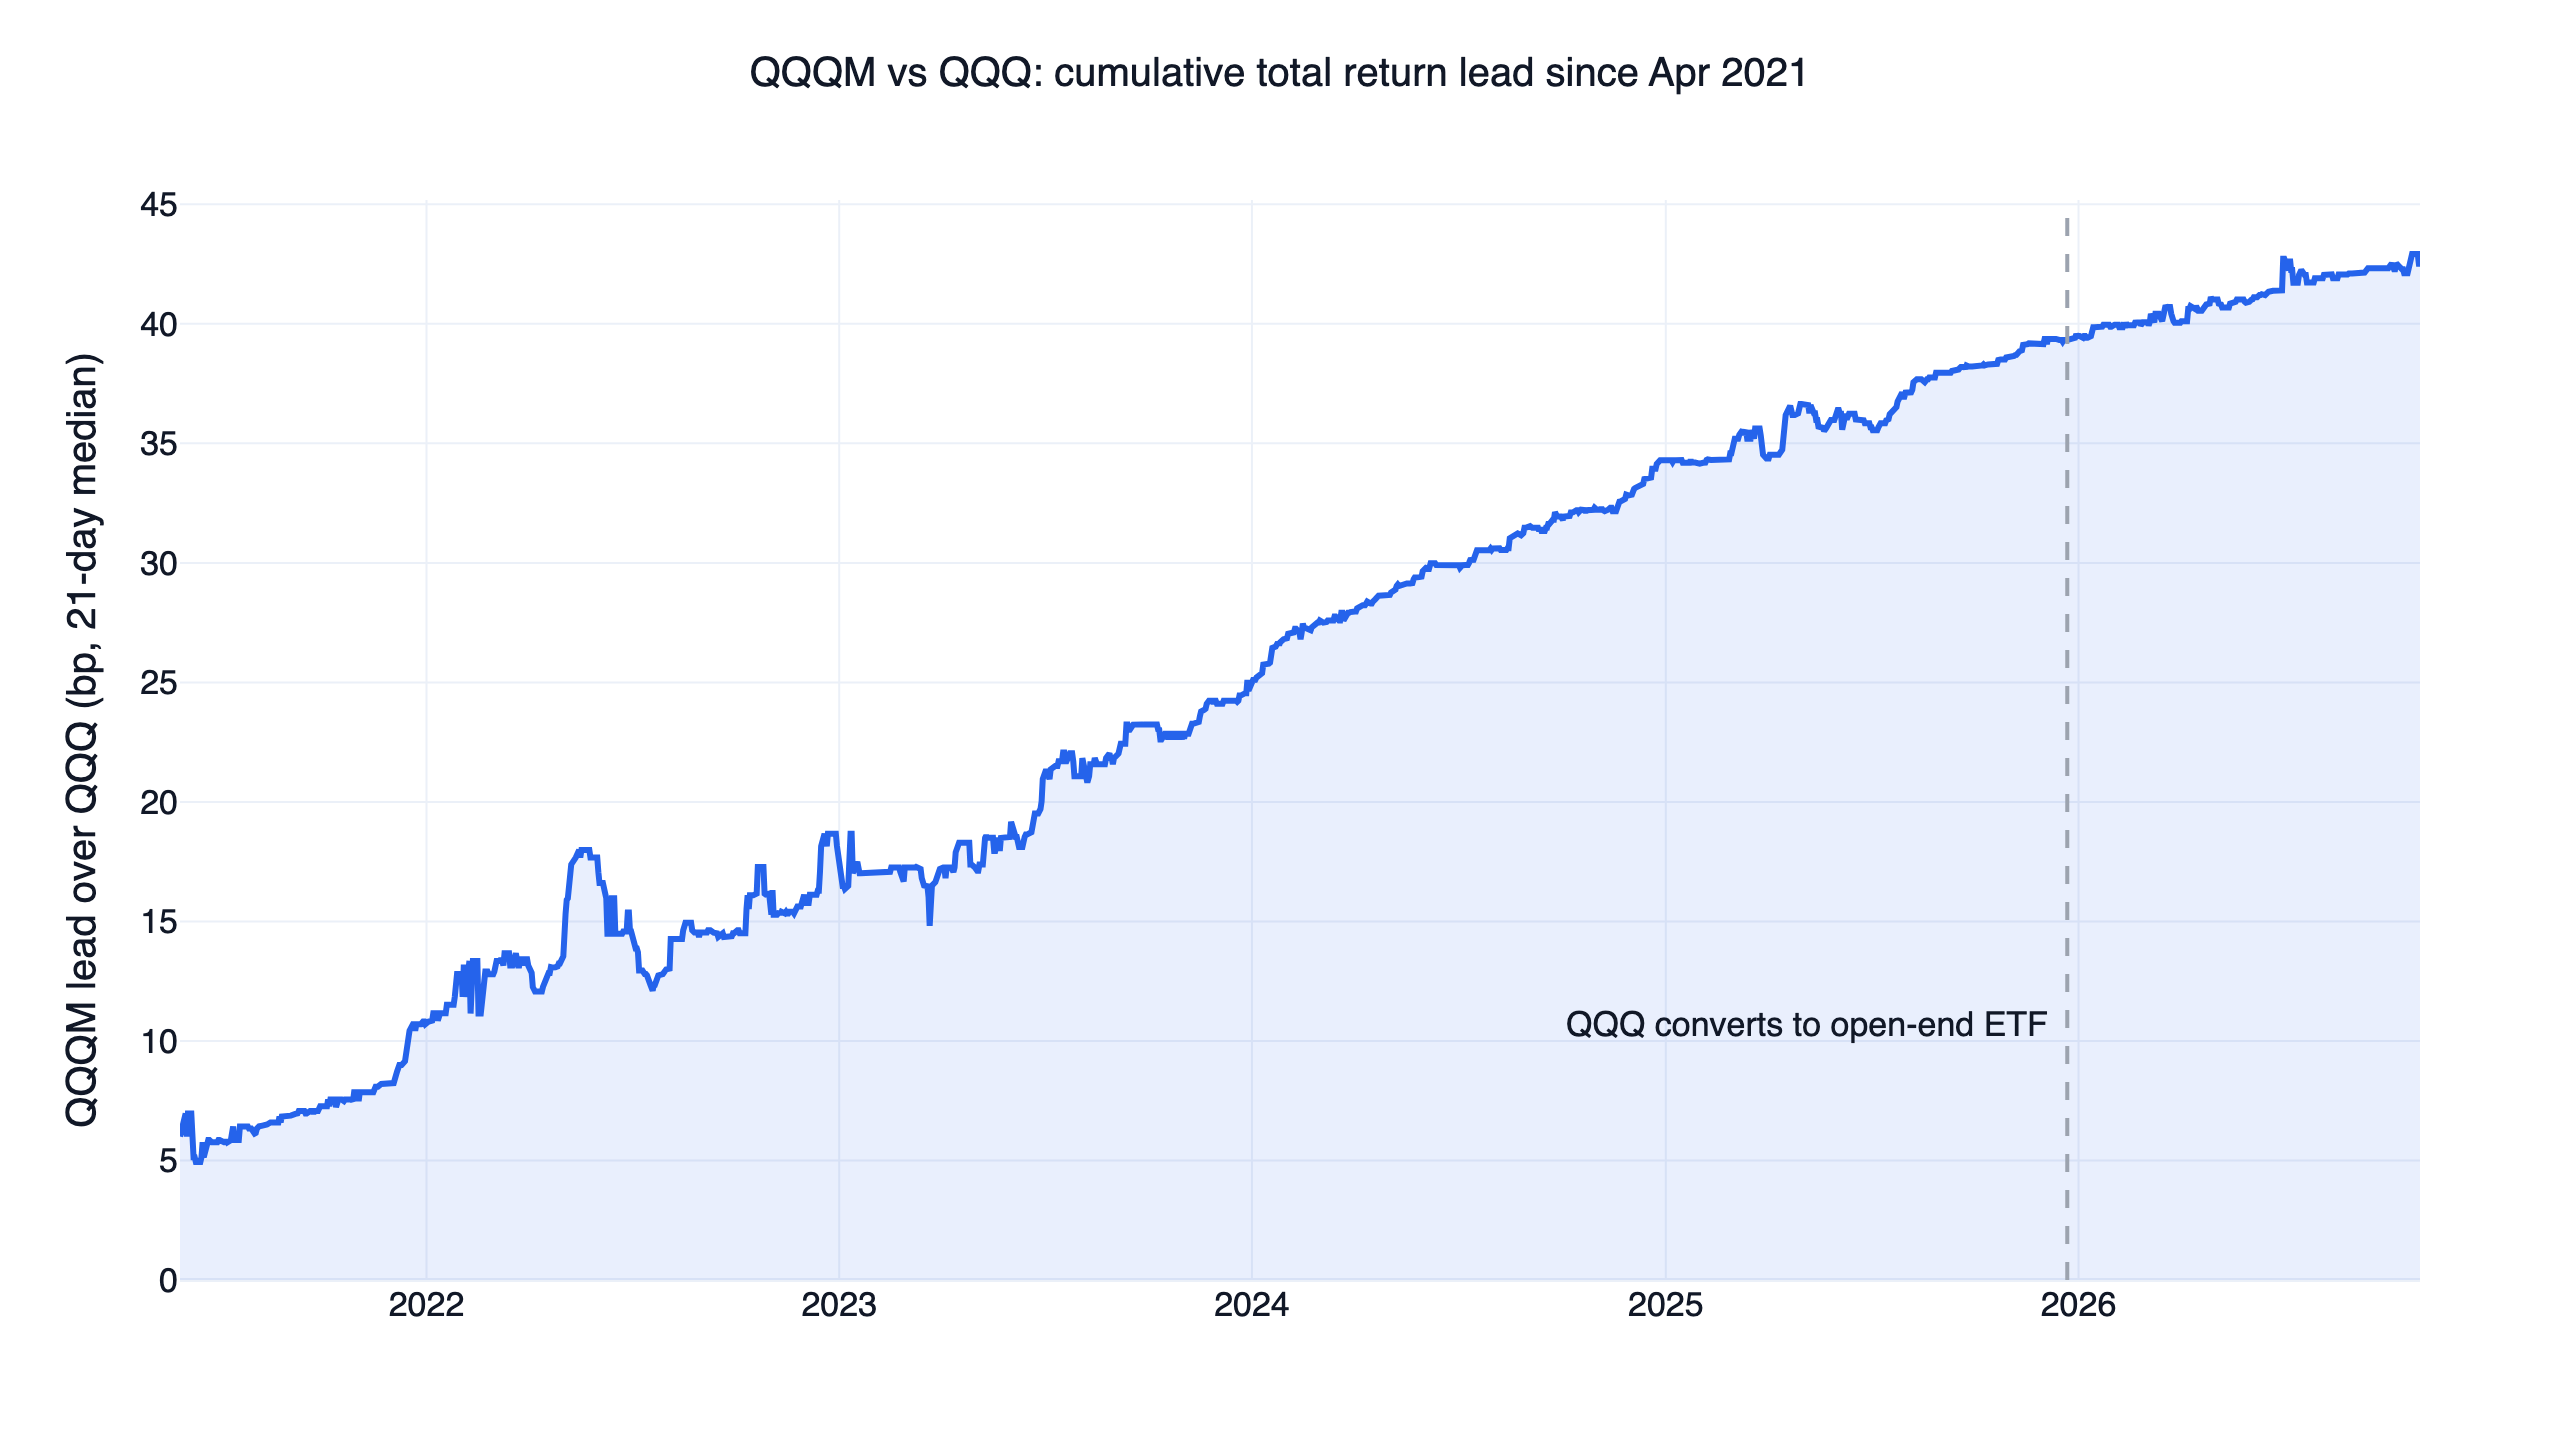
us_fund_price:adj_close is a dividend-adjusted price. From the first month end after QQQM listed to the end of October 2026, QQQM's total return was 166.1% against QQQ's 165.5%. Their daily returns correlate at 0.99928 and the median daily gap is 1.6 bp. The chart at the top starts on 2021-04-30 and uses a 21-day median to filter closing-price noise; the cumulative lead reaches about 43 bp by October 2026.
| Year | QQQ | QQQM | QQQM minus QQQ (bp) | Fee gap then |
|---|---|---|---|---|
| 2020 (from 10-30) | 16.68% | 16.47% | -20.8 | 5 bp |
| 2021 | 27.42% | 27.45% | +2.9 | 5 bp |
| 2022 | -32.58% | -32.52% | +6.0 | 5 bp |
| 2023 | 54.85% | 55.01% | +15.5 | 5 bp |
| 2024 | 25.58% | 25.68% | +10.5 | 5 bp |
| 2025 | 20.77% | 20.84% | +7.8 | 5 bp |
| 2026 to October | 12.78% | 12.82% | +4.2 | 3 bp |
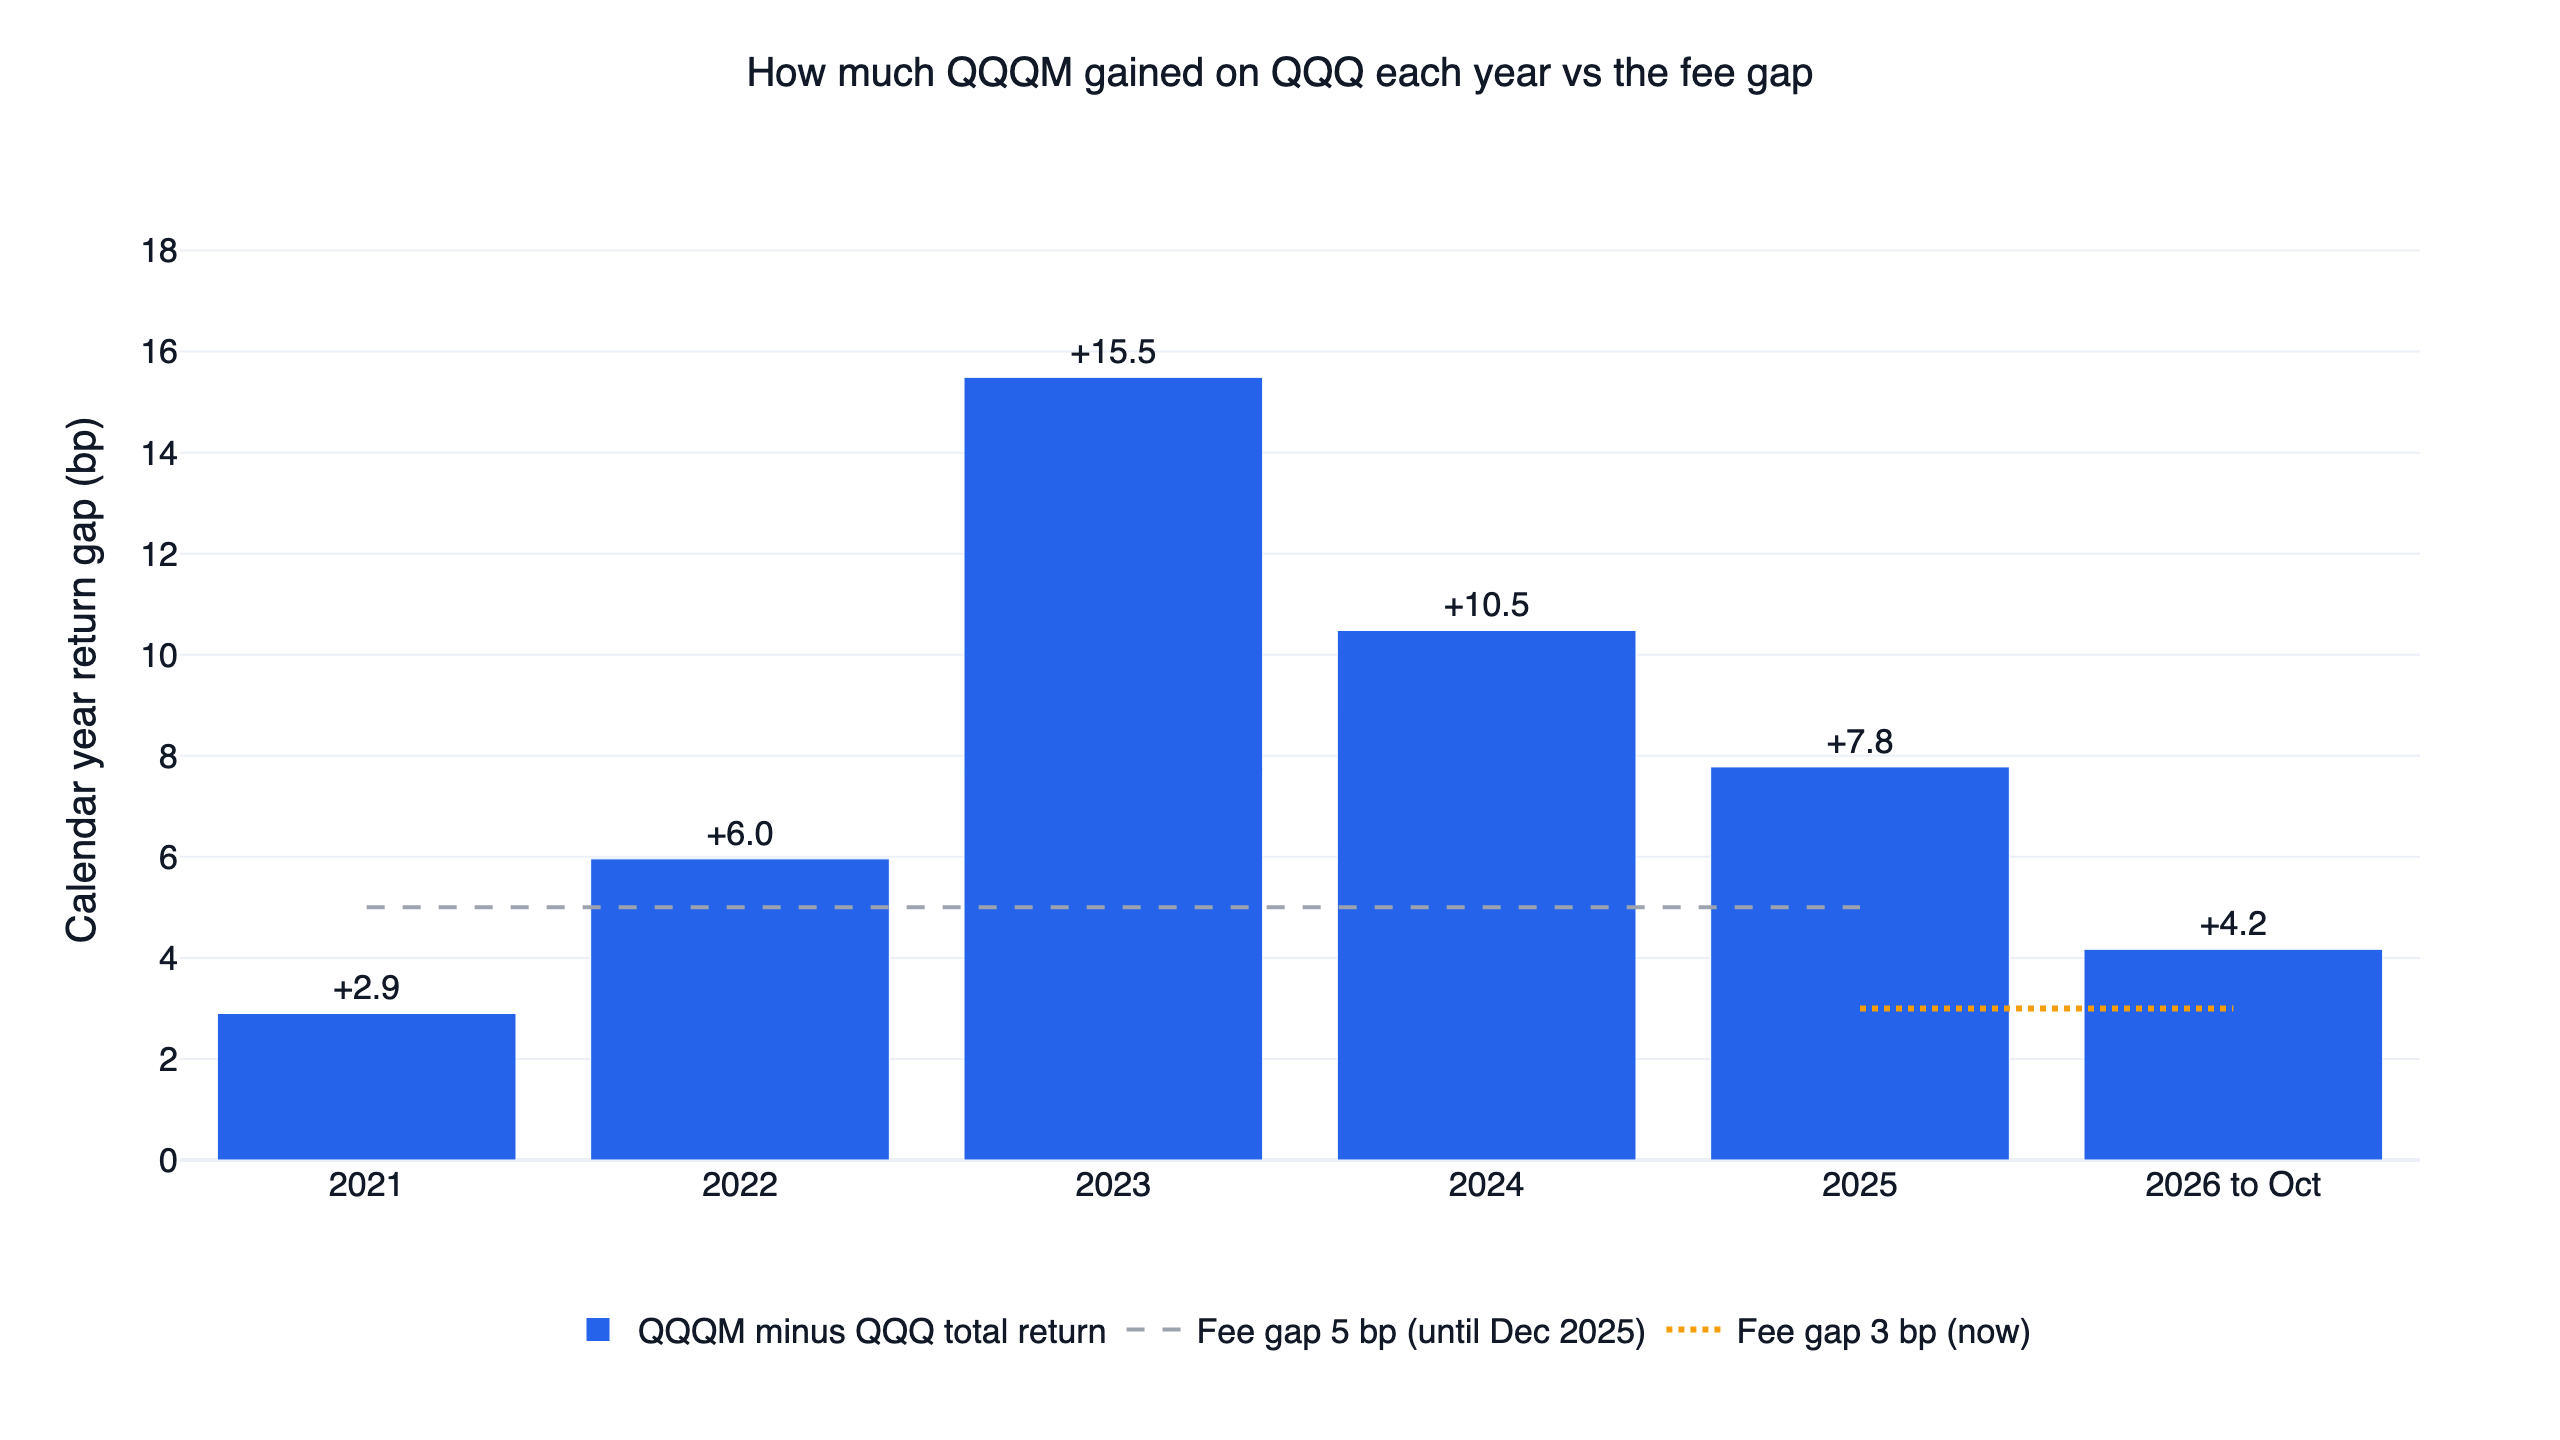
The chart leaves out 2020, which covers only two months.
Fees are the main source, and a structure effect is not visible. The five-year average gap from 2021 to 2025 is about 8.5 bp, somewhat above the 5 bp fee difference, but the years disagree. The gap was larger in the strong years 2023 and 2024 (15.5 and 10.5 bp), yet only 2.9 bp in 2021, also a strong year, and 6.0 bp in the 2022 decline. SPY is also a UIT with about twice QQQ's yield, and its gap to VOO over this period was only 6.9 bp a year, close to their 6 bp fee difference. Our data has no figures for the cash the fund held, so we cannot isolate any UIT effect.
The conversion shows no clear change yet. Since December 22, 2025 the annualised gap is 5.3 bp against a 3 bp fee difference. Ten months is too short to conclude anything.
2020 is negative. In its first weeks QQQM traded only about $1 million to $15 million a day, and its close moved around QQQ's by more, reversing within days. On 2020-11-03 QQQM closed about 55 bp high relative to QQQ and gave it back the next day; that 62 bp gap on 2020-11-04 is the largest of the whole period. Late February 2021 still saw single-day moves of about 50 bp, and they shrank after that. Petajisto (2017) also found that ETF price deviations from net asset value mean-revert. The closing price on the start date matters a lot: QQQM closed relatively high on October 30, so the gap from that date is 0.04% a year, against 0.09% from April 2021.
This also explains why the tracking error, the annualised standard deviation of the daily gap, looks high at 0.86%. It mostly reflects short-term noise in closing prices that reverses within days. What accumulates is the few basis points in the table.
Three checks: QQQM passes
We fixed these conditions before running anything. The test is buying QQQM in place of QQQ and holding it, and "beats" means a higher daily Sharpe, with no risk-free rate, than QQQ with dividends over the same dates.
1. At least 7 of 9 holding windows: all 9 won. Starts are the month ends of 2020-10, 2021-04 and 2021-10; ends are the month ends of 2025-10, 2026-04 and 2026-10.
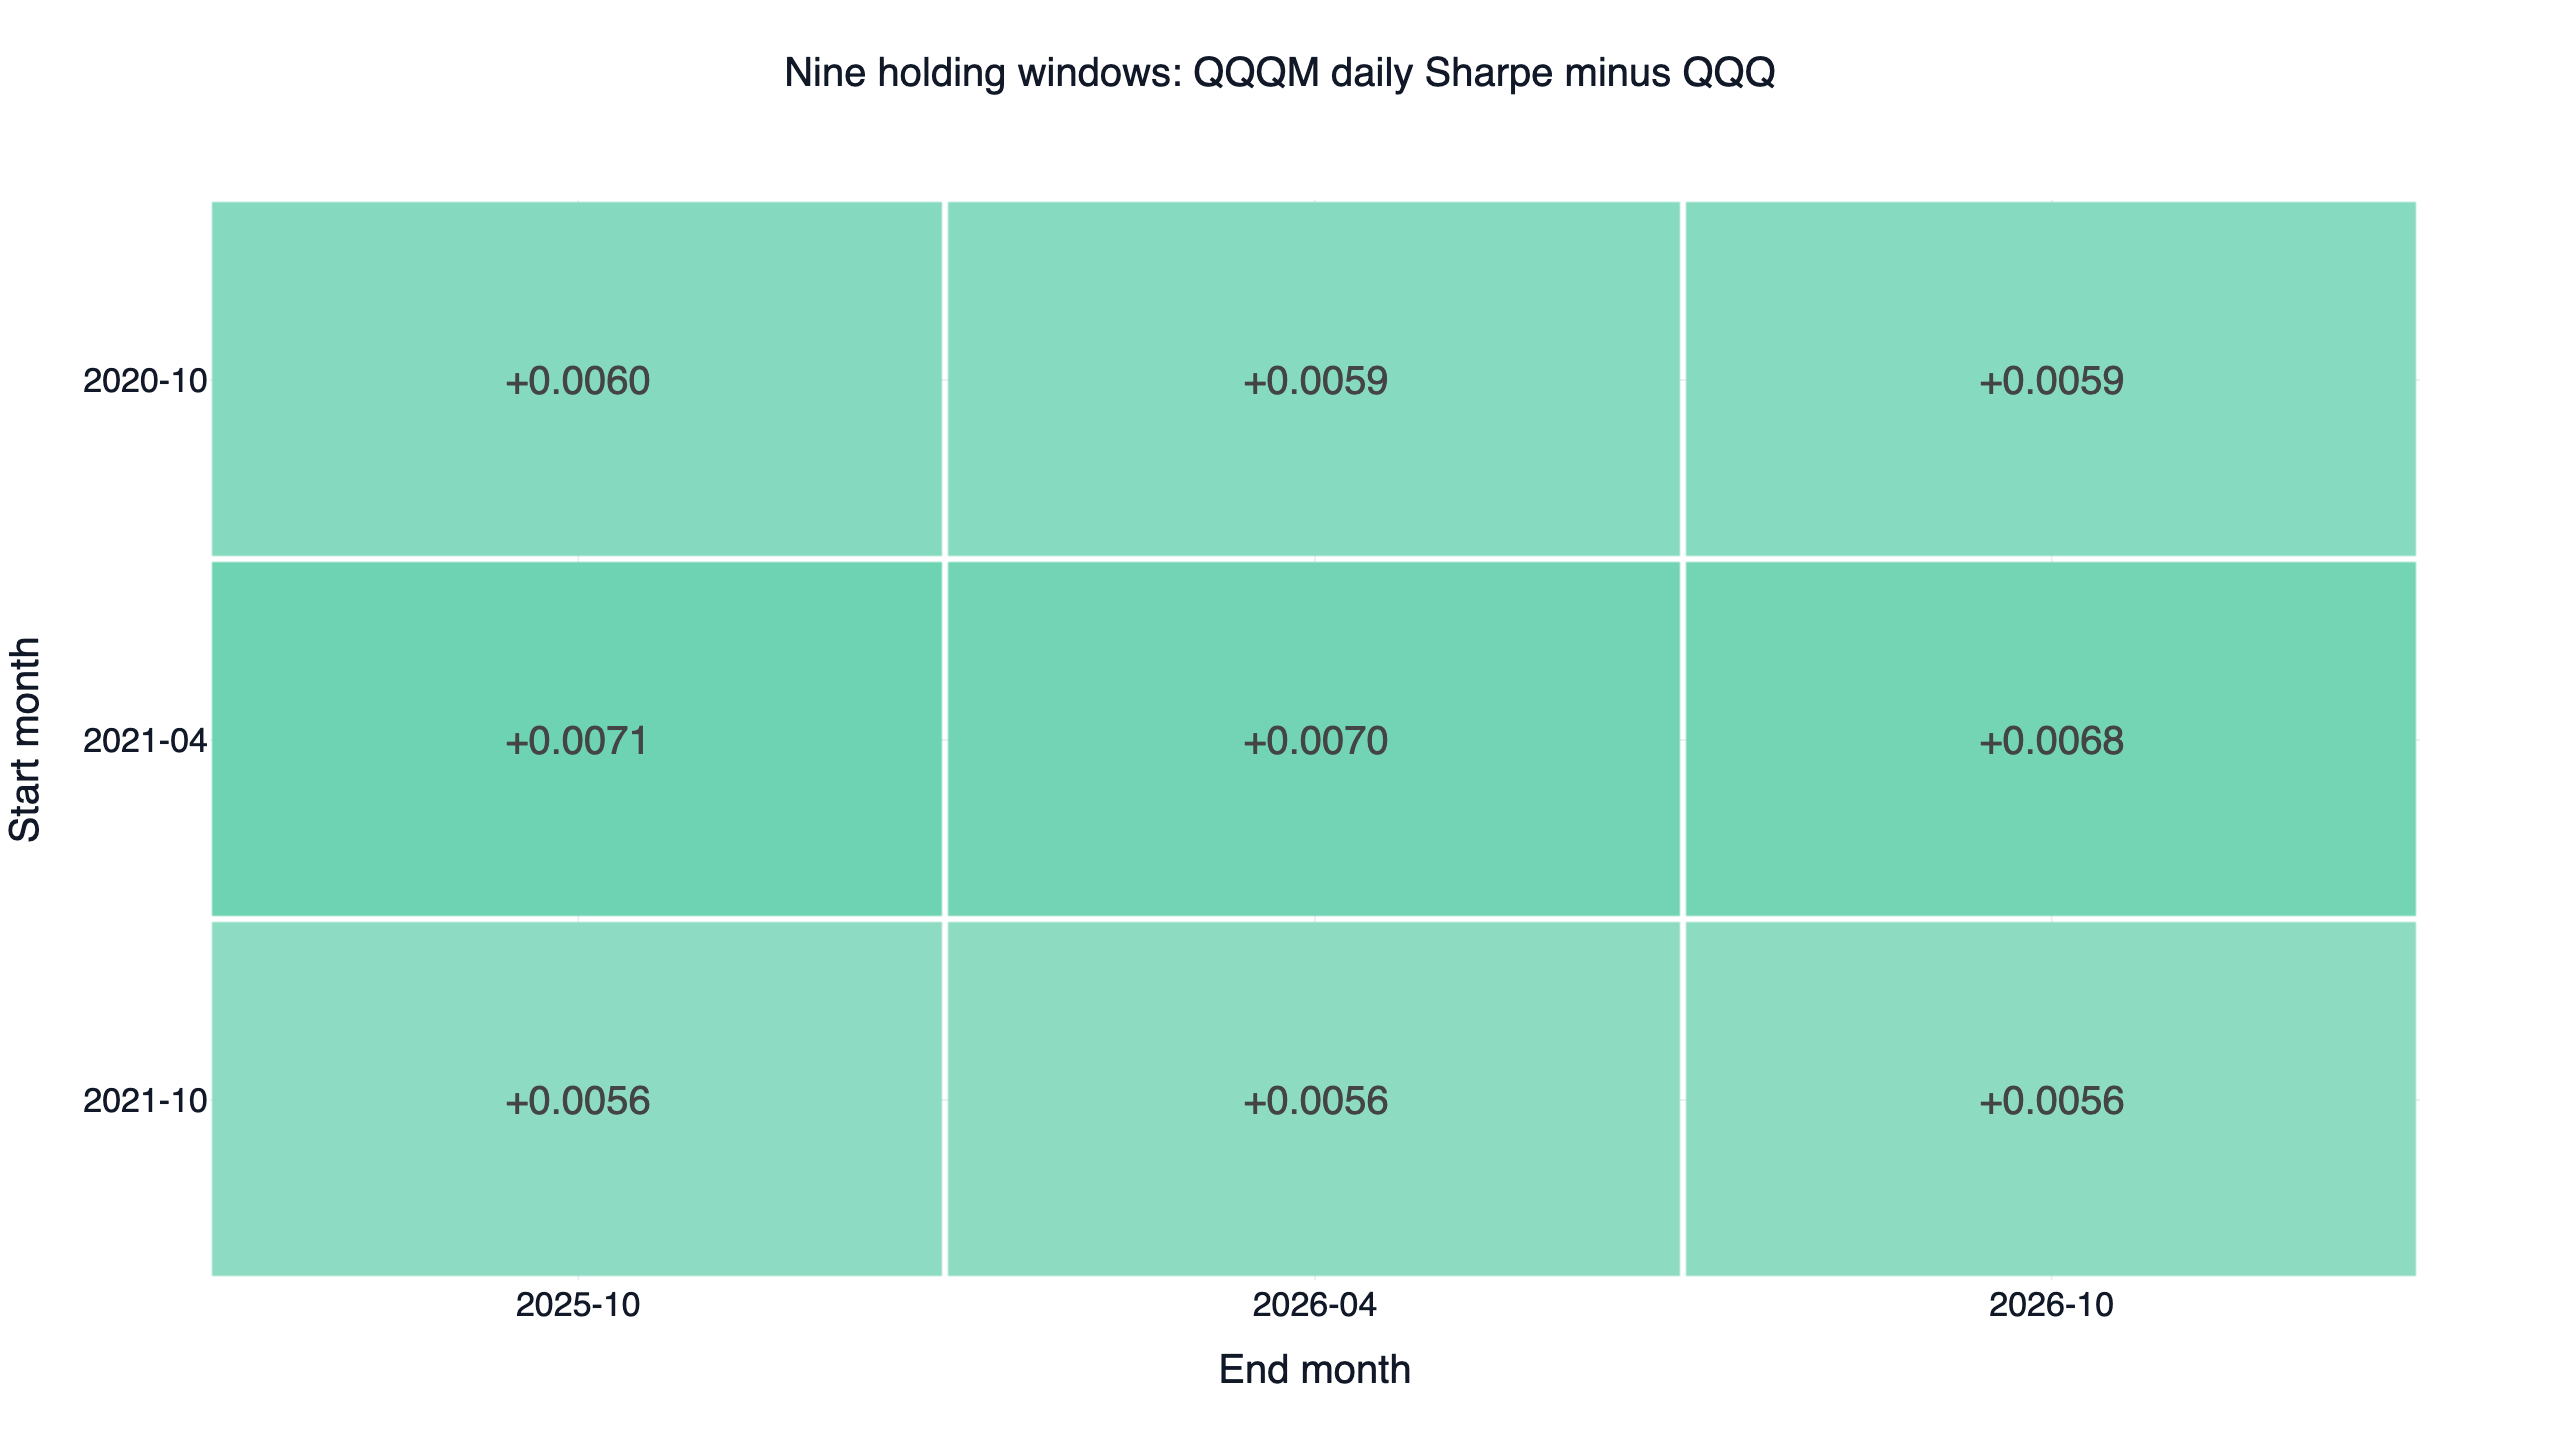
| Start | End | QQQM daily Sharpe | QQQ daily Sharpe | Annual gap |
|---|---|---|---|---|
| 2020-10-30 | 2025-10-31 | 0.896 | 0.890 | 0.040% |
| 2020-10-30 | 2026-04-30 | 0.888 | 0.882 | 0.040% |
| 2020-10-30 | 2026-10-30 | 0.849 | 0.843 | 0.043% |
| 2021-04-30 | 2025-10-31 | 0.753 | 0.746 | 0.098% |
| 2021-04-30 | 2026-04-30 | 0.755 | 0.749 | 0.092% |
| 2021-04-30 | 2026-10-30 | 0.726 | 0.719 | 0.090% |
| 2021-10-29 | 2025-10-31 | 0.666 | 0.661 | 0.078% |
| 2021-10-29 | 2026-04-30 | 0.676 | 0.670 | 0.073% |
| 2021-10-29 | 2026-10-30 | 0.652 | 0.647 | 0.073% |
2. Both halves: won both. Split on 2023-10-30, the first half is 0.5098 against 0.5079 and the second 1.2509 against 1.2393.
3. Trading costs: passed. A QQQ holder paying 0.1% per side, 0.2% in all, to move to QQQM (simulated in finlab sim, filled at the close of 2020-11-03) scores 0.843 against 0.841 for staying in QQQ.
The third check is scored on daily Sharpe. In dollars, that switch reached 2.639 times the starting money by the end of October 2026, against 2.646 for staying, about 0.3% behind. The reason is the fill date: on 2020-11-03 QQQM closed about 55 bp high relative to QQQ and gave it back the next day. Move the fill one to six trading days later (11-04 to 11-11) and every switch ends ahead, by 0.19% to 0.35%, and passes on Sharpe too. One day's closing gap mattered more than six years of fee differences.
With gaps this small, the Sharpe difference says little on its own; both funds hold one index. The annual return gap is more useful: it is positive in all nine windows, at 0.04% to 0.10%. Holding one ETF has no rule to update and its returns are almost identical to QQQ's, so we did not publish it as a live strategy.
Who won from any start date
Treating every trading day from 2020-10-30 as a purchase date:
| Hold | Start dates | QQQM beat QQQ | Median gap | Worst gap |
|---|---|---|---|---|
| 1 year | 1,255 | 93.8% | +7.9 bp | -68.4 bp |
| 3 years | 751 | 99.6% | +36.4 bp | -48.0 bp |
| 5 years | 247 | 99.2% | +71.7 bp | -41.5 bp |
The worst start date for all three holds is 2020-11-03, followed by 2021-02-26 and 2020-11-18, all early days when QQQM closed relatively high. The five-year sample has only 247 overlapping start dates. The win rate is 93.8% at one year and above 99% at three and five years, similar to VOO against SPY in the QQQ vs SPY, VOO and VTI comparison.
Liquidity, measured
QQQM's volume has grown fast, but it is still in a different class from QQQ.
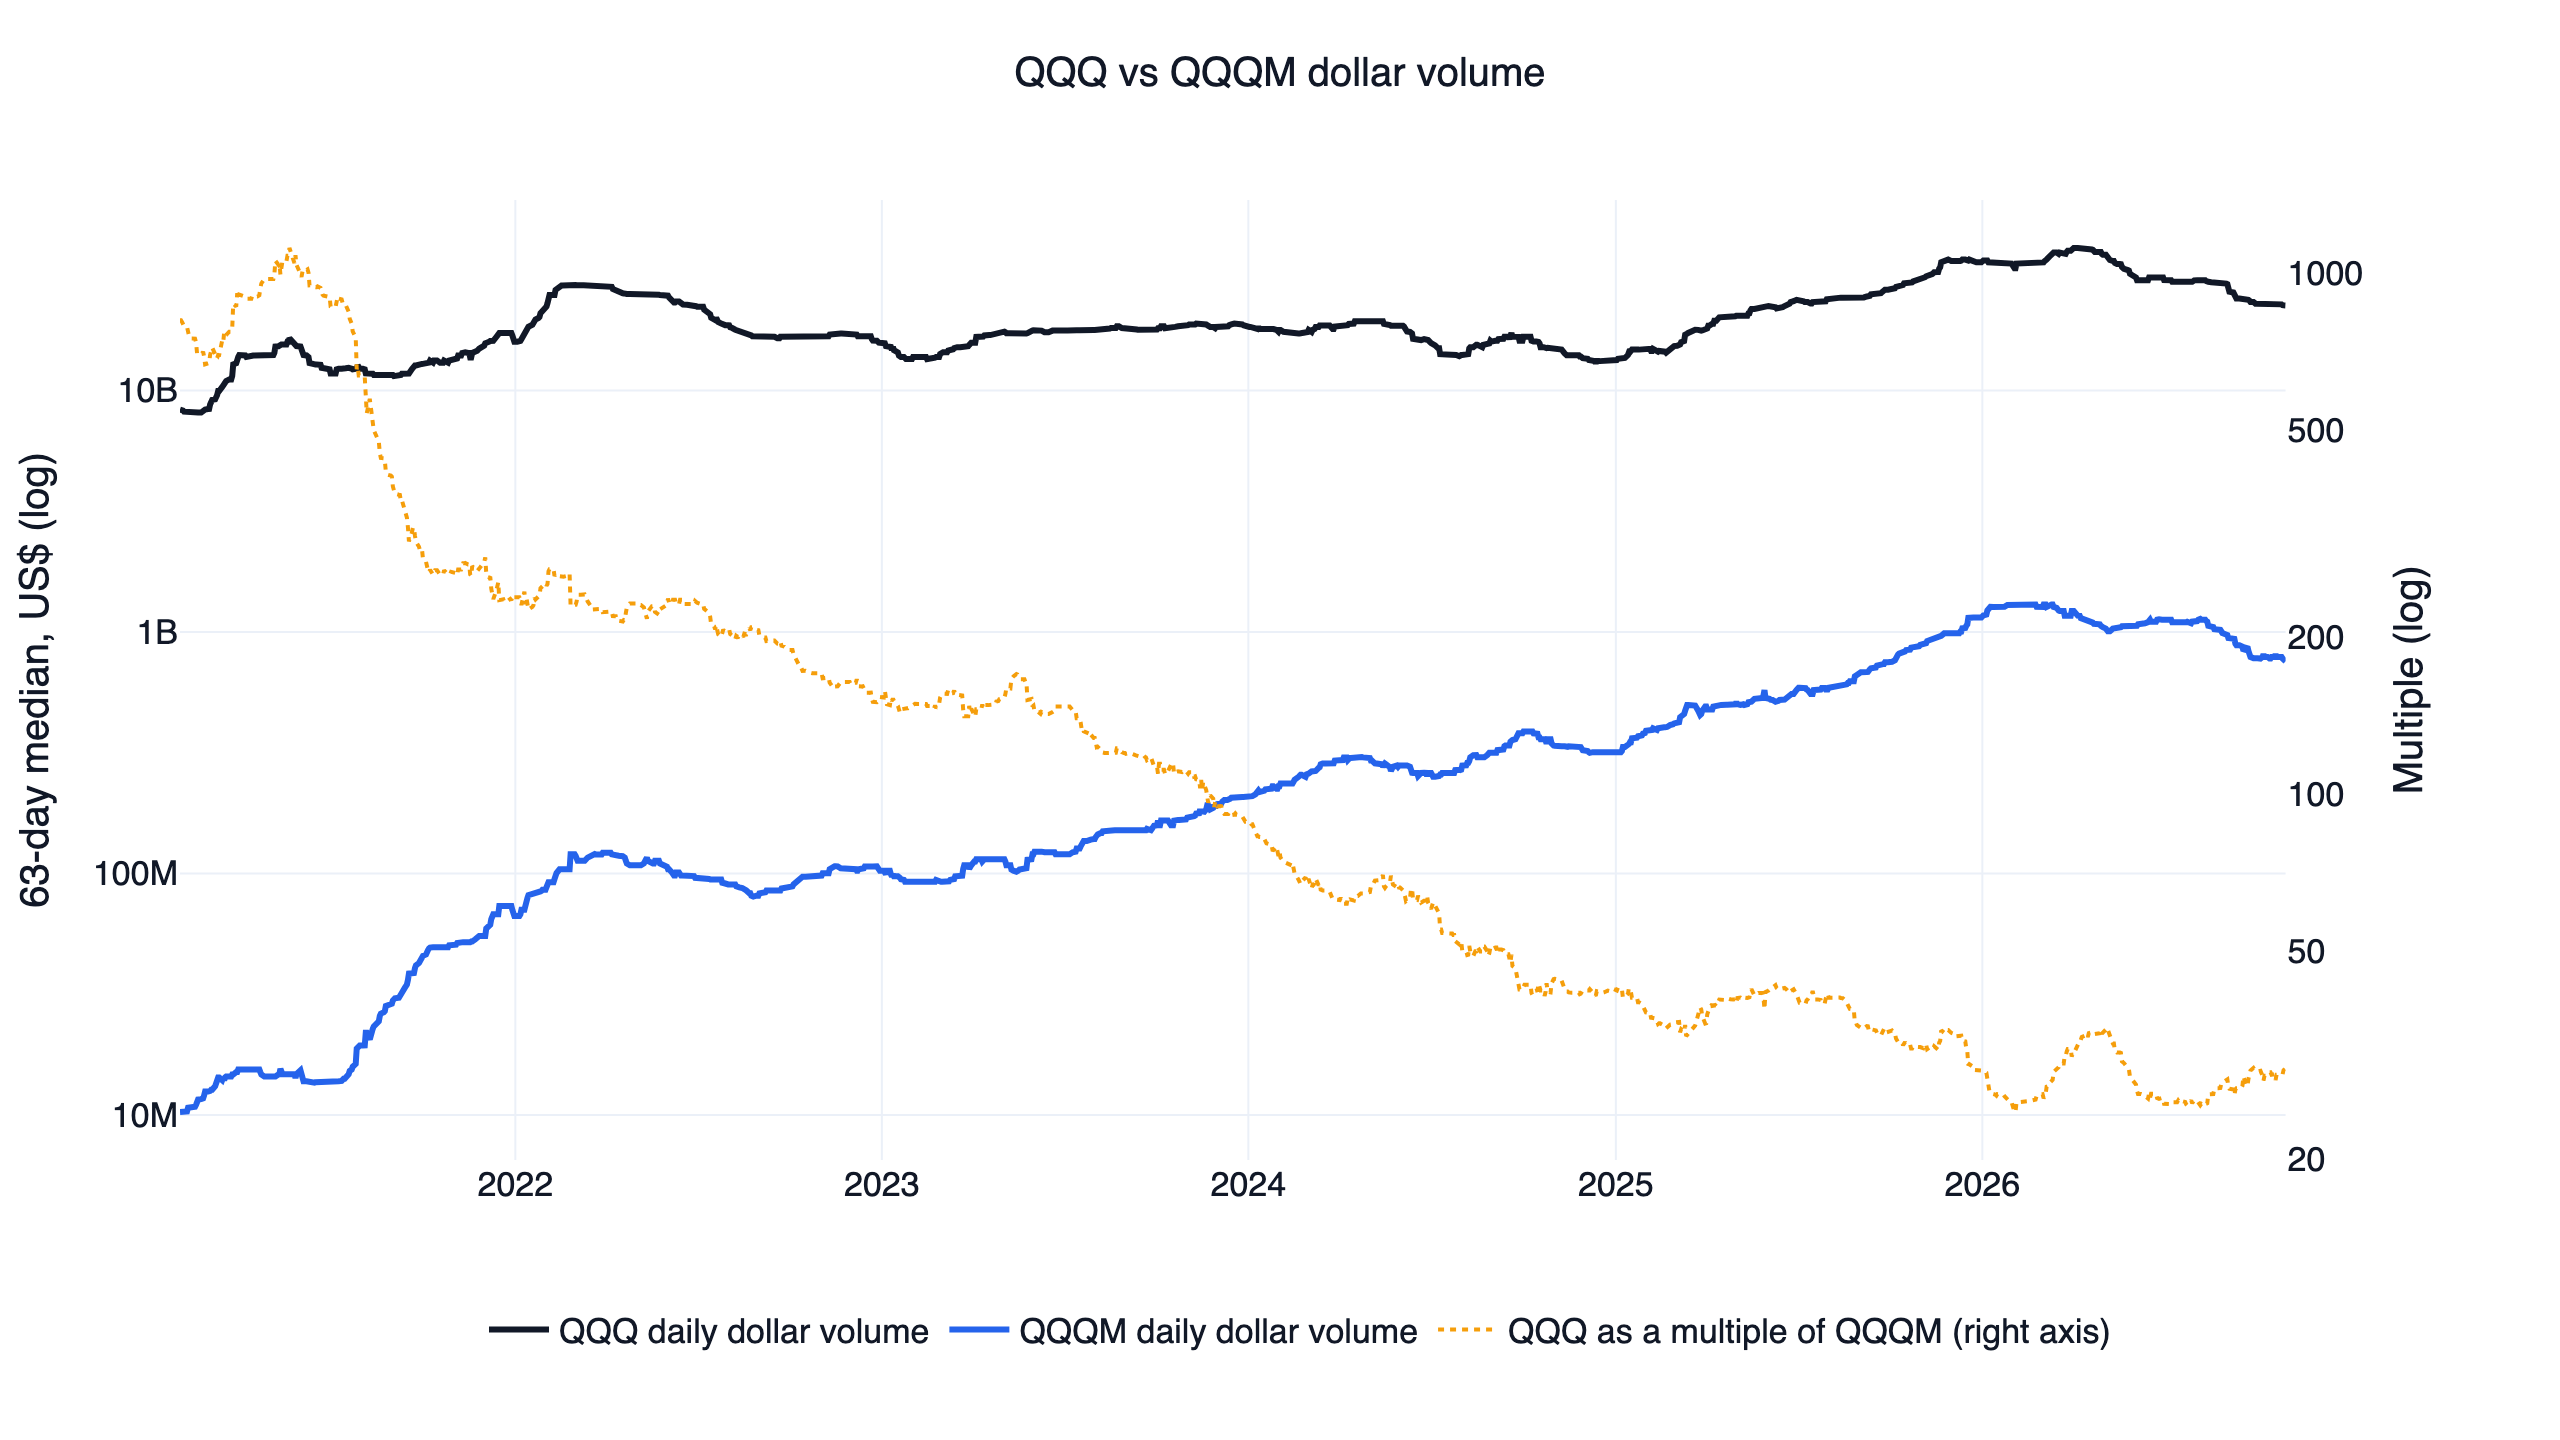
| Year | QQQ median daily dollar volume | QQQM median daily dollar volume | Multiple |
|---|---|---|---|
| 2020 (from end of October) | $8.08 billion | $8.6 million | 943 |
| 2021 | $13.3 billion | $27.2 million | 490 |
| 2022 | $19.2 billion | $98.8 million | 194 |
| 2023 | $17.5 billion | $147 million | 119 |
| 2024 | $16.0 billion | $314 million | 51 |
| 2025 | $25.1 billion | $706 million | 36 |
| 2026 to October | $28.6 billion | $1.04 billion | 28 |
How large is an order against a median day over the last year?
| Order | Share of QQQ's day | Share of QQQM's day |
|---|---|---|
| $10,000 | 0.000034% | 0.00095% |
| $100,000 | 0.00034% | 0.0095% |
| $1 million | 0.0034% | 0.095% |
| $10 million | 0.034% | 0.95% |
QQQM's quietest day of the last year still traded $412 million. Orders under $1 million are tiny in both funds. A rough price impact measure, the median of absolute daily return divided by dollar volume, gives about 0.003 bp per $1 million for QQQ and 0.07 bp for QQQM. That is 26 times larger, and both are far below 1 bp.
Share price matters too. US stocks trade in one-cent increments, and on 2026-10-30 one cent was 0.14 bp of QQQ and 0.35 bp of QQQM, so even at a one-cent spread on both, QQQM costs proportionally more to cross. FinLab's data has no bid and ask quotes, so we did not measure actual spreads or slippage. The daily high-to-low range is nearly the same (1.28% against 1.26%).
Options are not in our data either. QQQ has the deeper options market, and options traders usually stay with it.
Should you switch from QQQ to QQQM?
A switch is a one-time cost paid back by a yearly saving. At 0.1% per side, a 0.2% round trip, and today's 3 bp fee gap, it takes 6.7 years to break even. Your actual cost may be well under 0.1% per side, and the formula is simple: years to break even equals switching cost divided by the yearly gap. At a 0.05% round trip, that is about 1.7 years.
Tax is the larger item. Selling QQQ at a gain in a taxable account usually costs far more than trading. If the tax bill equals 1% of the position, that alone takes 33 years of a 3 bp gap to recover. That arithmetic holds only in accounts where selling is not taxed, such as a retirement account.
| What you care about | What the data shows |
|---|---|
| New money, long hold | QQQM is cheaper, and won over 99% of windows of three years or more |
| Small regular purchases | A $284 share is easier than a $690 share where fractional shares are not offered |
| Existing QQQ in a taxable account | The fee gap is $3 a year per $10,000; switching and tax usually cost more |
| Short-term trading, large orders | QQQ trades 28 times the dollars, and a cent is a smaller share of its price |
| Options | Not tested here; QQQ's market is deeper |
The code
This compares the two funds' total return and daily Sharpe, then computes the last year's dollar volume.
Show Code
import finlab
from finlab import data

finlab.login()  # finlab guides you through login
data.set_market("us")
data.truncate_end = "2026-10-30"

funds = ["QQQ", "QQQM"]

# 1. Prices with dividends, trading days only
prices = data.get("us_fund_price:adj_close")[funds].dropna().loc["2020-10-30":]
returns = prices.pct_change().dropna()

# 2. Total return and daily Sharpe (no risk-free rate)
total_return = prices.iloc[-1] / prices.iloc[0] - 1
sharpe = returns.mean() / returns.std() * 252 ** 0.5
print(total_return.round(4))
print(sharpe.round(3))

# 3. Median daily dollar volume over the last 252 trading days
close = data.get("us_fund_price:close")[funds].dropna()
volume = data.get("us_fund_price:volume")[funds].dropna()
dollar_volume = (close * volume).iloc[-252:].median()
print((dollar_volume / 1e9).round(2))
With data through 2026-10-30 this prints total returns of 1.6548 for QQQ and 1.6606 for QQQM, daily Sharpes of 0.843 and 0.849, and dollar volumes of 29.48 and 1.05 (US$ billion). The full research.py covers the nine windows, both halves, the switching simulation and distribution timing.
Install the FinLab skill for your AI agent
You do not need to write the code yourself. Install the FinLab skill in Claude Code, Codex or Gemini CLI with one command:
Show Code
npx skills add koreal6803/finlab-ai --skill finlab -g -yThen ask your agent in plain language, for example "compare VOO and IVV the same way" or "how long would a switch from SPY to VOO take to break even?". The AI agent setup page walks through each tool, the AI-assisted setup connects your FinLab account, and the same research runs in the browser at studio.finlab.finance.
Backtest method and limits
| Item | Choice |
|---|---|
| Window | QQQM listed on 2020-10-13; returns run from 2020-10-30 to 2026-10-30. That is six years, including the 2022 bear market, and not a full cycle. |
| Data | us_fund_price adj_close, close and volume, and us_fund_corporate_actions for distributions, with holiday rows removed. Data through 2026-10-30, rerun 2026-11-01. |
| Costs | Holding comparisons have no trading costs; expense ratios are already in the prices. The switching simulation uses 0.1% per side. |
| Slippage, spreads | Not measured; FinLab's data has no bid and ask quotes. |
| Closing prices | Market closes and not net asset value, so short-term gaps include premiums and discounts, especially in QQQM's first weeks. |
| Look-ahead | Buy and hold has no signal, so look-ahead bias does not apply. |
| Turnover | None; buy and hold. |
| In and out of sample | The whole period is in-sample. Both funds track one index and the gap comes from cost and structure, not from a fitted signal. |
| Expense ratios | Issuer documents checked in November 2026: QQQ, QQQM. Later changes will be in fund notices. |
What this result does and does not say
- QQQM and QQQ track one index. QQQM earned 0.04% to 0.10% a year more, mainly from the fee gap; our data cannot separate any effect of QQQ's old structure.
- With the conversion the fee gap is only 3 bp, so the future gap may be smaller than the past one.
- QQQ's liquidity is far larger, and for ordinary order sizes both funds have plenty.
- A decision to switch turns on tax first and fees second.
- This study does not cover bid and ask spreads, options, short selling or securities lending income.
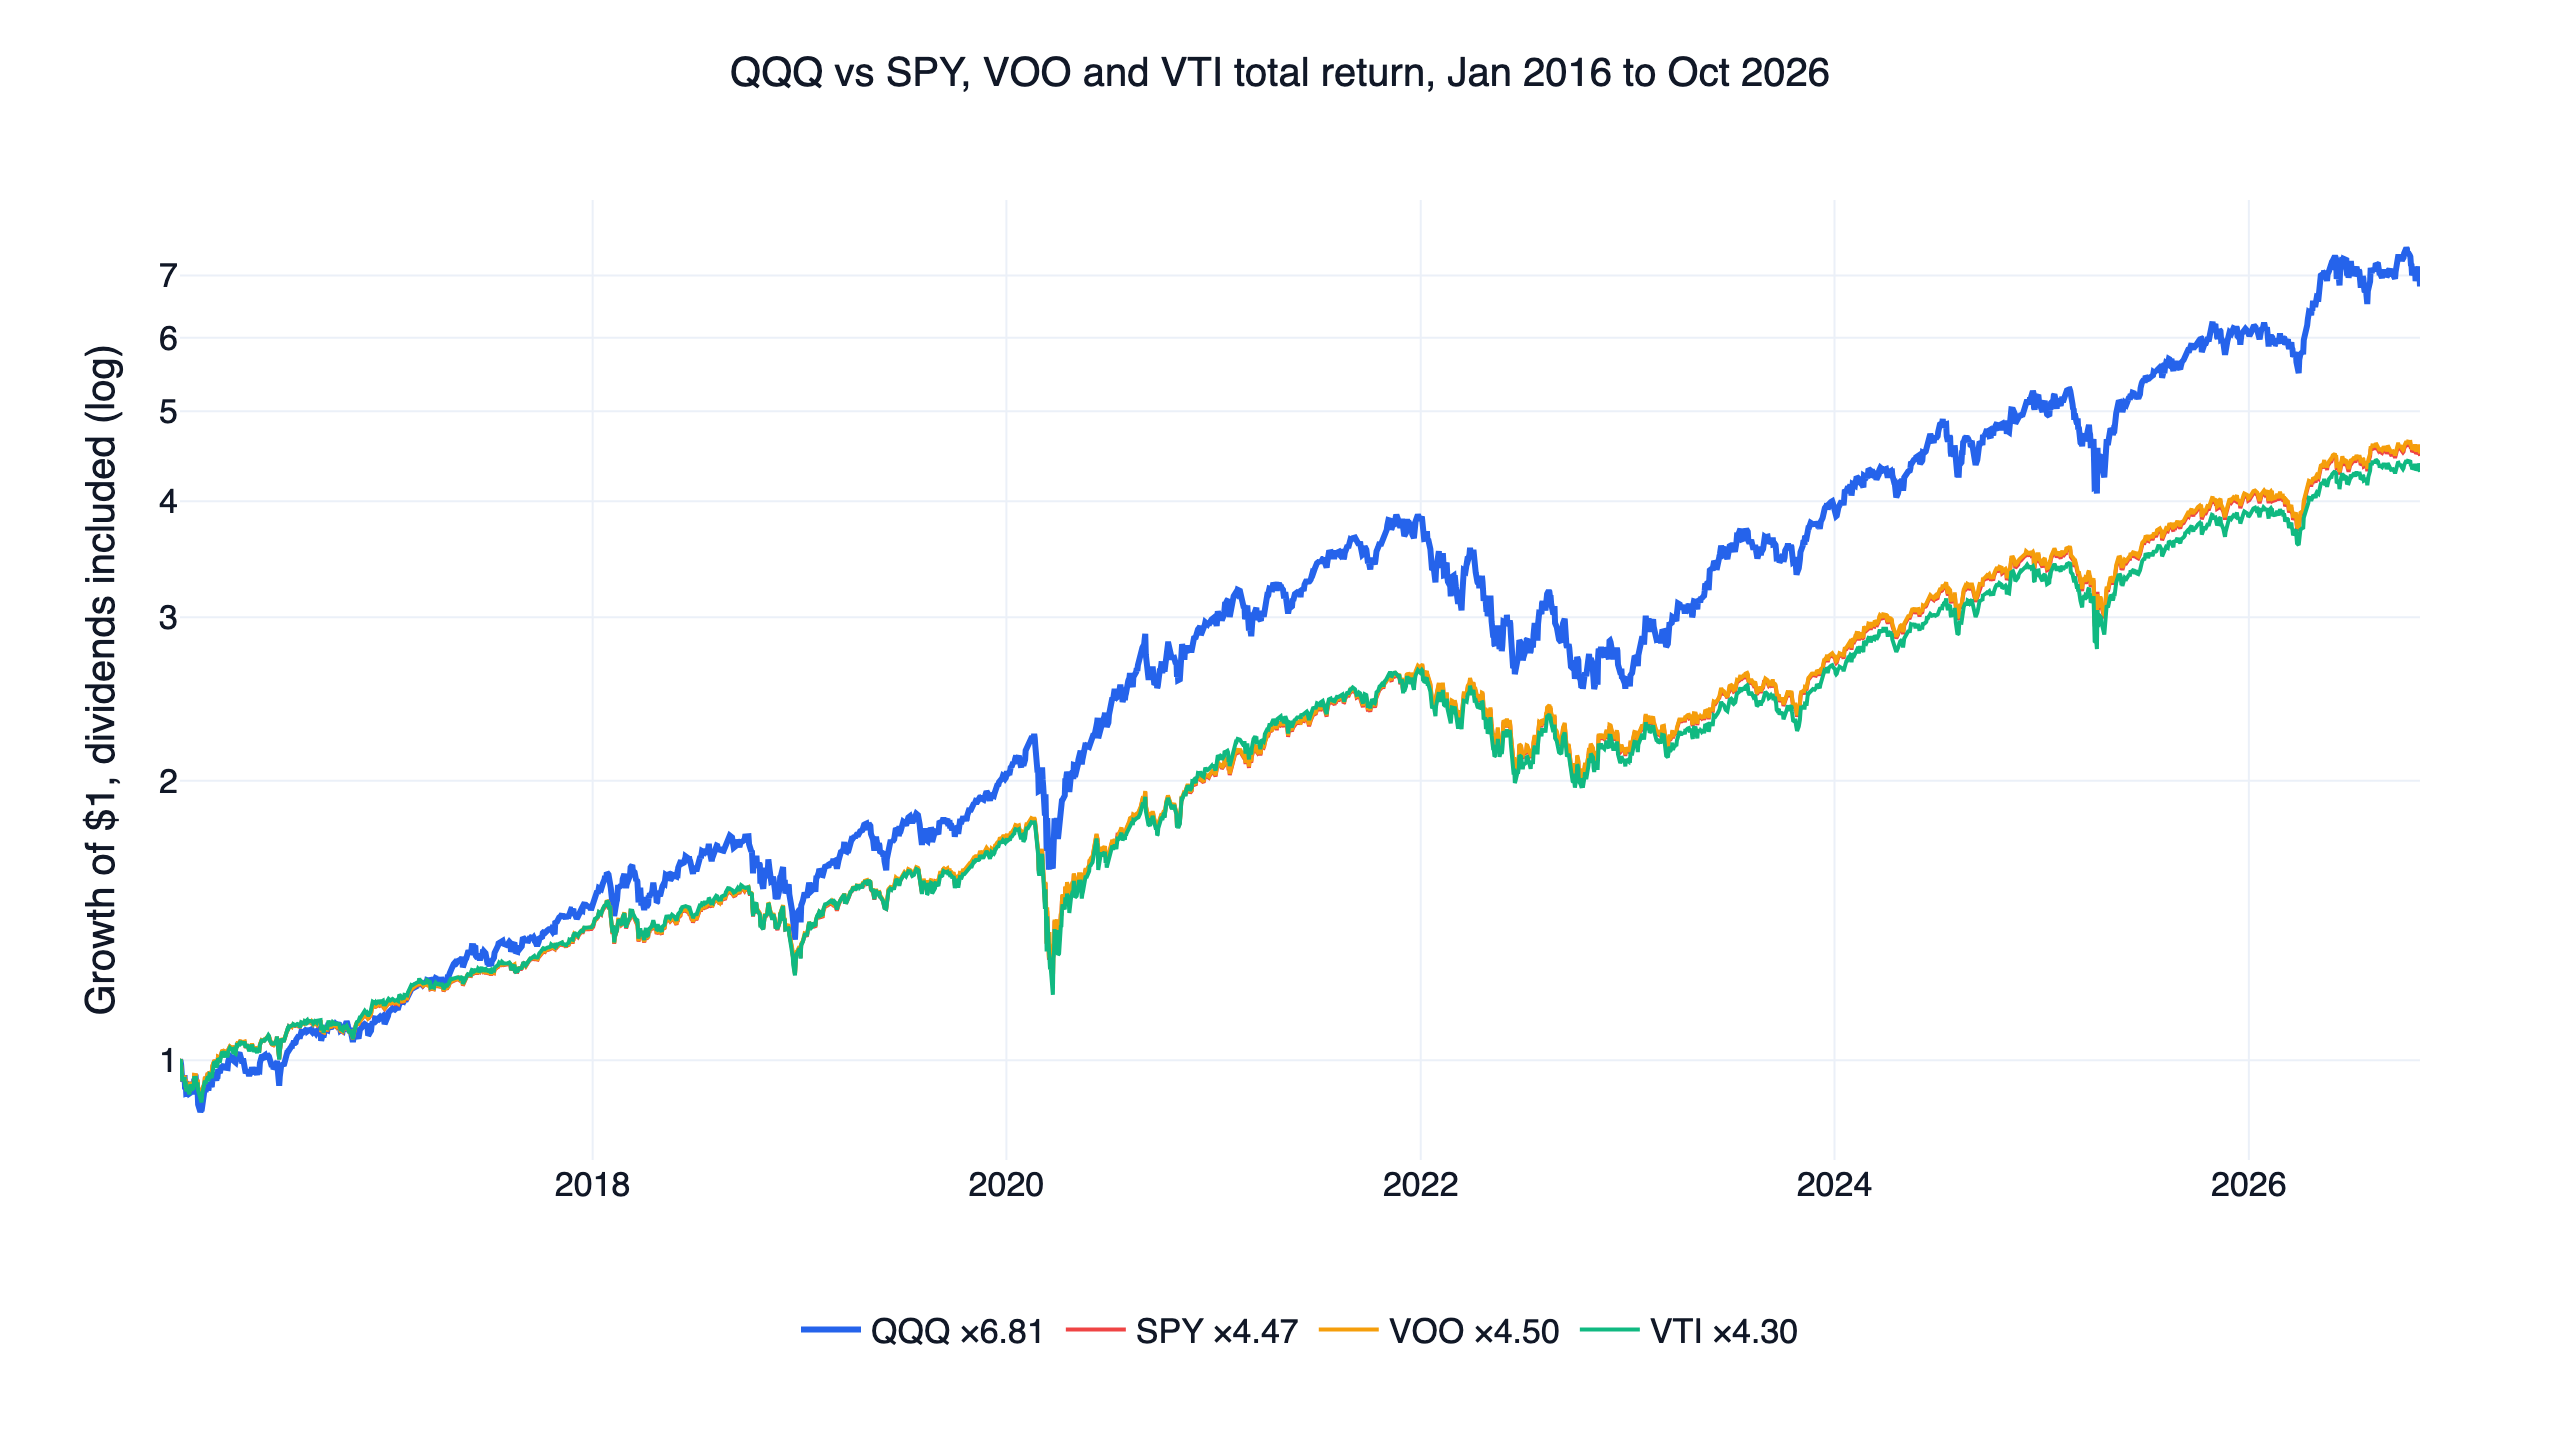
To compare different indexes, see QQQ vs SPY, VOO and VTI. For other ways to hold the Nasdaq-100, see volatility targeting, leveraged ETF timing and covered call ETFs.
FAQ
Is QQQM or QQQ better?
They track the same index. QQQM charges 0.15% and QQQ 0.18%, and over six years QQQM earned 0.04% to 0.10% a year more. Over these six years QQQM's total return was slightly higher; for short-term trading, large orders or options, QQQ's liquidity is better.
Is QQQM the same as QQQ?
In holdings and returns, nearly: their daily correlation is 0.99928. They differ in fees, liquidity and options: QQQ trades 28 times QQQM's dollars.
Should I switch from QQQ to QQQM now that QQQ has converted?
The conversion cut the fee gap from 5 bp to 3 bp and sped up distributions, so QQQM's edge is smaller. Switching costs money and possibly tax: at a 0.2% round trip it takes 6.7 years to break even.
Is QQQM liquid enough?
Its median daily dollar volume over the last year was $1.05 billion and its lowest day was $412 million. A $1 million order is about 0.095% of a median day. That is plenty for individuals; orders of $10 million or more deserve more care.
Why is QQQ's share price higher than QQQM's?
QQQ has compounded since 1999, while QQQM listed in 2020 at a lower price. The share price does not change the return. It only changes the cost of one share and how large one cent is relative to the price.
Do QQQM and QQQ pay the same dividend?
Nearly: the trailing yield is 0.46% against 0.45%, in the same months. QQQM pays about 4 days after the ex-date; QQQ's three payments in 2026 took 4, 18 and 17 days.
Can I rerun this myself?
Yes. Install FinLab through the AI-assisted setup and run the research.py below, or compare other ETFs in conversation at FinLab Studio. The backtesting guide and quant trading overview cover the basics, and more US research is in the US quant trading strategies overview.
Reproduce it yourself
- research.py: the nine windows, both halves, the switching simulation, tracking, rolling windows, liquidity and distribution timing.
- data.csv: daily total-return equity of both funds, QQQM's cumulative lead and daily dollar volume.
- metrics.json: every statistic quoted here.
Last updated: 2026-11 | Backtest window: 2020-10 to 2026-10 | Benchmark: QQQ total return | Author: FinLab Quant Research (reviewed by a quantitative researcher)
Past performance does not represent future results, and every result here is an in-sample backtest. The funds named are used to describe research results, not as recommendations. Consult a professional about your own taxes. This content is for education only and does not constitute investment advice.
FinLab AI
Want to build your own strategy?
Describe your stock-picking ideas in natural language. AI automatically validates, backtests, and gives you answers
Start Free