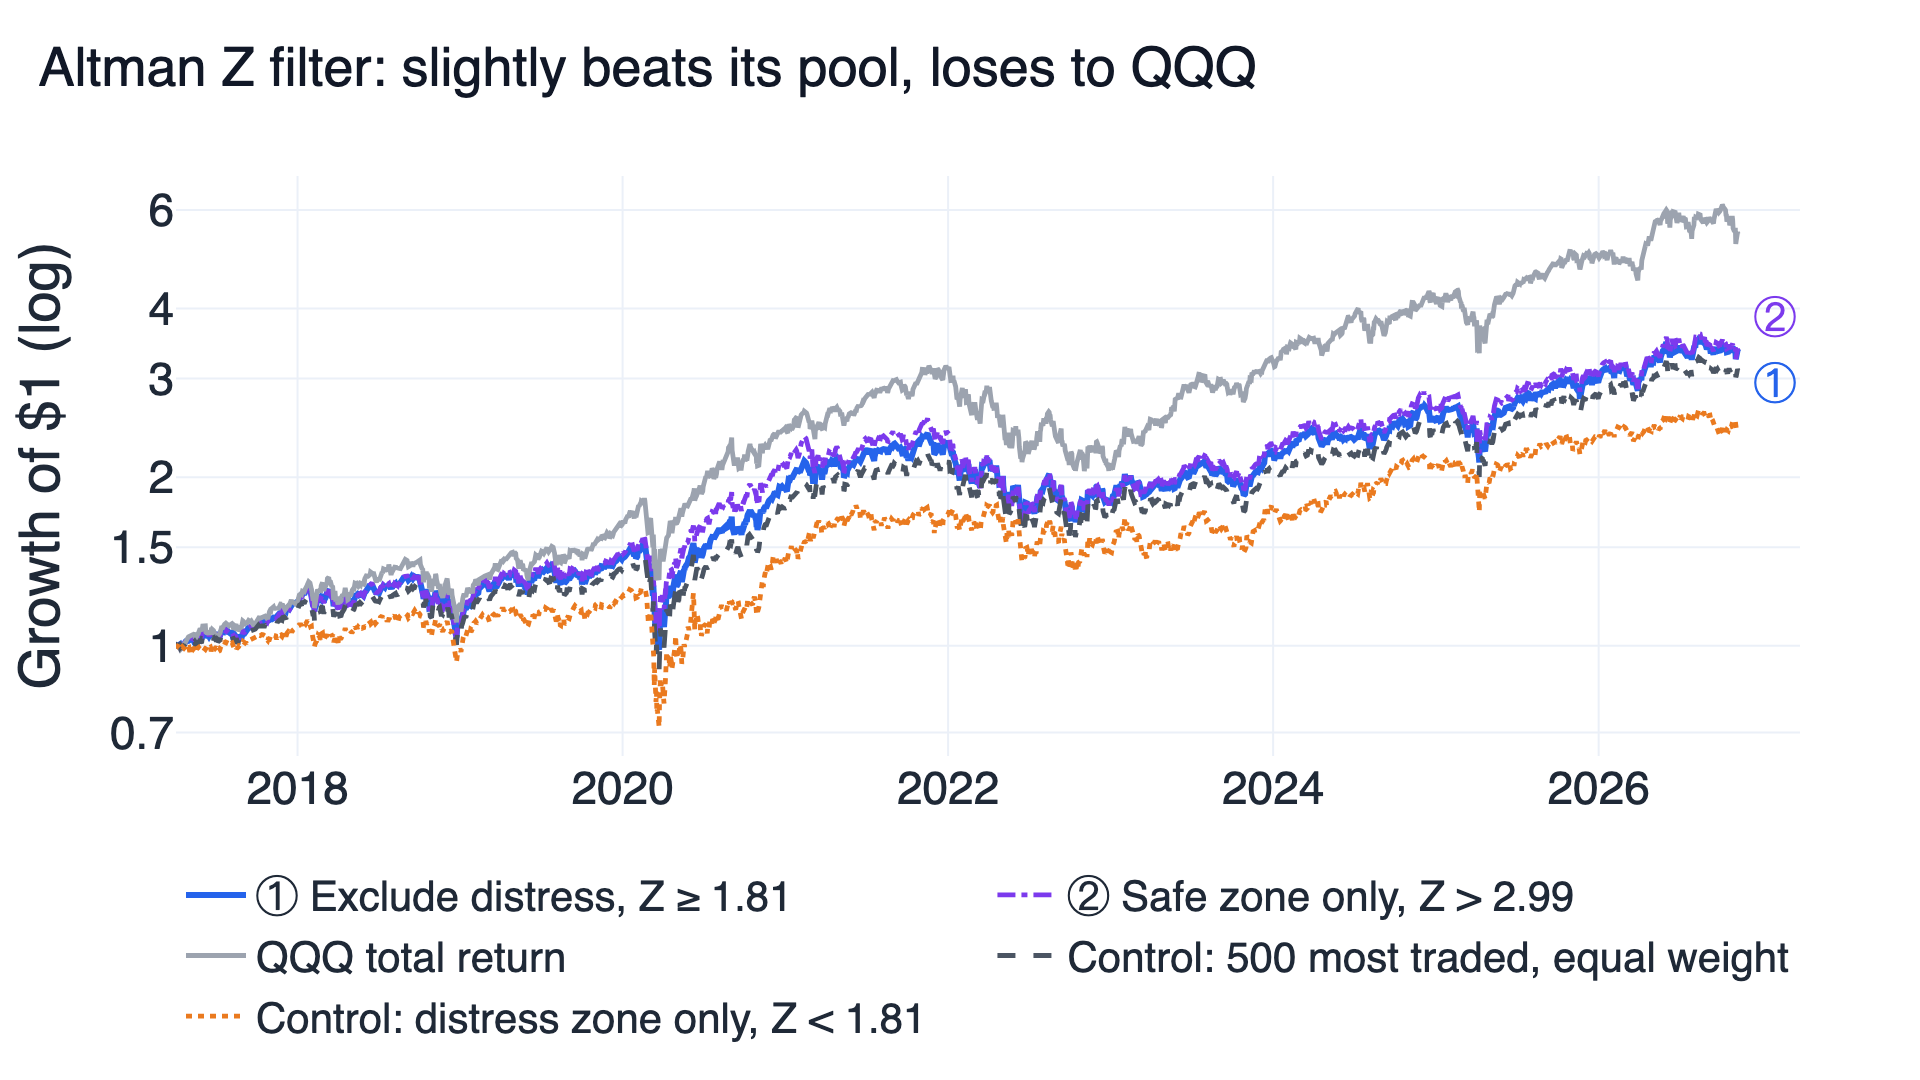
Neither Altman Z-score filter passes validation. Holding the 500 most traded non-financial US stocks except those in the distress zone (Z below 1.81) returned 13.4% a year with daily Sharpe 0.73 from 2017-04-03 to 2026-11-10, and holding only the safe zone (Z above 2.99) returned 13.5% with 0.71. Both beat the same pool held equally (12.5%, 0.69) but lost to QQQ, the Nasdaq-100 ETF of mostly large US technology companies (19.3%, 0.88), in all 18 settings.
The score does separate weak companies. Stocks in the distress zone returned 10.0% a year with a Sharpe of 0.56, trailed the pool in 8 of 10 calendar years and fell 43.5% in the 2020 crash. Removing them helps a little; it does not make a diversified basket of US stocks beat QQQ.
These trading rules are research results. To rerun the experiment, set up FinLab and download the research program (.py). Other files are in the research downloads.
What the Altman Z-score measures
The Altman Z-score is a bankruptcy score published by Edward Altman in 1968. Altman (1968) compared manufacturers that had gone bankrupt with similar ones that had not, and found the weighted combination of five financial ratios that best separated the two groups. A low score means a company looks more like the ones that failed.
| Term | Ratio | Weight | What it captures |
|---|---|---|---|
| Liquidity | Working capital / total assets | 1.2 | Current assets left after current liabilities |
| Accumulated profit | Retained earnings / total assets | 1.4 | Profits kept over the company's life; young or loss-making firms score low |
| Operating profit | EBIT (last four quarters) / total assets | 3.3 | How much the assets earn before interest and tax |
| Market cushion | Market value / total liabilities | 0.6 | How far the share price can fall before debts exceed equity value |
| Asset turnover | Revenue (last four quarters) / total assets | 1.0 | Sales generated per dollar of assets |
Z = 1.2 × liquidity + 1.4 × accumulated profit + 3.3 × operating profit + 0.6 × market cushion + 1.0 × asset turnover.
Altman's original cut-offs are still the ones people quote. Below 1.81 is the distress zone, above 2.99 the safe zone, and between them a grey zone where the score could not tell the two groups apart. The weights were fitted to manufacturers, so banks, insurers and other financial companies are excluded here: their balance sheets are mostly financial assets and debts, which makes the liquidity and turnover ratios meaningless.
Why expect the score to matter for returns? Riskier companies might be expected to pay investors more. The evidence went the other way. Dichev (1998) found that companies with high bankruptcy risk, measured with the Z-score among other models, earned lower returns than safer ones, and Campbell, Hilscher and Szilagyi (2008) found the same "distress anomaly" with a more detailed failure model. If that still holds, dropping distressed stocks should improve a portfolio.
The two filters, fixed before the run
At the start and at the last trading day of each quarter, the rule takes the most traded non-financial US stocks with a computable Z-score and holds every one that passes the filter, with equal weights.
| Design | Rule | Settings tested (original in bold) |
|---|---|---|
| ① Exclude distress | Hold the pool except stocks with Z below T | T 1.5 / 1.81 / 2.1 × pool 200 / 500 / 1,000 stocks (9) |
| ② Safe zone only | Hold only stocks with Z above T | T 2.5 / 2.99 / 3.5 × pool 200 / 500 / 1,000 stocks (9) |
The original thresholds are Altman's; the neighbors sit about 0.3 away for filter ① and 0.5 away for filter ②. The grids and the pass rules were fixed before any return was calculated. Two reference portfolios that are not part of the pass rules are shown for comparison: the whole pool held equally, and the distress zone alone.
Results
| Measure | ① Exclude distress | ② Safe zone only | Control: pool | Control: distress zone | QQQ |
|---|---|---|---|---|---|
| Verdict | ✗ Failed | ✗ Failed | Control | Control | Benchmark |
| Annual return (CAGR) | 13.4% | 13.5% | 12.5% | 10.0% | 19.3% |
| Daily Sharpe (return per unit of risk) | 0.726 | 0.709 | 0.691 | 0.558 | 0.880 |
| Worst fall (max drawdown) | -35.2% | -34.5% | -37.2% | -43.5% | -35.1% |
| Settings beating QQQ | 0 of 9 | 0 of 9 | — | — | — |
| Stocks held on average | 378 | 272 | 500 | 122 | — |
① holds the pool minus the distress zone (Z ≥ 1.81); ② holds only the safe zone (Z > 2.99). The pool is the 500 most traded non-financial stocks with a score, held equally.
CAGR is the average yearly growth rate. Daily Sharpe measures return per unit of day-to-day volatility: the mean daily return divided by its standard deviation, times the square root of 252, with no risk-free rate, following Sharpe (1994) with the rate set to zero. The first half ends on 2022-01-18; the second starts on 2022-01-19.
The embedded FinLab report is filter ① with its original setting. Its comparison line is the S&P 500 without dividends, an easier hurdle than the QQQ total return used in this article; the report's own grades are measured against that line and do not mean the rule passed the checks here, and its own Sharpe convention can differ slightly from the table.
On average 24.3% of the 500-stock pool was in the distress zone, 21.3% in the grey zone and 54.4% in the safe zone. A quarter of the most traded US companies scoring as "distressed" is a reminder that the 1968 cut-offs were set for a different economy: asset-light software firms and companies with large buybacks can have low retained earnings or thin working capital without being close to failure.
Nearby settings
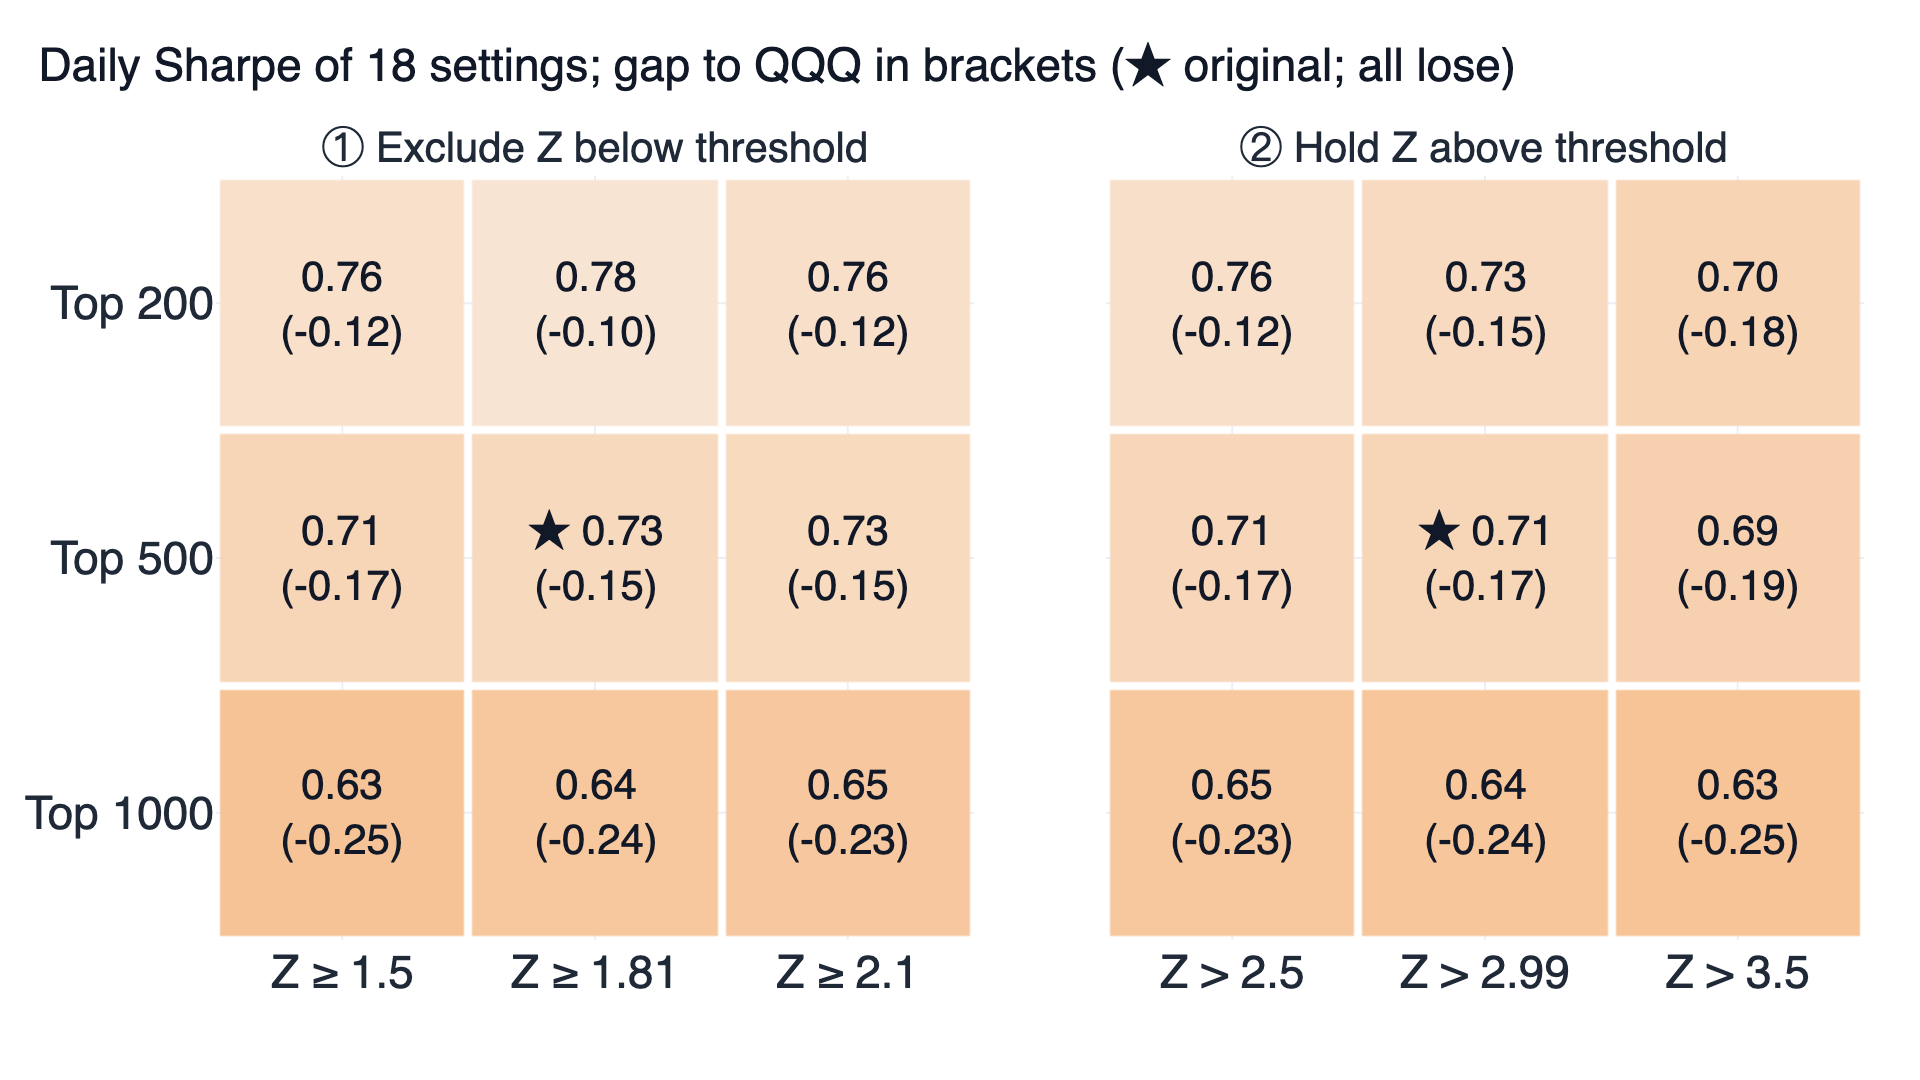
All 18 cells trail QQQ, by 0.10 to 0.25. The threshold barely matters: within each pool size the three thresholds are within 0.06 of each other. Pool size matters more. The 200 most traded stocks do best (Sharpe 0.70 to 0.78) and the 1,000 most traded worst (0.63 to 0.65): the larger pools add less traded, generally smaller companies, and adding them pulled the result down.
The validation checks
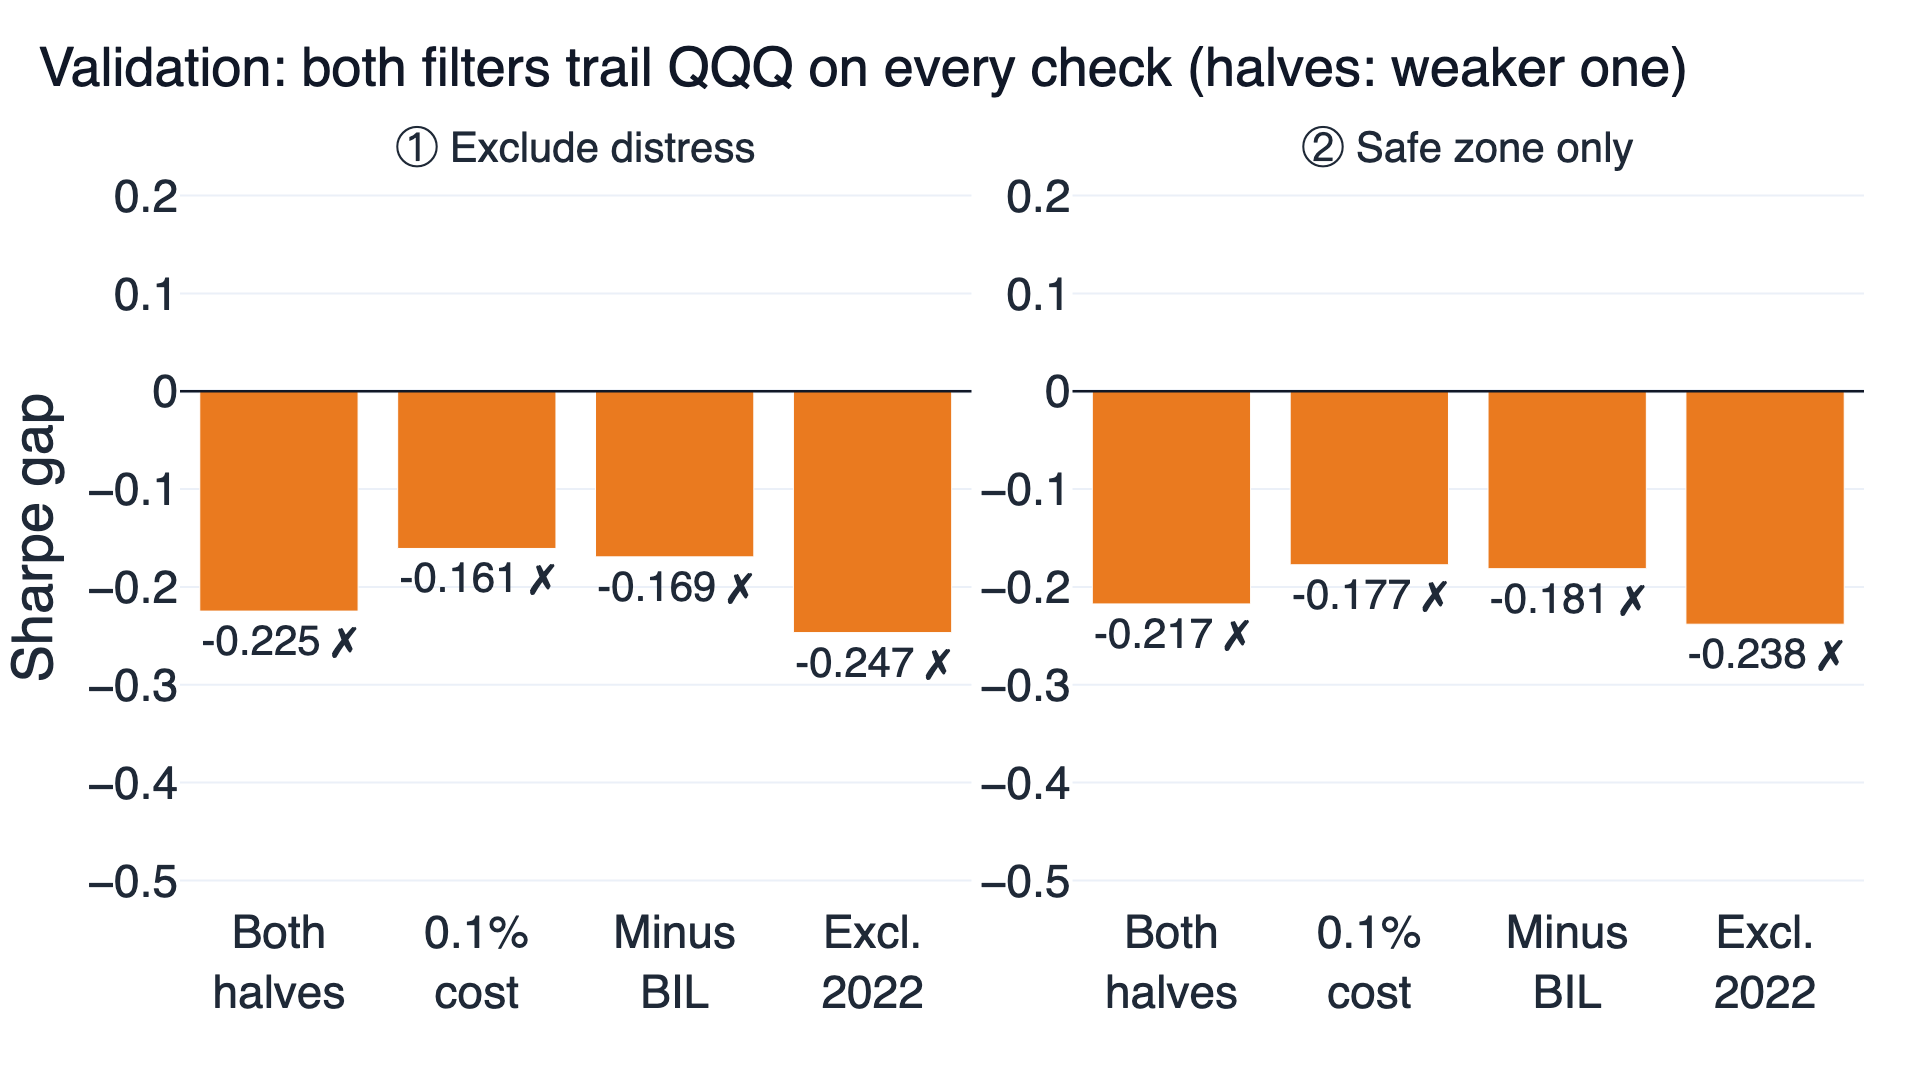
BIL is an ETF of 1–3 month US Treasury bills; subtracting its return shows what a portfolio earned above cash.
| Check | ① Exclude distress | ② Safe zone only | QQQ |
|---|---|---|---|
| 70% of 9 settings beat QQQ | 0 of 9 ✗ | 0 of 9 ✗ | — |
| Both halves beat QQQ (first / second) | 0.862 / 0.583 ✗ | 0.869 / 0.547 ✗ | 1.087 / 0.677 |
| 0.1% cost per side, Sharpe | 0.719 ✗ | 0.702 ✗ | 0.880 |
| Returns minus BIL, Sharpe | 0.606 ✗ | 0.594 ✗ | 0.776 |
| Without the year of largest lead (2022) | 0.977 ✗ | 0.985 ✗ | 1.223 |
Both filters fail every check. The cost run hardly matters, because a quarterly Z-score filter replaces only 11% to 14% of the portfolio's weight per rebalance; the bigger gap is to QQQ itself.
Distress stocks did lag
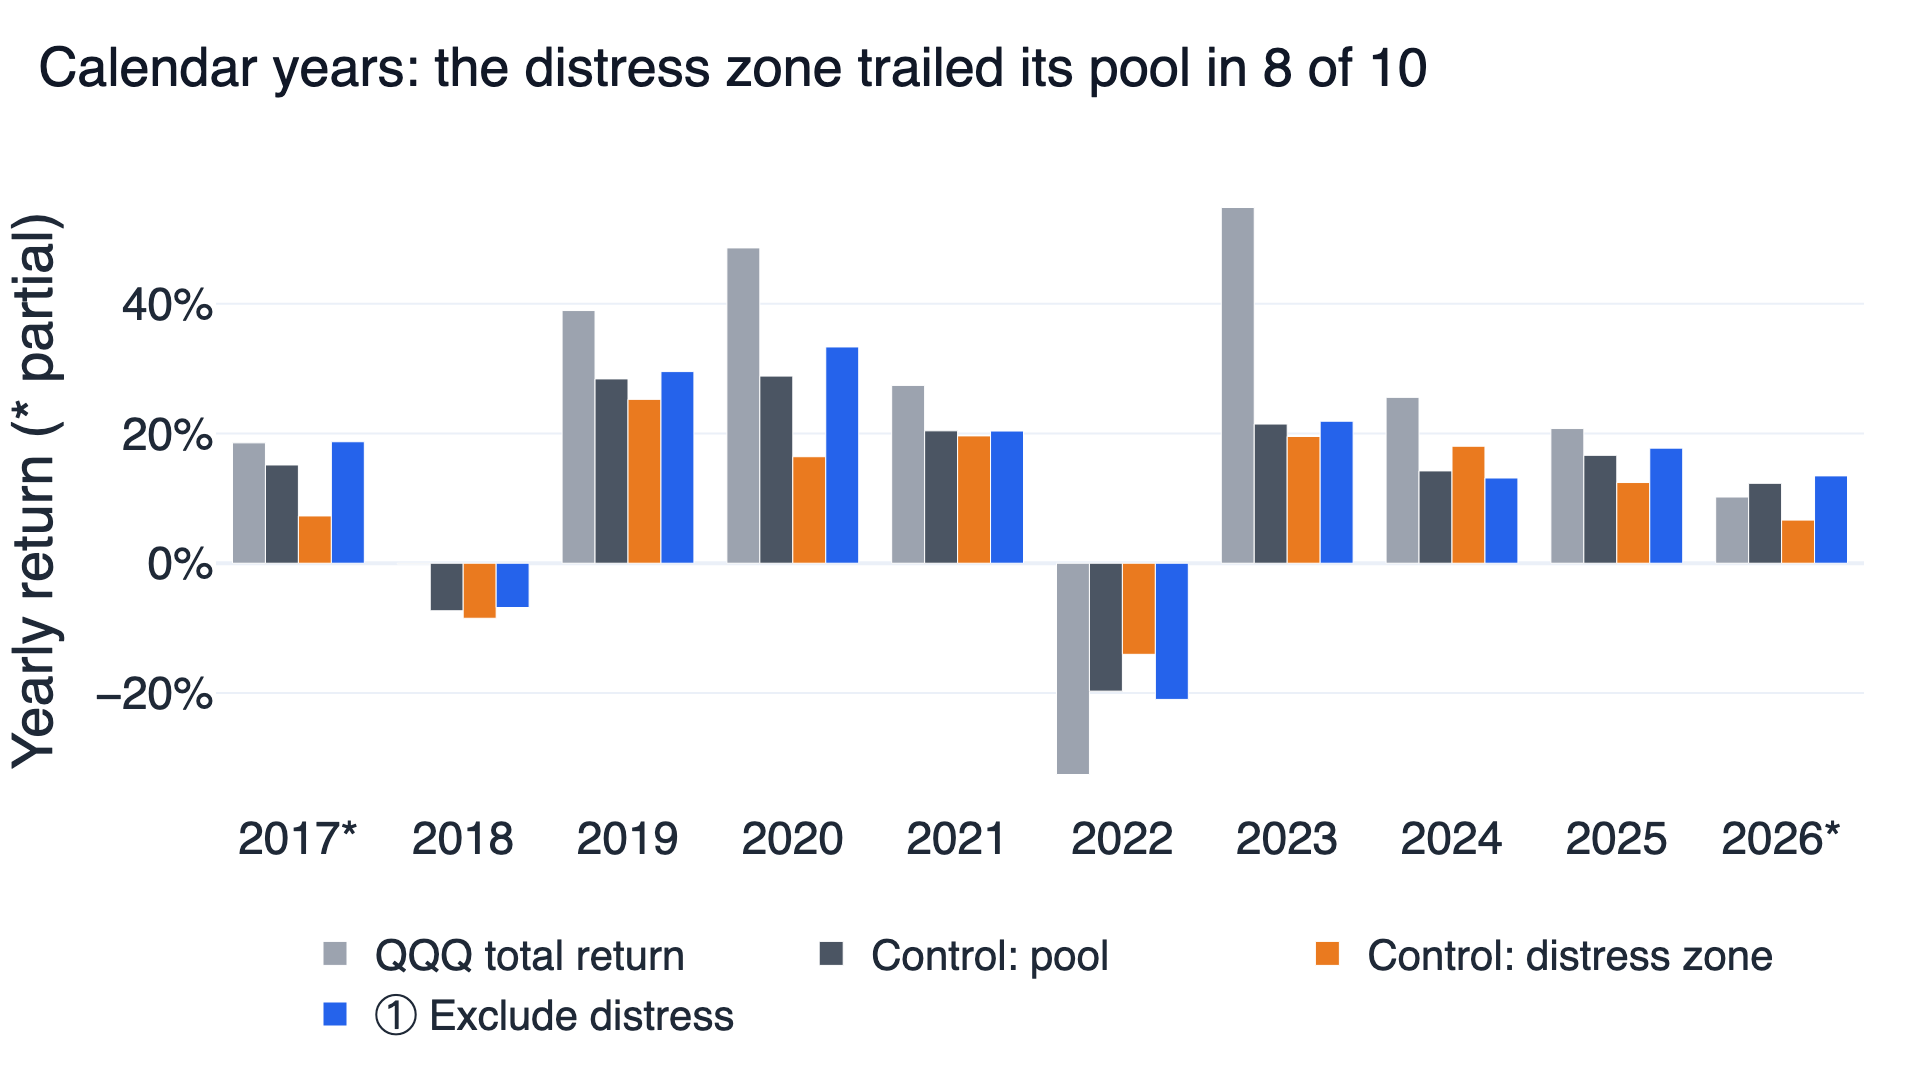
The distress-zone portfolio trailed the pool in 8 of the 10 calendar years (2017 and 2026 are partial). That is the pattern Dichev and Campbell and colleagues found, still visible two decades after Dichev's sample. The two exceptions were 2022 and 2024. In 2022, when QQQ fell 32.6%, the distress zone lost 14.0% and the pool 19.7%.
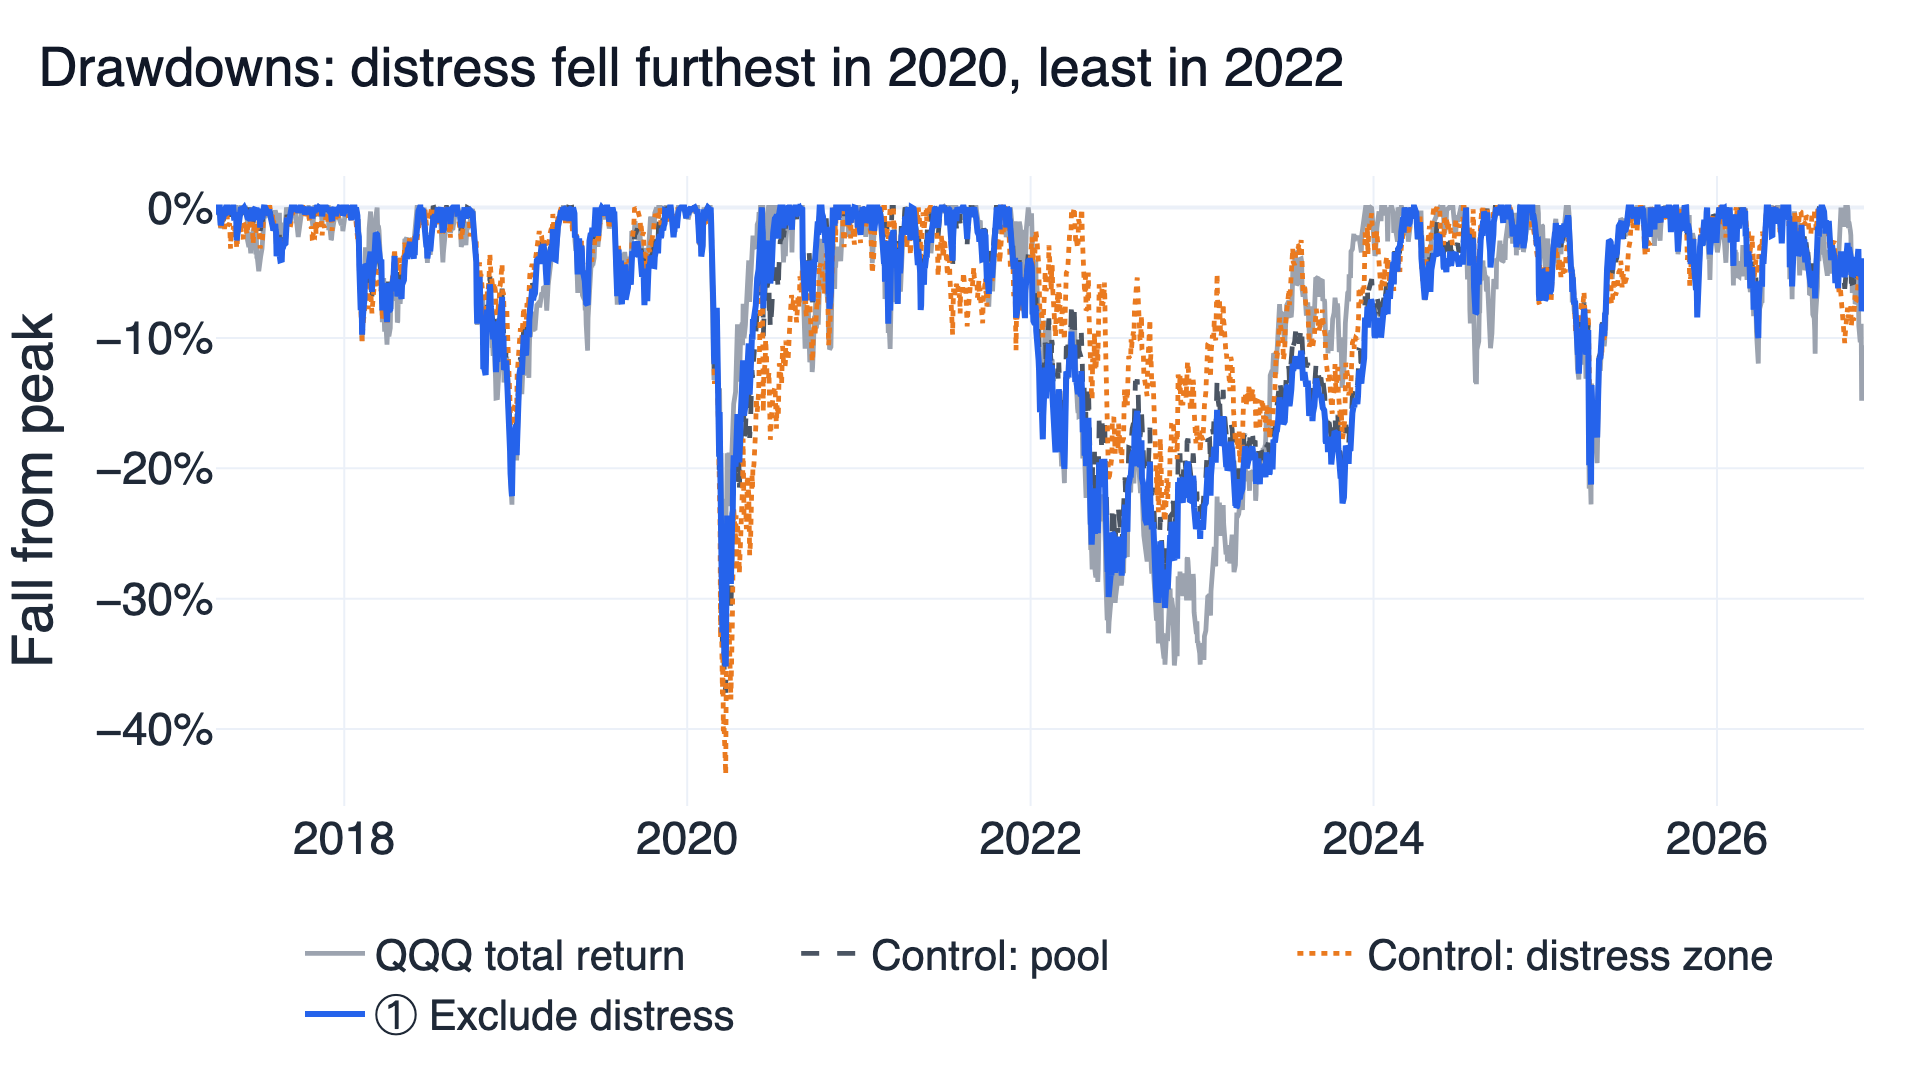
The drawdown chart shows both sides. From their February 2020 highs to their March lows, the distress zone fell 43.5%, the pool 37.2%, filter ① 35.2% and QQQ 28.6%. In the 2022 decline the order reversed: within that year the distress zone's deepest fall was 24.1%, against 26.5% for the pool, 27.5% for filter ① and 34.8% for QQQ.
Why removing weak companies did not beat QQQ
Removing the distress zone raised the pool's return from 12.5% to 13.4% and its Sharpe from 0.69 to 0.73. That is the improvement the papers predict, and about the size one would expect from dropping a quarter of the stocks when that quarter lags the rest by about three points a year (10.0% against 13.4%).
QQQ is a different kind of portfolio. It weights the Nasdaq-100 by market value, so a handful of very large technology companies drive its return. An equal-weighted basket of about 270 to 380 stocks across all non-financial sectors does not share that concentration, which is the most likely reason a filter of this kind stays far behind. Over this decade the gap between QQQ and the filtered portfolio, about six points a year, was much larger than anything a balance-sheet filter could close. The Z-score answers "which companies might fail?", which is a useful question for avoiding losses, but not the question that decided returns in this period.
How the test was run
- Universe: US common stocks, delisted ones included, one share class per company, no ETFs, funds or ADRs, and no financial companies (by the current company profile's sector). On each rebalance day a stock must close above $5, trade more than $5 million a day on average over 60 days, have had no daily move of 50% or more in the past year, and have a computable Z-score. The 200, 500 or 1,000 most traded of these form the pool.
- Look-ahead: balance sheet and income statement values are used from the date the quarterly report was filed. EBIT and revenue are the sum of the last four quarters, and the score needs all four. Market value is FinLab's
etl:us_market_value, the most recently reported quarterly share count times the close with later splits taken out, so the market term updates every day while the accounting terms update when a report is filed. Trades happen at the close after the rebalance day. - Survivorship: delisted companies stay in the data until their last price. The financial-sector exclusion uses today's company profile, a present-day snapshot.
- Weights and turnover: equal weight across every stock that passes, rebalanced quarterly; about 11% (①) and 14% (②) one-way turnover per rebalance.
- Costs and slippage: zero commission by default, with a separate run at 0.1% per side. No capacity or market-impact estimate.
- Data: results from 2017-04-03 to 2026-11-10, run on 2026-11-12 with finlab 2.3.8. Company profiles change daily, so a rerun on a later day can give slightly different numbers.
- Limits: in sample only, with no out-of-sample period. Bailey and colleagues (2017) explain why a single backtest overstates future results; no overfitting probability is estimated.
Reproduce the filter with an AI agent
Set up the FinLab skill for Claude Code, Codex or Gemini CLI with the FinLab setup flow; the agent guide explains how it works. The direct install command is:
Show Code
npx skills add koreal6803/finlab-ai --skill finlab -g -yFinLab Studio runs the same research in a browser. A good first request: "Download the Altman Z research program, run filter ① with its original setting, and list the companies in the distress zone at the latest rebalance."
Download the research program as research.py; it also contains the buy-the-dip and buyback tests. This excerpt computes the score and rebuilds filter ①. Login is handled by FinLab.
Show Code
import finlab
import numpy as np
from finlab import data
from research import use, z_pool, on_rebalance, rebalance_days, backtest

finlab.login()
use("us")

def balance(field):
    return data.get("us_balance_sheet:" + field)

def last_four_quarters(field):
    return data.get("us_income_statement:" + field).rolling(4, min_periods=4).sum()

assets = balance("total_assets")
accounting = (1.2 * (balance("total_current_assets") - balance("total_current_liabilities"))
              + 1.4 * balance("retained_earnings")
              + 3.3 * last_four_quarters("ebit")
              + 1.0 * last_four_quarters("revenue")) / assets
z = on_rebalance(accounting + 0.6 * data.get("etl:us_market_value") / balance("total_liabilities"))
z = z.where(np.isfinite(z))

# The 500 most traded non-financial stocks with a score, minus the distress zone
position = z_pool(500) & (z >= 1.81)
report = backtest(position, rebalance_days())
Questions about the Altman Z-score
What is a good Altman Z-score? Above 2.99 is Altman's safe zone and below 1.81 his distress zone. In this test 54% of the most traded non-financial US stocks were in the safe zone on an average rebalance day and 24% in the distress zone.
Does the Z-score predict bankruptcy for today's companies? It was built on manufacturers that went bankrupt between 1946 and 1965. It still ranks weak balance sheets, as the distress zone's returns show, but its cut-offs flag many healthy asset-light companies, so treat it as a ranking rather than a verdict.
Can it be used for banks? No. Financial companies were excluded because their balance sheets make the ratios meaningless; Altman later published versions for other kinds of firms.
Should I sell a stock that falls into the distress zone? This study tests portfolios of hundreds of stocks, not single companies. The distress zone lagged on average, with plenty of exceptions in both directions.
How is the Z-score different from the Piotroski F-score? The F-score counts nine signals of improving profitability and balance sheet; the F-score study tested it on S&P 500 stocks with a similar outcome against QQQ.
Where can I compare other quality filters? The quality and value strategy combines profitability with valuation, and the quality and low-volatility ETF comparison tests the fund versions against QQQ.
The US strategy overview lists validated rules alongside negative results like this one. The factor investing guide explains how factor portfolios are built and compared, the academic factors study tests ten other classic factors, and the stock buyback study from the same batch ranks companies by repurchases. The backtesting guide covers filing dates and survivorship bias.
Research downloads
| File | Contents |
|---|---|
| Open exclude-distress report (web) | Opens in your browser: daily balance, every trade and yearly returns of filter ① |
| Open safe-zone report (web) | The same report for filter ② |
| Download daily balances (CSV) | Daily balances of both filters, the pool, the distress zone, QQQ and BIL |
| Download complete test results (JSON) | Every setting, check and zone share, for AI or coding tools |
| Download research program (Python) | For your AI agent or for programmers; one program for all three studies in this batch |
Past performance does not guarantee future results. This material is for research and education and is not investment advice. It does not recommend buying or selling any stock, and a company's Z-score does not predict whether it will fail.
Last updated: 2026-11 | Backtest window: 2017-04-03 to 2026-11-10 | Author: FinLab Quant Research. The team maintains reproducible Taiwan and US market studies using FinLab data.
FinLab AI
Want to build your own strategy?
Describe your stock-picking ideas in natural language. AI automatically validates, backtests, and gives you answers
Start Free