Run this strategy
Copy the prompt to reproduce the evidence above with the article’s data, assumptions, and risk checks.
Tell your AI:
Set up FinLab and rerun the Piotroski F-Score backtest on S&P 500 members against RSP and QQQ. Please read: https://finlab.finance/en/setup?relatedUrl=/en/blog/piotroski-f-score-backtest
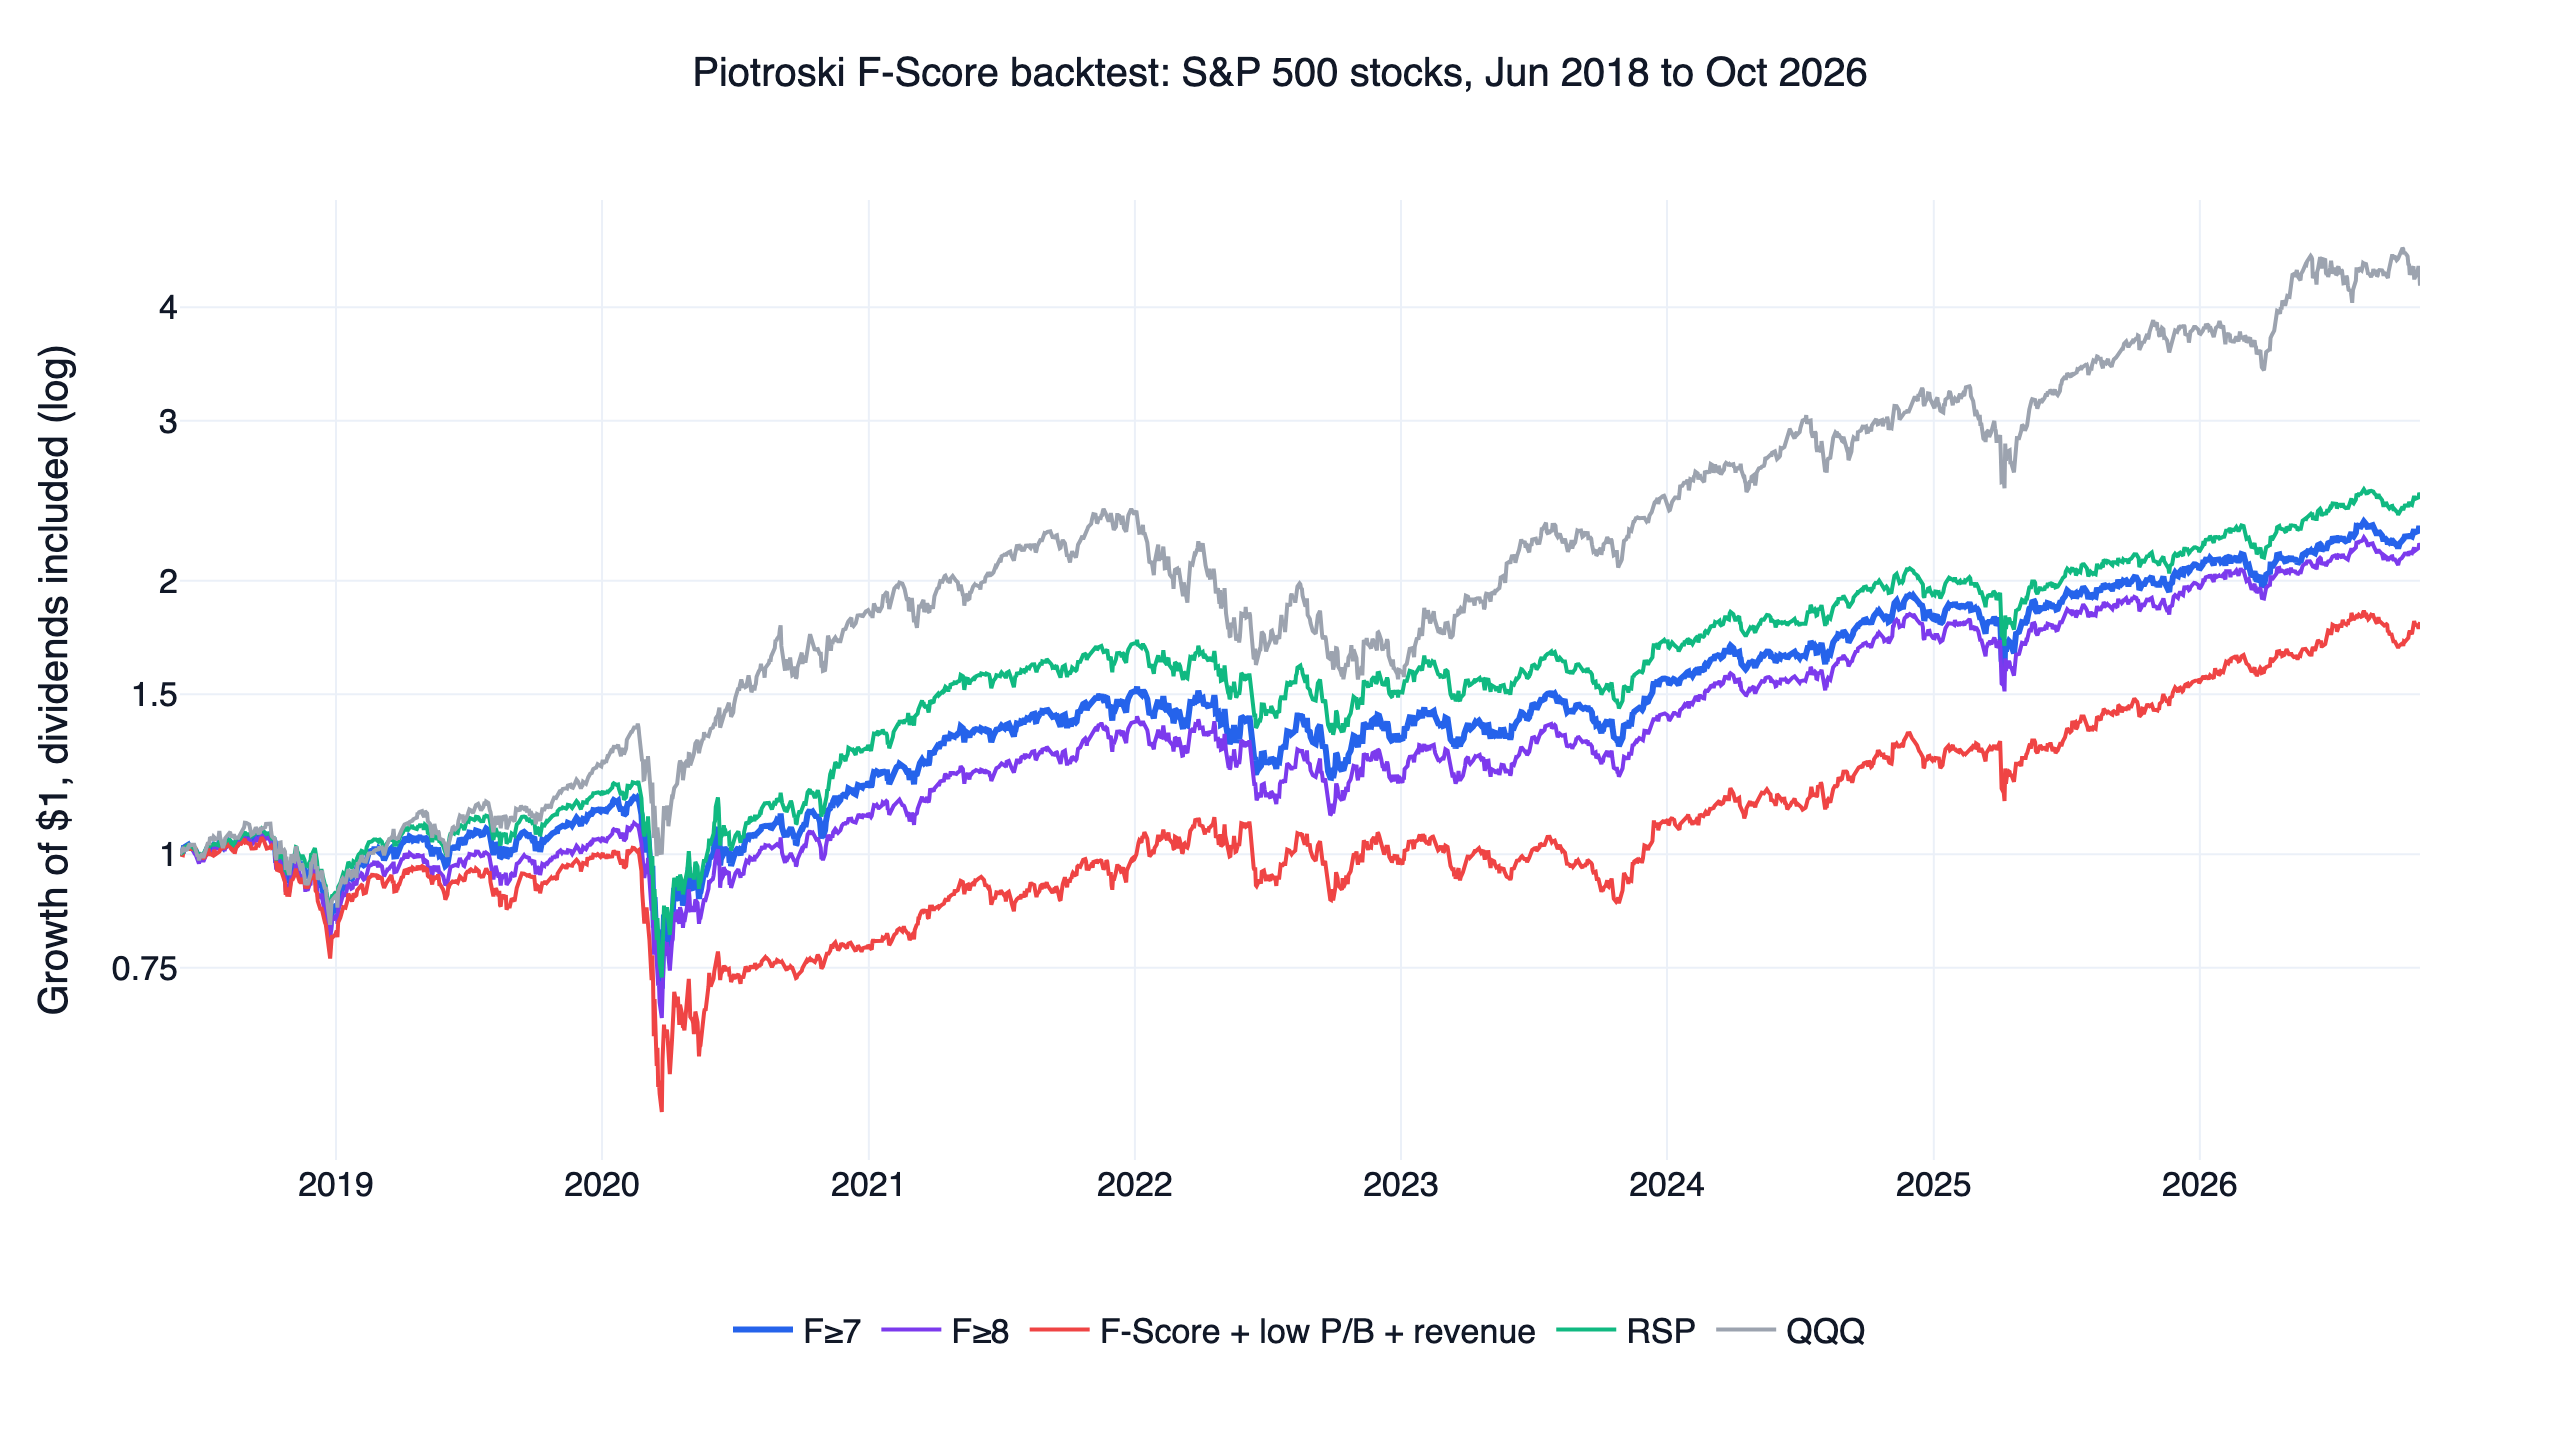
The Piotroski F-Score rates a company from 0 to 9 on nine pass/fail accounting checks covering profitability, leverage and liquidity, and operating efficiency. We applied it to each day's S&P 500 members from June 2018 to October 2026. Holding every member scoring 7 or more returned 10.3% a year with a daily Sharpe ratio of 0.61, behind the equal-weight RSP (11.4%, 0.66) and QQQ with dividends (18.7%, 0.84). None of the 21 settings tested beat QQQ, and stocks with a perfect 9 had the lowest Sharpe of any score, 0.41.
Piotroski built the score to sort cheap stocks, so the third design pairs it with low price to book and rising revenue. On S&P 500 stocks that pairing did worst: 7.2% a year, a Sharpe of 0.43 and a -50.2% drawdown. We fixed these three designs before seeing any result and recorded them on an internal GitHub issue, along with three in the PEG ratio backtest and three in the low-volatility stocks backtest. None of the nine passed, so none became a strategy page.
Piotroski F-Score results at a glance
| Design | Daily Sharpe | CAGR | Max drawdown | Stocks held (average) | Settings beating QQQ | Settings beating RSP | First / second half Sharpe | Result |
|---|---|---|---|---|---|---|---|---|
| F≥7 | 0.61 | 10.3% | -38.4% | 187 | 0 / 9 | 2 / 9 | 0.48 / 0.83 | Fails |
| F≥8 | 0.57 | 9.7% | -39.0% | 83 | 0 / 9 | 0 / 9 | 0.39 / 0.87 | Fails |
| F-Score + low P/B + revenue up | 0.43 | 7.2% | -50.2% | 32 | 0 / 9 | 0 / 9 | 0.18 / 0.86 | Fails |
| RSP, total return | 0.66 | 11.4% | -39.0% | reference | 0.61 / 0.76 | |||
| SPY, total return | 0.81 | 14.6% | -33.7% | reference | 0.68 / 1.01 | |||
| QQQ, total return | 0.84 | 18.7% | -35.1% | benchmark | 0.76 / 0.95 |
F≥7 means every S&P 500 member scoring at least 7, rebalanced monthly. All lines run from 2018-06-01 to 2026-10-30 with dividends reinvested, at finlab's default US cost of zero. The halves split at 2022-08-15.
What the Piotroski F-Score is
Piotroski (2000) scored cheap stocks on nine accounting signals and bought the ones scoring 8 or 9 within the highest book-to-market fifth. Each signal is a yes-or-no test on a company's own statements, worth one point. Piotroski & So (2012) later classified firms by whether the expectations in their pricing multiples fit the strength of their fundamentals, and found value and glamour returns concentrated where the two disagreed. Both papers read the score alongside price. Two of the three designs here apply it on its own.
| # | Group | Check | One point when |
|---|---|---|---|
| 1 | Profitability | Return on assets (ROA) | Trailing net income ÷ total assets a year earlier is above zero |
| 2 | Profitability | Operating cash flow | Trailing operating cash flow is above zero |
| 3 | Profitability | Change in ROA | ROA is higher than a year earlier |
| 4 | Profitability | Cash above earnings | Operating cash flow ÷ total assets a year earlier is above ROA |
| 5 | Leverage and liquidity | Long-term debt | Long-term debt ÷ average total assets is lower than a year earlier |
| 6 | Leverage and liquidity | Current ratio | Current assets ÷ current liabilities is higher than a year earlier |
| 7 | Leverage and liquidity | Share issuance | Trailing net common stock issuance is zero or negative |
| 8 | Operating efficiency | Gross margin | Trailing gross profit ÷ revenue is higher than a year earlier |
| 9 | Operating efficiency | Asset turnover | Trailing revenue ÷ total assets a year earlier is higher than a year earlier |
Piotroski scored annual statements. Here the score updates with every quarterly filing, on trailing four quarters against the same figures a year earlier. Net income, cash flow, revenue, gross profit and share issuance are four-quarter sums. Balance sheet lines are the quarter's closing figures. Blank long-term debt counts as zero, and any other check with a missing line fails. A stock with no net income, no operating cash flow or no ROA a year earlier gets no score at all. Check 7 uses net issuance, so buybacks can offset shares issued. Each score counts from the filing date of its quarter.
Five of the nine checks (3, 5, 6, 8 and 9) compare a company with its own figures a year earlier, so the score rewards improvement more than a strong level. Novy-Marx (2013) found that the level of gross profit to assets predicts returns; check 8 asks only whether the margin rose. A very profitable company whose margin slips loses that point, and a weak company whose margin edges up earns it. Check 4 draws on the accrual evidence in Sloan (1996): the accrual part of earnings persisted less than the cash flow part.
Does a higher F-Score pay?
In this setting, only up to a score of 6. To read the score without a floor or a stock cap, we split each month's S&P 500 members into equal-weight slices by score. We added these slices after seeing the results of the three designs, so they describe the outcome and were no part of any pass test.
| F-Score | Stocks (average) | Daily Sharpe | CAGR | Max drawdown | Volatility |
|---|---|---|---|---|---|
| 0 to 4 | 52 | 0.59 | 11.7% | -46.9% | 23.5% |
| 5 | 98 | 0.66 | 11.9% | -40.7% | 20.1% |
| 6 | 119 | 0.69 | 12.2% | -39.5% | 19.4% |
| 7 | 104 | 0.62 | 10.4% | -38.1% | 18.9% |
| 8 | 67 | 0.60 | 10.4% | -38.5% | 19.7% |
| 9 | 16 | 0.41 | 6.7% | -44.1% | 21.6% |
| No score | 37 | 0.74 | 14.6% | -40.1% | 21.5% |
| RSP | 0.66 | 11.4% | -39.0% | ||
| QQQ | 0.84 | 18.7% | -35.1% | 23.9% |
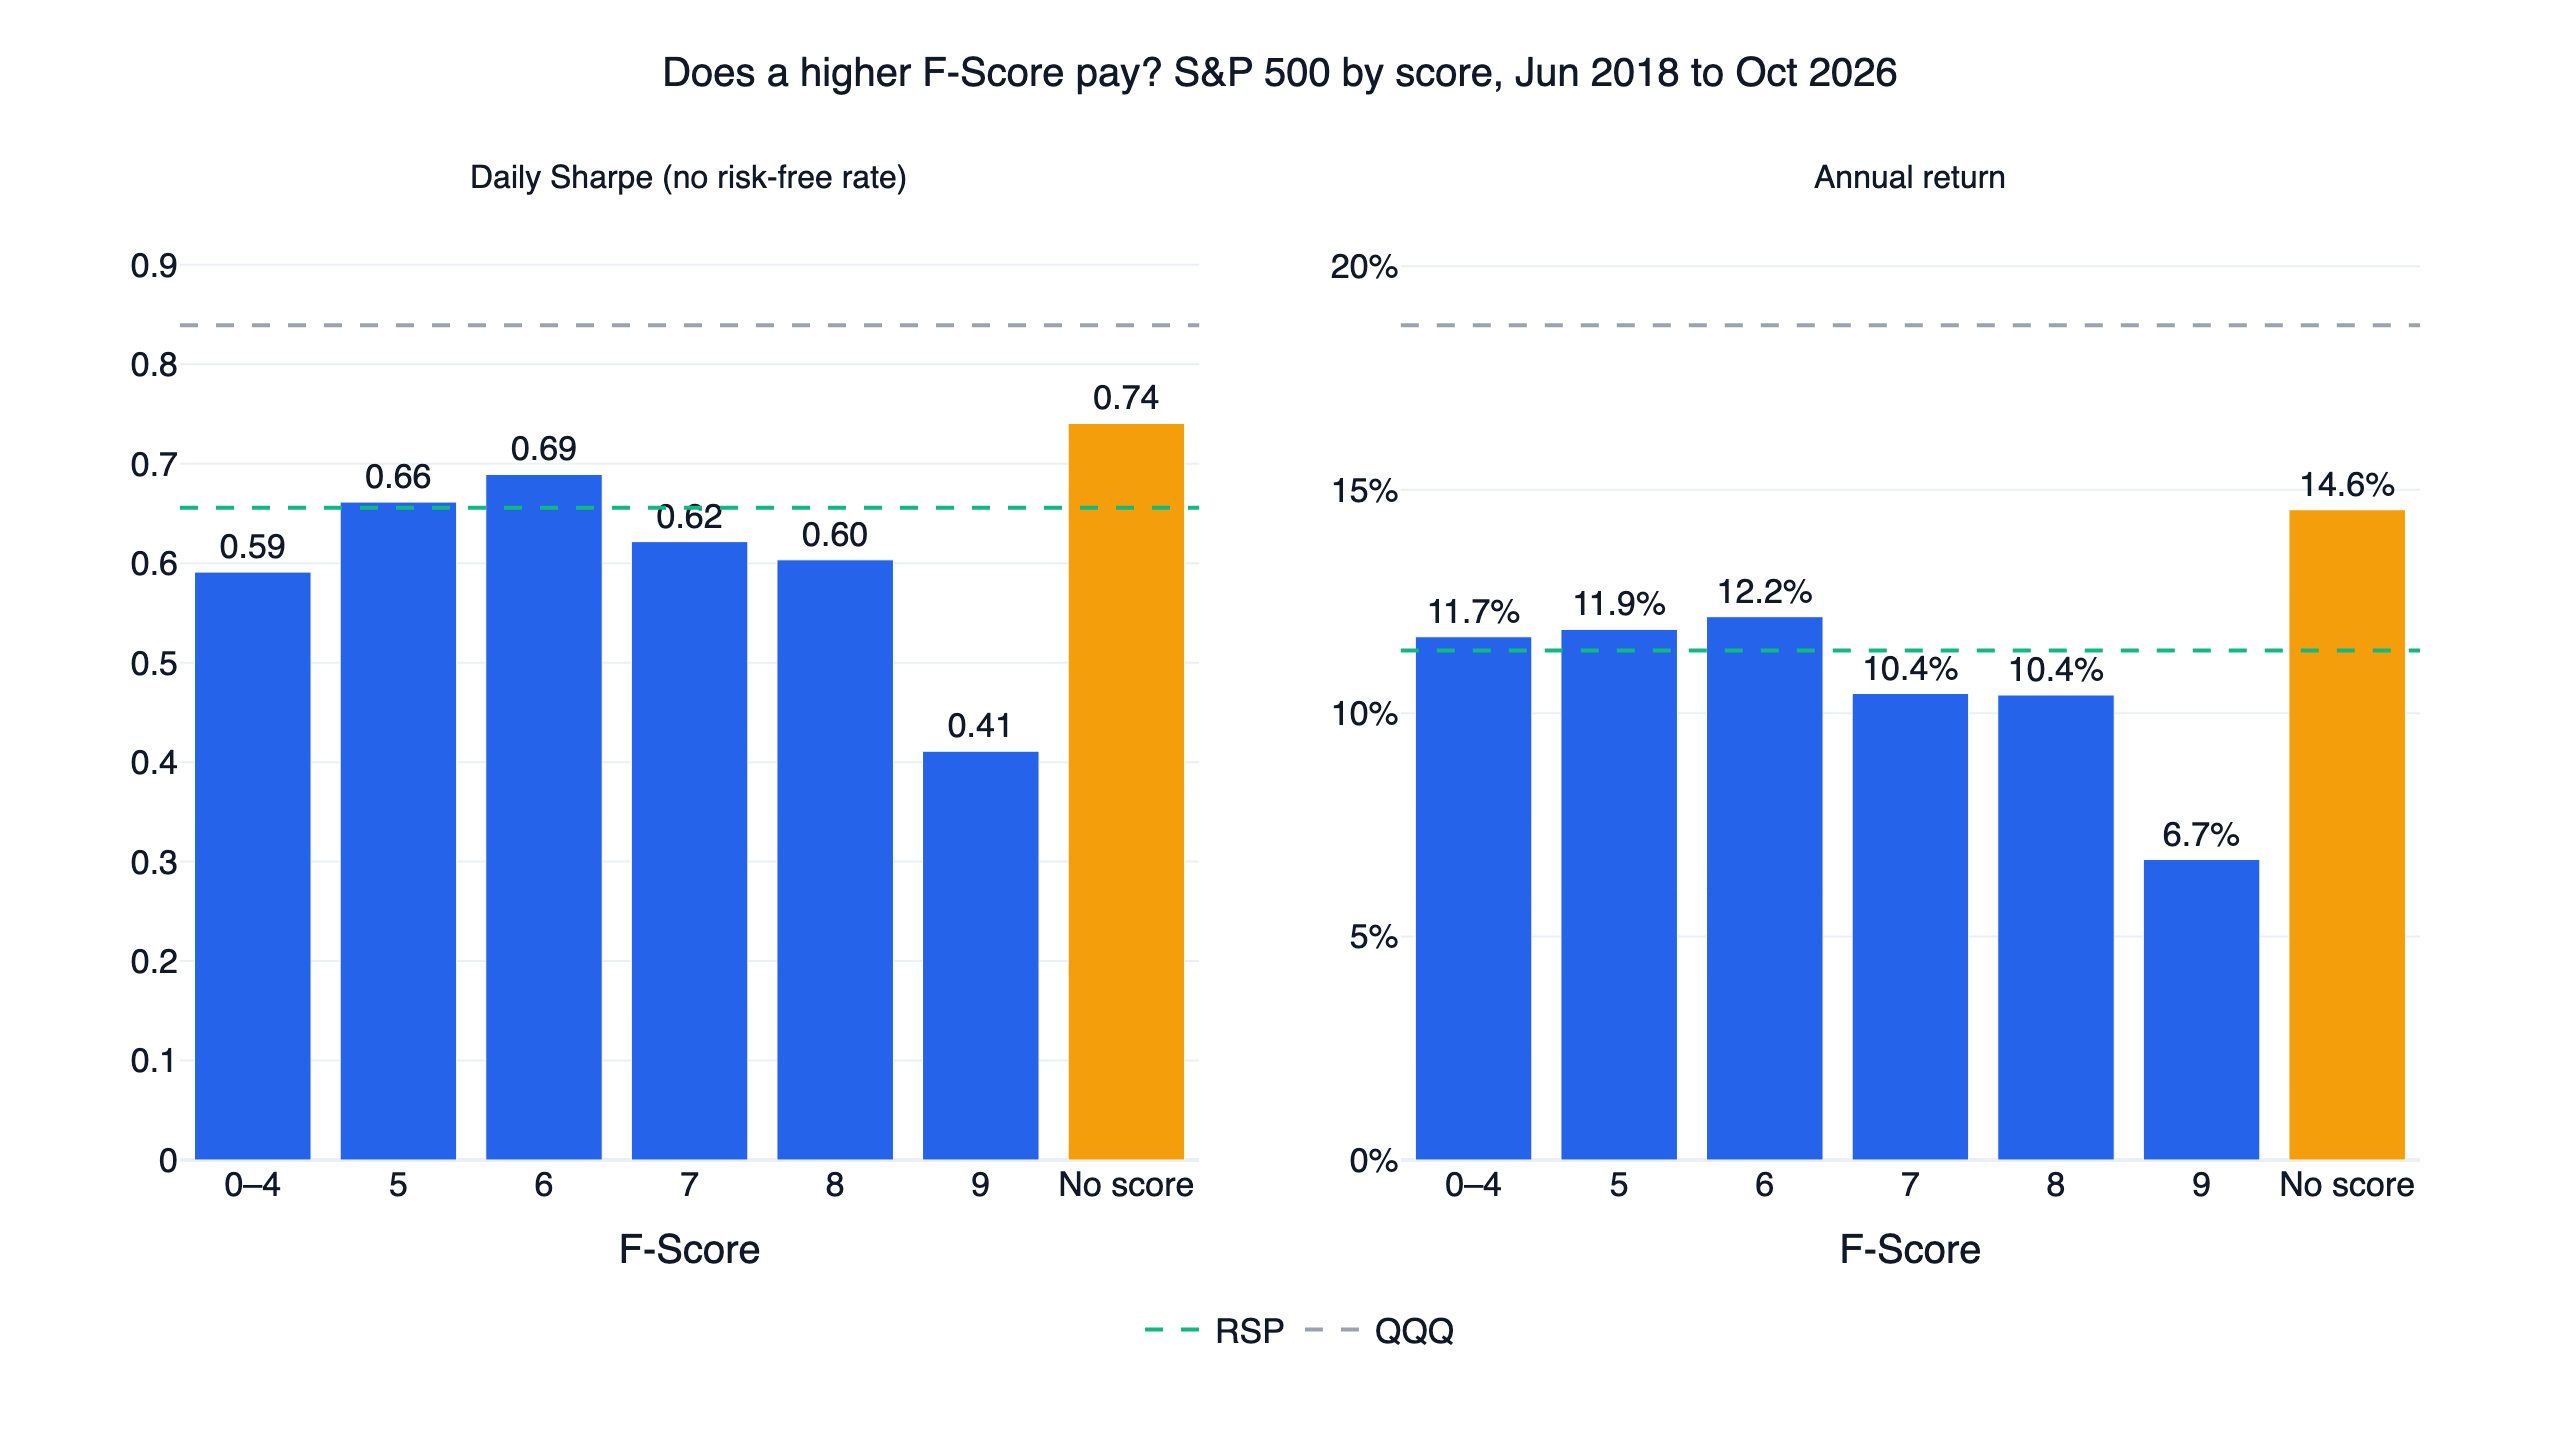
Sharpe rose from 0.59 for scores 0 to 4 to 0.69 at a score of 6, then fell at each step: 0.62, 0.60 and 0.41. Annual return took the same path, from 12.2% at 6 down to 6.7% at 9. Against the dashed RSP line, scores 5 and 6 cleared it on both measures, scores 7, 8 and 9 fell short on both, and scores 0 to 4 beat it on return only. No slice reached the dashed QQQ line.
The 9 slice is the thinnest, at 16 stocks on average, so its 0.41 is a noisy reading. The 7 and 8 slices are firmer, at 104 and 67 stocks, and they sit below RSP too.
Scores 0 to 4 had the deepest drawdown, -46.9%, and the highest volatility, 23.5%. A score of 7 had the shallowest drawdown, -38.1%, and the lowest volatility, 18.9%. We ran no significance test on any of these gaps.
The tallest bar, no score, is not a signal. It holds 37 stocks on average, most of them long-listed companies that filed as usual. When a fiscal quarter ends a few days after a calendar quarter, as is common on a 52/53-week fiscal year, the quarterly table leaves one quarter blank. Trailing sums and year-earlier comparisons both cross that blank, so a score can stop for more than two years. This is a leftover group defined by gaps in the table and not a usable bucket, and we did not study what drove its 0.74 and 14.6%. A few other members have no statements in the data at all, nearly all of them companies later acquired or delisted, and they sit in no row of the table.
The three designs and how they were tested
- F≥7. Every S&P 500 member scoring at least 7, rebalanced monthly. Neighbours: floors of 6, 7 and 8 with weekly, monthly and quarterly rebalancing.
- F≥8. The same around 8. Neighbours: floors of 7, 8 and 9 with the same three rhythms.
- F-Score + low P/B + revenue up. The cheapest 30% of members by price to book, scoring at least 7, with the latest quarter's revenue above the same quarter a year earlier, rebalanced monthly. Neighbours: the cheapest 20%, 30% and 40% with floors of 6, 7 and 8.
Each holds equal weights with at most 5% in a stock. "Beats" means a higher daily Sharpe ratio than QQQ with dividends over exactly the same dates, where Sharpe is mean daily return over its standard deviation times √252, with no risk-free rate. All rules were fixed in advance.
- Neighbouring settings. At least 70% of the nine must beat QQQ.
- Both halves. The original setting must win each half.
- Costs. It must win at finlab's default US cost of zero and at 0.1% per side.
- No single year. It must still win without the calendar year of its largest lead.
- Cash. A design averaging over 10% cash must beat QQQ on returns above T-bills (BIL). None did; the lowest invested average is 94.9%.
- The combination must add. It must beat F≥7 over the same dates.
| Check | F≥7 | F≥8 | Combination | QQQ | RSP |
|---|---|---|---|---|---|
| Settings beating QQQ, 7 of 9 needed | 0 | 0 | 0 | ||
| First half Sharpe, to 2022-08-15 | 0.48 | 0.39 | 0.18 | 0.76 | 0.61 |
| Second half Sharpe | 0.83 | 0.87 | 0.86 | 0.95 | 0.76 |
| Sharpe at zero cost | 0.61 | 0.57 | 0.43 | 0.84 | 0.66 |
| Sharpe at 0.1% per side | 0.59 | 0.55 | 0.41 | 0.84 | 0.66 |
| Sharpe without 2022 | 0.78 | 0.75 | 0.48 | 1.22 | |
| Average invested | 100% | 100% | 94.9% | ||
| Sharpe above T-bills, for disclosure | 0.47 | 0.44 | 0.31 | 0.73 |
2022 was the year of the largest lead for all three designs, by 21.5, 19.4 and 32.5 points. Each design failed every check it faced, and the combination failed its own as well: 0.43 against 0.61 for F≥7. As a calibration, equal-weighting all members from September 2017 tracks RSP with a daily correlation of 0.998 and a Sharpe of 0.68 for both, so the universe and engine behave.
RSP is the more useful control here. These designs are equal-weight baskets of S&P 500 stocks, so losing to QQQ alone says little. F≥7 and F≥8 stayed below RSP from their first weeks to the last day, and by October 2026 they had grown 2.28 and 2.18 times against 2.48 for RSP and 4.23 for QQQ. F≥7 held 187 stocks on average, more than a third of the index, and drew down about as far as RSP (-38.4% against -39.0%).
The combination grew 1.80 times. It lost 20.2% in 2020 while RSP gained 12.7%, and it returned 1.2% a year in the first half. In the second half its Sharpe of 0.86 beat F≥7 and RSP, so its shortfall against both came from the first half. It held 32 stocks on average and as few as 8, and because of the 5% cap it kept cash whenever fewer than 20 names qualified.
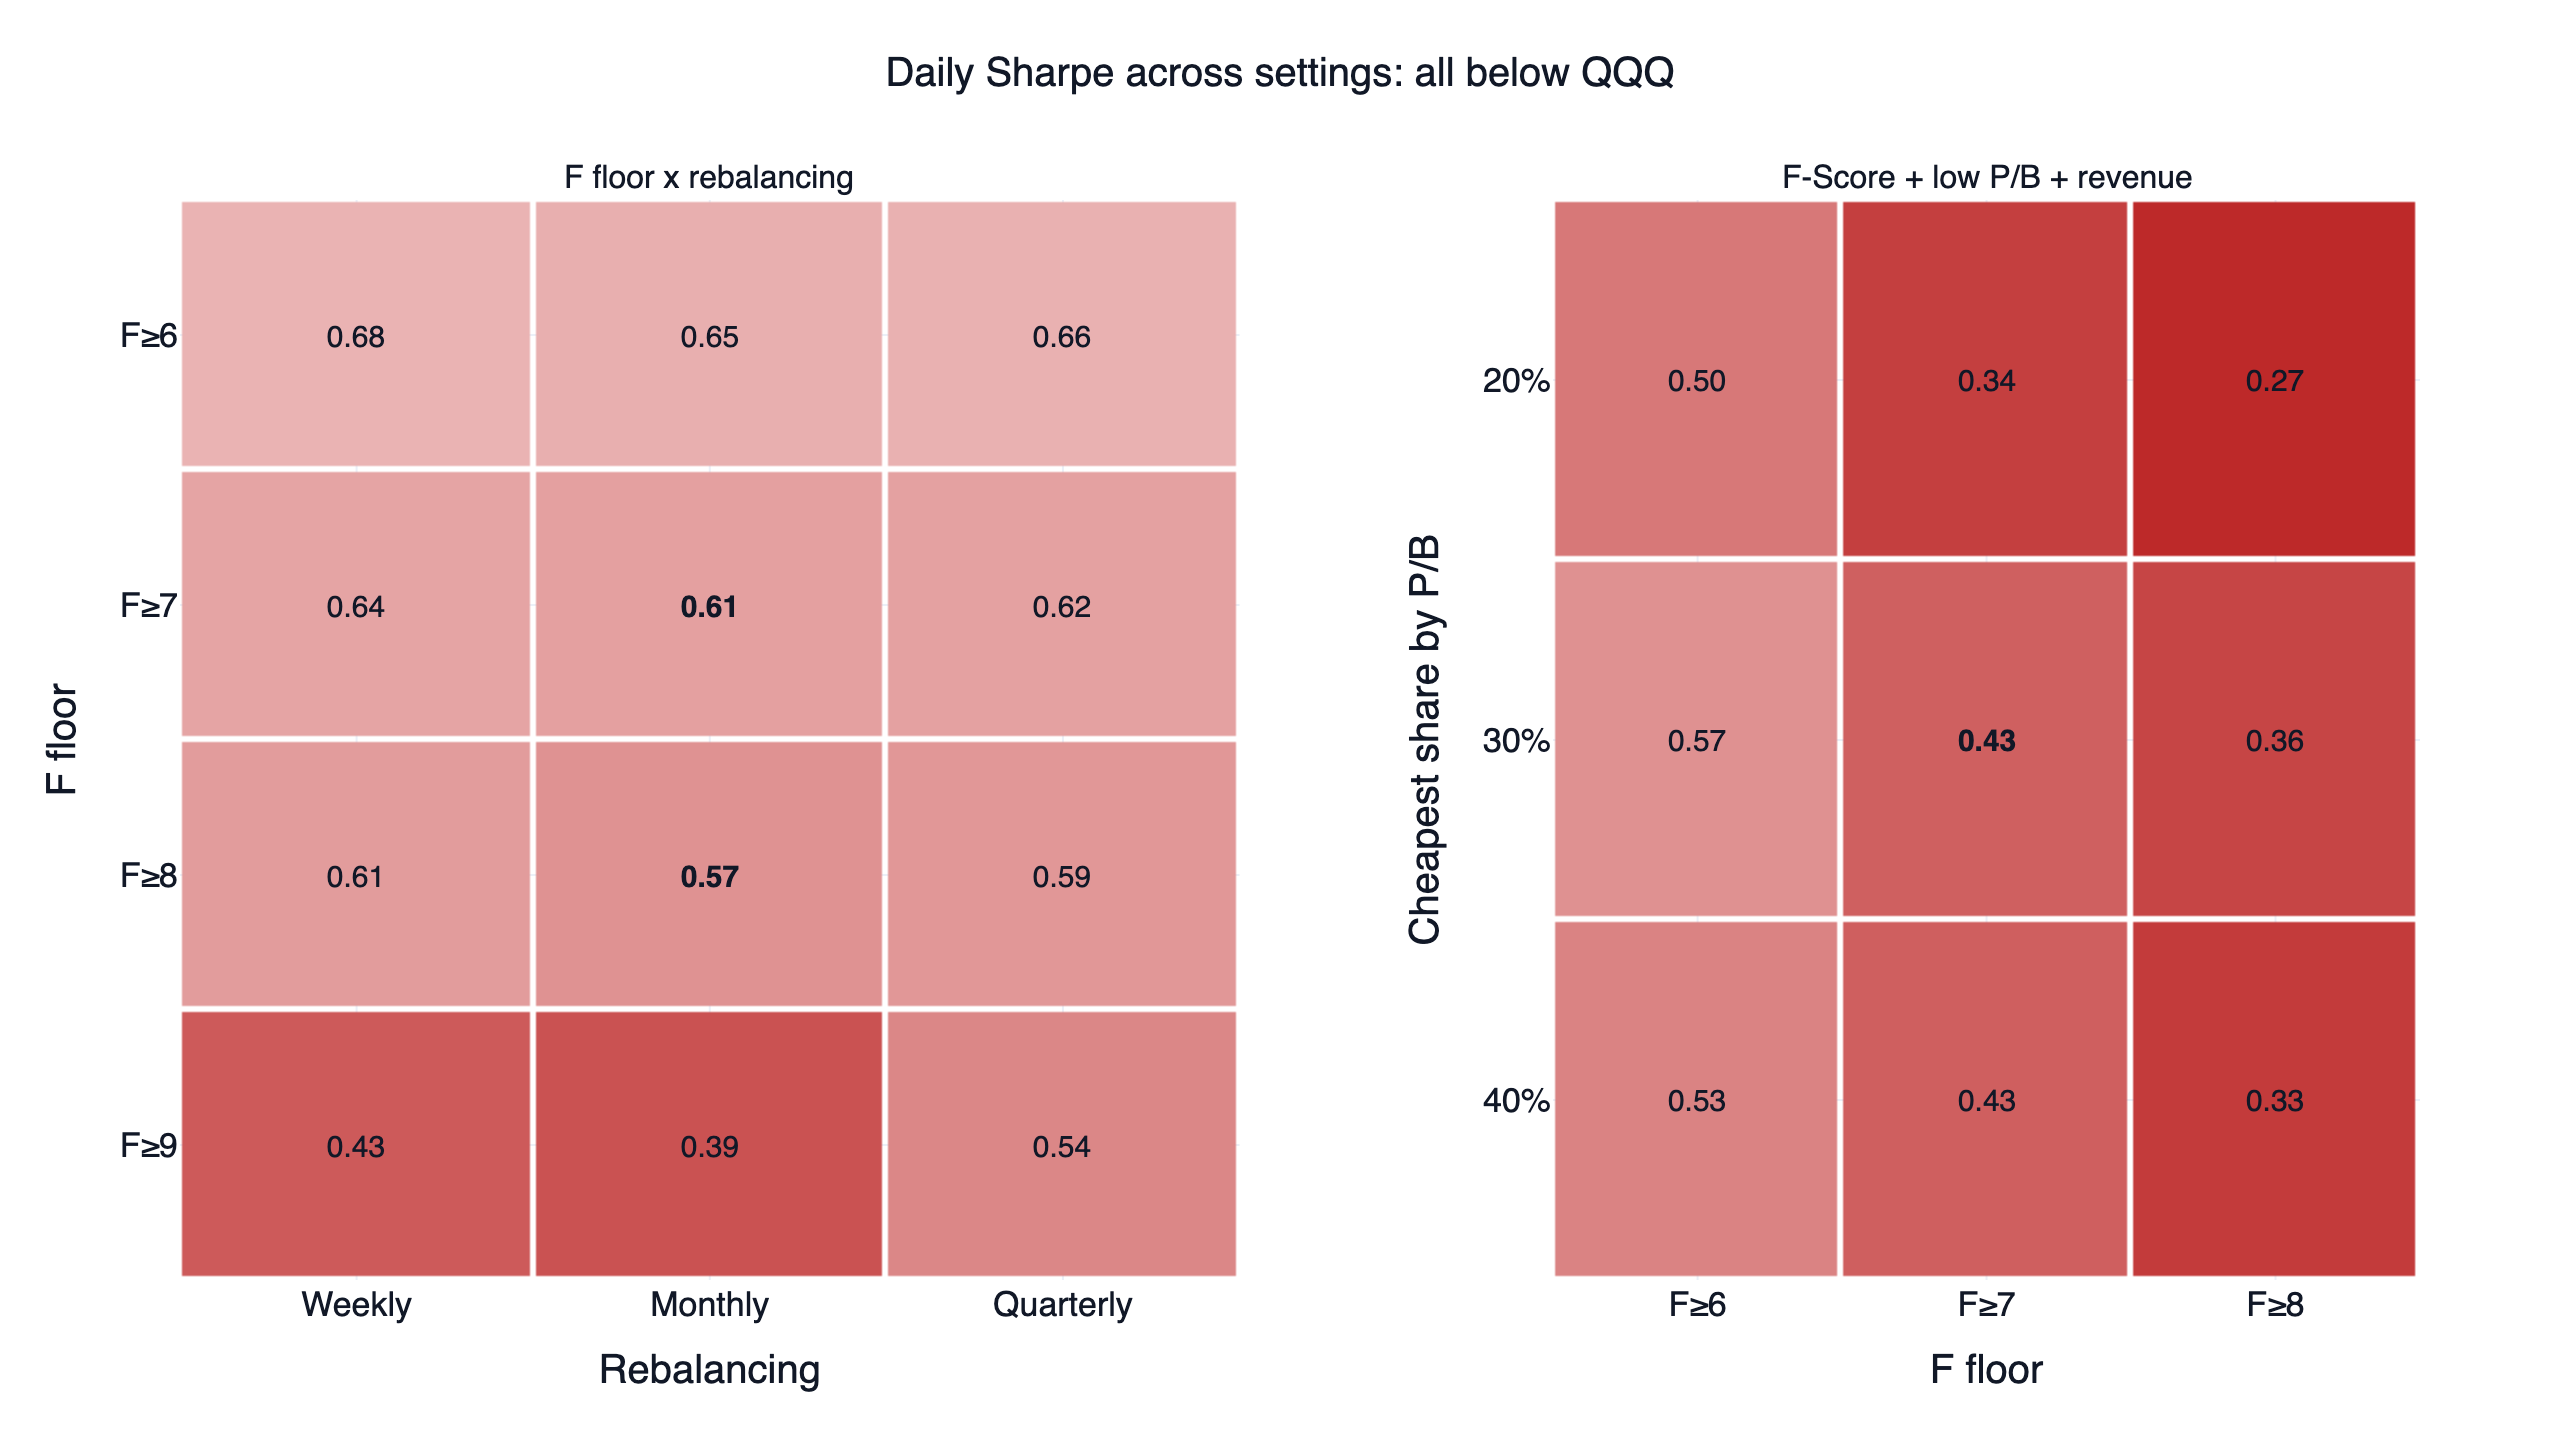
Bold cells are the originals. The F≥7 and F≥8 grids share their F≥7 and F≥8 rows, so the left panel draws them once, which leaves 21 distinct settings. Each cell is compared with QQQ on its own dates (0.85 weekly, 0.84 monthly and quarterly), and every cell lost.
On the left, a lower floor scored higher: F≥6 reached 0.65 to 0.68 and F≥9 only 0.39 to 0.54. Monthly rebalancing was the lowest of the three rhythms on every row, and all these cells are at zero cost. The F≥9 row keeps its 5% cap, so with about 16 stocks it sits partly in cash, which separates its 0.39 from the uncapped 0.41 slice above.
Only two settings beat RSP: F≥6 weekly (0.68 against 0.67) and F≥6 quarterly (0.661 against 0.659). Nothing with a floor of 7 or higher did. On the right, the same pattern holds. In every row the Sharpe falls as the floor rises, the best cell is the cheapest 30% with a floor of 6 at 0.57, and the narrowest 20% pool was the lowest in every column.
The same three filters in Taiwan
FinLab also runs these three filters as a Taiwan strategy, where it passed its checks against 0050. From June 2014 to October 2026 it returned 19.7% a year with a daily Sharpe of 1.26 against 1.05 for 0050 with dividends. The return matched 0050's 19.8%, so the lead came from lower risk, and the margin was thin in its later half: 1.33 against 1.30 from the end of August 2020. The US version here lost.
| Taiwan strategy | This study | |
|---|---|---|
| Pool | The 500 cheapest stocks by price to book, whole market | The cheapest 30% of S&P 500 members |
| Revenue check | Latest month against the same month a year earlier | Latest quarter against the same quarter a year earlier |
| Score | At least 7, using return on equity | At least 7, using return on assets |
| Stocks held (average) | 49 | 32 |
| Costs | 0.1425% commission and 0.3% tax | Zero, with a 0.1% per side rerun |
| Benchmark | 0050 with dividends | QQQ with dividends |
| Window | 2014-06 to 2026-10 | 2018-06 to 2026-10 |
| CAGR, daily Sharpe, max drawdown | 19.7%, 1.26, -30.8% | 7.2%, 0.43, -50.2% |
The market, the universe, the revenue data, the score and the benchmark all differ, so these are two separate tests and we give no cause for the opposite outcome.
The earlier US study and why this one starts in 2018
Our ten academic factors backtest tested the F-Score closer to Piotroski's framing: the cheapest 30% of the 1,000 most liquid US stocks, with financials excluded, holding every stock scoring at least 8. From August 2017 it scored 0.23 with 2.7% a year and a -68.6% drawdown, the lowest of the ten factors, against 0.89 for QQQ. On the same liquid universe, the factor investing study found the best-scoring tenth earned 0.9 points a year less than the worst tenth, with a t-statistic of -0.14.
Universe, financials and the score floor all differ here, and so does the start date. That study begins in August 2017. Here the rule fixed in advance was the first month with a value for at least 70% of members, and the score reaches that in May 2018. S&P 500 statements effectively start in 2016-Q1 (fewer than 80 companies a quarter in 2015), and the year-earlier ROA divides by total assets from a year before that. So for most companies the first quarter with a score is 2018-Q1, which needs nine quarters of statements from 2016-Q1 on and was filed in April and May 2018. The first monthly fill is on 2018-06-01.
F-Score year by year
| Year | F≥7 | RSP | QQQ |
|---|---|---|---|
| 2018 (June onward) | -12.3% | -9.2% | -10.1% |
| 2019 | 27.5% | 28.9% | 39.0% |
| 2020 | 7.4% | 12.7% | 48.6% |
| 2021 | 25.7% | 29.4% | 27.4% |
| 2022 | -11.0% | -11.6% | -32.6% |
| 2023 | 16.1% | 13.7% | 54.9% |
| 2024 | 16.4% | 12.8% | 25.6% |
| 2025 | 13.2% | 11.2% | 20.8% |
| 2026 (to October) | 10.7% | 15.3% | 12.8% |
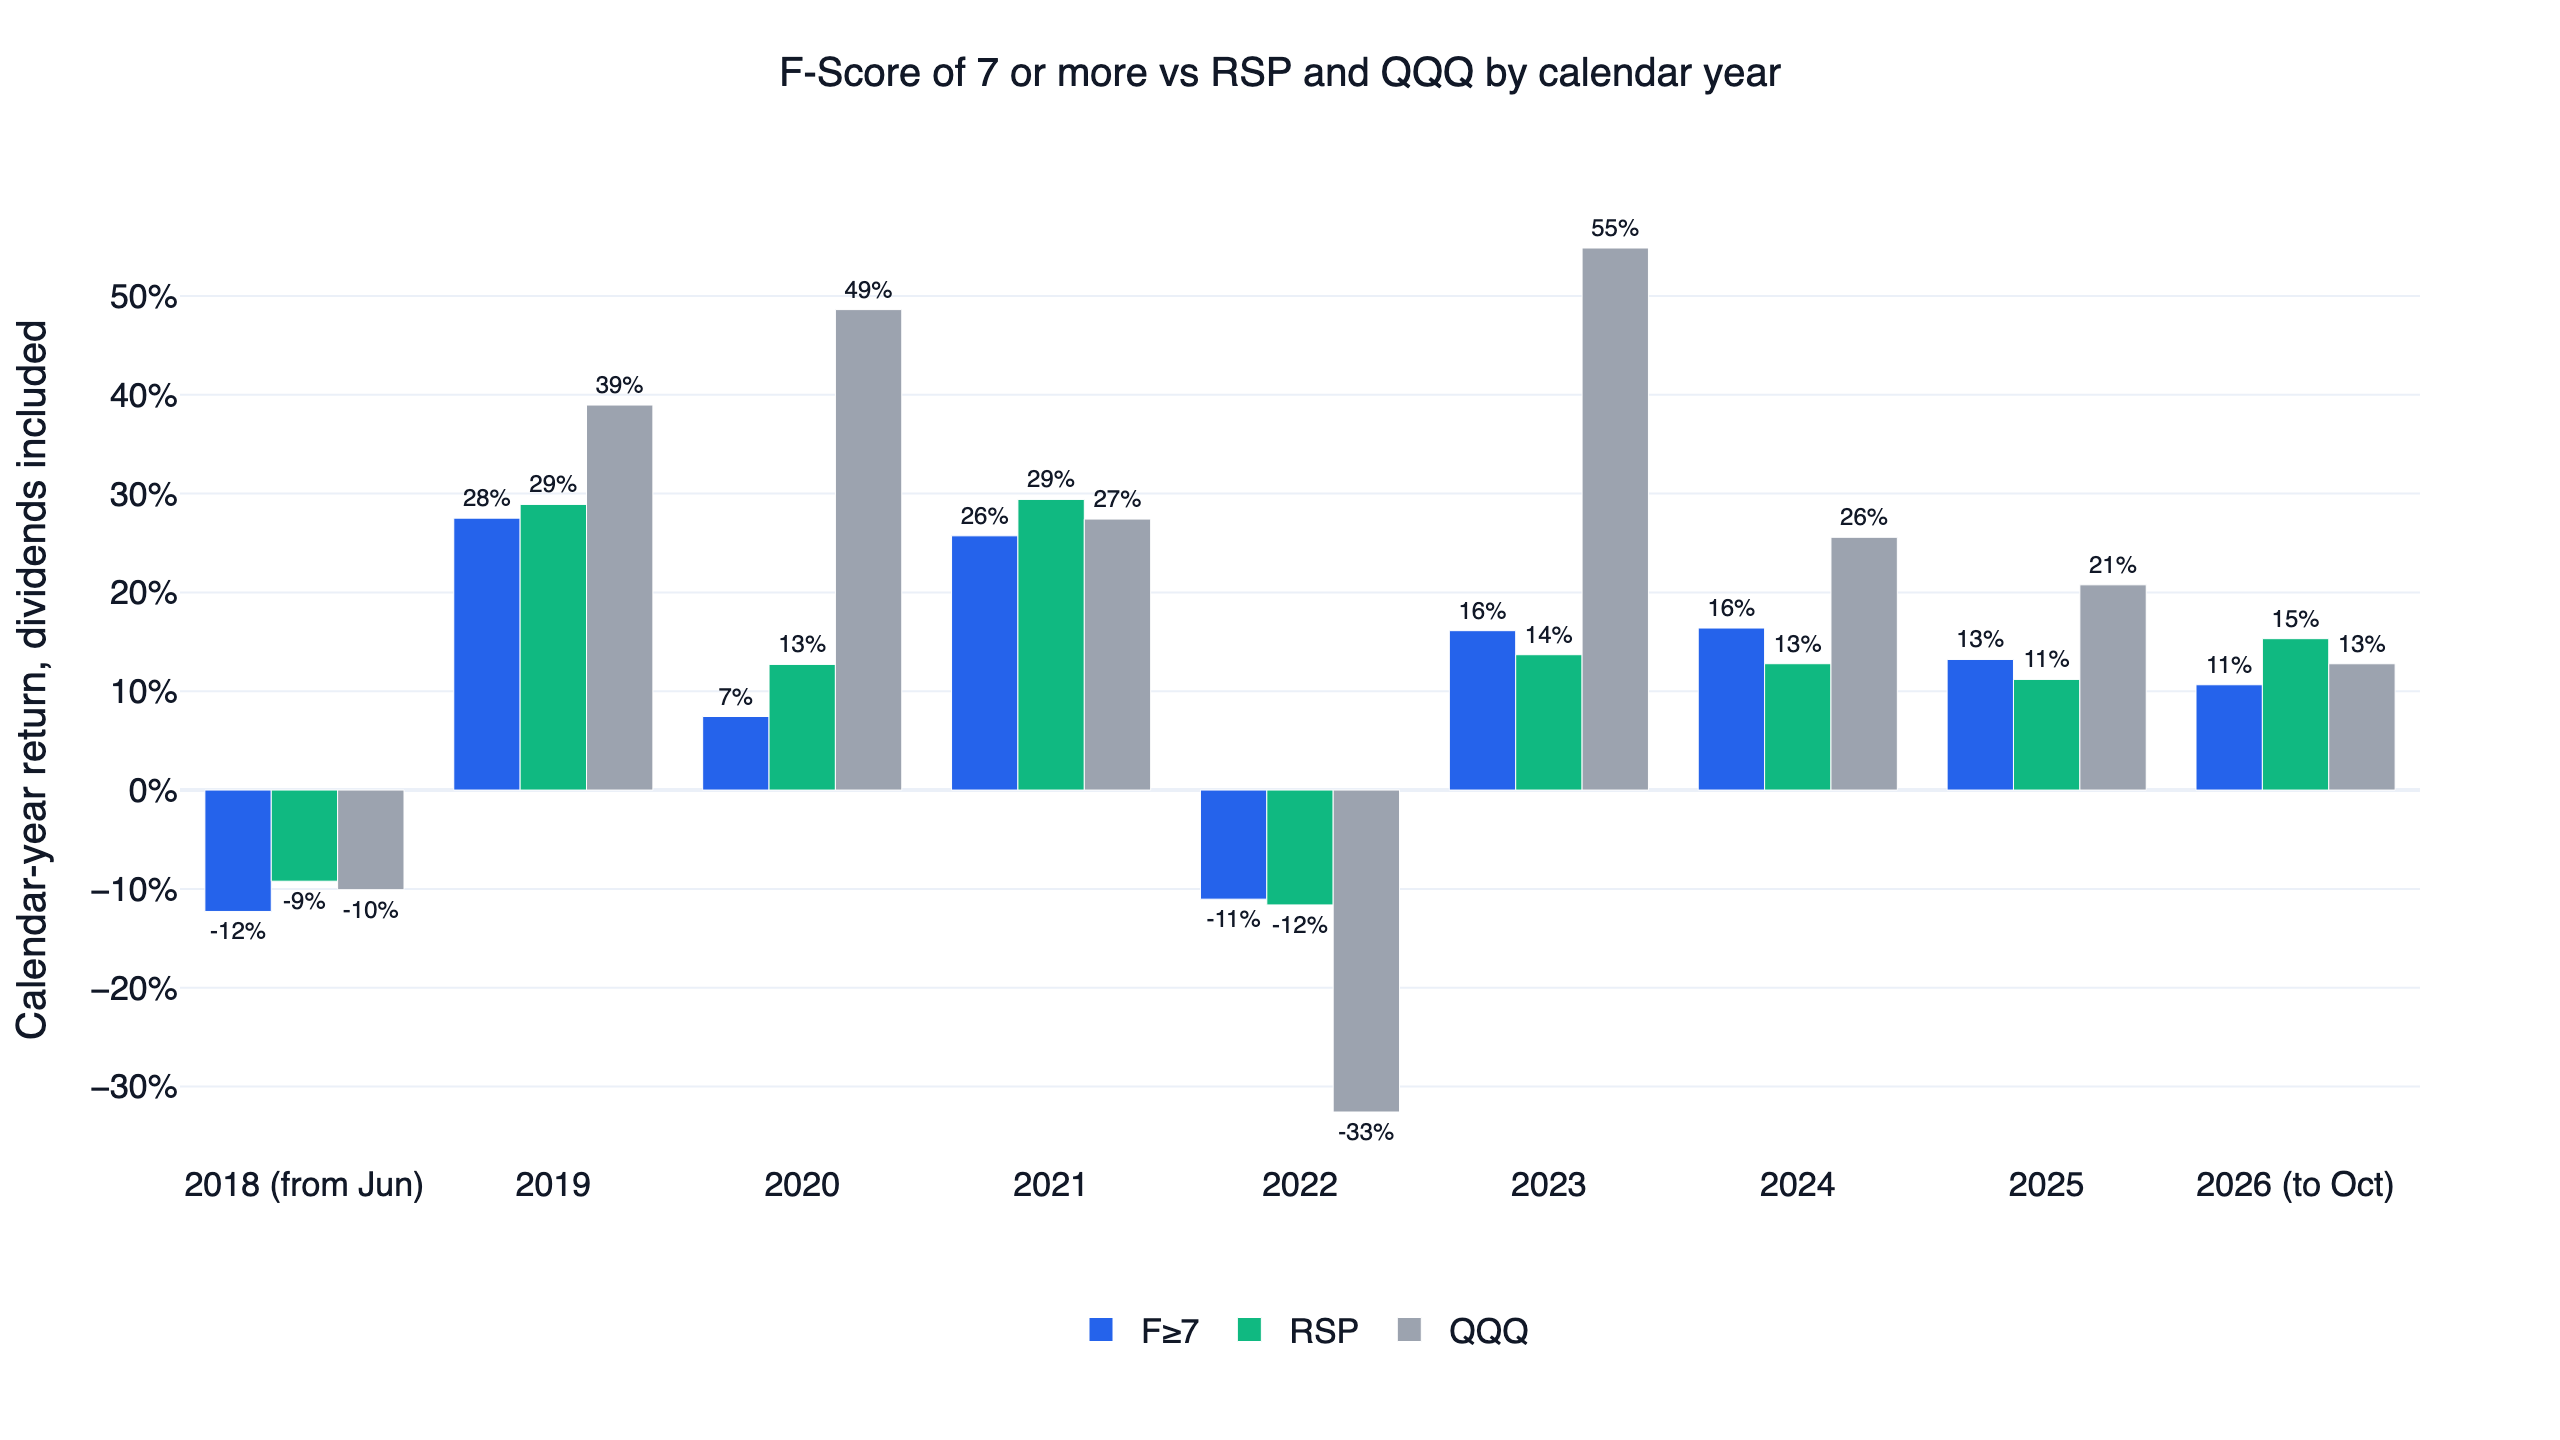
F≥7 beat QQQ in one year of nine, 2022, when it lost 11.0% against QQQ's 32.6%. RSP, which uses no score, lost nearly the same that year, 11.6%. 2023 went the other way: 16.1% against RSP's 13.7% and QQQ's 54.9%. Remove 2022 and F≥7 scores 0.78 against QQQ's 1.22.
F≥7 beat RSP in four straight years, 2022 to 2025, and trailed it in the other five. The two halves show the same turn: 0.48 in the first against QQQ's 0.76 and RSP's 0.61, then 0.83 in the second against 0.95 and 0.76. The design moved from behind RSP to ahead of it and stayed behind QQQ throughout. The numbers show that it happened and say nothing about why.
Financials stayed in
Banks do not report current assets the way industrial companies do, so checks like the current ratio and gross margin fit them badly. Fama & French (1992) left financial firms out of their study because the high leverage normal for them may mean something different than it does elsewhere, and our earlier factor study excluded the sector too. Here financials stayed in by design, because the test covers the whole index.
| Group | Financial share |
|---|---|
| All scored members | 15.2% |
| F≥7 | 14.8% |
| F≥8 | 13.3% |
| F≥9 | 7.8% |
Their share slips at F≥7 and F≥8 and about halves at F≥9. A cheap-and-growing basket went the other way: the combination held 34% financials. Sector labels are today's labels, not those at the time. We ran no version without financials. We computed these shares after seeing the results, and they describe the portfolios without explaining their results.
The code
This is F≥7, and the numbered comments follow the check table above. On data through October 2026 it prints 0.6, which is 0.60 with Python dropping the trailing zero. The results table says 0.61 because research.py keeps one share class per company, while this shorter version keeps both.
Show Code
import finlab
from finlab import data
from finlab.backtest import sim

finlab.login()
data.set_market("us")

close = data.get("us_price:adj_close")
members = data.get("us_index_constituents:sp500").astype(bool)
tickers = members.columns.intersection(close.columns)
members = members[tickers].reindex(close.index, method="ffill").fillna(False).astype(bool)

quarters = data.get("us_balance_sheet:total_assets").index


def quarterly(key):
    return data.get(key).reindex(index=quarters, columns=tickers)


def trailing(key):
    return quarterly(key).rolling(4, min_periods=4).sum()


income = trailing("us_income_statement:net_income")
cash_flow = trailing("us_cash_flow:operating_cash_flow")
assets = quarterly("us_balance_sheet:total_assets")
begin = assets.shift(4)[assets.shift(4) > 0]
revenue = trailing("us_income_statement:revenue")

roa = income / begin
leverage = quarterly("us_balance_sheet:long_term_debt").fillna(0) / ((assets + assets.shift(4)) / 2)
current = quarterly("us_balance_sheet:total_current_assets") / quarterly("us_balance_sheet:total_current_liabilities")
margin = trailing("us_income_statement:gross_profit") / revenue[revenue > 0]
turnover = revenue / begin

checks = [
    roa > 0,                                                  # 1 profitable
    cash_flow > 0,                                            # 2 cash from operations
    roa > roa.shift(4),                                       # 3 return on assets rising
    cash_flow / begin > roa,                                  # 4 cash above reported earnings
    leverage < leverage.shift(4),                             # 5 less long-term debt
    current > current.shift(4),                               # 6 better current ratio
    trailing("us_cash_flow:net_common_stock_issuance") <= 0,  # 7 no net share issuance
    margin > margin.shift(4),                                 # 8 better gross margin
    turnover > turnover.shift(4),                             # 9 better asset turnover
]
score = sum(check.astype(float) for check in checks)
score = score[roa.notna() & cash_flow.notna() & roa.shift(4).notna()]

# Count each quarter from its filing date; a blank quarter becomes -1
f_score = score.fillna(-1).index_str_to_date().reindex(index=close.index, method="ffill")

position = ((f_score >= 7) & members).loc["2018-05-01":"2026-10-30"]
report = sim(position.loc[:, position.any()], resample="M", trade_at_price="close",
             position_limit=0.05, market="us", upload=False)
curve = report.creturn.loc["2018-06-01":]
returns = curve.pct_change().dropna()
print(round(returns.mean() / returns.std() * 252 ** 0.5, 2))
Install the FinLab skill for your AI agent
You do not need to write this yourself. Install the FinLab skill in Claude Code, Codex or Gemini CLI with one command:
Show Code
npx skills add https://github.com/koreal6803/finlab-ai --skill finlabThen ask your agent in plain language, for example "rerun the F-Score study without financials" or "score the S&P 500 on annual filings only". The agent setup page has the details, and FinLab Studio runs the same research in a browser.
Backtest method and limits
| Item | How it was handled |
|---|---|
| Window | First monthly signal at the end of May 2018, first fill 2018-06-01, last day 2026-10-30. Weekly settings start 2018-05-07 and quarterly settings 2018-07-02 |
| Universe | Each day's S&P 500 members from FinLab's point-in-time list, one share class per company. Companies that left the index stay in while they were members, which limits survivorship bias from delisted names. In June 2018, 9 of 505 members have no price that day, falling to 0 by 2024. The study holds about 490 to 500 names a day |
| Liquidity | No filter beyond index membership |
| Exclusions | None by sector. Financials stay in |
| Look-ahead | Quarterly figures count from the filing date. Signals are read at a close and trade at the next close. A quarter with no score is marked as such, so an older score is not carried forward |
| Price to book | Market value ÷ latest stockholders' equity, positive equity only, ranked among that day's members |
| Weights | Equal weight, at most 5% in a stock, with cash earning nothing. The score slices have no cap |
| Costs | finlab's default US cost of zero, with each original rerun at 0.1% per side: CAGR falls to 9.9%, 9.2% and 6.7%. No slippage model |
| Turnover | One-way on target weights: about 1.4 times a year for F≥7, 2.0 for F≥8 and 2.5 for the combination |
| Capacity | Not estimated |
| Taxes | None, and dividends are reinvested in full |
| Benchmark | QQQ with dividends over the same dates, with RSP as the control |
| Sample | Everything is in sample, with no out-of-sample period. The two halves are a stability check |
Four limits matter more than the rest.
- Short window. The 8.4 years hold one 2020 and one 2022, so a single year can move a result: removing 2022 lifts QQQ's Sharpe from 0.84 to 1.22.
- Large caps only. Piotroski's original result came from a much broader cheap universe, and his paper reports the benefit concentrated in small and medium-sized firms, low-turnover stocks and firms with no analyst following. The S&P 500 sits far from that group, so this study does not retest his result.
- Trailing figures from filing dates. Scores here move through the year as each company files, and the paper scored annual statements.
- Latest partial filings. The newest quarter's filings were still partial when the data ended, so the last readings mix fresh and older statements.
What this result does and does not say
From June 2018 to October 2026, on S&P 500 members and with these rules, a high F-Score did not beat RSP at the original settings and did not beat QQQ at any setting. Above a score of 6, the Sharpe fell as the score rose. Pairing the score with low price to book and rising revenue did worse still. This does not show the F-Score fails on cheap small stocks, in older data or in other markets, and the Taiwan strategy above passed against its own benchmark.
Who the F-Score suits
It suits a reader who wants a plain checklist for one company's filings: nine yes-or-no questions on profit, debt and efficiency. It also suits someone researching cheap, smaller stocks, the group Piotroski wrote about and this study left out.
It does not suit someone looking for a rule to beat an index fund with S&P 500 stocks. In this setting F≥7 held more than a third of the index, landed close to RSP and earned less.
To take it further, change one thing at a time and rerun every check against RSP as well as QQQ: a floor of 6, annual scoring, no financials, or a universe of cheap stocks outside the S&P 500. The PEG ratio backtest and the low-volatility backtest on S&P 500 members use the same universe and rules. Price to book alone is covered in the US stock backtest tutorial, large-cap factors in the 17-factor comparison, and popular screens in the famous stock screens backtest. The quality value strategy uses stock factors as a signal for leveraged ETFs, and the US quant strategies overview lists the rest.
FAQ
What is a good Piotroski F-Score?
Piotroski's paper bought scores of 8 or 9. In our S&P 500 test from June 2018 to October 2026, the highest Sharpe among scored stocks came at a score of 6, 0.69, and the lowest at 9, 0.41, though the 9 slice held only 16 stocks on average.
How do you calculate the Piotroski F-Score?
Give one point for each of nine checks: positive ROA, positive operating cash flow, rising ROA, cash flow above ROA, lower long-term debt ratio, higher current ratio, no net share issuance, higher gross margin and higher asset turnover. The total runs from 0 to 9. Here each comparison uses trailing four quarters against a year earlier.
Does the Piotroski F-Score work?
On S&P 500 members from 2018 to 2026, as tested here, it did not beat QQQ in any of 21 settings, and only 2 of them beat RSP, both with a floor of 6. Those are large companies, and Piotroski's result came from a much broader cheap universe, so this does not settle the question for smaller stocks.
Is a perfect F-Score of 9 a buy signal?
Not on this evidence. The 9 slice returned 6.7% a year with a Sharpe of 0.41, the lowest of any score. With 16 stocks on average it is noisy, and the slices at 7 and 8 also trailed RSP.
Does the F-Score work for banks?
It fits them poorly, since banks do not report current assets the way industrial companies do. We kept them in by design. Financials are 15.2% of scored stocks and 7.8% of stocks scoring 9.
Does low price to book help the F-Score?
Not on S&P 500 stocks in this window. Adding the cheapest 30% by price to book and rising revenue lowered the Sharpe from 0.61 to 0.43 and deepened the drawdown from -38.4% to -50.2%.
Does the F-Score work in other markets?
The same three filters are live as a Taiwan strategy with a daily Sharpe of 1.26 against 1.05 for 0050 from 2014 to 2026, with a thin margin in its later half. That market, universe, score and benchmark all differ from this study.
Can I rerun this?
Yes. Install the FinLab skill through the agent setup page, download research.py below and run python research.py.
Reproduce it yourself
| File | Contents |
|---|---|
| research.py | All three designs, 21 settings, both halves, cost runs, score slices and financial shares |
| data.csv | Daily equity of the three designs, plus QQQ, SPY, RSP, SPLV and USMV |
| metrics.json | Every statistic quoted here, including each setting and yearly returns |
The team behind this research is on the about page.
Disclaimer: this article is for education only and does not constitute investment advice. Past performance does not guarantee future results, and investing involves risk. All results are in-sample, and the two halves were not validated out of sample. The funds named are used to describe research results, not as recommendations.
Last updated: 2026-11|Backtest window: 2018-06 to 2026-10|Data through 2026-10-30, rerun 2026-11-01|Benchmark: QQQ with dividends|Author: FinLab Quant Research
FinLab AI
Want to build your own strategy?
Describe your stock-picking ideas in natural language. AI automatically validates, backtests, and gives you answers
Start Free