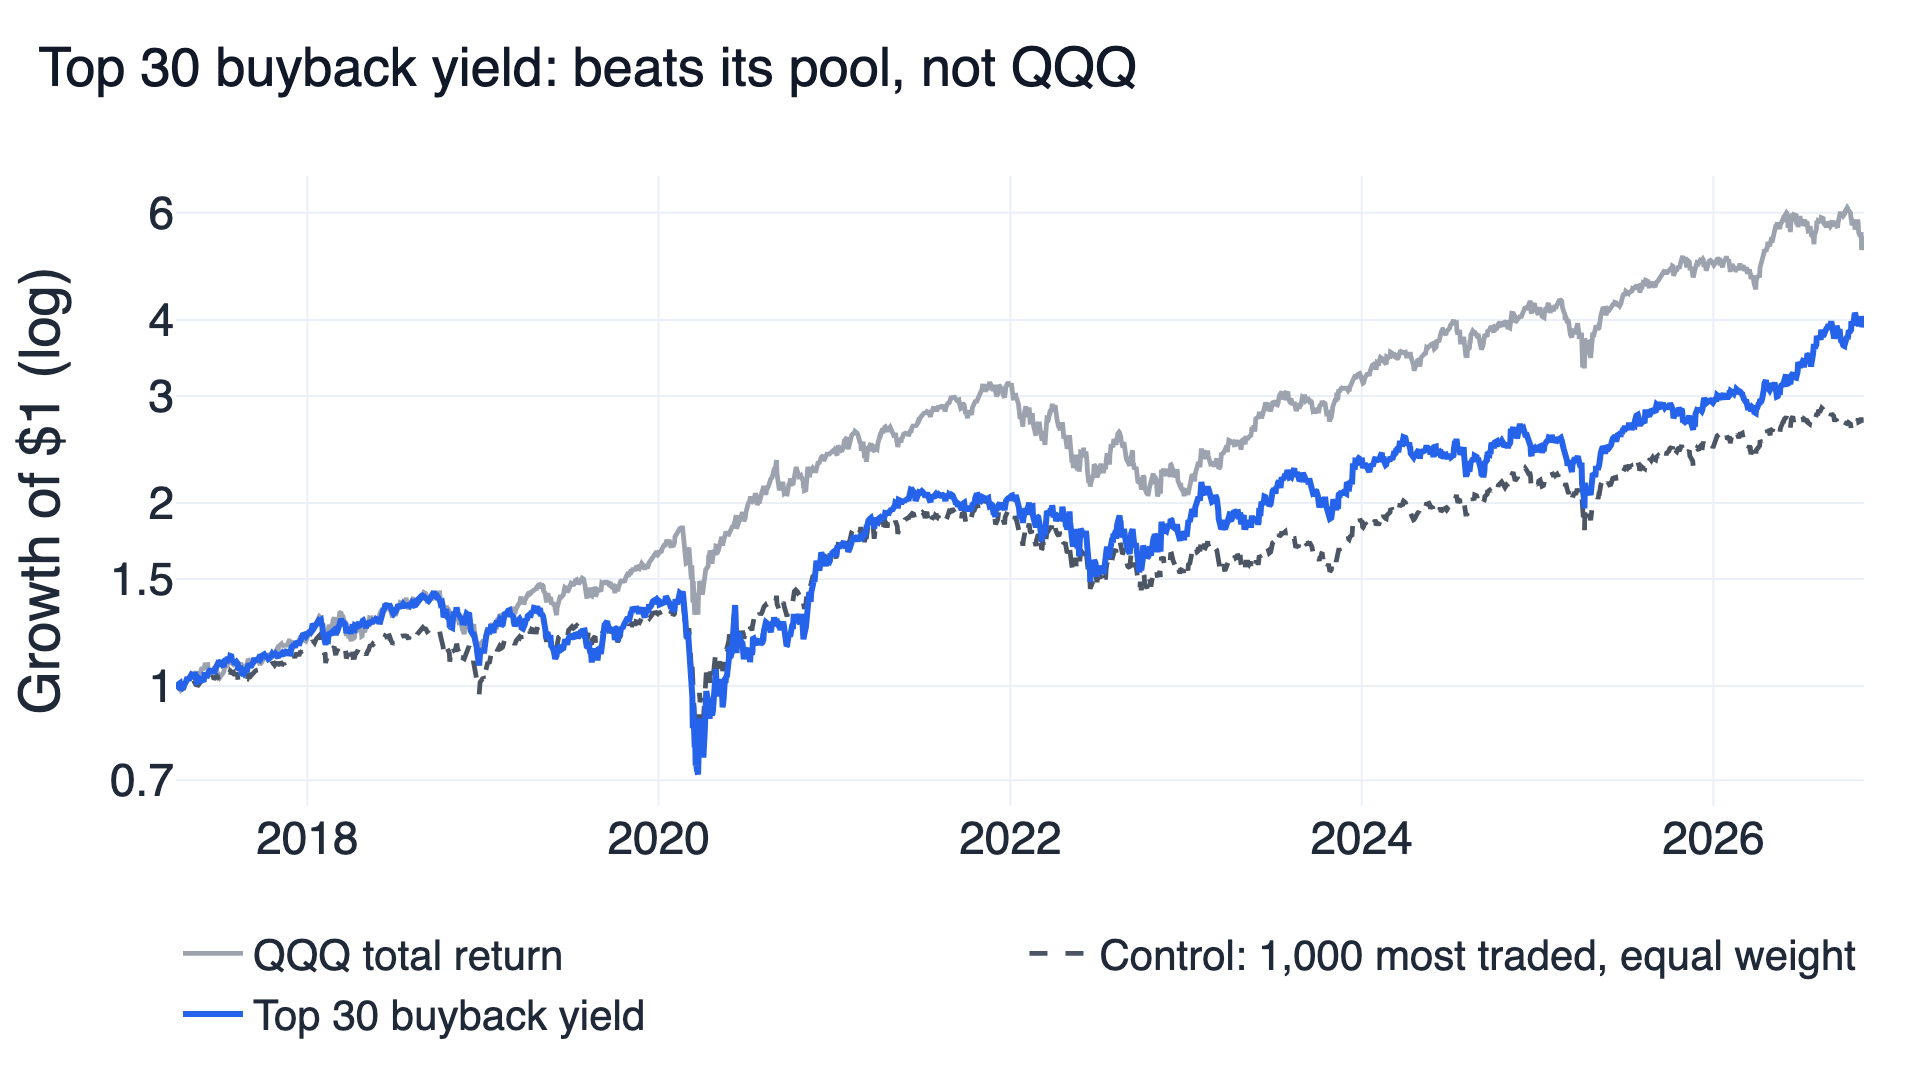
Buying the 30 US stocks with the highest buyback yield returned 15.4% a year with daily Sharpe 0.67 from 2017-04-03 to 2026-11-10. That beats the pool it was drawn from, the 1,000 most traded stocks held equally (11.0%, Sharpe 0.61), but not QQQ, the Nasdaq-100 ETF of mostly large US technology companies (19.3%, Sharpe 0.88). All 12 settings lost to QQQ, and the rule failed all five validation checks.
The buyback stocks also fell harder. From its February 2020 high to its March low the portfolio fell 50.0%, while QQQ fell 28.6% from its own high. Its best year was 2026, up 35.0% against QQQ's 10.2%; without that year its Sharpe drops to 0.59.
These trading rules are research results. To rerun the experiment, set up FinLab and download the research program (.py). Other files are in the research downloads.
What a stock buyback is
A stock buyback, also called a share repurchase, is a company using its cash to buy its own shares on the market. The repurchased shares become treasury stock or are cancelled, so each remaining share owns a slightly larger part of the company. Buybacks return cash to shareholders in the same way dividends do, but only the shareholders who sell receive it, and the company can stop at any time without the signal a dividend cut sends.
US companies report the cash spent on repurchases every quarter in the cash flow statement. FinLab's us_cash_flow:common_stock_repurchased field holds that amount as a negative number, and common_stock_issuance holds the cash raised by issuing new shares, including shares sold to employees. The two give two versions of the same idea:
- Gross buyback: the cash spent on repurchases over the last four or eight quarters.
- Net buyback: the same amount minus the cash raised from new shares. A company that buys back stock only to offset employee stock awards has a large gross buyback and a small net one.
The buyback yield divides either amount by the company's market value, so it reads like a dividend yield: a 5% buyback yield means the company spent 5% of its market value on its own shares over the period.
Two papers motivate the test. Ikenberry, Lakonishok and Vermaelen (1995) found that US companies announcing open-market repurchase programs beat comparable firms by about 12% over the following four years, with the effect concentrated in value stocks. Boudoukh, Michaely, Richardson and Roberts (2007) showed that a payout yield that counts repurchases predicts stock returns better than the dividend yield, and that a net payout yield, which subtracts issuance, does so for the market as a whole. This study uses the cash actually spent, not the announcement of a program, and asks a practical question: would a simple ranking on buyback yield have beaten QQQ in the last decade?
The rule, fixed before the run
At the start and at the last trading day of every quarter, the rule ranks the 1,000 most traded US common stocks by buyback yield and holds the 30 highest with equal weights. Only positive yields qualify. A yield above 50% is treated as a data error and skipped. The grid and every pass rule were fixed before any return was calculated.
| What varies | Settings tested (original in bold) |
|---|---|
| Repurchase window | Last 4 quarters / last 8 quarters |
| Measure | Gross / net of issuance |
| Number of stocks | 20 / 30 / 50 |
That makes 12 settings. A setting "beats QQQ" when its daily Sharpe is higher than that of QQQ with dividends reinvested over the same dates.
Results
| Measure | Top 30 buyback yield | Control: 1,000 most traded, equal weight | QQQ total return |
|---|---|---|---|
| Verdict | ✗ Failed | Control | Benchmark |
| Annual return (CAGR) | 15.4% | 11.0% | 19.3% |
| Daily Sharpe (return per unit of risk) | 0.673 | 0.606 | 0.880 |
| Worst fall (max drawdown) | -50.0% | -40.9% | -35.1% |
| Settings beating QQQ | 0 of 12 | — | — |
CAGR is the average yearly growth rate. Daily Sharpe measures return per unit of day-to-day volatility: the mean daily return divided by its standard deviation, times the square root of 252, with no risk-free rate subtracted; it follows Sharpe (1994) with the rate set to zero. The first half ends on 2022-01-18 and the second starts on 2022-01-19, splitting the trading days in two.
The embedded FinLab report is the original setting. Its comparison line is the S&P 500 without dividends, an easier hurdle than the QQQ total return used in this article; the report's own grades are measured against that line and do not mean the rule passed the checks here, and its own Sharpe convention can differ slightly from the table.
Nearby settings
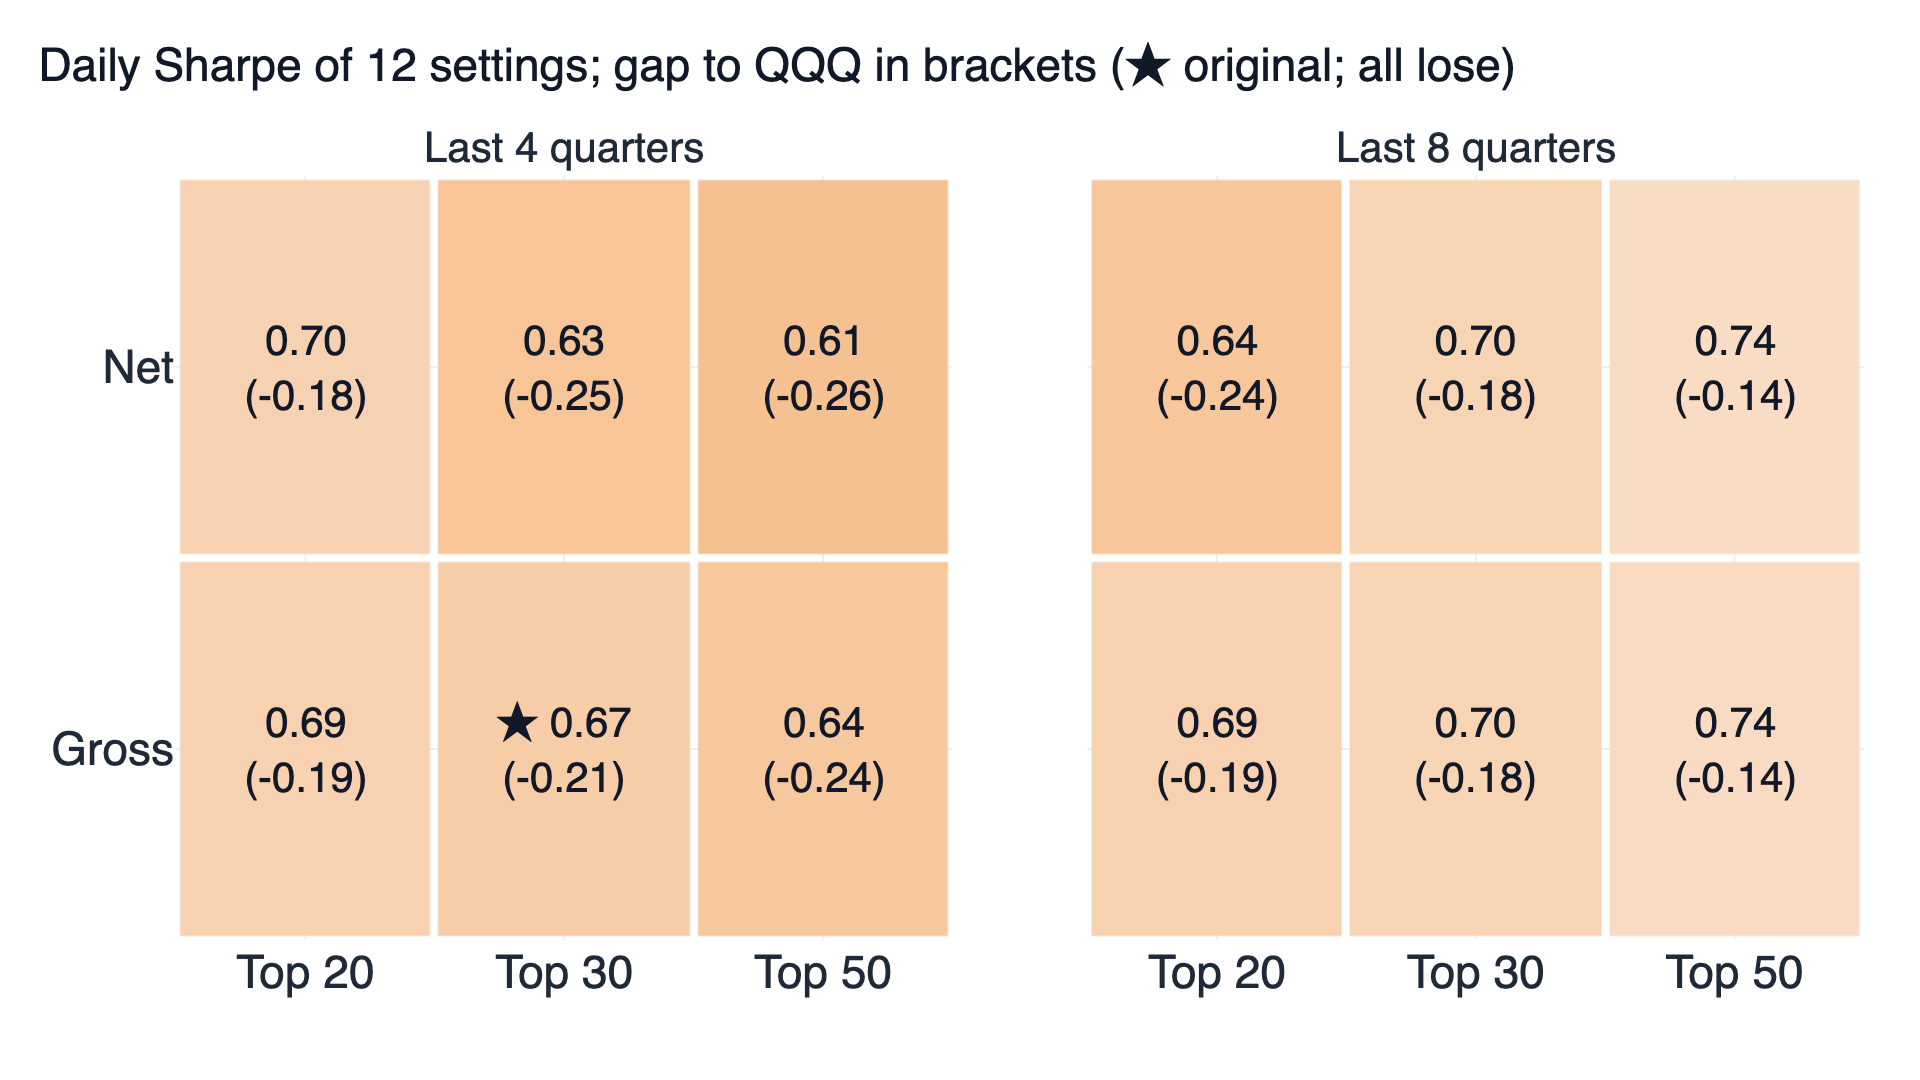
Even the closest cells are 0.14 below QQQ: the eight-quarter, 50-stock versions at a Sharpe of 0.74. With eight quarters, holding more stocks helps (0.69 to 0.74); with four quarters it hurts (0.69 to 0.64 for gross buybacks). Subtracting issuance has no consistent effect: net and gross differ by at most 0.053, in either direction.
The validation checks
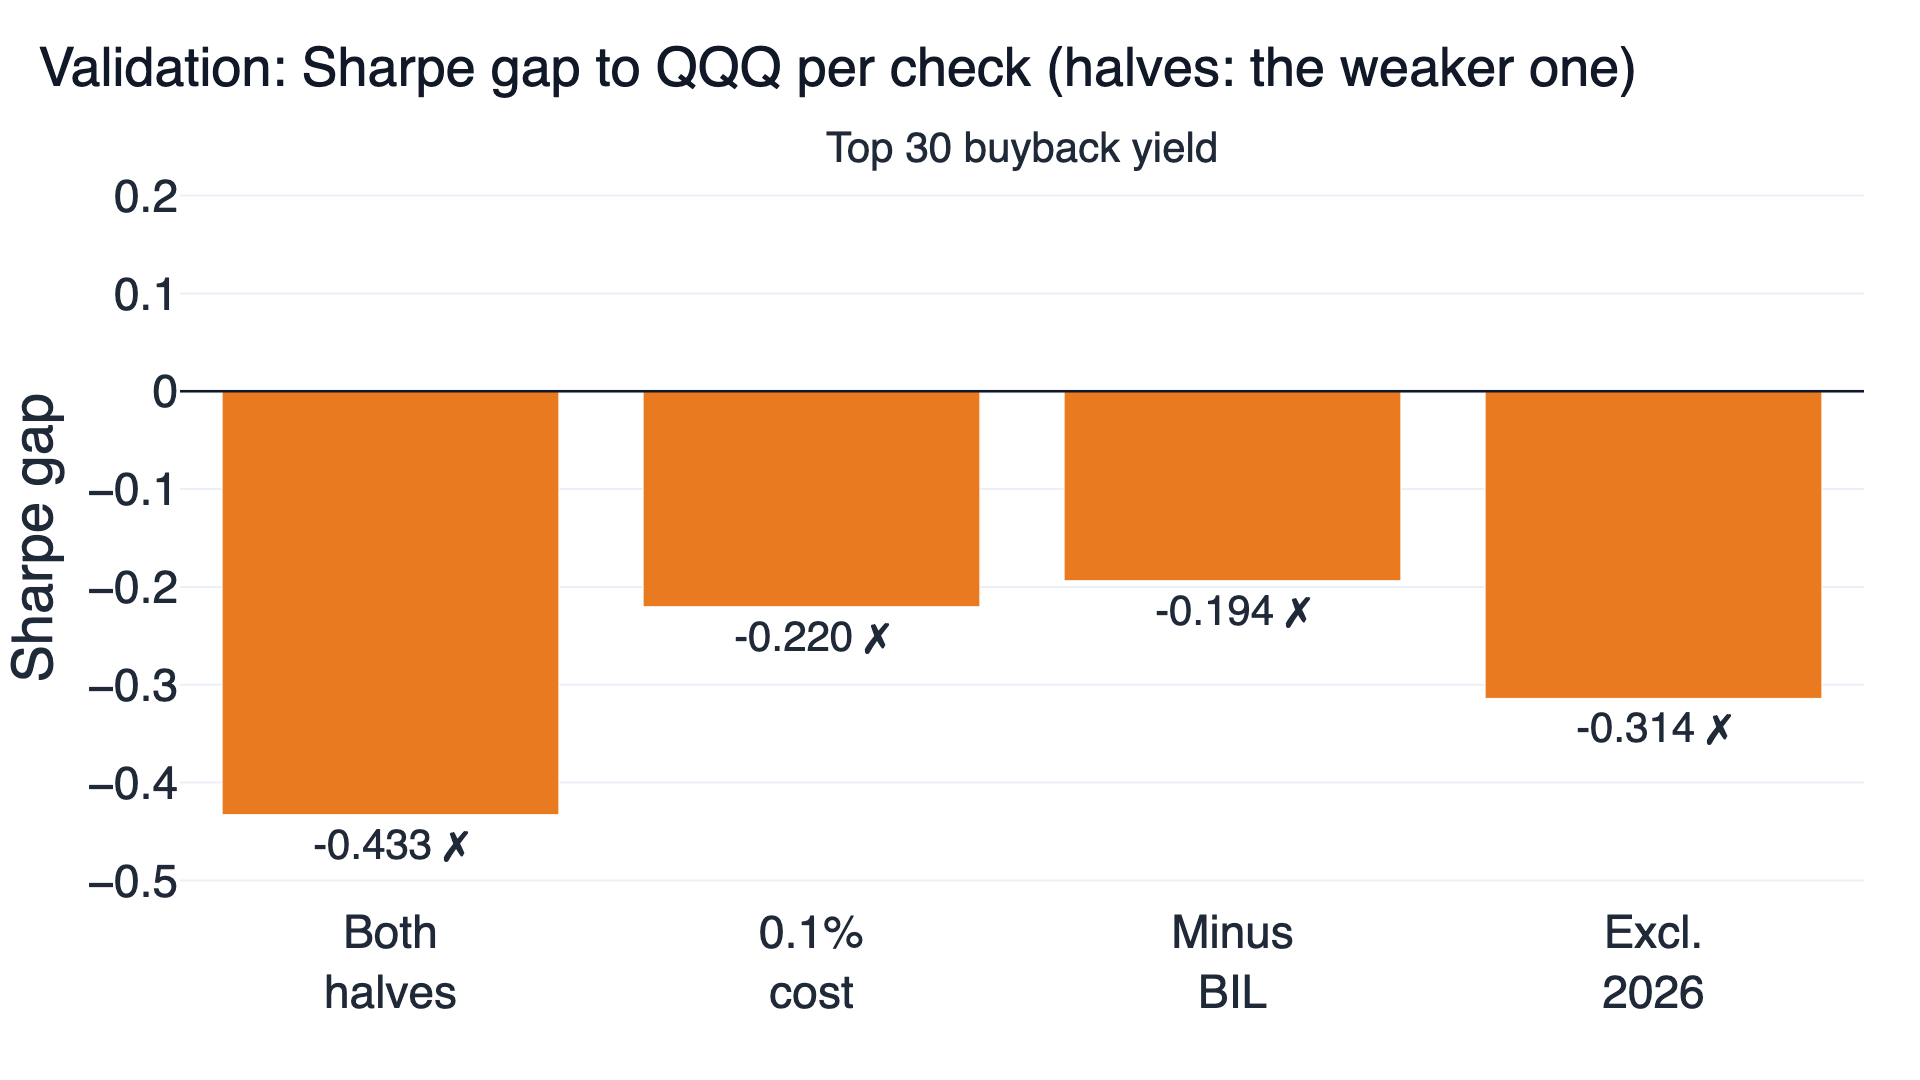
BIL is an ETF of 1–3 month US Treasury bills; subtracting its return shows what a portfolio earned above cash.
| Check | Top 30 buyback yield | QQQ |
|---|---|---|
| 70% of 12 settings beat QQQ | 0 of 12 ✗ | — |
| Both halves beat QQQ (first / second) | 0.654 / 0.696 ✗ | 1.087 / 0.677 |
| 0.1% cost per side, Sharpe | 0.659 ✗ | 0.880 |
| Returns minus BIL, Sharpe | 0.582 ✗ | 0.776 |
| Without the year of largest lead (2026) | 0.590 ✗ | 0.904 |
The second half is the only place the rule is ahead, by 0.019, and that half contains 2026. FinLab's default cost for US stocks is zero commission; the 0.1%-per-side run is a separate allowance for spreads and slippage. The portfolio replaces about 38% of its weight at each quarterly rebalance, so the cost run takes 0.4 percentage points a year off its return.
What the portfolio held
The ranking picks extreme repurchasers. The median yield of the stocks held was 15.8%. Among the pool, about 72% of companies had bought back some stock in the previous four quarters, and the median yield of those was 1.8%. A company reaches the top 30 by spending a large share of its value on its own stock. A falling share price raises the yield on the same dollars spent, so the ranking can also pick companies right after a decline.
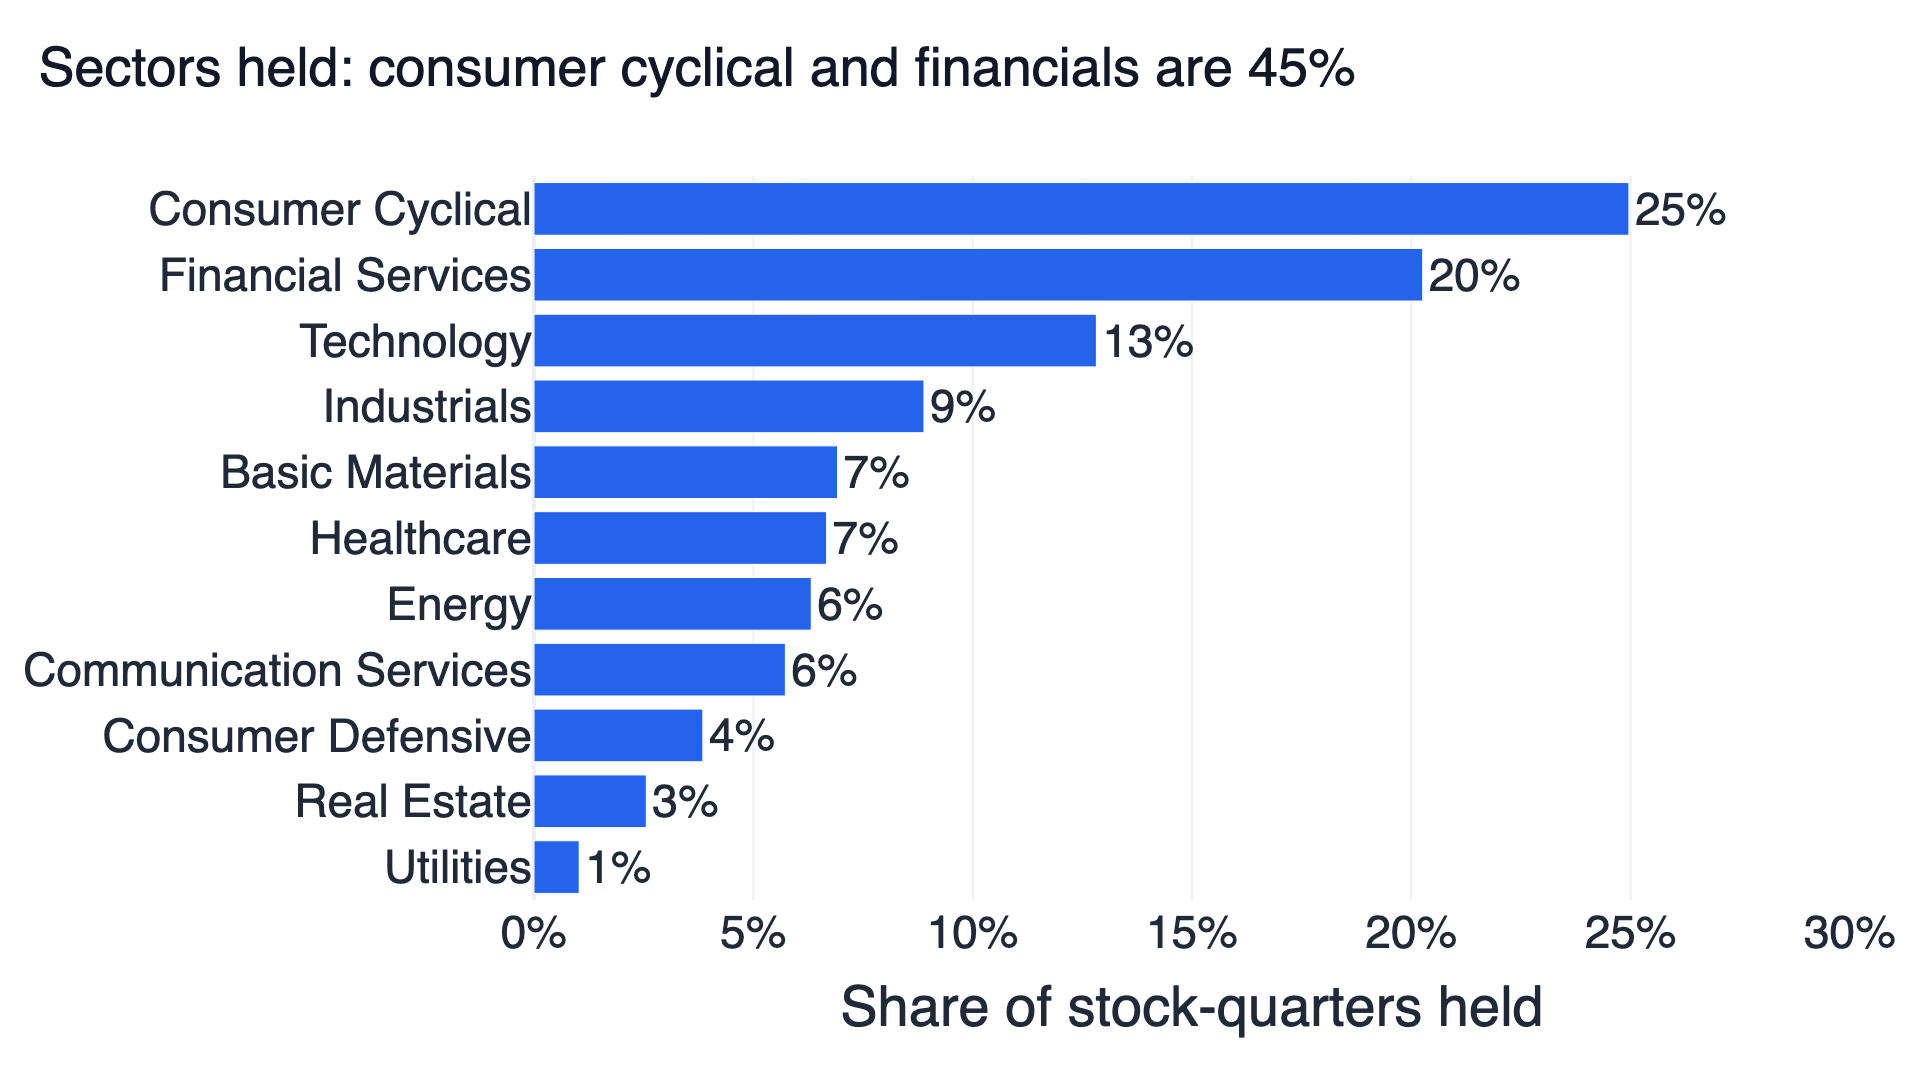
Consumer cyclical companies (retailers, autos, travel, homebuilders) and financial companies make up 45% of the stock-quarters held, and technology only 12.8%. Sectors come from the current company profile, so a company that changed sector is shown under today's label. QQQ, which tracks the Nasdaq-100, is concentrated in large technology companies, the opposite tilt.
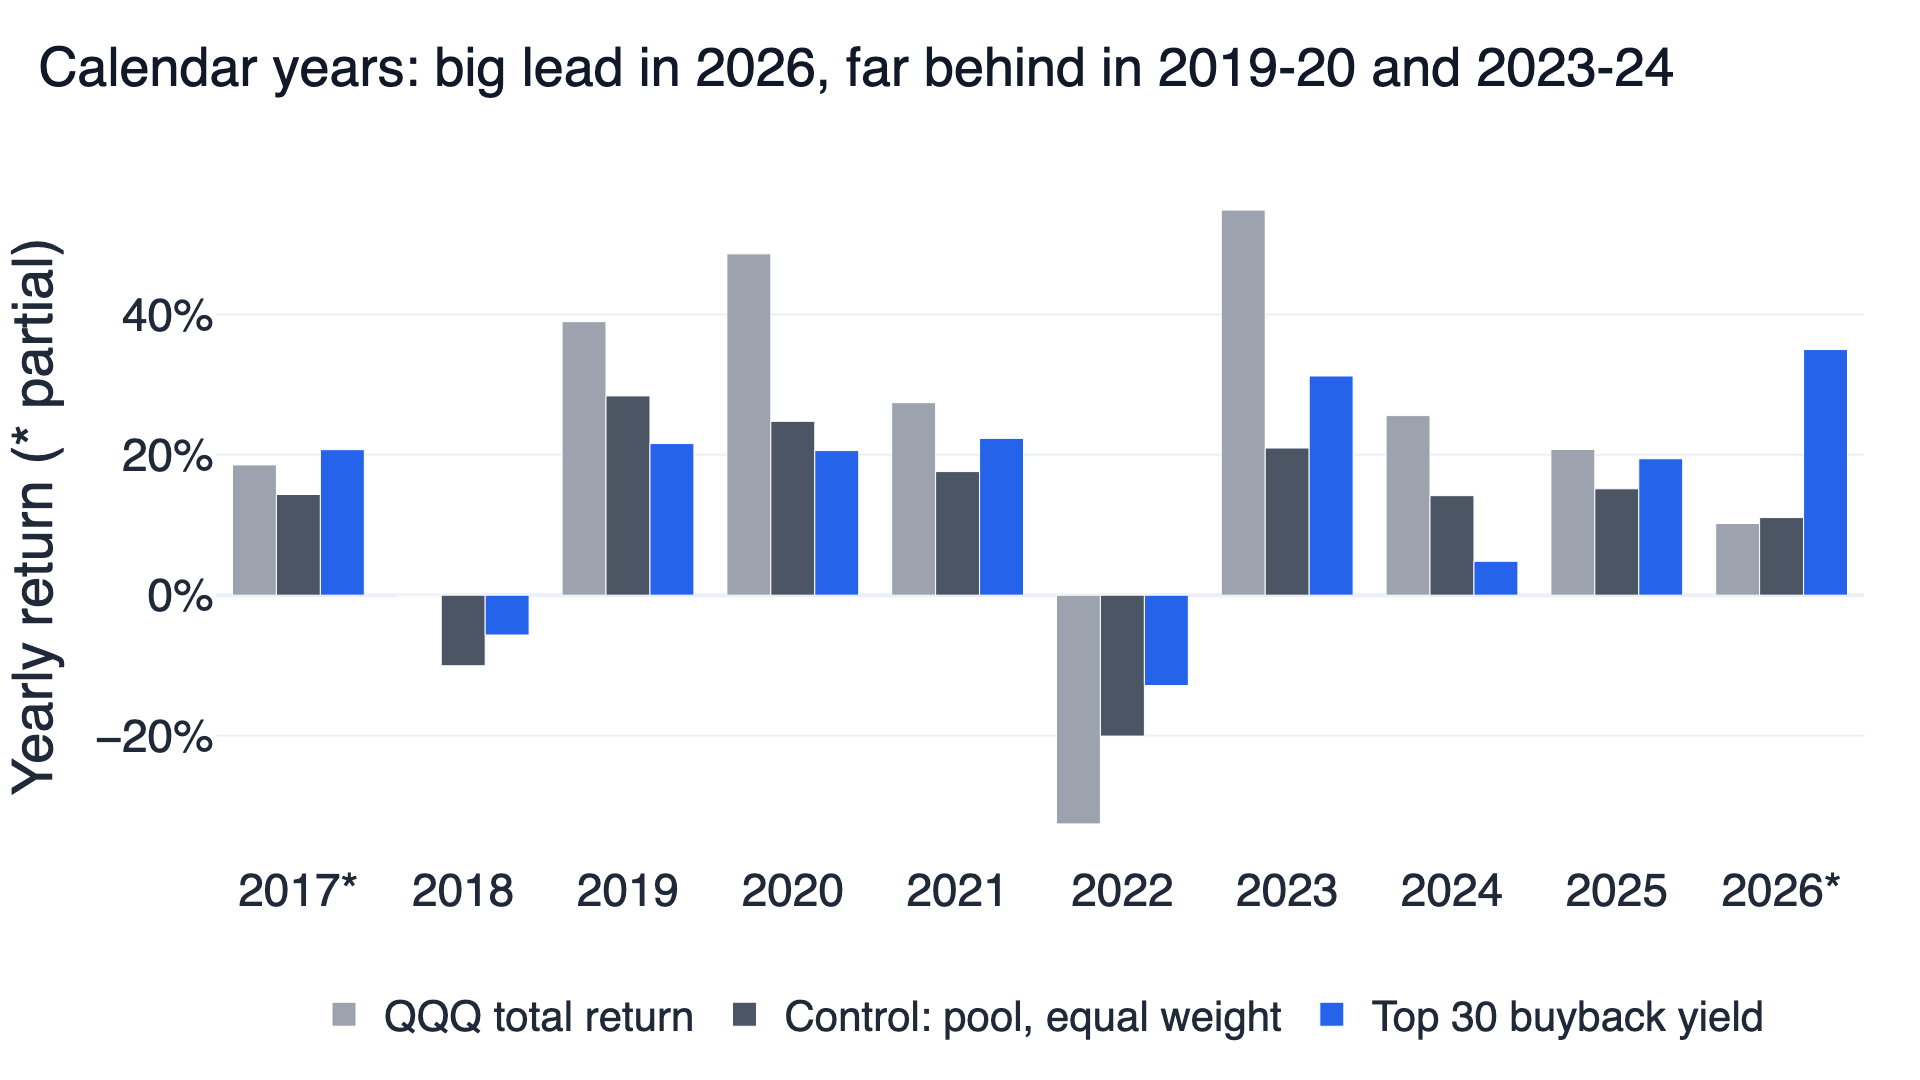
Year by year, the buyback portfolio beat its pool in 7 of 10 calendar years (2017 and 2026 are partial). Against QQQ it led only in 2017, 2022 and 2026, and fell far behind in the technology-led years: 21.6% against 39.0% in 2019, 20.6% against 48.6% in 2020, 31.2% against 54.9% in 2023 and 4.8% against 25.6% in 2024.
Why a high buyback yield did not beat QQQ
The buyback signal did something useful: within the same pool it added about four percentage points a year and lifted the Sharpe from 0.61 to 0.67, consistent with the papers above. The problem is the starting point. An equal-weighted portfolio of the 1,000 most traded US stocks returned 11.0% a year in this window, eight points less than QQQ. A filter that improves on that pool still has a long way to go.
The portfolio's risk also concentrated in the 2020 crash, when it lost half its value. Its maximum drawdown of 50.0% is deeper than the pool's 40.9% and QQQ's 35.1%.
Ranking on the cash spent also differs from the announcement effect in Ikenberry and colleagues, who measured returns from the day a program was announced. This study does not test announcements; the US corporate actions study tests other company events, such as dividend increases and stock splits.
How the test was run
- Universe: US common stocks, delisted ones included, one share class per company, no ETFs, funds or ADRs. On each rebalance day a stock must close above $5, trade more than $5 million a day on average over 60 days, and have had no daily move of 50% or more in the past year. The 1,000 most traded of these form the pool. Financial companies are kept; that choice was fixed with the rest of the rules.
- Look-ahead: repurchase amounts are used from the date the quarterly report was filed, which FinLab's US statements already align to. Market value is FinLab's
etl:us_market_value: the most recently reported quarterly share count times the close, with later stock splits taken out. The rule trades at the close after the rebalance day. - Survivorship: delisted companies stay in the data until their last price. Sector labels come from the current company profile, which is a present-day snapshot.
- Weights and turnover: equal weight across 30 stocks, rebalanced quarterly, about 38% one-way turnover per rebalance and 1,170 trades in total.
- Costs and slippage: zero commission by default, with a separate run at 0.1% per side. Capacity and market impact were not estimated.
- Data: results run from 2017-04-03, the first day eight quarters of repurchases are on file, to 2026-11-10. The run was completed on 2026-11-12 with finlab 2.3.8. Company profiles are updated daily, so a rerun on a later day can give slightly different numbers.
- Limits: this is an in-sample test with no out-of-sample period. Bailey and colleagues (2017) explain why one backtest tends to overstate future results; no overfitting probability is estimated here.
Reproduce the rule with an AI agent
Set up the FinLab skill for Claude Code, Codex or Gemini CLI with the FinLab setup flow; the agent guide explains what the agent can do with it. The direct install command is:
Show Code
npx skills add koreal6803/finlab-ai --skill finlab -g -yFinLab Studio runs the same research in a browser. A good first request: "Download the buyback research program, run the original setting, and show me the 30 stocks it holds at the latest rebalance with their buyback yields."
Download the research program as research.py next to your notebook; it also contains the buy-the-dip and Altman Z tests. This excerpt rebuilds the original setting with its universe helpers. Login is handled by FinLab.
Show Code
import finlab
from finlab import data
from research import use, liquidity, most_traded, on_rebalance, rebalance_days, backtest

finlab.login()
use("us")

# Cash spent on repurchases over the last four quarters, divided by market value
repurchased = -data.get("us_cash_flow:common_stock_repurchased")
last_year = repurchased.rolling(4, min_periods=4).sum()
buyback_yield = on_rebalance(last_year / data.get("etl:us_market_value"))

# The 1,000 most traded stocks that pass the price and liquidity screens
eligible, _ = liquidity()
pool = most_traded(eligible, 1000)

# Hold the 30 highest positive yields, equal weight, rebalanced each quarter
candidates = buyback_yield.where(pool & (buyback_yield > 0) & (buyback_yield <= 0.5))
position = candidates.rank(axis=1, ascending=False, method="first") <= 30
report = backtest(position, rebalance_days())
Questions about stock buybacks
Are stock buybacks good for shareholders? They return cash, and over this decade the heaviest repurchasers beat an equal-weighted pool of the 1,000 most traded US stocks. Whether a given buyback is good depends on the price paid; a company buying at a high price transfers value to the shareholders who sell.
Do stock buybacks raise the share price? Repurchases reduce the share count, which raises earnings per share. The price effect is not automatic: in this test the top repurchasers fell 50.0% in the 2020 crash.
What is the difference between gross and net buybacks? Net subtracts the shares issued, mostly to employees. In this test net was lower in 4 of 6 cells (one by less than 0.001) and higher in 2, by at most 0.053, with no consistent direction.
Is buyback yield the same as shareholder yield? Shareholder yield usually adds dividends and sometimes debt paydown. This study uses repurchases alone; the famous stock screens study and the academic factors study test other value measures.
Why not limit the rule to the S&P 500? Point-in-time index membership is available, but the pool here is defined by trading value so every year has the same 1,000 stocks to choose from. The S&P 500 additions study shows how index changes behaved.
How is this different from Taiwan's treasury-stock research? Taiwan companies announce buybacks with a fixed window and target. The Taiwan study measures the announcement; this one ranks the cash actually spent by US companies.
The US strategy overview lists validated rules and negative results side by side. Related studies include the quality and value strategy, the Piotroski F-Score, the Altman Z-score filter and buying the dip on QQQ. The backtesting guide explains filing dates and survivorship bias.
Research downloads
| File | Contents |
|---|---|
| Open buyback strategy report (web) | Opens in your browser: daily balance, every trade and yearly returns of the original setting |
| Download daily balances (CSV) | Daily balances of the rule, its pool, QQQ and BIL; opens in a spreadsheet |
| Download complete test results (JSON) | Every setting, check and sector share, for AI or coding tools |
| Download research program (Python) | For your AI agent or for programmers; one program for all three studies in this batch |
Past performance does not guarantee future results. This material is for research and education and is not investment advice. It does not recommend buying or selling any stock, and a company's past repurchases do not guarantee future ones.
Last updated: 2026-11 | Backtest window: 2017-04-03 to 2026-11-10 | Author: FinLab Quant Research. The team maintains reproducible Taiwan and US market studies using FinLab data.
FinLab AI
Want to build your own strategy?
Describe your stock-picking ideas in natural language. AI automatically validates, backtests, and gives you answers
Start Free