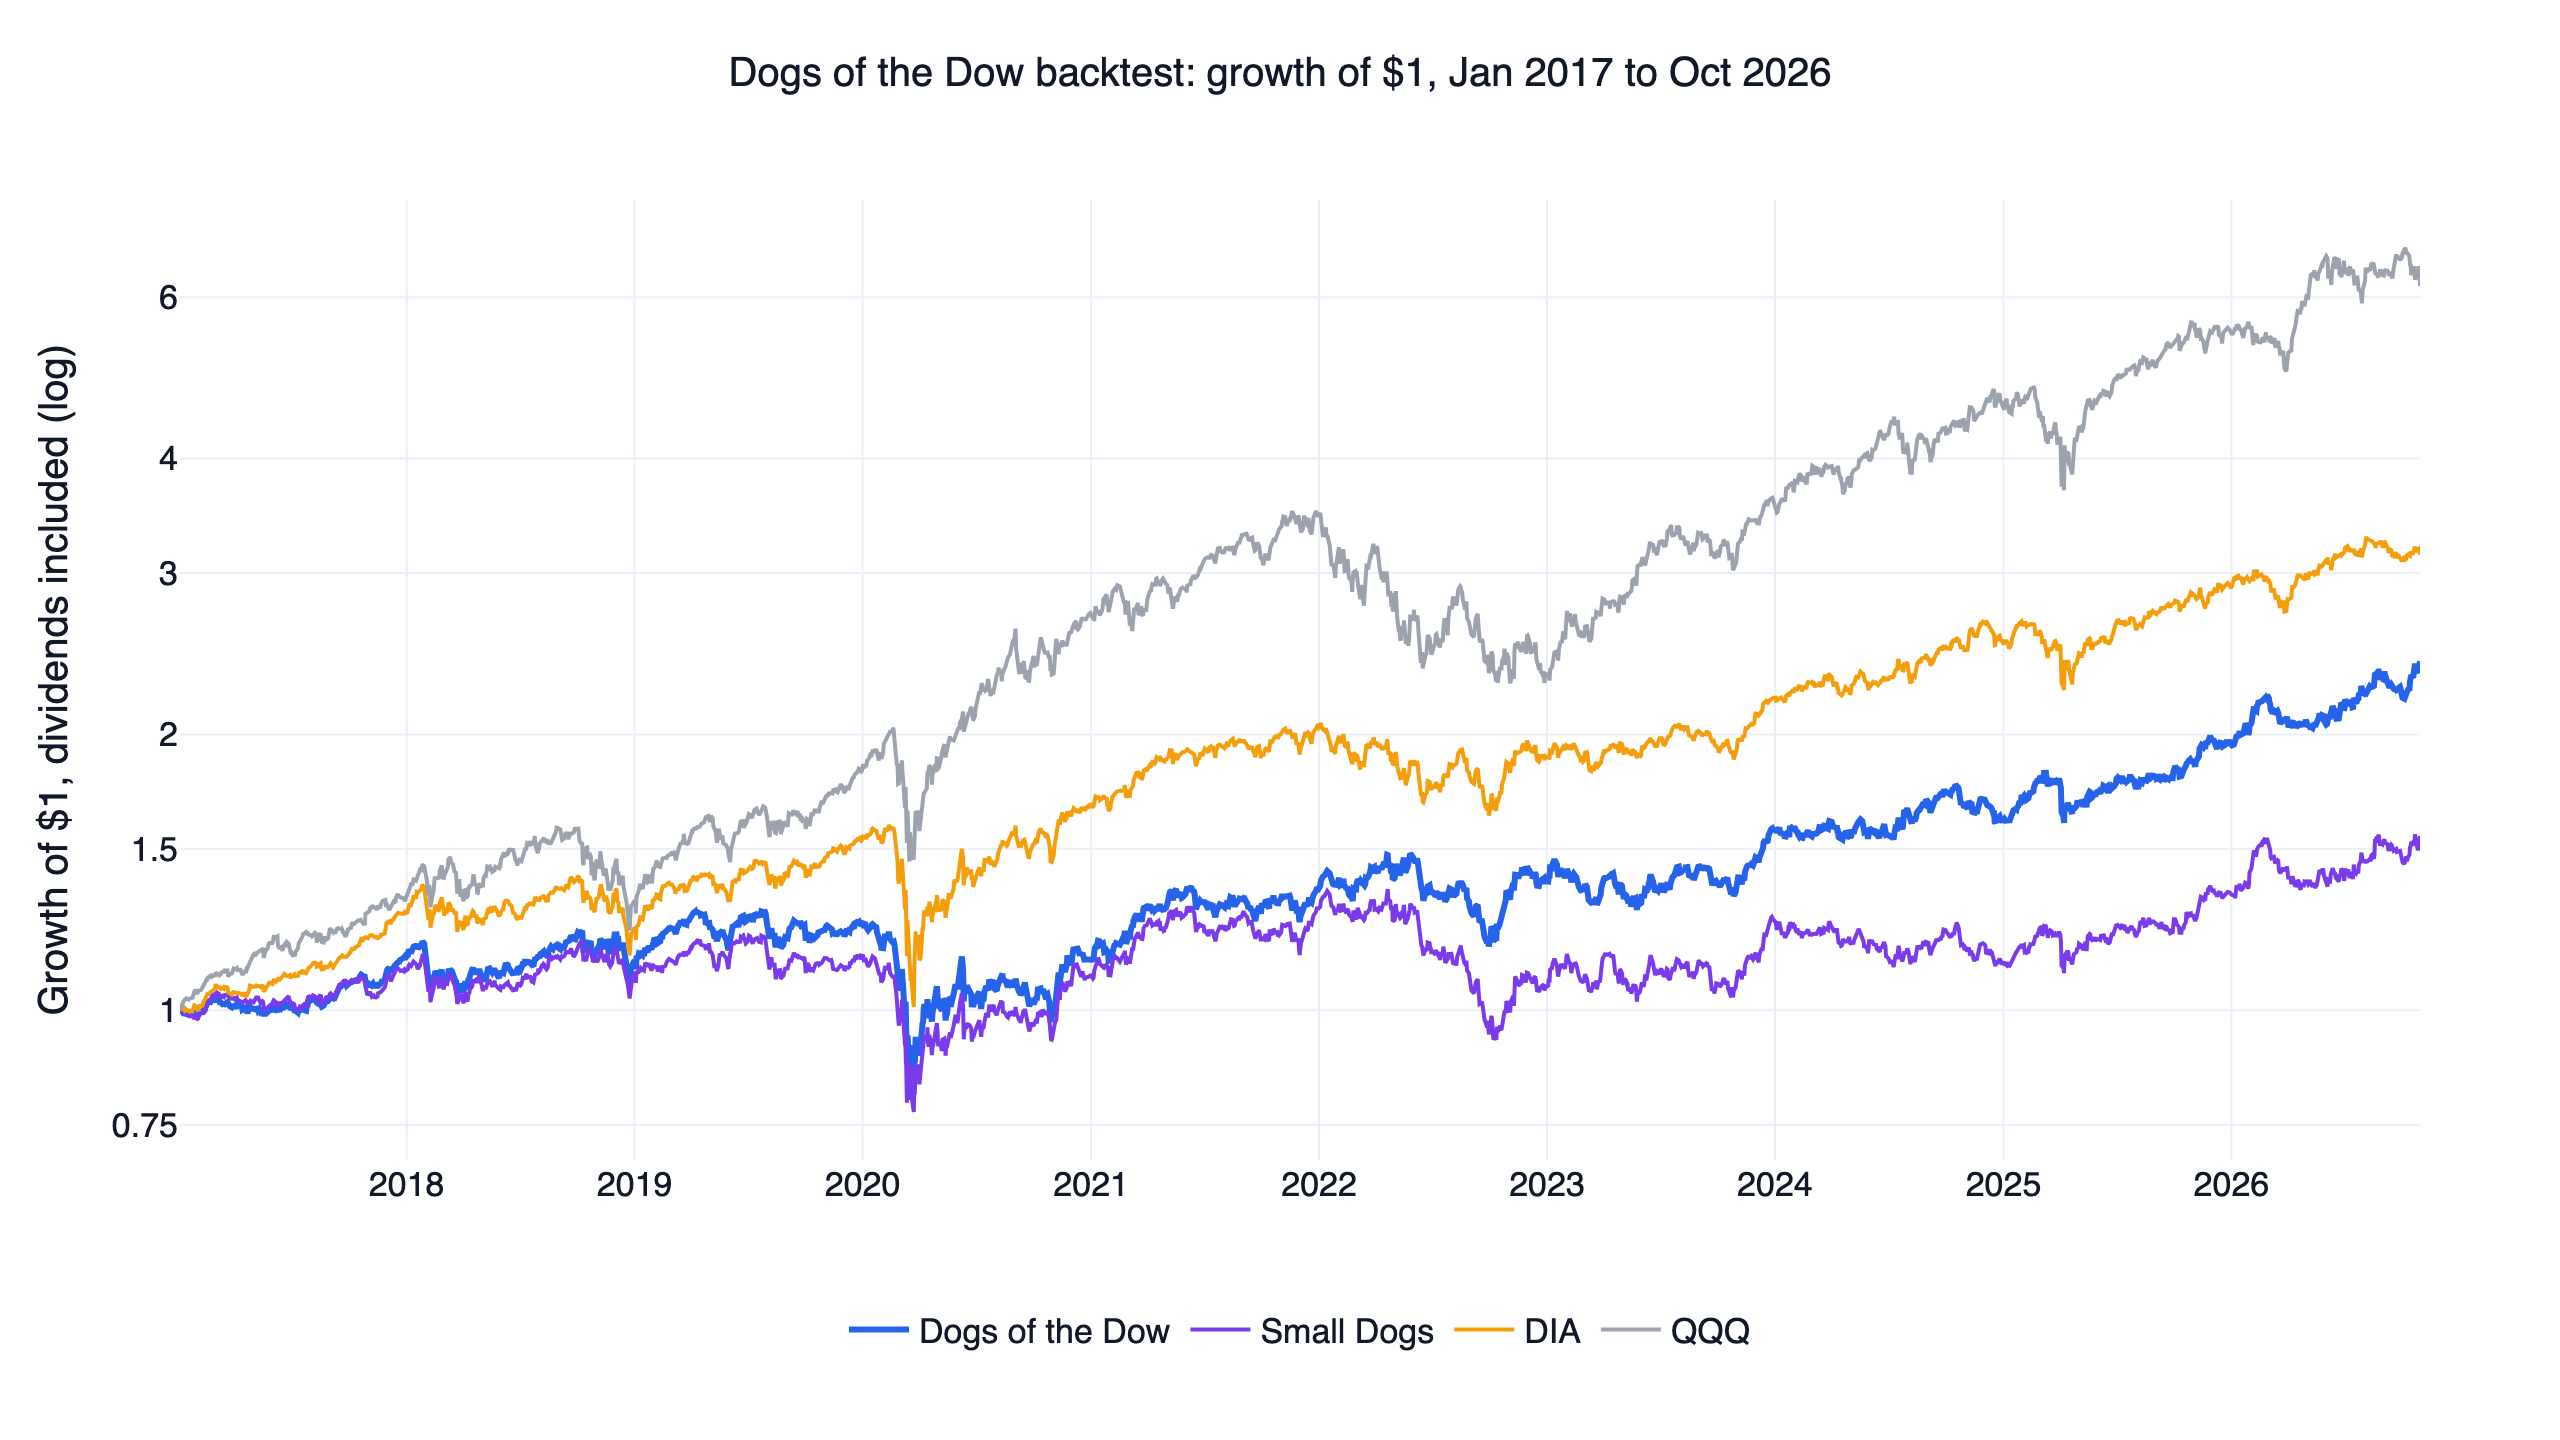
Run this strategy
Copy the prompt to reproduce the evidence above with the article’s data, assumptions, and risk checks.
Tell your AI:
Set up FinLab and rerun the PEG ratio backtest on S&P 500 members against QQQ and RSP. Please read: https://finlab.finance/en/setup?relatedUrl=/en/blog/peg-ratio-backtest
The PEG ratio is a stock's price-to-earnings ratio divided by its earnings growth rate in percent, and the usual rule of thumb calls 1 fair value. We held every S&P 500 member with a PEG below 1 from April 2018 to October 2026. It returned 11.6% a year with a daily Sharpe ratio of 0.65, against 19.8% and 0.88 for QQQ with dividends and 11.8% and 0.68 for the equal-weight RSP. Stocks with a PEG under 0.5 were the weakest slice, at 0.58. A version using three-year growth scored 1.05 against QQQ's 1.03 from April 2020, and 0.72 against 0.75 from April 2021. None of the three designs passed our checks, so none became a strategy.
The designs, their settings and the pass rules were written down before any result was seen. The PEG bands, the monthly counts and the April 2021 comparison came afterwards. These are three of nine designs across this article, the Piotroski F-Score backtest and the low volatility stocks backtest. None of the nine passed.
PEG ratio backtest: key numbers
| Design | Daily Sharpe | CAGR | Max drawdown | Settings beating QQQ | Settings beating RSP | First / second half | Sharpe at 0.1% per side |
|---|---|---|---|---|---|---|---|
| PEG below 1 | 0.65 | 11.6% | -42.1% | 0 / 9 | 1 / 9 | 0.34 / 1.15 | 0.63 |
| Lowest PEG in each sector | 0.61 | 10.9% | -42.4% | 0 / 9 | 0 / 9 | 0.38 / 0.96 | 0.58 |
| RSP, total return | 0.68 | 11.8% | -39.0% | reference | 0.52 / 0.95 | ||
| SPY, total return | 0.84 | 15.1% | -33.7% | reference | 0.61 / 1.17 | ||
| QQQ, total return | 0.88 | 19.8% | -35.1% | benchmark | 0.71 / 1.09 | ||
| Multi-year PEG, three-year growth | 1.05 | 19.6% | -24.5% | 3 / 9 | 2 / 9 | 1.03 / 1.14 | 1.03 |
| RSP, same dates | 1.06 | 18.4% | -21.4% | reference | 1.14 / 0.99 | ||
| SPY, same dates | 1.16 | 20.2% | -24.5% | reference | 1.13 / 1.21 | ||
| QQQ, same dates | 1.03 | 23.1% | -35.1% | benchmark | 1.05 / 1.02 |
The first five rows run from 2018-04-02 to 2026-10-30, split at 2022-07-14. The last four run from 2020-04-01 to 2026-10-30, split at 2023-07-17. The multi-year settings are counted on each setting's own dates, which changes the result.
What is the PEG ratio?
The price-to-earnings ratio tells you what the market pays for a dollar of current earnings, and it says nothing about whether those earnings are growing. The PEG ratio brings growth in:
PEG ratio = P/E ratio ÷ annual earnings growth rate in percent
Growth goes in as a whole number, so 25% growth is 25. Here is the arithmetic for two made-up companies with round numbers:
| Company A | Company B | |
|---|---|---|
| Share price | $60 | $63 |
| Earnings per share (EPS), last four quarters | $3.00 | $4.20 |
| EPS, the four quarters before that | $2.40 | $4.00 |
| P/E ratio | 60 ÷ 3.00 = 20 | 63 ÷ 4.20 = 15 |
| EPS growth | 3.00 ÷ 2.40 - 1 = 25% | 4.20 ÷ 4.00 - 1 = 5% |
| PEG ratio | 20 ÷ 25 = 0.8 | 15 ÷ 5 = 3.0 |
Company B has the lower P/E and the higher PEG. A high multiple can be cheap for its growth, and a low one can be expensive for it. If earnings are negative or shrinking, the formula gives a negative or meaningless number, so a PEG exists for only part of the market.
The ratio is credited to Mario Farina's 1969 book A Beginner's Guide to Successful Investing in the Stock Market, and Peter Lynch made it famous. In One Up on Wall Street, Lynch (1989) wrote: "The P/E ratio of any company that's fairly priced will equal its growth rate." That sentence is the source of the rule of thumb: a PEG of 1 is fair, below 1 is cheap and above 1 is expensive. AAII's summary of his screen adds two more lines: a P/E at half of historical earnings growth counts as attractive, and a ratio above 2.0 as unattractive.
Academic work is more guarded about the denominator. Easton (2004) found that expected returns implied by the PEG ratio correlate highly with a more refined estimate, which supports it as a simple way to rank stocks, and calls it "arguably still too simplistic" because it assumes short-run growth also captures the long run. Chan, Karceski & Lakonishok (2003) found no persistence in long-term earnings growth beyond chance. The multi-year design below stretches the denominator to two, three and four years of growth.
A PEG also depends on whose growth rate goes into it. Screens may use trailing growth or analyst forecasts, so two websites can quote different PEGs for the same stock. Everything here uses trailing growth: the last four quarters of EPS against the same four quarters a year earlier.
What is a good PEG ratio?
The usual answer is below 1, with under 0.5 seen as especially cheap and above 2 as expensive. In S&P 500 stocks from April 2018 to October 2026 that order did not hold. Stocks under 0.5 scored lowest, stocks between 0.5 and 2 scored highest, and stocks with no usable PEG stayed close to the equal-weight index. No band reached QQQ.
We added this table after seeing the results, so it describes one window and tests nothing. Each month members go into slices by PEG, using one-year EPS growth, and each slice is held at equal weight.
| PEG band | Stocks held on average | Daily Sharpe | CAGR | Max drawdown |
|---|---|---|---|---|
| Under 0.5 | 55 | 0.58 | 10.5% | -42.9% |
| 0.5 to 1 | 47 | 0.71 | 12.7% | -41.3% |
| 1 to 1.5 | 28 | 0.71 | 12.4% | -40.9% |
| 1.5 to 2 | 18 | 0.77 | 13.9% | -35.4% |
| 2 to 3 | 22 | 0.62 | 10.5% | -36.5% |
| Over 3 | 47 | 0.66 | 10.8% | -35.5% |
| No usable PEG | 276 | 0.69 | 12.7% | -41.0% |
| RSP, total return | fund | 0.68 | 11.8% | -39.0% |
| QQQ, total return | fund | 0.88 | 19.8% | -35.1% |
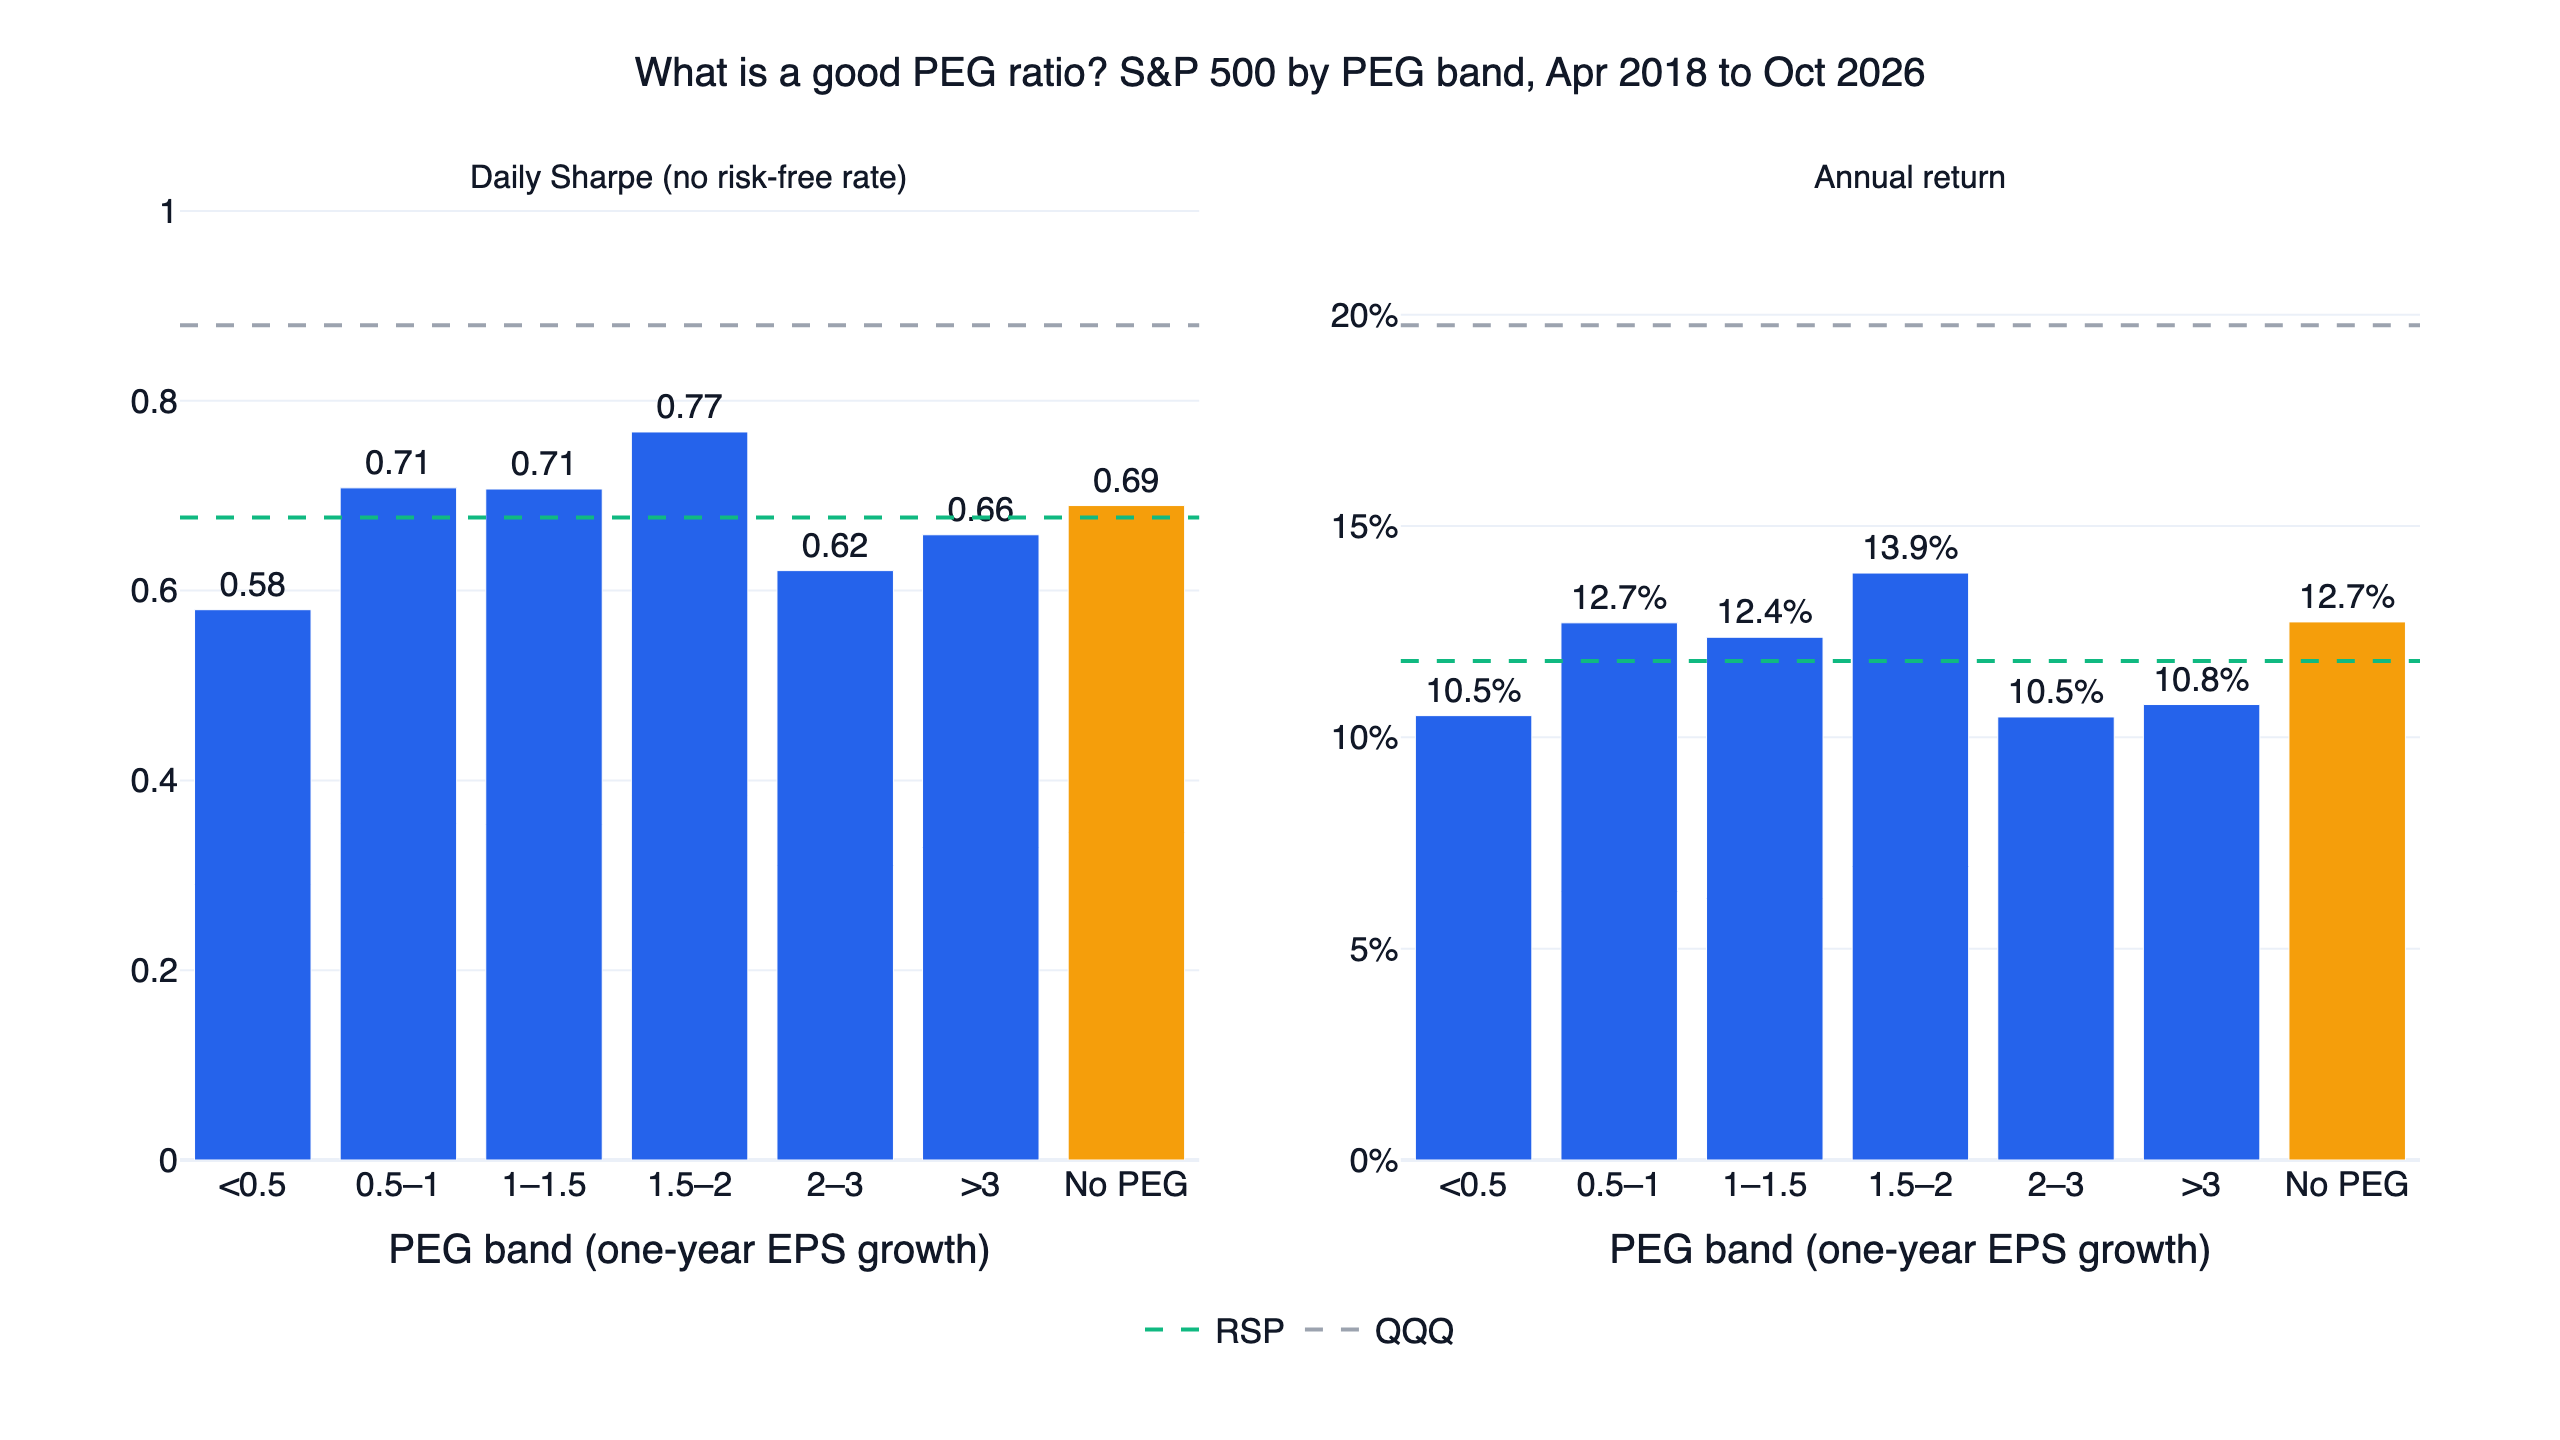
- Under 0.5 was the weakest slice at 0.58, with the deepest drawdown of the seven. The range the rule of thumb likes best scored lowest in this window.
- 0.5 to 2 covers three slices at 0.71, 0.71 and 0.77, all above RSP's 0.68.
- 2 to 3 and over 3 scored 0.62 and 0.66, below RSP, with shallower drawdowns of -36.5% and -35.5%. Over 3 still beat under 0.5.
- No usable PEG covers losses, shrinking EPS, growth above 100% and missing figures. These 276 stocks on average scored 0.69, close to RSP, and returned 12.7% a year, more than the under-0.5 slice.
Volatility mostly fell as PEG rose, from 21.1% in the lowest slice to 18.0% in the highest; QQQ's was 23.7%. The two lowest slices together are the PEG below 1 design: 55 plus 47 is the 102 stocks it held on average.
The 1.5 to 2 bar is the tallest, and it averages 18 stocks. The slices on either side of it scored 0.71 and 0.62, so we do not read a sweet spot into it. In this table a PEG below 1 scored no better than a PEG of 1 to 2, and a PEG under 0.5 scored below both. The gaps are small for one 8.6-year window and the order changed between its two halves: under 0.5 scored 0.27 in the first and 1.05 in the second. This describes the window and sets no rule.
How many S&P 500 stocks have a usable PEG?
Fewer than half, on average. A usable PEG here needs positive earnings, positive EPS a year ago and growth between 0 and 100%. At an average month end 44% of members had one and 21% sat below 1. At the end of October 2026 those shares were 57% and 27%, with a median PEG of 1.09. The median ranged from 0.52 to 1.68 over the window.
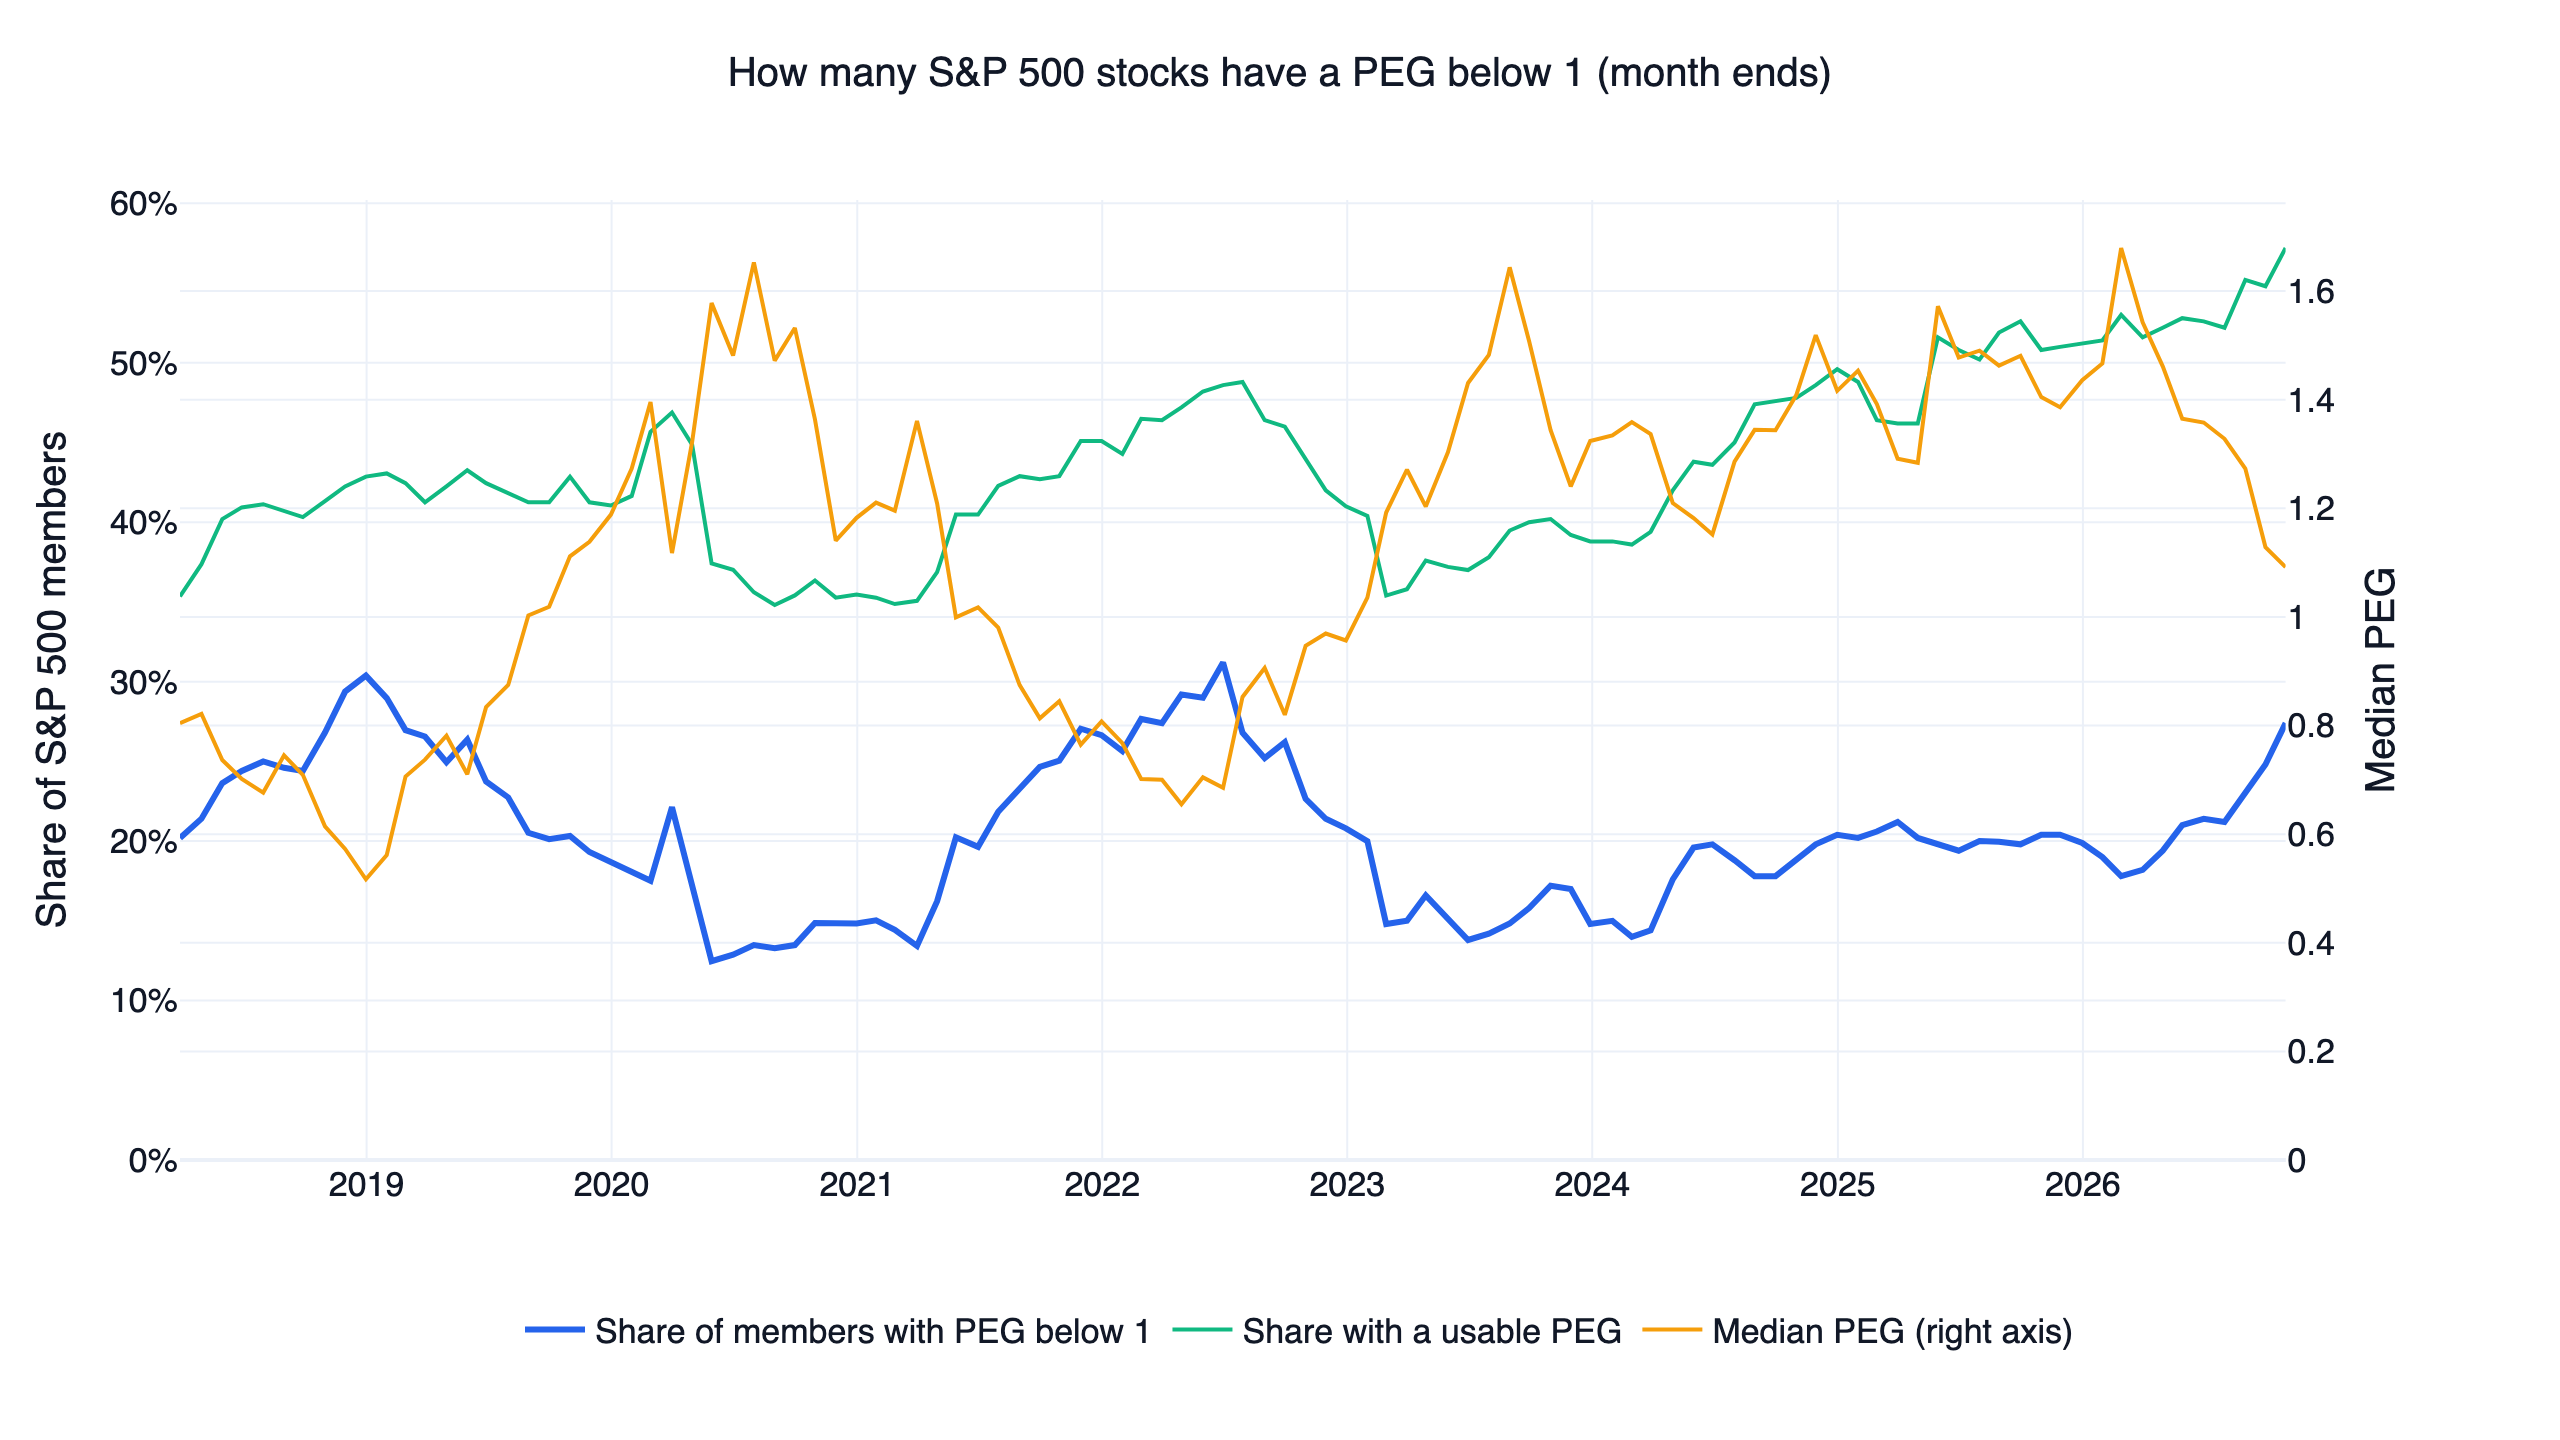
The blue line, the share below 1, ran from 12.5% in May 2020 to 31.2% in June 2022, and also reached 30.4% in December 2018. The green line, the share with a usable PEG, fell to 34.8% in August 2020 and reached 57.2% in October 2026, the last month shown. The orange line, the median among stocks with a usable PEG, bottomed at 0.52 in December 2018 and hit 1.68 in February 2026.
A fixed line at 1 does not pick a fixed share of the market. The PEG below 1 basket ranged from 62 to 156 stocks.
How a design had to pass
"Beat" means a higher daily Sharpe ratio than QQQ with dividends reinvested, over exactly the same dates. Sharpe here is the mean daily return over its standard deviation, times √252, with no risk-free rate subtracted. Some strategy comparison pages on this site may use monthly Sharpe ratios, so keep these figures apart from those.
- Neighbouring settings. At least 70% of the nine settings around the original beat QQQ.
- Both halves. The original setting beats QQQ in each half of its window.
- Costs. The original setting beats QQQ at finlab's default US cost of zero and at 0.1% per side.
- No single year. It still beats QQQ without the calendar year of its largest lead.
- Cash. A design averaging over 10% in cash must also beat QQQ on returns above T-bills (BIL). All three PEG designs stayed fully invested, so this rule did not apply.
- Combinations. A combined design must beat its single-signal base. None of these three is a combination.
RSP is the most useful control. These designs are equal-weight baskets of S&P 500 stocks and RSP is the S&P 500 at equal weight, so losing to QQQ alone says little. As a check on the setup, equal-weighting all members tracks RSP closely: daily correlation 0.998, Sharpe 0.68 against 0.68.
The three PEG designs and their results
PEG here is market value over four quarters of net income, divided by EPS growth in percent. Each design holds equal weights with at most 5% in a stock and changes hands monthly.
- PEG below 1. Every member with a PEG below T and one-year EPS growth above 0 and at most a cap. T is 0.75, 1 or 1.25 and the cap is 50%, 100% or 200%. The original is 1 and 100%.
- Lowest PEG in each sector. The N lowest PEGs in each of the 11 sectors, with the same growth cap. N is 2, 3 or 4. The original is 3 and 100%.
- Multi-year PEG. The first design with Y-year annualised EPS growth, capped at 100%. Y is 2, 3 or 4 and the original is 3.
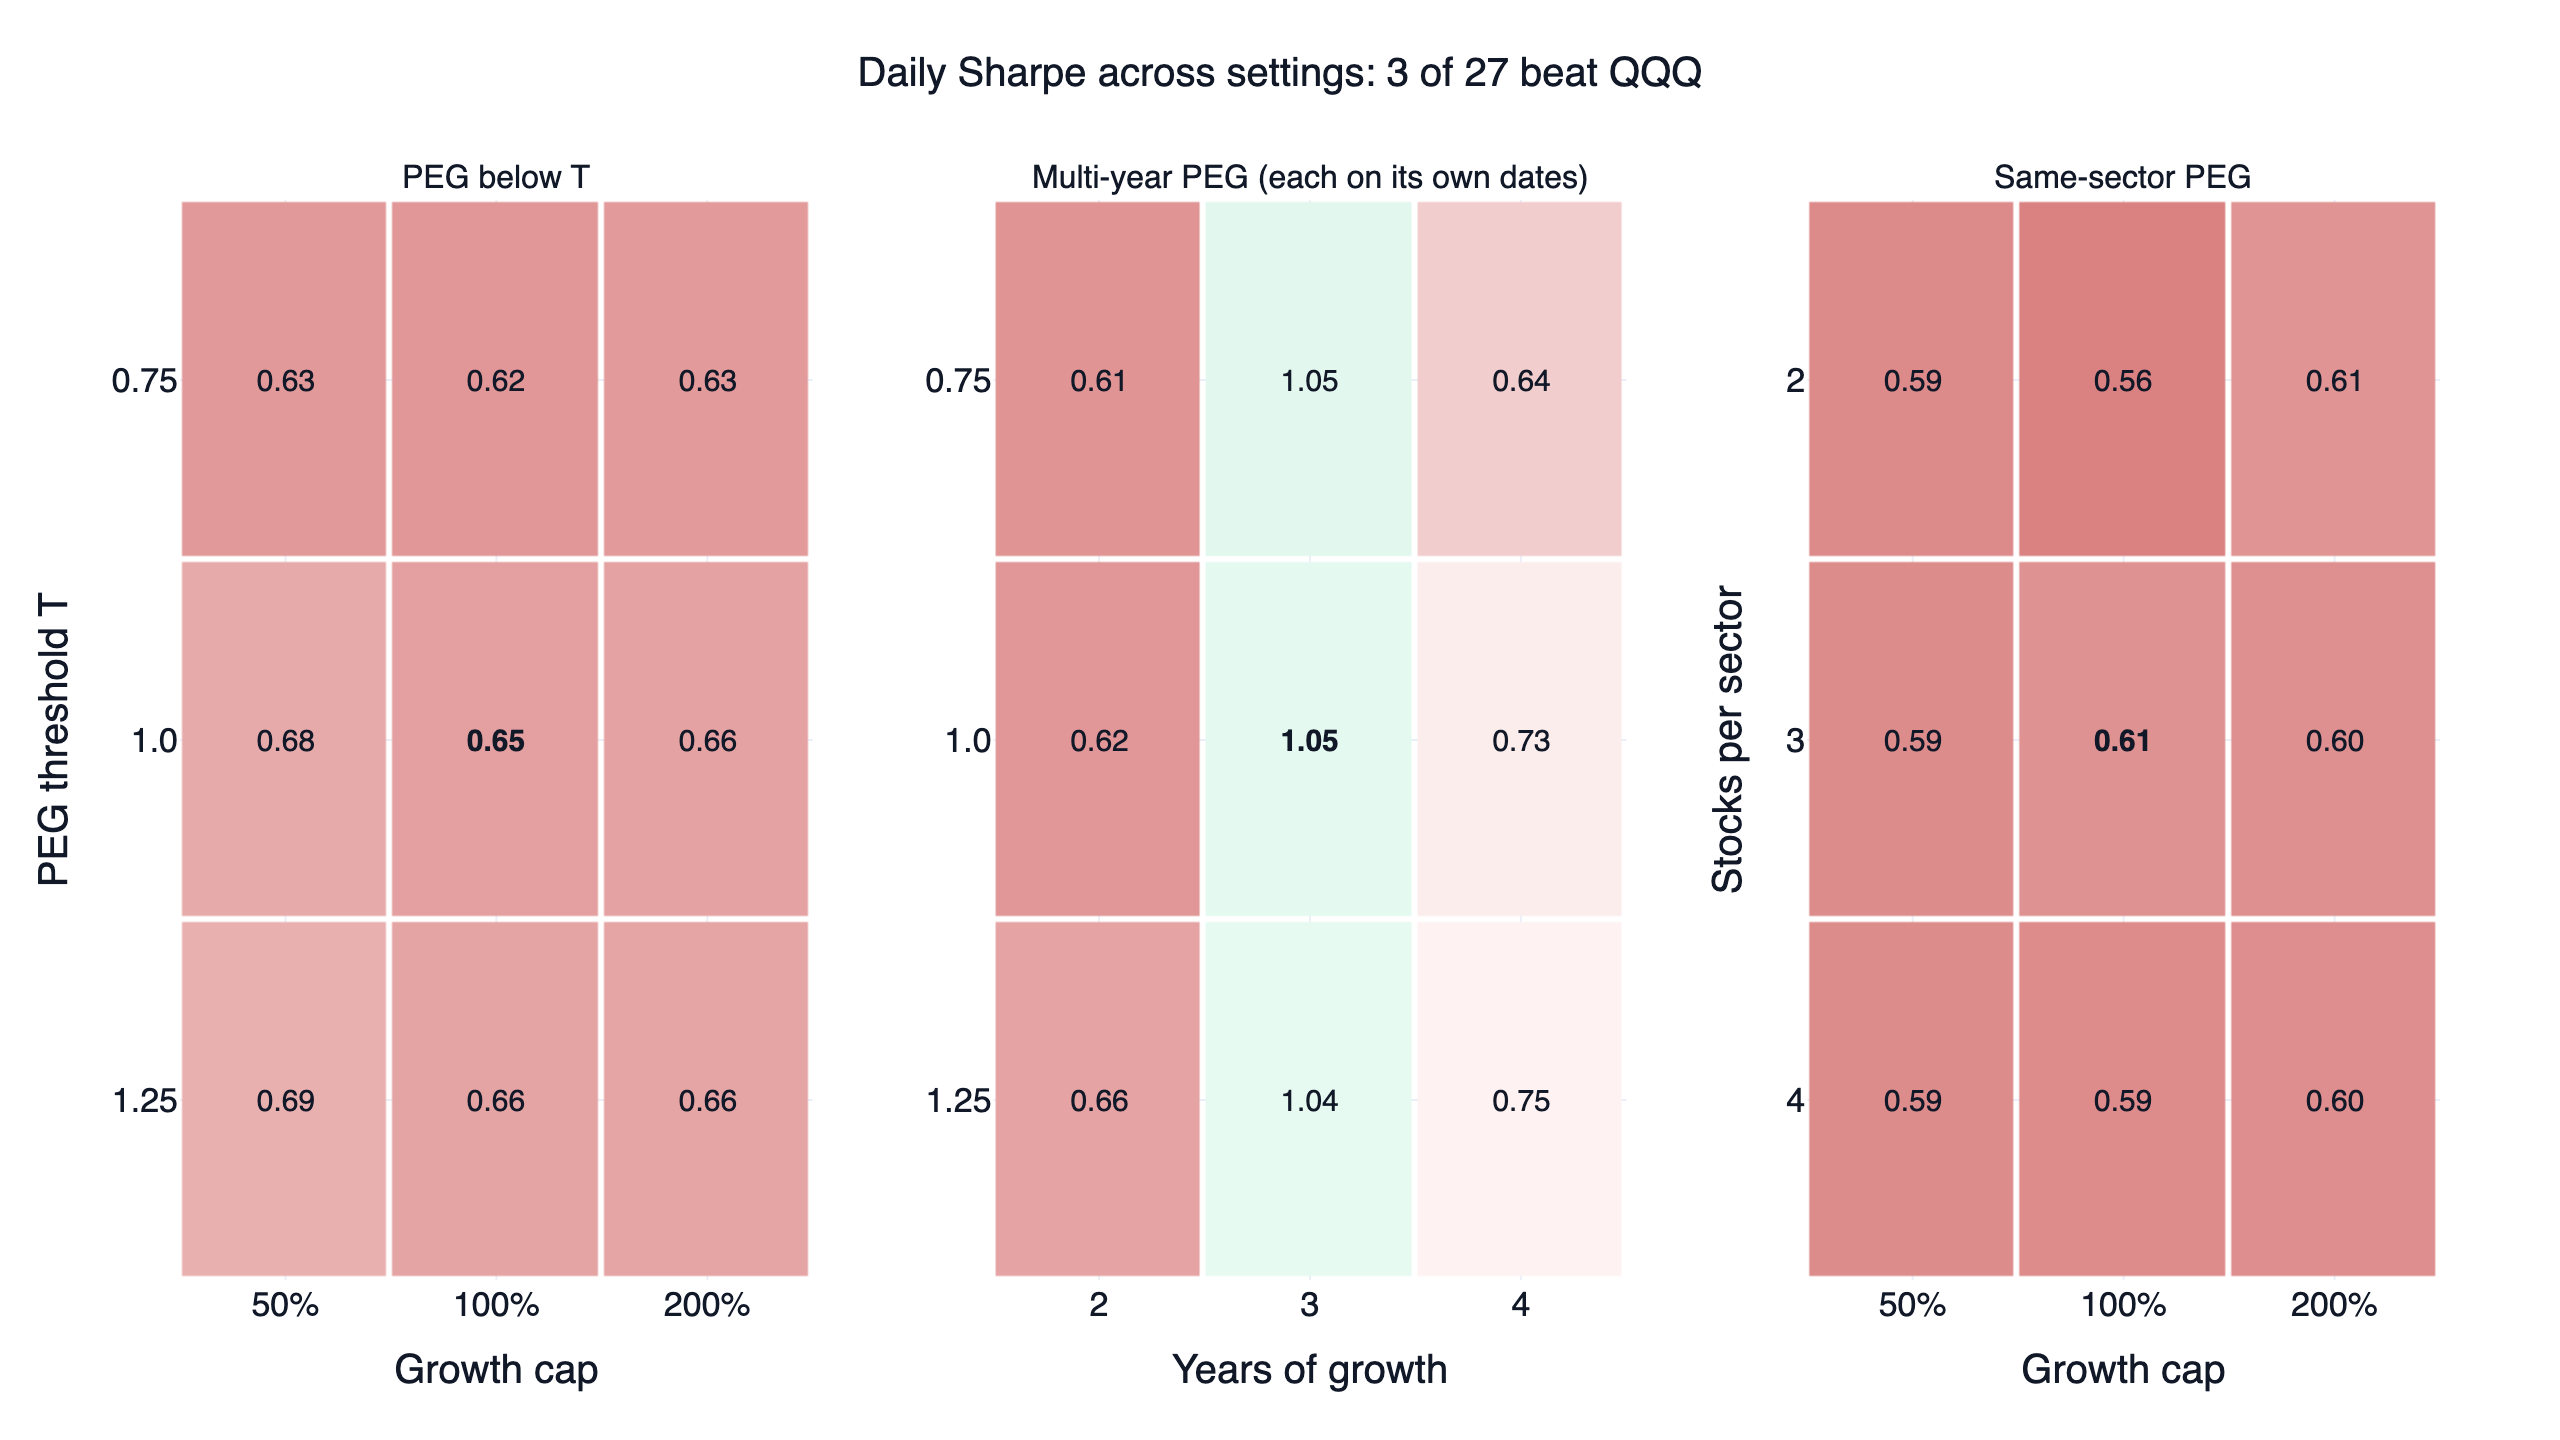
Bold marks the originals, and green marks a win over QQQ on that setting's own dates. PEG below 1 scored 0.62 to 0.69 across its nine settings and held 102 stocks on average. Only a threshold of 1.25 with a 50% growth cap beat RSP, 0.69 against 0.68. The same-sector version scored 0.56 to 0.61, held 32 stocks on average and lost to RSP in all nine settings. Filtering within each sector scored lower than the plain threshold here, and it turned over more of the portfolio.
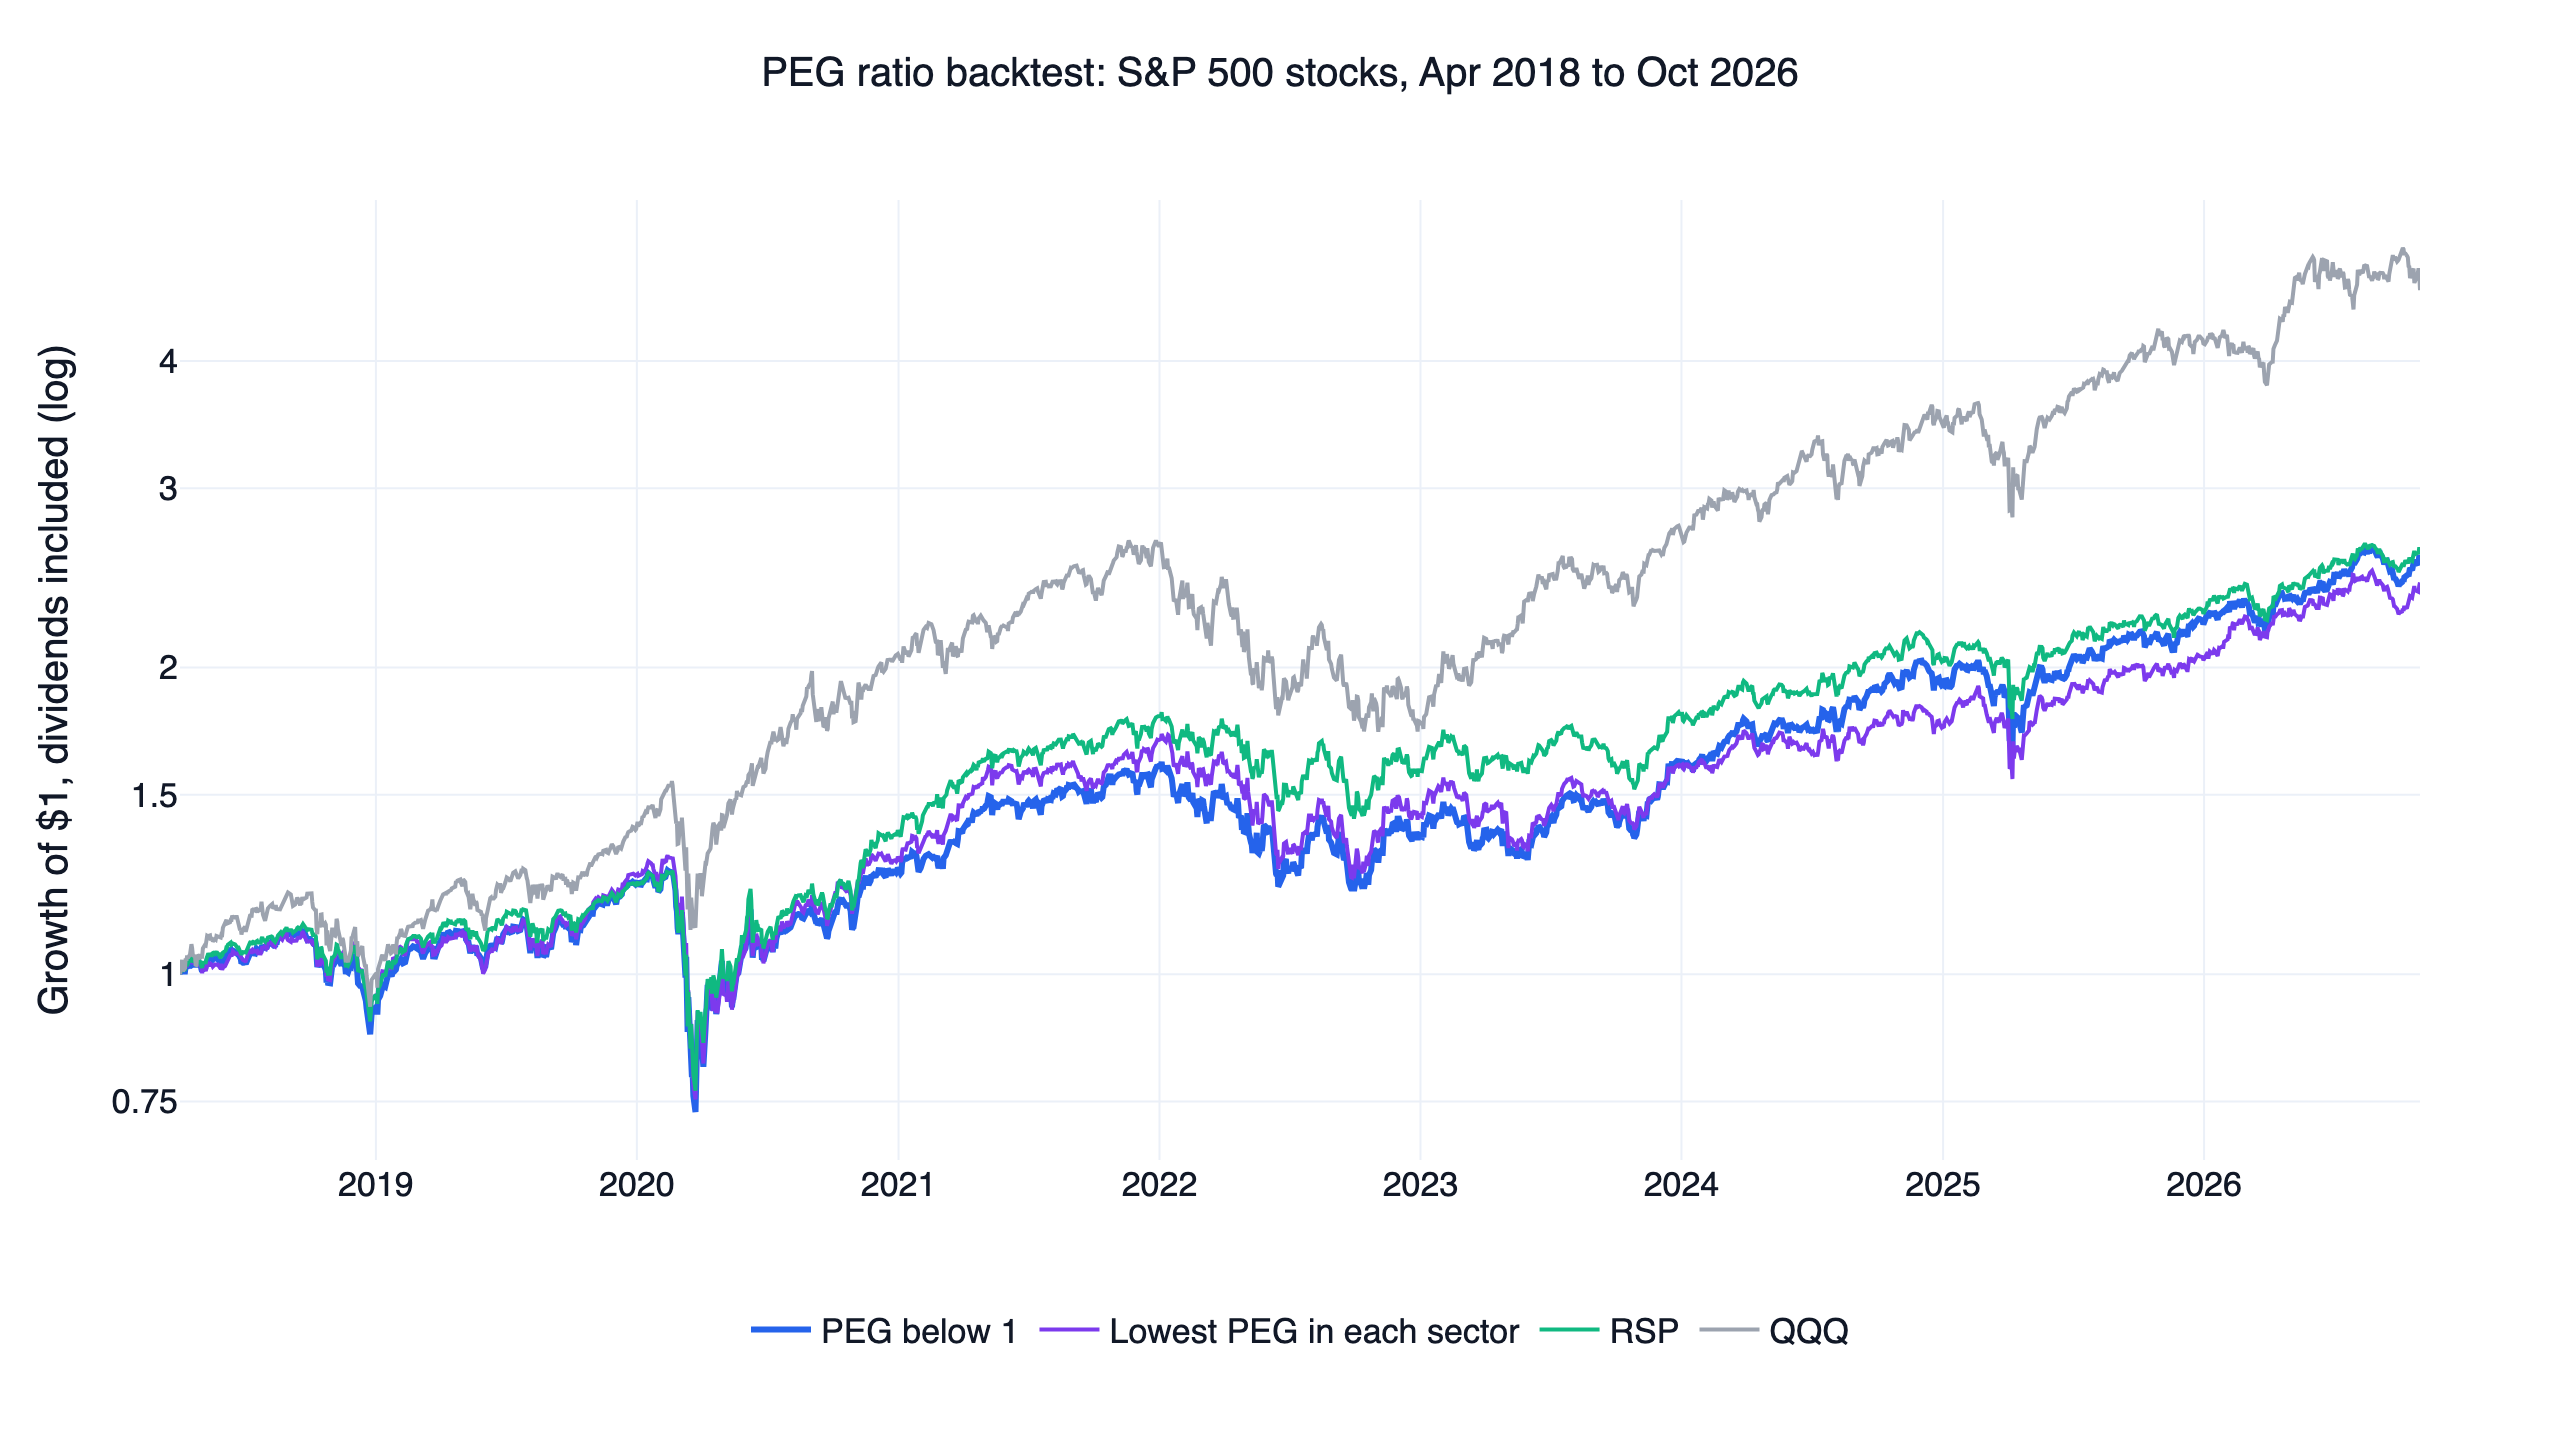
The chart at the top shows the two original baskets, RSP and QQQ. PEG below 1 tracked RSP until early 2020, kept falling behind until mid-2023 and then closed most of the gap, ending at 11.6% a year against 11.8%. The same-sector line ran above PEG below 1 from 2021 until late 2023, stayed below it from 2024 and ended lowest of the four at 10.9%. QQQ opened a wide lead during 2020, gave back much of it in 2022 and rebuilt it in 2023. Both PEG baskets drew down more than RSP and QQQ.
None of the 27 settings beat both QQQ and RSP, and none beat SPY.
| Check | PEG below 1 | Lowest PEG in each sector | Multi-year, three years |
|---|---|---|---|
| Neighbours beating QQQ (7 of 9 needed) | 0 / 9 | 0 / 9 | 3 / 9 |
| First half against QQQ | 0.34 / 0.71 | 0.38 / 0.71 | 1.03 / 1.05 |
| Second half against QQQ | 1.15 / 1.09 | 0.96 / 1.09 | 1.14 / 1.02 |
| At 0.1% per side against QQQ | 0.63 / 0.88 | 0.58 / 0.88 | 1.03 / 1.03 |
| Without 2022, the year of largest lead | 0.84 / 1.26 | 0.81 / 1.26 | 1.45 / 1.63 |
| Above T-bills, for disclosure | 0.52 / 0.77 | 0.48 / 0.77 | 0.90 / 0.91 |
| Result | Fails | Fails | Fails |
Each pair is the design, then QQQ.
The multi-year result depends on its start date
Multi-year growth looks like the fix at first: 1.05 against QQQ's 1.03, a -24.5% drawdown against -35.1%, and three winning settings. All three winners are the three-year column, and that column needs care.
Growth over Y years needs Y more years of filings, and statement data for S&P 500 companies effectively start in 2016-Q1, with fewer than 80 companies a quarter in 2015. We fixed the start before seeing results: the first March in which about 70% of members have a growth rate. That put the first trades in April 2019 for two years, April 2020 for three and April 2021 for four. The rule knew nothing about the market, and it still put the three-year column days after the March 2020 low. That window skips the crash and keeps the rebound, for QQQ too, which is why QQQ's Sharpe is 1.03 on those dates and 0.88 from 2018. The two neighbouring columns start at other dates and lose: 0.61 to 0.66 against 0.88 for two years, 0.64 to 0.75 against 0.75 for four.
So we put all nine settings on the same dates, from April 2021, the first month all nine exist. This check was added after seeing the results.
| PEG threshold | Two-year growth | Three-year growth | Four-year growth |
|---|---|---|---|
| 0.75 | 0.68 | 0.72 | 0.64 |
| 1 | 0.69 | 0.72 | 0.73 |
| 1.25 | 0.72 | 0.69 | 0.75 |
| QQQ | 0.75 | 0.75 | 0.75 |
| RSP | 0.66 | 0.66 | 0.66 |
| SPY | 0.85 | 0.85 | 0.85 |
None of the nine beat QQQ. The closest, a threshold of 1.25 with four-year growth, rounds to the same 0.75 and is 0.7450 against 0.7453 unrounded. The three-year original scored 0.72 and returned 11.3% a year against 15.1%. Eight of the nine beat RSP, and none beat SPY.
The verdict flips around that date, so April 2021 does not settle it either. In two more checks added after seeing the results, which data.csv reproduces, the three-year original beat QQQ from every monthly start from April 2020 to March 2021 (0.77 against 0.74 from March 2021) and lost from every start from April 2021 to April 2023 except December 2021. PEG below 1, with one-year growth, scored 1.06 against 1.03 from April 2020, so the win on those dates does not need multi-year growth.
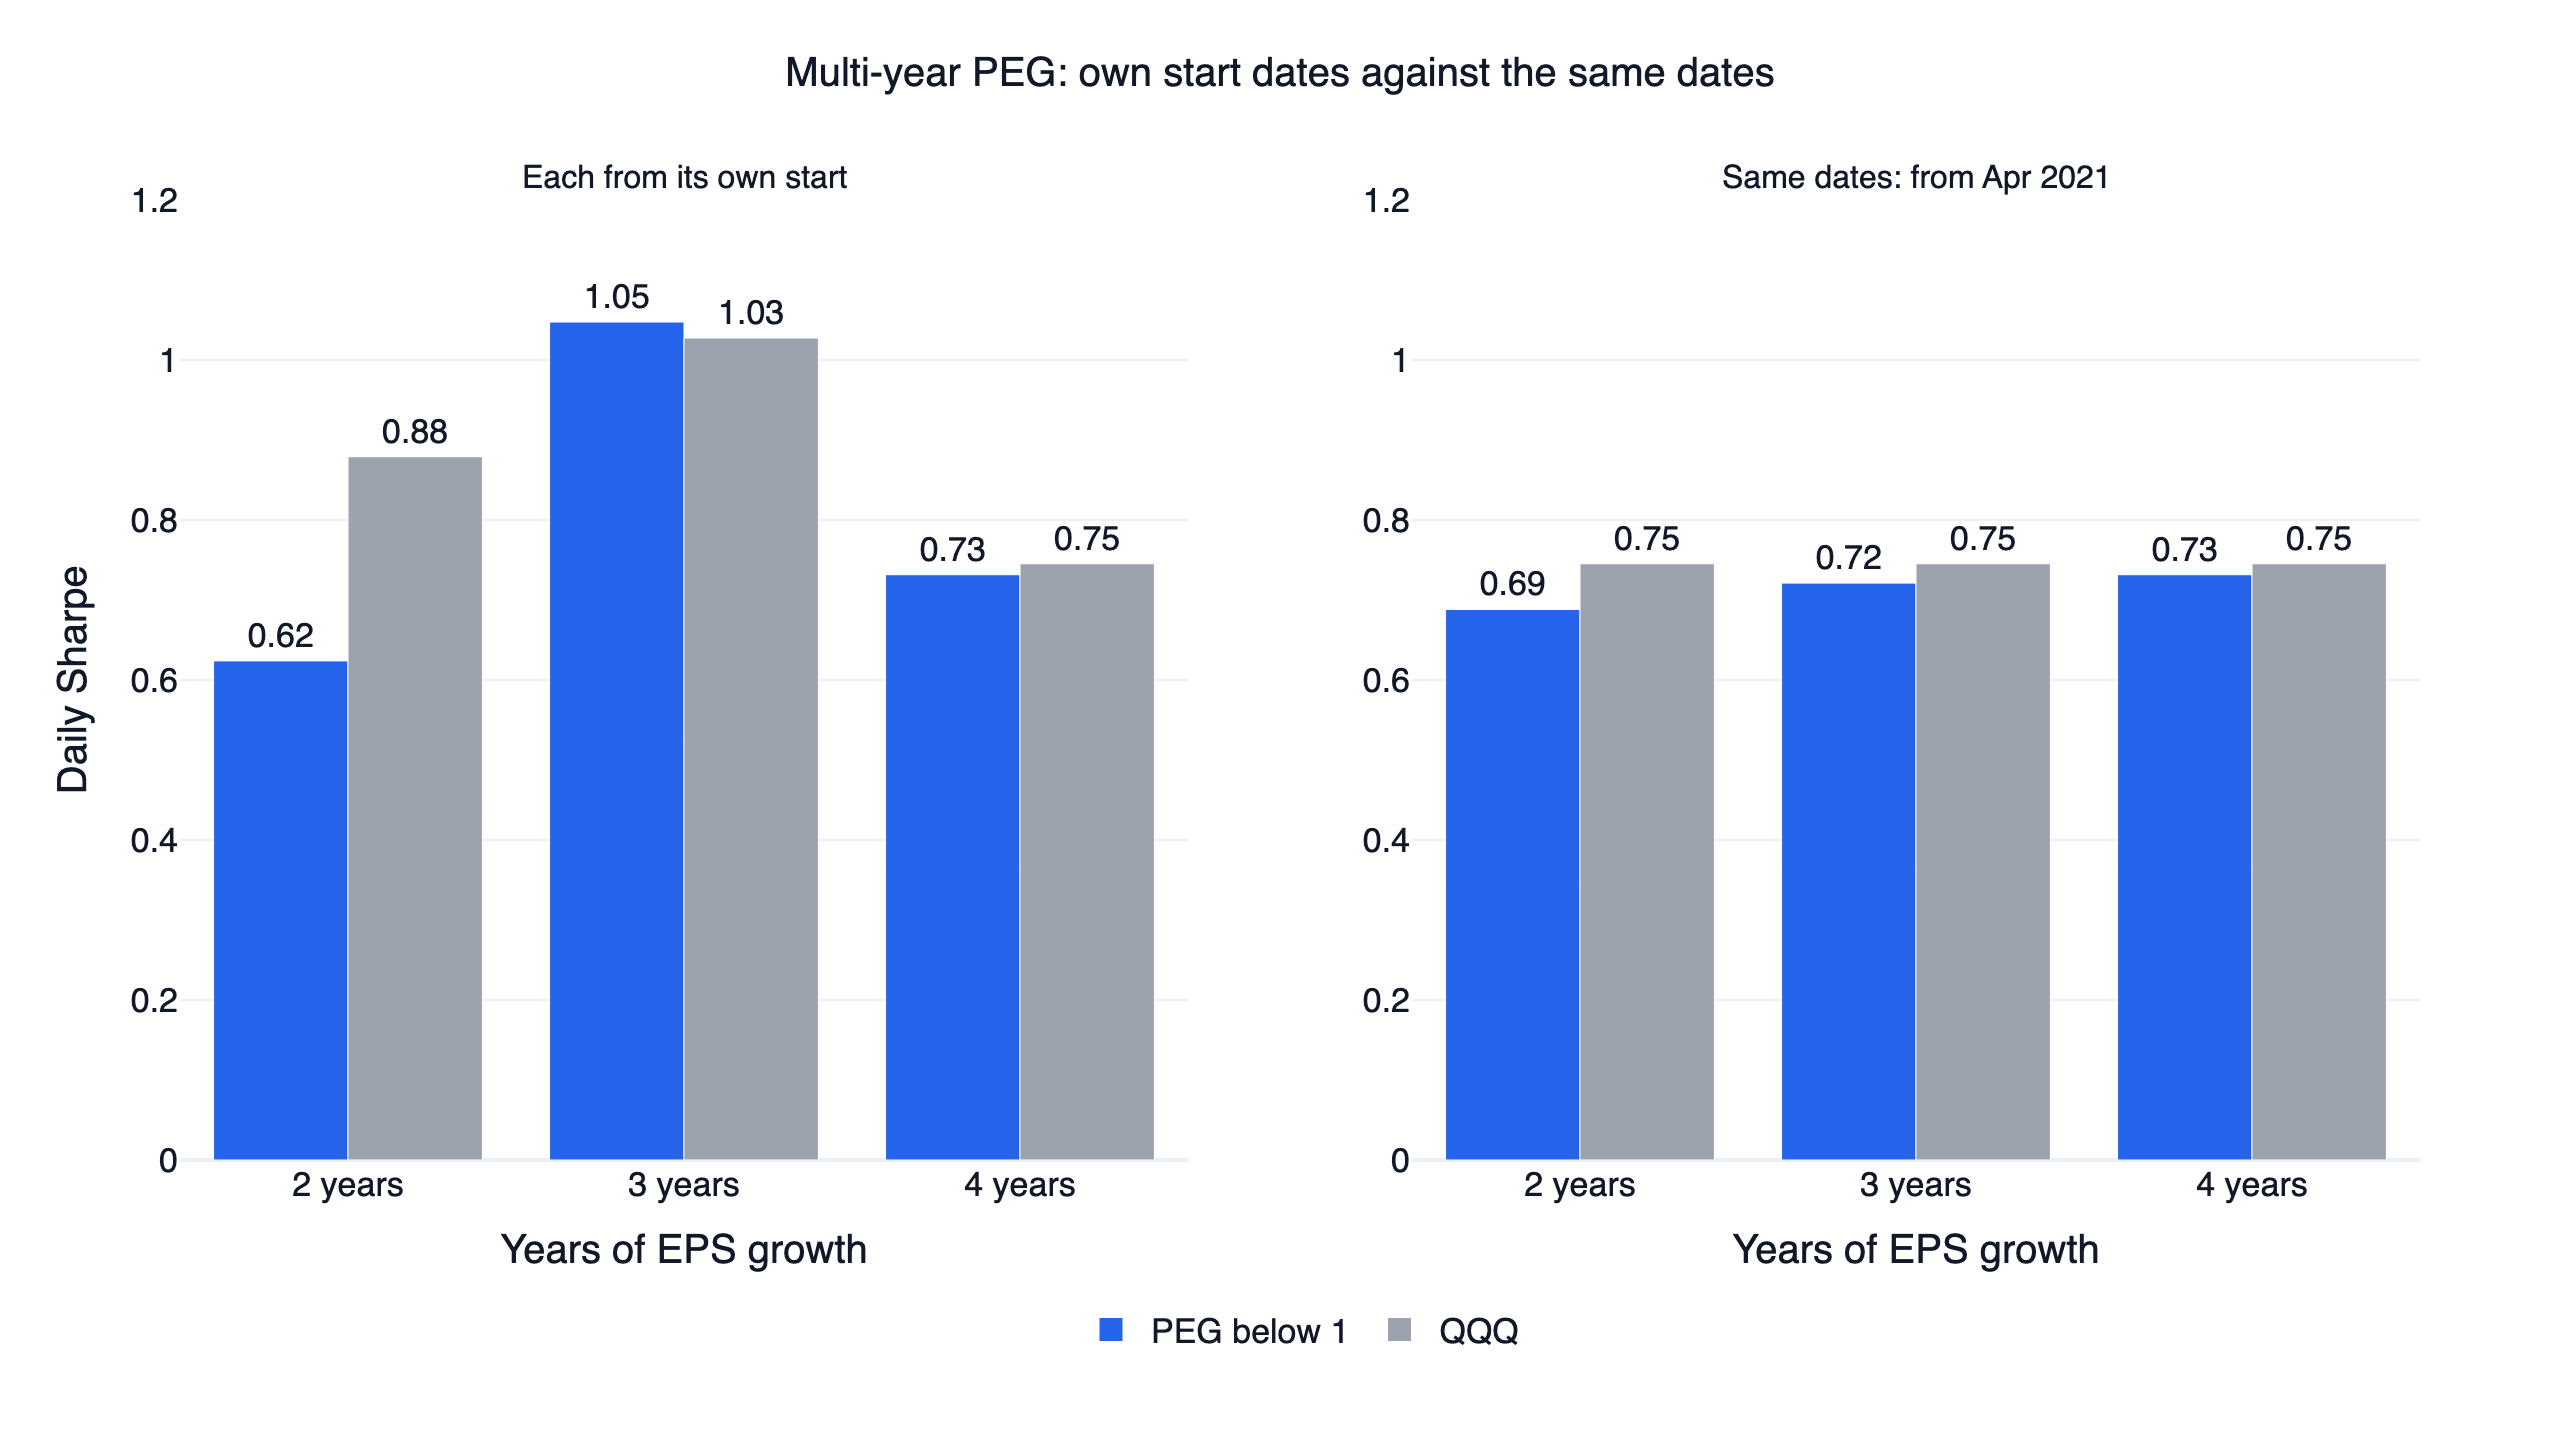
The chart shows the threshold-of-1 row. On the left, from each version's own start, two years lost 0.62 to 0.88, three years won 1.05 to 1.03 and four years lost 0.73 to 0.75. On the right, on the same dates, the three scored 0.69, 0.72 and 0.73 against 0.75.
The three-year original also fails on its own dates. It lost the first half, 1.03 against 1.05. Without 2022, its best year against QQQ, it lost 1.45 against 1.63. It returned 19.6% a year against QQQ's 23.1%, and it lost to RSP at 1.06 and SPY at 1.16. All three settings that beat QQQ lost to RSP. What it did deliver was a shallower drawdown than QQQ and a 2022 of -13.6% against -32.6%, close to RSP's -11.6%.
PEG below 1 by period and by year
The original PEG below 1 design lost the first half and won the second: 0.34 against QQQ's 0.71 to July 2022, then 1.15 against 1.09. RSP scored 0.52 and 0.95, so the basket also trailed RSP first and led it later. SPY scored 1.17 in the second half, ahead of the basket.
| Year | PEG below 1 | Lowest PEG in each sector | QQQ | RSP |
|---|---|---|---|---|
| 2018, from April | -7.3% | -4.8% | -0.1% | -4.7% |
| 2019 | 32.5% | 31.6% | 39.0% | 28.9% |
| 2020 | 3.6% | 4.1% | 48.6% | 12.7% |
| 2021 | 25.9% | 30.2% | 27.4% | 29.4% |
| 2022 | -14.6% | -15.7% | -32.6% | -11.6% |
| 2023 | 18.1% | 11.7% | 54.9% | 13.7% |
| 2024 | 19.1% | 9.4% | 25.6% | 12.8% |
| 2025 | 14.6% | 16.2% | 20.8% | 11.2% |
| 2026, to October 30 | 16.6% | 19.2% | 12.8% | 15.3% |
The year that hurt most was 2020: 3.6% against 48.6% for QQQ and 12.7% for RSP. The year that helped most against QQQ was 2022, when PEG below 1 lost 14.6% against QQQ's 32.6%, though RSP lost less at 11.6%. It beat QQQ in only two of these nine periods, 2022 and 2026.
The largest sector weight in PEG below 1 was financials at 22%, followed by industrials at 14%, technology at 13%, consumer cyclical at 12% and healthcare at 11%. We report the mix and did not test whether it explains any of these years.
How this compares with our earlier PEG test
Our study of 17 factors on US large caps tested low PEG as one factor among many. The 20 lowest PEGs among the 200 largest companies scored 0.75, and among the 500 most traded 0.50, against QQQ's 0.90 over its window. Those figures come from that study. We did not rerun it here, because the two tests differ in most of their inputs.
| This study | Earlier 17-factor study | |
|---|---|---|
| Universe | Each day's S&P 500 members, financials included | US-headquartered common stocks without financials: the 200 largest, or the 500 most traded |
| Selection | Every stock below the threshold, about 102 | The 20 lowest PEGs |
| Growth | Four quarters of EPS against a year earlier, capped at 100% | Four quarters of net income against a year earlier, positive, no cap |
| Window | 2018-04 to 2026-10 | 2017-08 to 2026-10 |
| Daily Sharpe | 0.65, QQQ 0.88 | 0.75 and 0.50, QQQ 0.90 |
Both land below QQQ. Against their own pools the picture is mixed: the 20 lowest PEGs edged an equal-weight top 200 there, 0.75 against 0.74, but trailed an equal-weight 500 most traded, 0.50 against 0.66, and the below-1 basket here trailed RSP, 0.65 against 0.68. The earlier page points to rebounds from a low earnings base as a source of very low PEGs. The 100% cap here drops the largest of those rebounds and the under-0.5 slice was still the weakest. We did not split that slice by where its growth came from, so we cannot say whether rebounds are the reason.
The code
This is PEG below 1 at its original setting. On data through 2026-10-30 it prints 0.66. The table says 0.65 because research.py keeps one share class per company, and this short version keeps both.
Show Code
import finlab
from finlab import data
from finlab.backtest import sim

finlab.login()
data.set_market("us")

close = data.get("us_price:adj_close")
members = data.get("us_index_constituents:sp500").astype(bool)
tickers = members.columns.intersection(close.columns)
members = members[tickers].reindex(close.index, method="ffill").fillna(False).astype(bool)

income = data.get("us_income_statement:net_income").reindex(columns=tickers)
shares = data.get("us_income_statement:weighted_average_shs_out_dil").reindex(columns=tickers)
value = data.get("etl:us_market_value").reindex(columns=tickers)


def on_trading_days(quarterly):
    # A blank quarter becomes -1, or the filing would keep showing the quarter before
    return quarterly.fillna(-1).index_str_to_date().reindex(index=close.index, method="ffill")


# Four quarters of earnings per diluted share, positive now and a year ago
eps = (income[income != 0] / shares[shares > 0]).rolling(4, min_periods=4).sum()
growth = on_trading_days(eps[eps > 0] / eps.shift(4)[eps.shift(4) > 0] - 1)

# P/E from market value and four quarters of net income
earnings = on_trading_days(income.rolling(4, min_periods=4).sum())
pe = value / earnings[earnings > 0]

# PEG below 1, with growth above 0 and at most 100%
peg = pe / (growth[(growth > 0) & (growth <= 1)] * 100)
position = (peg < 1)[members].loc["2018-03-01":"2026-10-30"].fillna(False).astype(bool)

report = sim(position.loc[:, position.any()], resample="M", trade_at_price="close",
             position_limit=0.05, market="us", upload=False)
curve = report.creturn.loc["2018-04-02":]
returns = curve.pct_change().dropna()
print(round(returns.mean() / returns.std() * 252 ** 0.5, 2))
Install the FinLab skill for your AI agent
You do not need to write this yourself. Install the FinLab skill in Claude Code, Codex or Gemini CLI with one command:
Show Code
npx skills add https://github.com/koreal6803/finlab-ai --skill finlabThen ask your agent in plain language, for example "split the S&P 500 stocks with a PEG under 0.5 by whether earnings a year ago were unusually low" or "rerun the PEG below 1 test on the 1,000 largest US stocks and compare with RSP". The agent setup page covers each tool, and FinLab Studio runs the same research in a browser.
Backtest method and limits
| Item | How it was handled |
|---|---|
| Window | First fill 2018-04-02, last day 2026-10-30. Multi-year settings start 2019-04-01, 2020-04-01 and 2021-04-01. Each start follows the first March in which about 70% of members have a growth rate |
| Universe | Each day's S&P 500 members from FinLab's point-in-time list, one share class per company. Companies that left the index stay in for the time they were members. In April 2018, 9 of 505 members have no price that day, falling to 0 by 2024; the study holds about 490 to 500 names a day |
| Exclusions | No sector is excluded, so financials stay in. Stocks without a usable PEG are simply not held by the three designs. About 6 members a day have no statement data here and sit in no PEG slice |
| Liquidity | No filter beyond index membership. Capacity is not estimated |
| Look-ahead | Signals are read at a close and trade at the next close. Quarterly figures count from the filing date, and a blank quarter counts as unknown instead of repeating the quarter before (look-ahead bias) |
| Weights | Equal, at most 5% in a stock, changed monthly. All three designs stayed fully invested. The PEG band slices have no cap |
| Turnover | One-way turnover a year: 2.0 for PEG below 1, 3.2 for the same-sector version, 1.7 for multi-year |
| Costs | finlab's default US cost is zero. At 0.1% per side, CAGR falls from 11.6% to 11.2%, from 10.9% to 10.1% and from 19.6% to 19.2%. Multi-year PEG then rounds to QQQ's 1.03 and sits just below it unrounded, 1.027464 against 1.027469, so this check fails |
| Slippage | No slippage model |
| Taxes | None |
| Benchmark | QQQ with dividends reinvested over the same dates, with SPY and RSP as controls |
| Sample | All in sample, with no out-of-sample period. The two halves are a stability check |
Five limits shape how far these results reach.
- Trailing growth only. FinLab's forward PEG data start in 2026-02, so a forward PEG cannot be backtested here. Forecasts have known problems of their own: Chan, Karceski & Lakonishok (2003) report that IBES growth forecasts are overly optimistic and add little predictive power, La Porta (1996) finds expectations about earnings growth too extreme, and Bradshaw (2004) finds the PEG model explains analysts' stock recommendations while strategies based on their long-term growth projections had the least association with future excess returns.
- Net income includes one-offs. A one-time gain counts as earnings, and it can raise growth and lower the PEG.
- Some quarters are blank. When a fiscal quarter ends a few days after a calendar quarter, as on a 52/53-week year, the quarterly table leaves one quarter blank. Trailing figures that cross it have no PEG for up to two years, and those stocks sit in the no-PEG group.
- EPS is computed. We use net income over diluted shares because restated
eps_dilutedis rounded: NVDA's 2019 quarters read 0.023, 0.016, 0.023 and 0.036 there. NVDA appears here only as a data example. - Sector labels are today's. The same-sector design and the sector weights use current labels, not the ones at the time.
- One short window. It covers 8.6 years, with one 2020 and one 2022.
What this result does and does not say
Under this setup, from April 2018 to October 2026, a PEG threshold did not sort S&P 500 stocks in the order the rule of thumb predicts, and none of the three designs passed. The two designs that ran the full window landed below RSP as well as QQQ. The result covers large US stocks, trailing growth and one window. It says nothing about small caps or forecast growth, and it does not test a reader who uses PEG as one input among several.
PEG suits a reader who wants a quick way to compare a valuation with growth before doing more work, and Easton's result supports it as a simple ranking. In this study it did not suit someone looking for a rule to run by itself: holding every stock below 1 gave about the return of the equal-weight index with a deeper drawdown.
If you use PEG, these are practical next steps:
- Check which growth figure a quoted PEG uses, trailing or forecast, and over how many years.
- For a PEG under 0.5, look at why growth is so high. In this window that slice scored lowest.
- Compare any PEG screen with RSP as well as QQQ, on exactly the same dates.
- Treat a multi-year result with suspicion until its start date has been moved.
Related studies include the 10 academic factors backtest, the six famous stock screens and the quality value backtest. The introduction to factor investing explains the wider idea, the US strategy overview collects our US work, and the US backtest tutorial walks through a first test in Python. The team behind this research is on the about page.
FAQ
What is the PEG ratio?
The P/E ratio divided by annual earnings growth in percent. A stock on a P/E of 20 with 25% EPS growth has a PEG of 0.8.
What is a good PEG ratio?
The rule of thumb says 1 or below. In our S&P 500 test from April 2018 to October 2026, the slices between 0.5 and 2 scored a daily Sharpe of 0.71 to 0.77, the slice under 0.5 scored 0.58, and none reached QQQ's 0.88. These slices were added after seeing the results and some are thin.
Is a PEG ratio below 1 good?
It is cheap by the formula, and it is common: 21% of S&P 500 members sat below 1 at an average month end. Holding all of them returned 11.6% a year with a Sharpe of 0.65, against 11.8% and 0.68 for RSP.
What does a negative PEG ratio mean?
Earnings or earnings growth is negative, so the ratio has no useful reading as a valuation. We count those stocks as having no usable PEG. That group, which also includes growth above 100% and missing figures, averaged 276 stocks and scored 0.69.
Should the PEG ratio use trailing or forward growth?
Both are common, and they can give different answers for the same stock. This study uses trailing growth because FinLab's forward PEG data exist only from 2026-02, too short to backtest.
How is the PEG ratio different from the P/E ratio?
P/E compares price with current earnings, and PEG also divides by growth. A stock on a P/E of 15 growing 5% has a PEG of 3.0, while a stock on a P/E of 20 growing 25% has a PEG of 0.8.
Does the PEG ratio work for US stocks?
In this setup, none of three designs passed, and none of 27 settings beat both QQQ and RSP from 2018 to 2026. Our earlier study, with different rules, also found low PEG below QQQ. Neither covers small caps or forecast growth.
Can I rerun this?
Yes. Install the FinLab skill through the AI-assisted setup, download research.py below and run python research.py.
Reproduce it yourself
| File | Contents |
|---|---|
| research.py | All three designs, 27 settings, both halves, cost runs, PEG bands and the same-dates check |
| data.csv | Daily equity of the three original designs with QQQ, SPY, RSP, SPLV and USMV |
| metrics.json | Every statistic quoted here, including monthly PEG shares and yearly returns |
Disclaimer: this article is for education only and does not constitute investment advice. Past performance does not guarantee future results, and investing involves risk. All results are in-sample, and the two halves were not validated out of sample. Stocks and funds named here describe research results and are not recommendations.
Last updated: 2026-11|Backtest window: 2018-04 to 2026-10|Benchmark: QQQ with dividends|Author: FinLab Quant Research
FinLab AI
Want to build your own strategy?
Describe your stock-picking ideas in natural language. AI automatically validates, backtests, and gives you answers
Start Free